Hand oil sands_2010
15
Opportunities in Canada’s Oil Sands Slide 1 Ports-to-Plains Energy Summit James Hand, VP Surmont Phase 2 ConocoPhillips Canada April 9, 2010
description
Transcript of Hand oil sands_2010
Opportunities in Canada’s Oil Sands
Slide 1
Ports-to-Plains Energy SummitJames Hand, VP Surmont Phase 2
ConocoPhillips CanadaApril 9, 2010

CAUTIONARY STATEMENT FOR THE PURPOSES OF THE “SAFE HARBOR” PROVISIONS
OF THE PRIVATE SECURITIES LITIGATION REFORM ACT OF 1995
The following presentation includes forward-looking statements within the meaning of Section 27A of the Securities Act of 1933, as amended and Section 21E of the Securities Exchange Act of 1934, as amended, which are intended to be covered by the safe harbors created thereby. You can identify our forward-looking statements by words such as “anticipates,” “expects,” “intends,” “plans,” “projects,” “believes,” “estimates,” and similar expressions. Forward-looking statements relating to ConocoPhillips’ operations are based on management’s expectations, estimates and projections about ConocoPhillips and the petroleum industry in general on the date these presentations were given. These statements are not guarantees of future performance and involve certain risks, uncertainties and assumptions that are difficult to predict. Further, certain forward-looking statements are based upon assumptions as to future events that may not prove to be accurate. Therefore, actual outcomes and results may differ materially from what is expressed or forecast in such forward-looking statements.
Factors that could cause actual results or events to differ materially include, but are not limited to, crude oil and natural gas prices; refining and marketing margins; potential failure to achieve, and potential delays in achieving expected reserves or production levels from existing and future oil and gas development projects due to operating hazards, drilling risks, and the inherent uncertainties in interpreting engineering data relating to underground accumulations of oil and gas; unsuccessful exploratory drilling activities; lack of exploration success; potential disruption or unexpected technical difficulties in developing new products and manufacturing processes; potential failure of new products to achieve acceptance in the market; unexpected cost increases or technical difficulties in constructing or modifying company manufacturing or refining facilities; unexpected difficulties in manufacturing, transporting or refining synthetic crude oil; international monetary conditions and exchange controls; potential liability for remedial actions under existing or future environmental regulations; potential liability resulting from pending or future litigation; general domestic and international economic and political conditions, as well as changes in tax and other laws applicable to ConocoPhillips’ business; limited access to capital or significantly higher cost of capital related to illiquidity or uncertainty in the domestic or international financial markets. Other factors that could cause actual results to differ materially from those described in the forward-looking statements include other economic, business, competitive and/or regulatory factors affecting ConocoPhillips’business generally as set forth in ConocoPhillips’ filings with the Securities and Exchange Commission (SEC), including our Form 10-K for the year ending December 31, 2008. ConocoPhillips is under no obligation (and expressly disclaims any such obligation) to update or alter its forward-looking statements, whether as a result of new information, future events or otherwise.
Cautionary Note to U.S. Investors – The U.S. Securities and Exchange Commission permits oil and gas companies, in their filings with the SEC, to disclose only proved reserves that a company has demonstrated by actual production or conclusive formation tests to be economically and legally producible under existing economic and operating conditions. We may use certain terms in this presentation such as “oil/gas resources,” “Syncrude,”and/or “Society of Petroleum Engineers (SPE) proved reserves” that the SEC’s guidelines strictly prohibit us from including in filings with the SEC. U.S. investors are urged to consider closely the oil and gas disclosures in our Form 10-K for the year ended December 31, 2008.
Slide 2
• About the Oil Sands• COP’s Position• The Surmont Project• Oil Sands Technology• The Transportation Corridor• Opportunities for a Secure Energy Future
Today’s Presentation
Slide 3

Global Crude Oil Reserves by Country
Source: Oil & Gas Journal Dec. 2008
21303644
60
9299102
115
136
175
264
0
50
100
150
200
250
300
Saudi Arabia Canada Iran Iraq Kuwait VenezuelaAbu Dhabi Russia Libya Nigeria Kazhakhstan UnitedStates
billi
on b
arre
ls
Includes 170 billi
on barrels
of oil s
ands reserves
OtherAccessibleReserves
OtherAccessibleReserves
OtherAccessibleReserves
State ownedor controlled
Accessible
Canada’sOil Sands
World OilReserves
OtherAccessibleReserves
53%
47%
AccessibleOil Reserves
Slide 4

Significant Source of US Supply
Slide 5
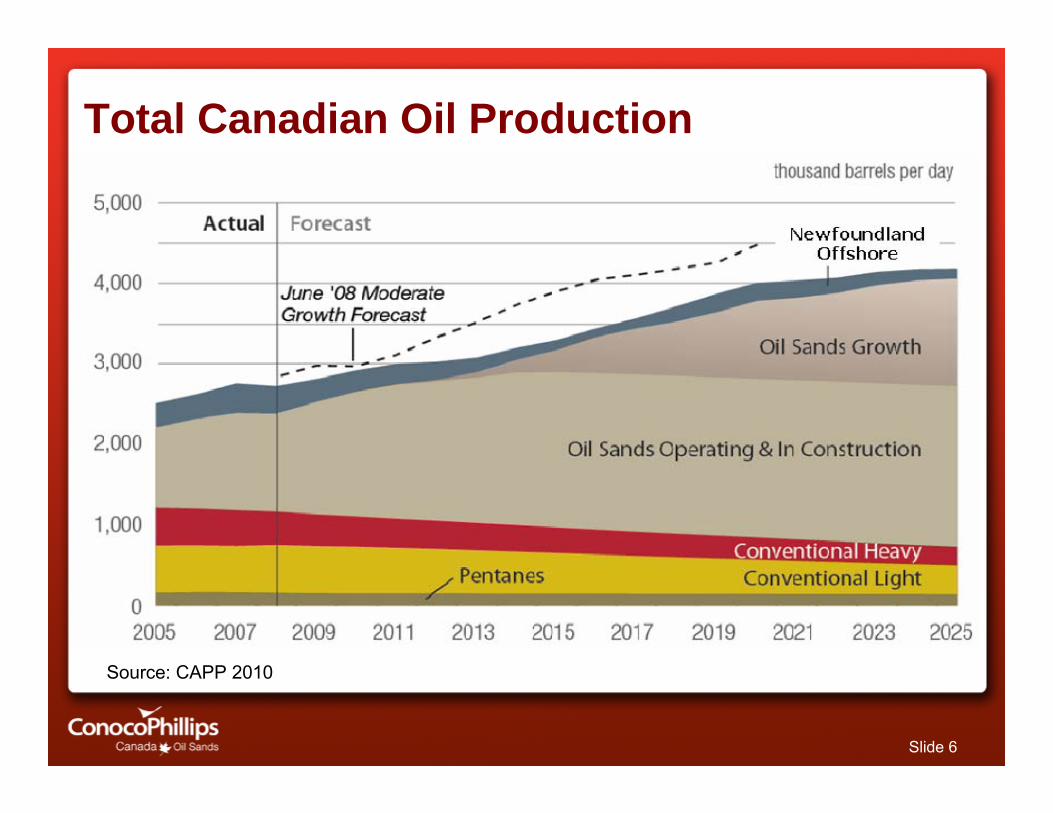
Total Canadian Oil Production
Source: CAPP 2010
Slide 6
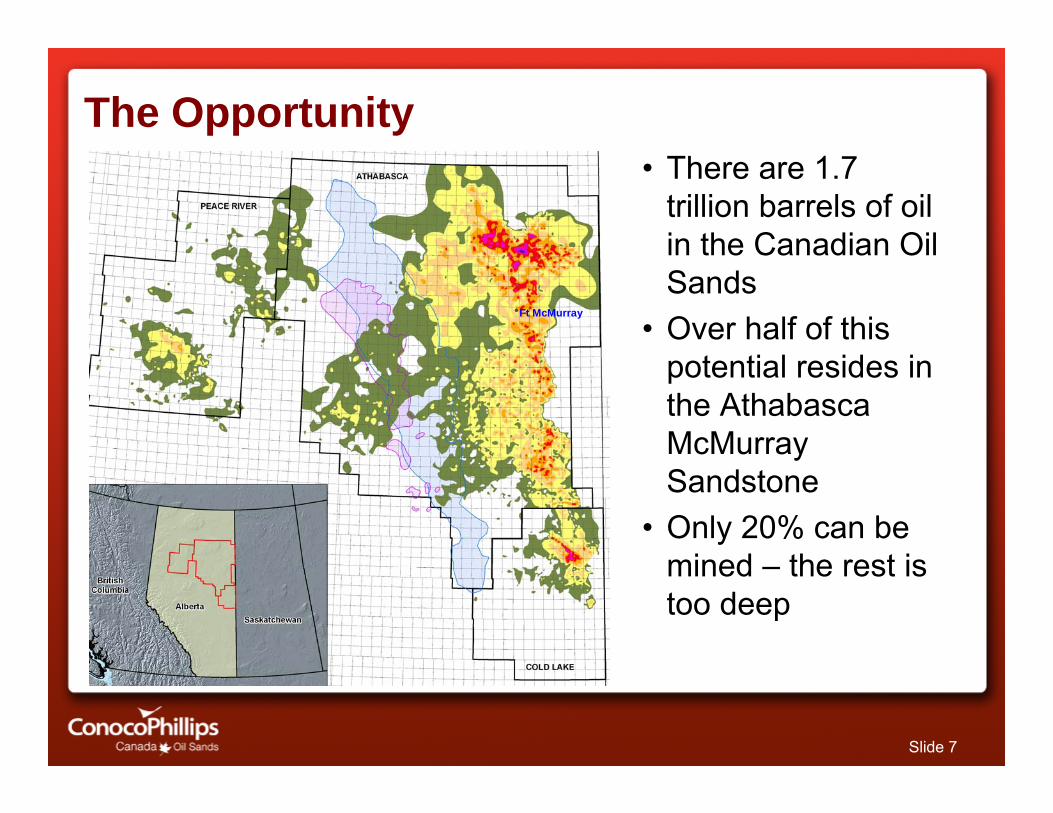
The Opportunity• There are 1.7
trillion barrels of oil in the Canadian Oil Sands
• Over half of this potential resides in the Athabasca McMurray Sandstone
• Only 20% can be mined – the rest is too deep
Slide 7
Ft McMurray٭

Bitumen underSAGD
Water
Cream
Olive Oil
Maple Syrup
Ketchup
Peanut Butter
Visc
osity
(cP)
Typical oil in the ground
Bitumen at virgin reservoir conditions
1
10
100
1,000
10,000
100,000
1,000,000
10,000,000
0 50 100 150 200 250Temperature (deg C)
The Challenge: Viscosity
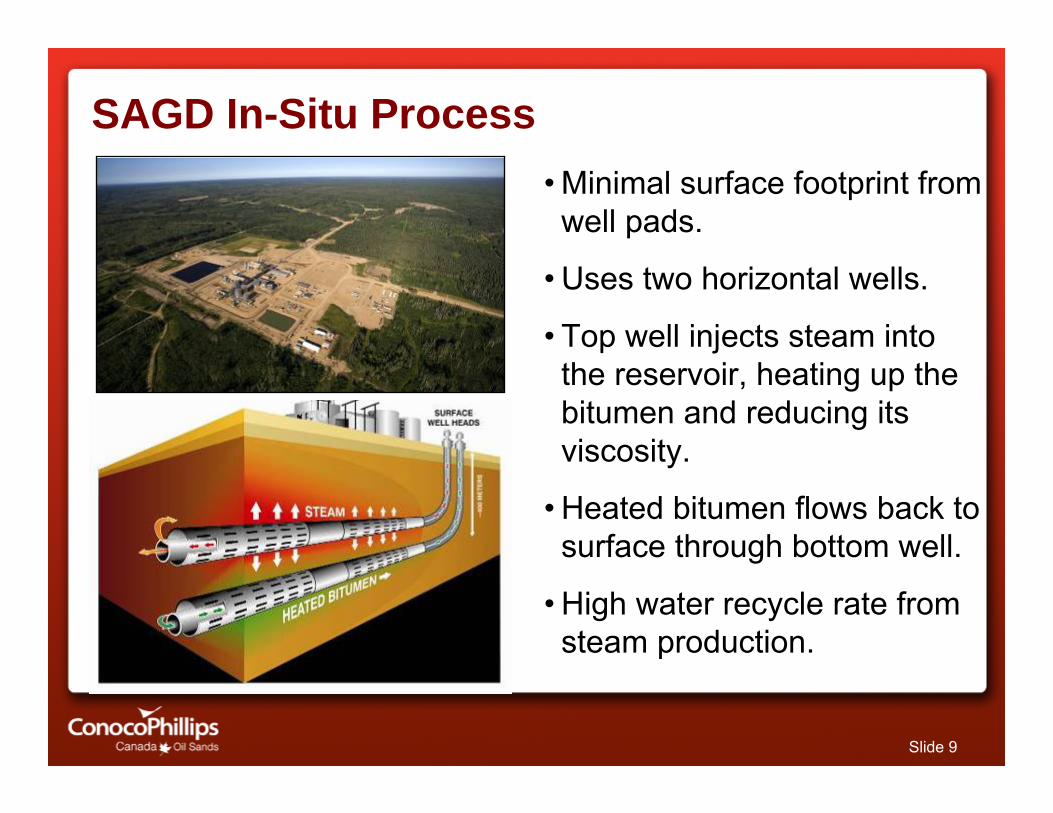
SAGD In-Situ Process • Minimal surface footprint from well pads.
• Uses two horizontal wells.
• Top well injects steam into the reservoir, heating up the bitumen and reducing its viscosity.
• Heated bitumen flows back to surface through bottom well.
• High water recycle rate from steam production.
Slide 9
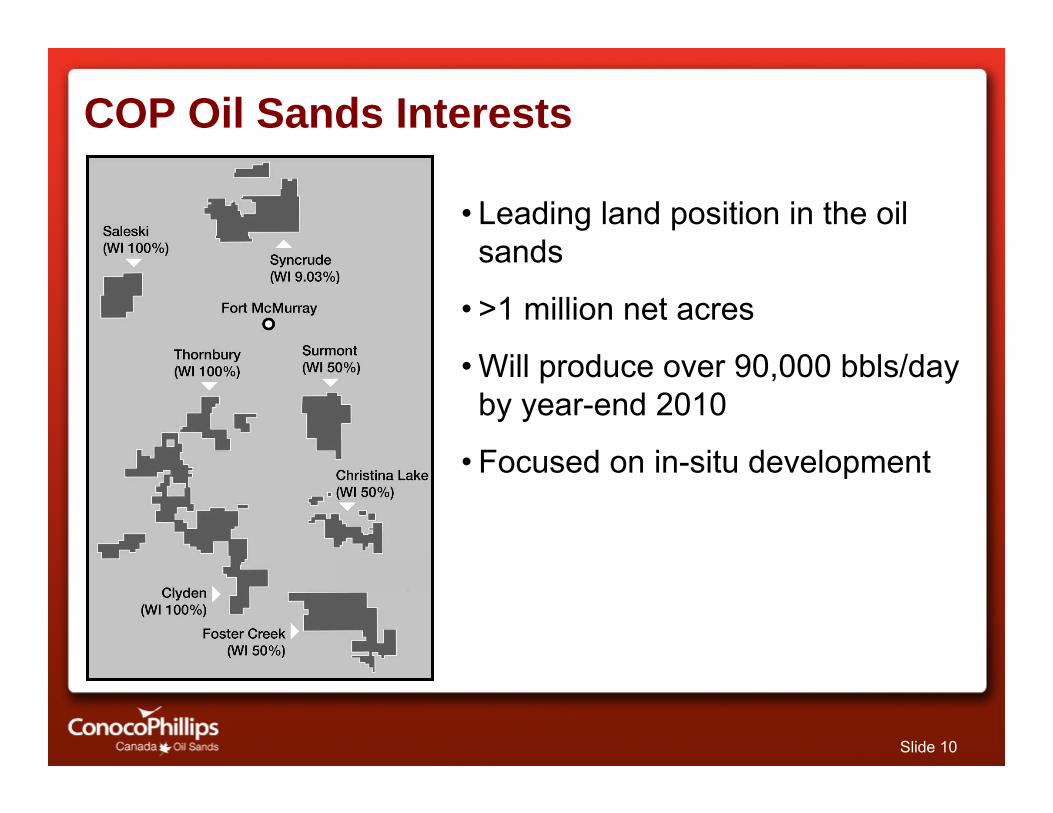
COP Oil Sands Interests
• Leading land position in the oil sands
• >1 million net acres
• Will produce over 90,000 bbls/day by year-end 2010
• Focused on in-situ development
Slide 10
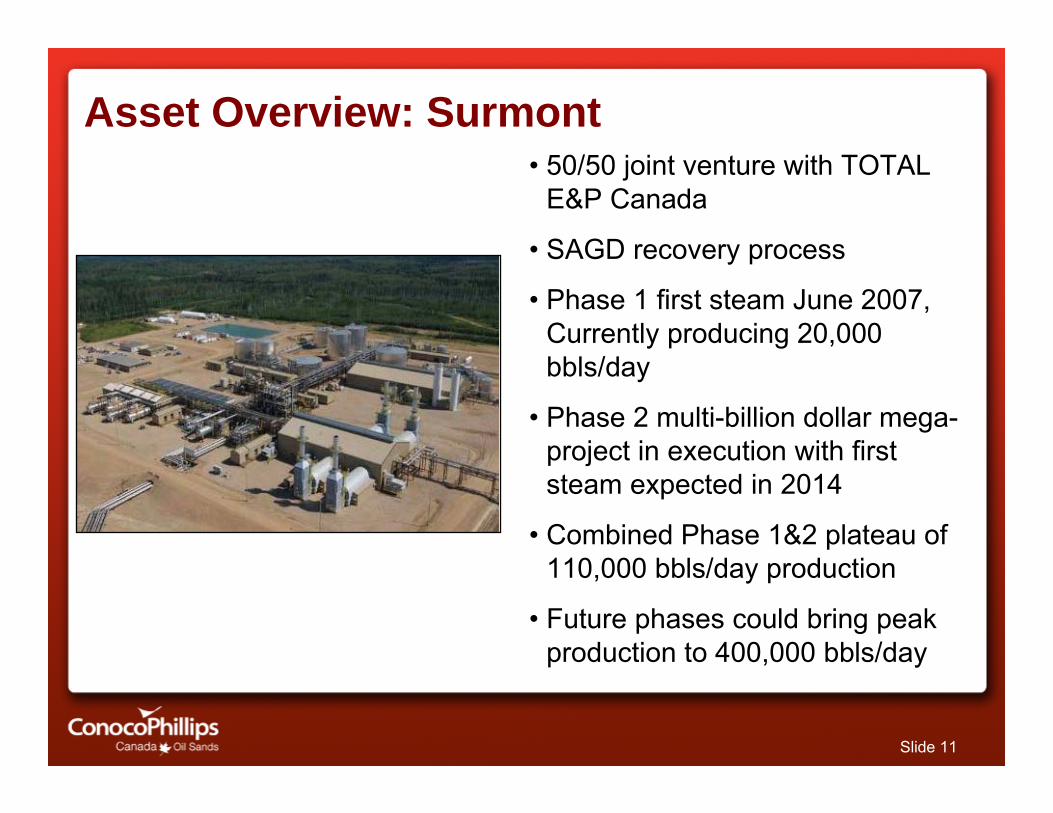
Asset Overview: Surmont• 50/50 joint venture with TOTAL
E&P Canada
• SAGD recovery process
• Phase 1 first steam June 2007, Currently producing 20,000 bbls/day
• Phase 2 multi-billion dollar mega-project in execution with first steam expected in 2014
• Combined Phase 1&2 plateau of 110,000 bbls/day production
• Future phases could bring peak production to 400,000 bbls/day
Slide 11

Oil Sands Technology• Water
•Use less water•Recycle more water•Use higher salinity water
• Land•Disturb less land•Use land more efficiently•Reclaim land
• GHGs•Less steam/bbl of oil•Fewer GHGs/bbl of steam•Facilitate CCS
Slide 12
End User Emissions
Production
Refining
Transportation
Greenhouse Gas Production by Oil Sands Segment
Data source: CERA, 2009
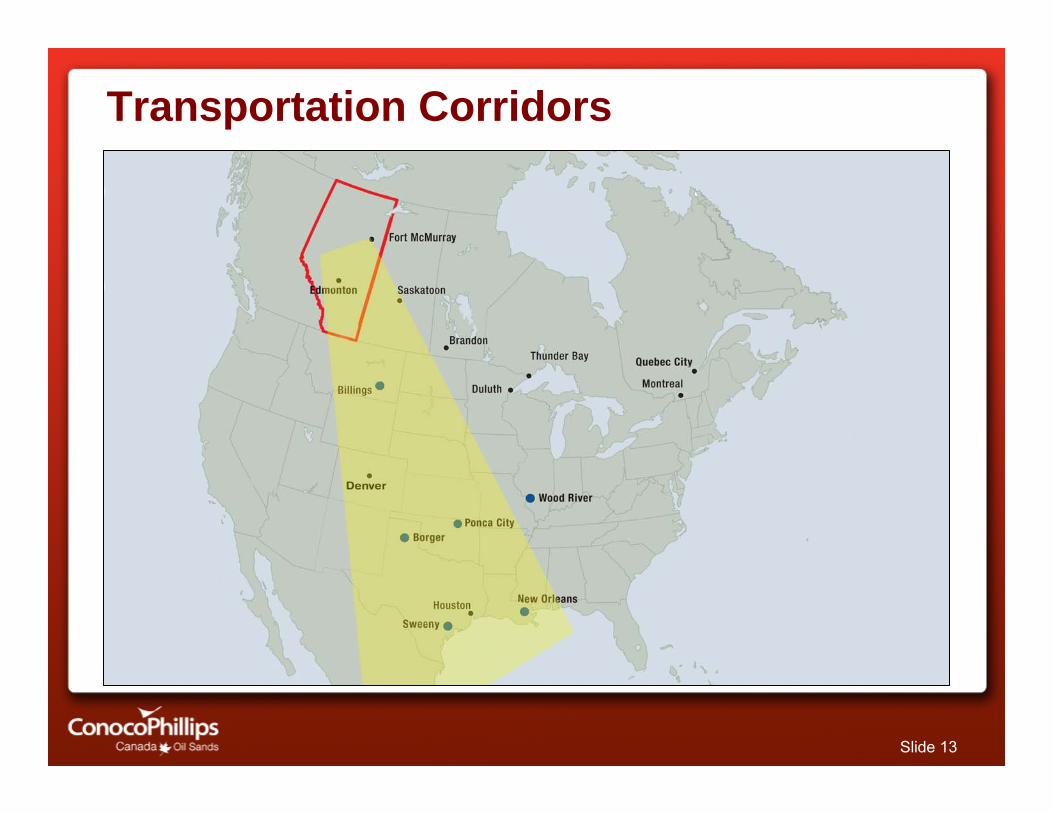
Transportation Corridors
Slide 13
A Secure Energy Future• Oil sands part of the energy mix and can be
developed sustainably.
• Opportunities for North America provided we have a conducive policy environment.
• Investing in technology to minimize the impacts associated with development.
• Opportunities for energy security that include transportation.
Slide 14

Opportunities in Canada’s Oil Sands
Ports-to-Plains Energy SummitJames Hand, VP Surmont Phase 2
ConocoPhillips CanadaApril 9, 2010
Slide 15