Halton economic review 2015
33
1 Halton Region Economic Review 2015
-
Upload
bethanyp -
Category
Economy & Finance
-
view
77 -
download
0
Transcript of Halton economic review 2015
1
Halton RegionEconomic Review 2015

22
Table of contentsMessage from Regional Chair Gary Carr . . . . . . . . . . . . . . 3
Central location . . . . . . . . . . . . . . . . . . . . . . . . . 4
Overview: doing business in Halton . . . . . . . . . . . . . . . . 5
Overview: living in Halton . . . . . . . . . . . . . . . . . . . . . 6
Employment . . . . . . . . . . . . . . . . . . . . . . . . . . . 7
Construction activity . . . . . . . . . . . . . . . . . . . . . . 10
Real estate activity . . . . . . . . . . . . . . . . . . . . . . . 16
Infrastructure . . . . . . . . . . . . . . . . . . . . . . . . . . 23
2015 business news . . . . . . . . . . . . . . . . . . . . . . 27
Living here . . . . . . . . . . . . . . . . . . . . . . . . . . . 29
Our services . . . . . . . . . . . . . . . . . . . . . . . . . . 31
Contact us . . . . . . . . . . . . . . . . . . . . . . . . . . . 33

Message fromRegional Chair Gary CarrHalton Region is committed to supporting and sustaining a strong local economy and ensuring businesses succeed throughout the region . When businesses locate in Halton, they are choosing one of the best places to do business in Canada . Businesses in our area benefit from a deep talent pool of professionals, proximity to leading educational institutions, easy access to major markets and a high quality of life that is second to none .
On behalf of Regional Council, I am proud to present Halton Region’s Economic Development – Economic Review 2015 report (2015 Economic Review) . This annual review provides an overview of business investment in our region and highlights how we are performing from an economic development perspective . By working together with our local municipalities and key community partners, we have again accomplished impressive results, including:
• Achieving a AAA credit rating for more than 25 consecutive years;
• Achieving a 5 .3 per cent unemployment rate, significantly lower than the rest of the Greater Toronto and Hamilton Area (GTHA), Ontario and Canada;
• Keeping property tax rates low when compared to other GTHA municipalities;
• Creating a confident business outlook, with 83 per cent of businesses surveyed anticipating economic conditions in Halton to remain stable or improve; and
• Investing in infrastructure with an additional $295 million into water, wastewater and transportation projects .
By planning for today and tomorrow, Halton Region will continue to support its vibrant and growing business community . I encourage you to learn more about our thriving economy, an integral part of what makes Halton a great place to live, work, raise a family and retire .
If you have any questions or comments, please contact me by dialing 311 or emailing gary .carr@halton .ca . You can also find me on Twitter @garycarrhalton, LinkedIn or Facebook .
Gary CarrHalton Regional Chair
3

Halton
Washington1.5hrs 8hrs
Bu�alo30 min 1hr
Niagara Falls1hr
Toronto30 min
Waterloo30 min
Ottawa1hr 4.5hrs Montreal
1hr 5.5hrs
Boston1.5hrs 8hrs
New York1.5hrs 7hrs
Detroit1hr 3 hrs
Chicago1.5hr 7hrs
4

5Overview: doing business in Halton
Population
Land area
Businesses
Jobs in Halton - workforce
Business parks
Credit rating
2015 Gross Regional operating budget
2015 Gross Regional capital budget
543,557
969 km2
13,259*
220,026*
16
AAA
$800M
$406M
Halton’s four
municipalities:
City of Burlington
Town of Halton Hills
Town of Milton
Town of Oakville
* Preliminary estimate - Halton Employment Survey 2015

Sources: Statistics Canada Census, National Household Survey, Labour Force Survey, Building Permit statistics, Toronto Real Estate Board .
For more detailed demographics and maps, visit
halton .ca/datacentre
Demographics
Quality of life
In comparison
Population
Post-secondary education
Central location
30 mins to Toronto
1 hr to Niagara Falls
Median age
Average household income
Natural environment
Population growth
Unemployment rate
Diverse and multicultural communities
Growth in total construction value
Great place to live
Halton business owners say quality of life is in line or better than the rest of the GTHA .
544K
$808M
820K
$1 .1B
1M
AmericasEuropeAfricaAsiaOther
$1 .8B
2015
2000
2031
2009
2041
2015
51% 49%
$667,688
Average housing price 2015
39.3
64% $79K
6 .9%
65% $86K
6 .8%
74% $119K
5 .3%
Canada Canada
Canada
Ontario Ontario
Ontario
Halton Halton
Halton
420 km2 of green space
26 km of waterfront
13 conservation parks
Years
Overview: living in Halton
93%
6

Employment
“Almost 50% of our employees live in Halton. It’s the perfect spot for our head office. Our customers appreciate that we’re here in the region. We expect to be here for a long time.”
Blake Macaskill – Managing Director, CIT Canada – Burlington, ON
7

Employment overview
A strong labour market and a highly-educated
workforce give Halton businesses a
competitive edge.
For more information about Halton’s workforce, visit
halton .ca/whyhalton
Unemployment rateHalton 5.3%Lower than:Greater Toronto Area 7.1%Ontario 6.8% Canada 6.9%
Business growth+ 66new places of employment in 2015(13,259* business count)
Participation rateHalton 70.4%Higher than:Greater Toronto Area 66.8%Ontario 65.2%Canada 65.8%
Job growth+ 1,769new jobs created in 2015(220,026* employment count)
*preliminary estimate - Halton Employment Survey 2015 Source: Statistics Canada, Labour Force Survey – Custom tabulation, three-month moving avg . unadjusted
8

Employment overview
Major employment sectors in Halton
Over 1/3of Halton business owners plan on hiring additional
staff in 2016
4 in 5Halton business owners rank availability of skilled labour
favourably
90%of Halton business owners anticipate steady or higher
profits in 2016
Retail Manufacturing Healthcare
Sources: Halton Business Conditions Survey 2015 and Halton Employment Survey 2015
9
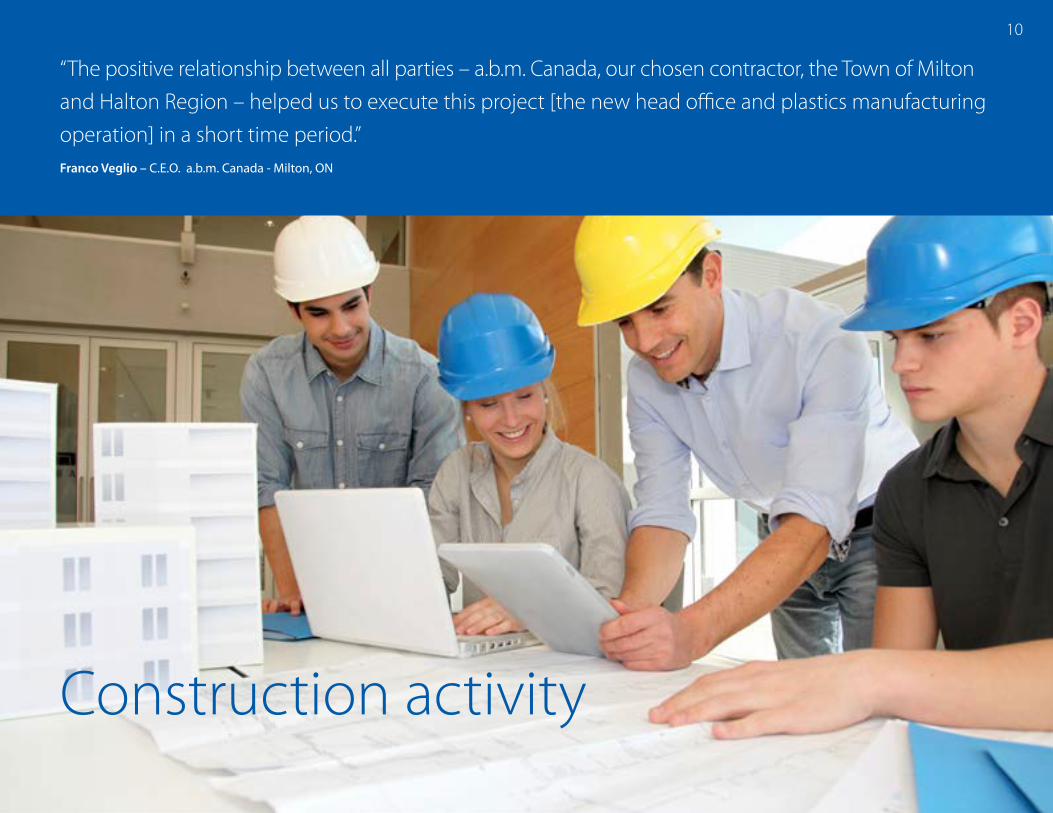
Construction activity
“The positive relationship between all parties – a.b.m. Canada, our chosen contractor, the Town of Milton and Halton Region – helped us to execute this project [the new head office and plastics manufacturing operation] in a short time period.”Franco Veglio – C .E .O . a .b .m . Canada - Milton, ON
10

Development activity
Over the last decade, Halton’s average
annual non-residential development growth increased nearly 20%.
For detailed development statistics visit
halton .ca/datacentre
Halton non-residential construction value 2005-2015 ($ millions)
of Halton business owners plan on investing in growth over the next year .37%
Construction value
Change 2014-2015
Avg. change since 2005
Industrial -27% 22%
Commercial -9% 11%
Institutional 279% 76%
Total non-residential 24% 19%
Sources: Statistics Canada, Building Permits Survey (Publication 64-001-XWF), February 2016 and Halton Business Conditions Survey 2015
2005
439.6395.5
650.8574.8
392.6336.5 352.3
2006 2007 2008 2009 2010 2011 2012 2013 2014 2015
1,151.7
707.2
550.0
681.7
11

Development activity
Total floor area built (sq. ft.)
2015 total value Growth 2014-2015
Industrial 3,800,278 316%
Office 345,485 -43%
Retail 267,320 -51%
Other* 662,477 8%
Total non-residential 5,075,560 89%
* projected
*Including institutionalSource: Halton Region, Non-Residential Development Charges Database
Halton annual non-residential total floor area (TFA)
built 2005 – 2016 (million sq. ft.)
Learn more at
12
2005
5.07
4.02
5.95
3.87
1.68 1.572.02
7.16
2.102.69
5.08
3.30
2006 2007 2008 2009 2010 2011 2012 2013 2014 2015 2016*
halton .ca/datacentre

Development activity across GTHA
In 2014, 15.3% of Halton’s total assessment base was non-residential (industrial, commercial and institutional). This figure represents a 0.2% annual increase.
Source: Ontario Ministry of Municipal Affairs, Financial Information Returns
Non-residential portion of total assessment – Greater Toronto and Hamilton Area (GTHA), 2014
Halton Hills
Durham Region
Hamilton
Oakville
Halton Region
York Region
Milton
Burlington
Toronto
Peel Region
12.0 %
12.2 %
12.4 %
14.0 %
15.3 %
16.0 %
16.4 %
17.4 %
19.9 %
21.6 %
13

Commercial development
Ten-year growth trend in commercial construction value across Halton 2005 – 2015 ($ millions)
2005
300232
364408
234178 190
532
310
2006 2007 2008 2009 2010 2011 2012 2013 2014 2015
299 271 Commercial $ value trendline forecast
Source: Statistics Canada, Building Permits Survey (Publication 64-001-XWF), February 2016
For a complete listing of commercial developments over $1M, please visit halton .ca/datacentre
$271MTotal value of new commercial construction
612,805 sq. ft.Total commercial floor area built*
Notable commercial developments:
$15.7MGreat Lakes Business Park, Oakville
$6.4MJoshua Creek Corporate Centre, Oakville
$2MLamenza Investments Corporation, Burlington
14
*Includes office and retail

Industrial development
Ten-year growth trend in industrialconstruction value across Halton2005-2015 ($ millions)
Industrial $ value trendline forecast
For a complete listing of industrial developments over $1M, please visit halton .ca/datacentre
$129MTotal value of new industrial construction
3.8M sq. ft.Total industrial floor area built
Notable industrial developments:
$40MEmery Investments Distribution centre, Milton
$30MPrologis Distribution CentreIndustrial warehouse, Milton
$26MBroccolini Construction Inc.Storage warehouse, Halton Hills
2005
80105
156
232
364 118
42178 55
177
129
105 299 271
2006 2007 2008 2009 2010 2011 2012 2013 2014 2015
97110
Source: Statistics Canada, Building Permits Survey (Publication 64-001-XWF), February 2016
15

Real estate activity
“This location [Oakville] appealed to us because it is a growing business community, is close to public transit and major highways, and has leading green design features, all of which support PwC’s environmental objectives. Our aim is to create a truly unique PwC work space that meets the diverse and long-term needs of the firm, both for our people and our business.”
Raj Kothari – GTA Managing Partner, PwC – Oakville, ON
16

Industrial real estate market summary
Key demand drivers such as Halton’s premium
location, proximity to highways and availability
of new real estate continue to spur new development
of industrial space.
For more details about finding the right
location for business investment, visit
halton .ca/siteselection
GTA industrial market vacancy rates (%), 2014 – 2015
GTA industrial market absorption 2015 (sq. ft. millions)
Average net rent (per sq. ft.)
$5.44Representing Burlington, Milton and Oakville
$5.41GTA Source: CBRE Ltd ., MarketView Q4 2015
Toronto Scarborough Markham Vaughan Mississauga Brampton Oakville Milton Burlington Caledon
Q4-2014 Q4-2015
3.32.42.4
1.51.42.22.5
1.41.2
2.92
2.6
54.2
8.8
6
1.71.81 0.2
GTA East
TorontoCentral
GTA North
GTA West
-0.10 0.74
3.34
6.16
17

Commercial real estate market summary
Ongoing employment land development and infrastructure advances will ensure that Halton
is well-represented in the GTA West’s office market growth in the
coming years.
For more information, visit
halton .ca/siteselection
$17.39Representing Burlington and Oakville
$17.69GTA
GTA office market vacancy rates (%), 2014 – 2015
GTA office market absorption, 2015 (sq. ft.)
Average net rent (per sq. ft.)
18
Toronto Downtown
Toronto Midtown
Scarborough Markham North /
Richmond Hill
North Yonge Vaughan Mississauga City Centre
Brampton Oakville Burlington
5.6 4.7
14.316.3
10.97.97.4
13.612.510.211.5
5.9
16
24.8 26.5
21 1922
7.4 7
Q4-2014 Q4-2015
GTA East
TorontoDowntown
TorontoMidtown
GTA North
GTA West
-193,791
757,025
25,914 119,628-43,259

Residential real estate market summary
88% increase over the past five years
29% increase over the past five years
38% decline over the past five years
Housing sales
Average home price ($)
Average days-on-market
Source: Toronto Real Estate Board, Market Watch
29%
38%
88%
2010 2011 2012 2013 20152014
4,692 5,330 5,8096,982
8,8017,807
2010 2011 2012 2013 20152014
517,811 543,414 556,407 580,954667,688620,467
2010 2011 2012 2013 20152014
40
3127 30 27
25
19

Propery taxes
Halton maintains competitive tax rates
for both industrial and commercial landowners.
Commercial tax rates in Halton are among the
lowest in the GTHA.
Contact us to find out more about industrial and
property tax rates
ecdev@halton .ca
Industrial property tax rates 2015 (% of taxable assessment)
Commercial property tax rates 2015 (% of taxable assessment)
Hamilton
Oshawa
Halton Hills
Burlington
Oakville
Milton
Brampton
Mississauga
Vaughan
Markham
5.66%
4.64%
3.13%
3.11%
3.02%
2.80%
2.68%
2.42%
2.03%
1.99%
Hamilton
Oshawa
Halton Hills
Burlington
Oakville
Milton
Brampton
Mississauga
Vaughan
Markham
3.62%
3.13%
2.26%
2.05%
1.9%
1.89%
1.84%
1.74%
1.70%
1.70%
Rates as of July 1, 2015 . Source: BMA Municipal Study, 2015
20
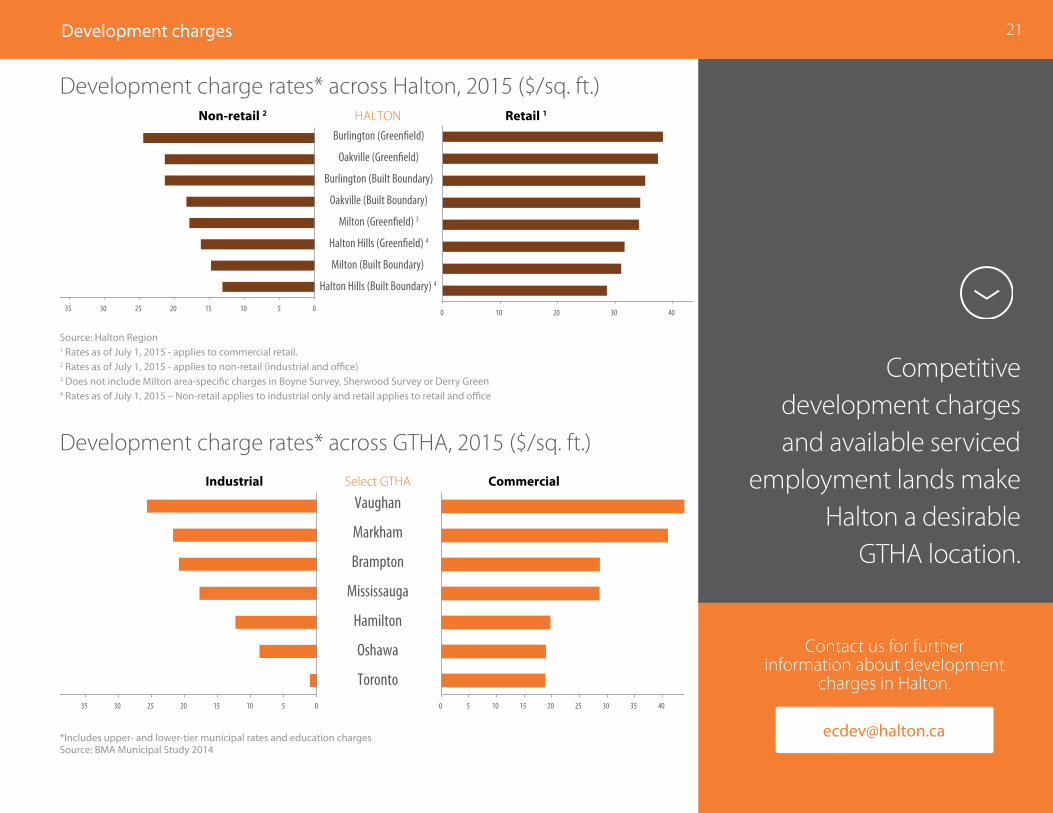
Development charges
Competitive development charges and available serviced
employment lands make Halton a desirable
GTHA location.
Contact us for further information about development
charges in Halton.
ecdev@halton .ca
Development charge rates* across Halton, 2015 ($/sq. ft.)
Development charge rates* across GTHA, 2015 ($/sq. ft.)
Source: Halton Region1 Rates as of July 1, 2015 - applies to commercial retail .2 Rates as of July 1, 2015 - applies to non-retail (industrial and office)3 Does not include Milton area-specific charges in Boyne Survey, Sherwood Survey or Derry Green4 Rates as of July 1, 2015 – Non-retail applies to industrial only and retail applies to retail and office
*Includes upper- and lower-tier municipal rates and education charges Source: BMA Municipal Study 2014
HALTON
Halton Hills (Built Boundary) 4
Milton (Built Boundary)
Halton Hills (Green�eld) 4
Milton (Green�eld) 3
Oakville (Built Boundary)
Burlington (Built Boundary)
Oakville (Green�eld)
Burlington (Green�eld)
0 10 20 30 40 50
Retail 1
50 45 40 35 30 25 20 15 10 5 0
Non-retail 2
Toronto
Oshawa
Hamilton
Mississauga
Brampton
Markham
VaughanSelect GTHA
50 45 40 35 30 25 20 15 10 5 0
Industrial
0 5 10 15 20 25 30 35 40 45 50
Commercial
Source: BMA Municipal Study 2015 & Regional Municipality of Halton* Halton Rates as of July 1, 2015. Applies to non-retail (ind. & o�ce)** Does not include Milton area
Source: BMA Municipal Study 2015 & Regional Municipality of Halton* Halton Rates as of July 1, 2015. Applies to Commercial Retail**Does not include Milton Area Specific charges in Boyne Survey, SherwoodSurvey or Derry Green.
21

Development activity across GTA
GTA industrial market shares, 2015 GTA comparison of total building permit construction value 2015
($ thousands per capita*)
Second strongest development market by size across the GTA in 2015.
Overall, Halton’s total construction value grew by 17% over 2014.
GTA commercial market shares, 2015
*2011 population estimatesSource: Statistics Canada, Building Permits Survey (Publication 64-001-XWF), February 2016
Halton PeelYork
3.7 3.583.4
2.99
2.37
DurhamToronto
ICI Residential
22
Halton
11%
41%15%
11%
22%
Peel
York
Durham
Toronto
$ 1.1 BGTA Industrial
construction value
Halton
7%14%
16%
3%
60%
Peel
York
Durham
Toronto
$ 3.8 BGTA Сommercial
construction value

Infrastructure
“A review of Greater Toronto Area corridors shows Halton Region as having the least congested corridors compared to other regional municipalities.”CIMA + Consulting, Time Delay Study 2014
23

Employment lands: infrastructure
Halton’s inventory of serviced employment land coming on stream over the next several years will help ensure Halton continues to be investment ready.
Regional servicing: $63 .2M trunk
infrastructure (initiated 2014/
completion 2017)
Status: Secondary Plan approved
by Halton Region in 2013, Ontario
Municipal Board (OMB) approval 2015
Regional servicing: $42 .7M trunk
infrastructure (initiated 2011)
Status: Regional Official Plan
Amendment (ROPA) 38 added 240 ha of
employment lands, ROPA 43
re-phased employment areas affected
by GTA West Environmental Assessment
(EA) post 2021
Regional servicing: $8 .3 million trunk
infrastructure
Status: Trunk water and wastewater
servicing completed 2015
Milton Derry Green Corporate Business Park
Halton Hills 401 Corridor
Oakville Winston Park West
For more details about Halton’s business parks, visit halton .ca/businessparks
HaltonHills
Milton
OakvilleBurlington
Milton Derry Green Corporate Business Park
Halton Hills 401 Corridor
Oakville Winston Park West
24

In 2015, Halton’s area servicing plans will help ensure that employment land is investment-ready
and that urban growth centres have the necessary infrastructure identified for intensification.
Employment lands: area servicing plans (ASP)
Bronte Meadows, Burlington • Contract awarded; work underway • Final ASP expected by Fall 2016
Halton Hills 401 Corridor• ASP to commence in 2017
Midtown Oakville• Contract awarded; work underway• Final ASP expected by late Fall 2016
Milton Education Village• Timing of the ASP will be determined in line with the Milton Education Village Secondary Plan
Upper Middle Rd
Mainway
QEWBu
rloa
k D
rive
App
leby
Lin
e
Fift
h Li
ne
Win
ston
Chu
rchi
ll Bl
vd
401
Steeles Avenue
Cornwall Road
Char
twel
l
Traf
alga
r Rd
QEW
Lakeshore Road
Bell
Scho
ol L
ine
Trem
aine
Roa
d
Derry Road
Britannia Road
Upper Middle Rd
Mainway
QEW
Burl
oak
Dri
ve
App
leby
Lin
e
Fift
h Li
ne
Win
ston
Chu
rchi
ll Bl
vd
401
Steeles Avenue
Cornwall Road
Char
twel
l
Traf
alga
r Rd
QEW
Lakeshore Road
Bell
Scho
ol L
ine
Trem
aine
Roa
d
Derry Road
Britannia Road
Upper Middle Rd
Mainway
QEW
Burl
oak
Dri
ve
App
leby
Lin
e
Fift
h Li
ne
Win
ston
Chu
rchi
ll Bl
vd
401
Steeles Avenue
Cornwall Road
Char
twel
l
Traf
alga
r Rd
QEW
Lakeshore Road
Bell
Scho
ol L
ine
Trem
aine
Roa
d
Derry Road
Britannia Road
Upper Middle Rd
Mainway
QEW
Burl
oak
Dri
ve
App
leby
Lin
e
Fift
h Li
ne
Win
ston
Chu
rchi
ll Bl
vd
401
Steeles Avenue
Cornwall Road
Char
twel
l
Traf
alga
r Rd
QEW
Lakeshore Road
Bell
Scho
ol L
ine
Trem
aine
Roa
d
Derry Road
Britannia Road
25

Employment lands: infrastructure highlights
Regional roads• Steeles Avenue reconstruction: Widening of Steeles Ave . between Winston Churchill Blvd .
and Trafalgar Rd . in Halton Hills completed in 2015
• Derry Road underpass: Underpass grade separation on Derry Road in Milton completed in 2015
Water and Wastewater• Mid Halton Wastewater Treatment Plant: Plant upgrades and expansion to increase
capacity and construct a new operations facility
• Skyway Wastewater Treatment Plant: Plant upgrades and expansion to increase capacity and construct a new operations facility and region-wide laboratory
• Britannia West Corridor Project: Extension to service lands from Sixteen Mile Creek to Tremaine Road in Milton
• Zone 1 Watermain: Tunneling watermain from Burloak Water Purification to Kitchen Reservoir to supply future development lands in north Oakville and Milton
FacilitiesPolice headquarters: Construction began on a new, state-of-the-art, 235,000 sq . ft . facility for the Halton Regional Police Service’s Headquarters in October 2015 . The facility is slated to be operational by 2017 and will be a central hub for police training, forensics, evidence management and administration .
In 2015, Halton invested $295 million into water, wastewater and transportation projects. More than $3 billion is planned to be invested over the next 10 years (to 2025).
For more information about infrastructure investment in Halton, visit halton .ca/advancedinfrastructure
26

2015 business news
Halton’s competitive edge as a leading business location continues to bring outstanding investment to the region.
27

Moody’s Investors Service reaffirms AAA credit rating for Halton Region .
Halton Healthcare Services opens their new, state-of-the-art, $2 .7 billion Oakville-Trafalgar Memorial Hospital .
The 2015 Pan Am/Parapan Am cycling events were held at the new world-class Mattamy National Cycling Centre in July and August .
Ford Motor Company celebrates the global production start of the all-new 2015 Ford Edge at the newly-transformed Oakville Assembly plant and hires an additional 400 employees .
L-3 WESCAM receives $75 million investment from the Federal Government to build next generation surveillance technology .
Laker Energy Products purchases a 65,000 sq . ft . manufacturing facility in Oakville .
Lowe’s opens a state-of-the-art 1 .3 million sq . ft . distribution facility .
Neovia Logistics opens a new state-of-the-art 435,000 sq . ft . facility in Halton Hills .
Three Halton companies named to 2015 Profit 500: Life Science Nutritionals, Secure Sense Solutions and ThreeOFour .
Atlantic Wind & Solar chooses Burlington for a 320 KW Solarpower plant .
Emery Investments breaks ground on new 410,000 distribution centre in Milton .
Carttera Private Equities breaks ground on new business park in Oakville .
2015 Halton business news
halton .ca/business
28
The latest economic development information, including an RSS feed, is available at
HaltonHills
Milton
OakvilleBurlington
Neovia Logistics
Halton Healthcare
L-3 WESCAM
Laker EnergyLife SciencesNutritional
* Atlantic Wind & Solar
Lowes Distribution
ThreeOFour
Emery Investments
FordCarttera
Secure Sense Solutions
Mattamy National Cycling Centre
*
28

Living here
“Halton offers such a range of high-quality neighbourhoods that it is no surprise many Siemens Canada employees call it home and love to avoid a daily commute downtown.”
Robert Hardt – President and CEO, Siemens Canada – Oakville, ON
29

Halton communities rank within top 10
Halton Region is one of the best places in
Canada to live and do business.
For more details why Halton is a great place to live and invest, visit
halton .ca/whyhalton
#1Overall Best Medium-sized City to Live - Burlington
#9Overall Best Small-sized City to Live - Halton Hills
#1Best Place for
Business - Milton
#2Overall Best Places to Raise Kids – Burlington
#6Best Places for New Immigrants – Burlington
#2Overall Best Medium-sized City to Live – Oakville
#4 Best Places for Business – Burlington
#7 Best Places to do Business – Oakville
#10 Best Places to Retire – Burlington
#9Best Places to Raise Kids – Halton Hills
#4Best Places to Raise Kids – Oakville
#8 Best Places to Raise Kids – Milton
30
Source : Rogers Media - Profit and MoneySense

Our services
Halton’s Economic Development group can assist with your investment and location needs, offering a one-window approach.
31

With a broad range of knowledge and contacts, we can provide you with support services and a detailed response that provides the information you need on our region’s economy, labour force, business costs, infrastructure, real estate and lifestyle.
Halton economic development services
Business development & site selection
Industry news & resources
Online data centre First point of contact
1
32

905-825-6000 or 1-866-442-5866
1151 Bronte RoadOakville, Ontario
L6M 3L1CANADA
halton.ca/invest
For more information about Halton or to get connected to opportunities,contact Halton’s economic development team:
@haltonbusiness Facebook.com/haltonbusiness Linkedin.com/haltonbusiness
Join the conversation!
Contact us 33