HALLIBURTON 2002 ANNUAL REPORT of $1 billion, and Landmark Graphics again had excellent revenues ......
122
HALLIBURTON 2002 ANNUAL REPORT
-
Upload
truongduong -
Category
Documents
-
view
215 -
download
0
Transcript of HALLIBURTON 2002 ANNUAL REPORT of $1 billion, and Landmark Graphics again had excellent revenues ......

H A L L I B U R T O N2 0 0 2 A N N U A L R E P O R T

COMPARATIVE HIGHLIGHTS
Millions of dollars and shares except per share data 2002 2001 2000
Diluted income (loss) per share from continuing operations $ (0.80) $ 1.28 $ 0.42
Diluted net income (loss) per share (2.31) 1.88 1.12
Cash dividends per share 0.50 0.50 0.50
Shareholders’ equity per share 8.16 10.95 9.20
Revenues 12,572 13,046 11,944
Operating income (loss) (112) 1,084 462
Income (loss) from continuing operations (346) 551 188
Net income (loss) (998) 809 501
Long-term debt (including current maturities) 1,476 1,484 1,057
Shareholders’ equity 3,558 4,752 3,928
Capital expenditures 764 797 578
Depreciation and amortization 505 531 503
Diluted average shares outstanding 432 430 446
Net income in 2001 includes a gain on disposal of discontinued operations of $299 million or $0.70 per diluted share.Net income in 2000 includes a gain on disposal of discontinued operations of $215 million or $0.48 per diluted share.
HALLIBURTON TODAY
The Energy Services Group offers the broadest array of products and services to the upstream petroleum industry
worldwide. These services include decision support services for locating hydrocarbons and managing digital data;
creation and evaluation of the wellbore; creation of infrastructure to move hydrocarbons; and optimization of
hydrocarbon production.
KBR, the Engineering and Construction Group, serves the energy industry by designing, building and providing
operations and maintenance services for liquefied natural gas plants, refining and processing plants, production
facilities and pipelines both onshore and offshore. The non-energy business of the group meets the engineering and
construction needs of governments and civil infrastructure customers.
CONTENTS
Letter to Shareholders 2Operations Overview 6Board of Directors 30Corporate Information 32Financial Information 33

12 0 0 2 H A L L I B U R T O N A N N U A L R E P O R T
O U R M I S S I O N : D E L I V E R I N G S E R V I C E Q U A L I T Y

2 0 0 2 H A L L I B U R T O N A N N U A L R E P O R T 2
D A V I D J . L E S A R L E T T E R T O S H A R E H O L D E R S
David J. Lesar, Chairman of the Board, President and Chief ExecutiveOfficer of Halliburton

32 0 0 2 H A L L I B U R T O N A N N U A L R E P O R T
DEAR FELLOW SHAREHOLDERS,
In 2001, Real Time technology began
transforming Halliburton into a faster,
smarter, more responsive service
company. This year, we took the next
step and made Service Quality a
Company-wide campaign.
At Halliburton, we’ve always prided
ourselves on our ability to perform
under the most extreme conditions or
constraints. But with the economy
laboring under the strain of geopolitical
tensions and uncertainties, the market-
place demands even more. We believe
that Service Quality, or knowing what
customers expect and delivering it
right the first time, will give us the
edge. Companies that can consistently
deliver exceptional Service Quality
will win on every front – customer
satisfaction, employee motivation and
shareholder value.
Throughout these pages, you’re going
to see and read stories of Halliburton
people achieving Service Quality
beyond expectations. You’ll see them
on job sites in remote and demanding
places, in laboratories and manufactur-
ing facilities around the world. You’ll
meet teams, individuals, old hands
and newcomers. And what you’re going
to notice is how much pride they
have in what they do. They are excited
about where they work and how
hard they work. They’re proud of their
years of experience and their loyalty
to the Company. They are Halliburton.
And it is through their efforts, and the
efforts of thousands more like them,
that Halliburton has achieved good
financial performance in 2002 – even
during a difficult environment.
Looking back, 2001 gave rise to a new
and frightening world with fear of
terrorism, the war in Afghanistan, a
global recession and growing geopoliti-
cal instability. That atmosphere has
persisted, making many companies
hesitant to increase their investments
because of concerns of what might
happen in the future. Yet, despite all
this, and the cloud of asbestos litiga-
tion, 2002 was a very good year for
Halliburton. While revenues were down
slightly for the year, we are very
pleased with our performance relative
to our peers in this very difficult
environment. I’d like to thank the
management team and hard-working
Halliburton people everywhere.
Certainly, one of the biggest news
items for Halliburton this year has
been the progress we have made toward
resolving our asbestos litigation problem.
We still have a long way to go and may
not get there, but we are working
toward a resolution that we believe will
result in a fair and equitable settlement
with the asbestos claimants and free us
to concentrate on the future.
Overall, we had solid results from
the Energy Services Group. Following a
record year for the Energy Services
Group in 2001, reduced drilling activity
in the United States and Canada and
increased pricing pressures in 2002
resulted in a 12 percent drop in
revenues for the Energy Services
Group. Yet, in spite of the decline in
rig activity, Sperry-Sun had record
revenues of $1 billion, and Landmark
Graphics again had excellent revenues
and operating income increases.
Higher revenues on the Engineering
& Construction side of the business
offset the Energy Services Group’s
decreased revenues. The Engineering
& Construction Group’s onshore and
offshore business revenues increased
by 25 percent or more, while the
Infrastructure business experienced a
22 percent rise.
With large contract wins in Algeria,
Egypt and Nigeria, KBR continues to
perform extremely well in the liquefied
natural gas (LNG) market. Government
Services also experienced significant
successes, including a site support serv-
ices contract with the U.S. Department
of Energy’s Los Alamos National
Laboratory in New Mexico, and a
design-build contract for the new U.S.
Embassy compound in Kabul,
Afghanistan.
A continuing bright spot for both
business groups was the international
market. Halliburton’s international
revenues increased in 2002 to 67 percent
of total revenues from 62 percent
a year ago. Another positive was
the dispositions of non-core business
assets that bolstered our liquidity.
Last year, our message was of

2 0 0 2 H A L L I B U R T O N A N N U A L R E P O R T
transformation. The transformation
continues, sweeping through every
part of the Company:
• There have been major organizational
changes, as the Energy Services
Group (ESG) and Engineering &
Construction Group (KBR) became
two independent business units in
2002. There were many reasons for
this restructuring: liquidity pressures
in a more difficult global business
environment; competitive pressures to
have the best possible cost structure;
pressure on the stock price due to
asbestos litigation; and the increasingly
different business drivers, business
cycles and customers of the Energy
Services Group and Engineering &
Construction Group. But the overriding
reason? Restructuring will enable both
companies to strengthen their busi-
nesses and go head-to-head with our
most powerful competitors, many of
them companies that have an emphasis
on one core competency. This will, in
turn, position Halliburton to achieve
sustained growth and profitability.
• There have been management changes.
Edgar Ortiz, the chief executive
officer of the ESG, retired Dec. 31
after a distinguished 33-year career
in the industry, and Halliburton
Energy Services President John Gibson
succeeded him. KBR continues under
the leadership of Randy Harl. Doug
Foshee is now our chief operating
officer, and C. Christopher Gaut has
joined us as chief financial officer.
• There have been fundamental business
changes, with the Engineering &
Construction Group making a bold
move in deciding it will no longer
pursue lump-sum engineering,
procurement, installation and com-
missioning (EPIC) projects for the
offshore oil and gas industry until and
unless the current business model
improves to allow for reasonable profits
at reasonable risks.
The oil and gas industry is historically
boom or bust. Since the collapse in
prices in late 1998, oil prices have been
even more unstable than in past decades.
The tight energy supply-and-demand
balance in the industry these days
means that even small shifts can lead
to large swings in prices.
Clearly, we are at a point in time
where we must redesign our Company
for short commodity price cycles and
position ourselves technologically,
operationally and culturally to respond
as the energy industry is evolving.
That means looking beyond what will
make us successful this year, and for-
ward into the next 10 years.
We’re working hard to increase our
productivity so that we can accomplish
more with a smaller core group.
Programs that align employee perform-
ance and compensation with our busi-
ness objectives are an important first
step. Our intense Service Quality focus
will produce more efficiencies, as well
as a competitive advantage.
We’re also finding ways to work
with our customers to improve overall
efficiency. This could mean a restruc-
turing of traditional relationships. Or
it could mean collaborative relation-
ships yielding more focused, effective
products and services. At Halliburton,
different times call for fresh thinking.
Innovation is the means by which
companies exploit change as an oppor-
tunity for growth, and technology will
continue to be a major thrust of our
strategy. Over the past five years,
Halliburton has invested more than
$1 billion developing game-changing
technologies in almost every product
line. Instead of designing products to
compete head-to-head with others in
the market, our aim is to create products
that optimize assets, solve problems
and deliver long-term value for ourselves
and our customers.
Today at the ESG, new technology
accounts for more than 20 percent of
our total revenues. But innovation can
also be achieved by integrating existing
technologies to provide new or improved
offerings, and we are pursuing opportuni-
ties to do this.
At the same time, we are shifting our
economic resources into areas of higher
productivity and greater yields. The
Energy Services Group and Engineering
& Construction Group currently hold the
No. 1 or No. 2 positions in most of their
product lines. The Energy Services Group
derives more than 75 percent of its
revenue today from product service lines
where it holds a No. 1 or No. 2 position.
4

52 0 0 2 H A L L I B U R T O N A N N U A L R E P O R T
In the months ahead, you will see us
developing strategies and investing to
sustain and grow those positions in all
of our product lines because that’s what
will generate the profitability to sustain
us, boom or bust.
I’ve said before how important Health,
Safety and Environment (HSE) is to
Halliburton. Respect for the environment
and for the health and safety of our
employees and others that we work with
is a core value, and we are a leader in
this arena. HSE is really about good
business practices. Take, for instance,
Company-mandated driver safety
initiatives. There’s a clear correlation
between not wearing seat belts and
cell phone use while driving and the
quantity and severity of incidents
that impact the health and safety of our
employees. Adverse incidents have a
negative impact on insurance rates
and worker productivity, which increase
our cost of operations. A zero incidents
objective is not just a good idea, it’s
good business.
Protecting the environment as we go
forward in the next decades is another
good business practice – management
of environmental risks saves money
today and demonstrates our commitment
to a better environment. Halliburton
is developing new technologies that will
help our customers address some of their
most pressing environmental needs.
For instance, Halliburton developed
the Sea Emerald Burner for well testing,
which produces a 99.9 percent clean
burn, back in 1994. It’s still considered
the industry standard. But as good as
it is, the result is still significant ther-
mal releases that are suspected to add
to global warming. Now, we’re working
on technologies that will eliminate
flaring altogether, such as open-hole
test techniques, formation testing while
drilling and under-balanced drilling
methods that enable us to evaluate the
reservoir in real time while drilling.
All of these technologies are environ-
mentally responsible, but none of them
will be truly successful unless they are
more cost-efficient and effective. It’s
entirely achievable, too, as we learned
from developing our new Accolade™
drilling fluid system. Designed to conform
to stricter regulatory standards in the
Gulf of Mexico, Accolade dramatically
increased the rate of penetration over
traditional fluids while significantly
reducing fluid losses from as many as
5,000 barrels to a few hundred barrels.
It’s a great example of how creativity
within guidelines resulted in cost and
performance breakthroughs.
As we look into the future, we can see
that challenges abound in every area
of our industry. Our industry’s workforce
in North America and Europe is aging,
and few young people are entering the
ranks. But Halliburton is finding and
training talented young professionals
at our locations around the world.
Engineers from countries like Malaysia,
Angola, Russia and the Caspian Sea
region are bringing fresh perspectives
and drive. They are welcome additions
to the Halliburton family.
The next 10 years will require diligence
and imagination. And despite current
industry conditions, I am very encour-
aged. We are transforming our internal
processes. We’re improving our execution
and our products. Everywhere you
look, the Energy Services Group and
Engineering & Construction Group are
being re-energized.
We’re evolving in our industry from
having value in fixed assets to having
value in intellectual capital, which
makes us very rich indeed. Because
Halliburton people are the finest that
the industry has to offer. As I walk the
hallways and visit job sites, the feeling
I get from managers to field personnel
is that we are entering the most exciting
period in our history. They are pleased
to be here at this point in time, with all
its risks and opportunities, because for
the companies that can think clearly and
act quickly, the rewards will be great.
I’d like to thank the people of
Halliburton for their spirit, dedication
and sense of adventure. I’m proud to
work with you.
David J. Lesar Chairman of the Board,President and Chief Executive Officer

2 0 0 2 H A L L I B U R T O N A N N U A L R E P O R T 6

72 0 0 2 H A L L I B U R T O N A N N U A L R E P O R T

2 0 0 2 H A L L I B U R T O N A N N U A L R E P O R T 8 2 0 0 2 H A L L I B U R T O N A N N U A L R E P O R T

W O R L D ’ S B E S T F R A C C R E W S
92 0 0 2 H A L L I B U R T O N A N N U A L R E P O R T2 0 0 2 H A L L I B U R T O N A N N U A L R E P O R T
“YOU CALL, WE HAUL.” Crews like this one in Mission area big reason why Halliburton is the “go-to” supplier of fracservices to South Texas. That, and the right tools: our one-of-a-kind HT-2000 pump, the only 2000 HHP pump designedto work at 20,000 psi; our high-tech, temperature-bustingSiroccoSM fracturing system and ExpediteSM XT proppantflowback control. Five wells treated with these technologiesincreased production revenues some $1.5 million in eightdays. Halliburton’s “you call, we haul” tradition meets the
21st century.
2 0 0 2 H A L L I B U R T O N A N N U A L R E P O R T 10
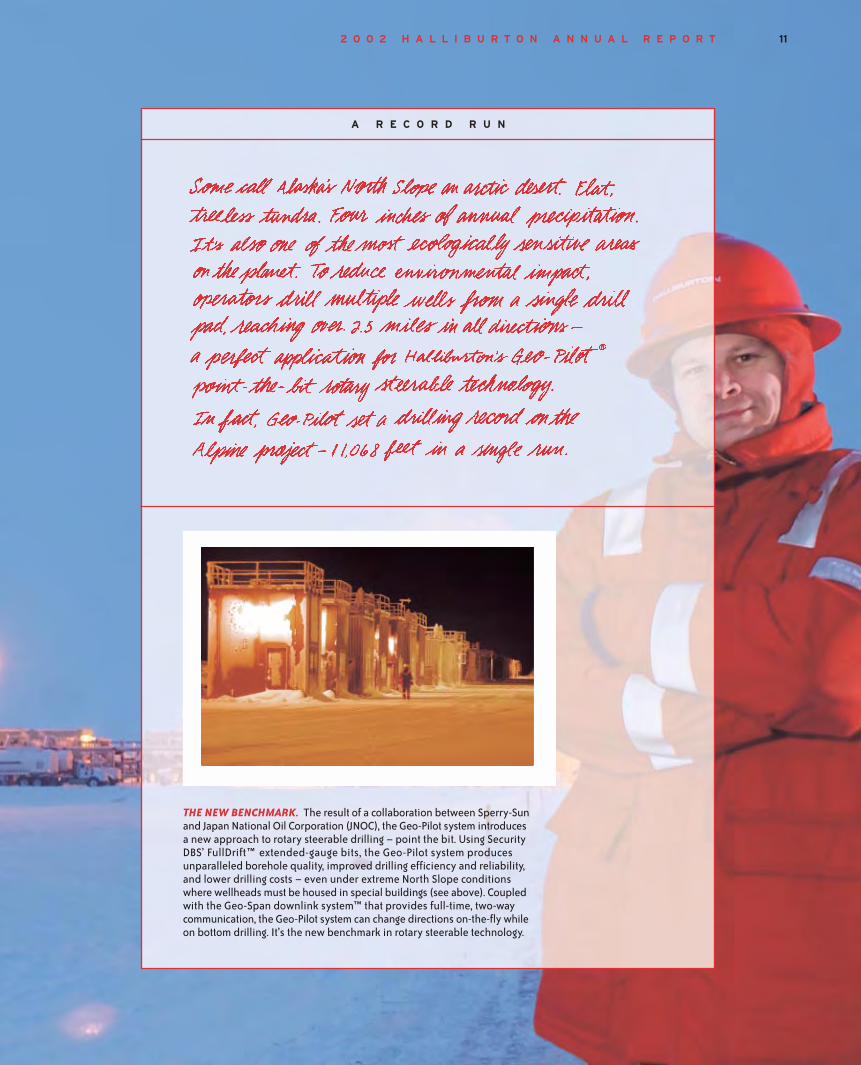
A R E C O R D R U N
112 0 0 2 H A L L I B U R T O N A N N U A L R E P O R T
THE NEW BENCHMARK. The result of a collaboration between Sperry-Sunand Japan National Oil Corporation (JNOC), the Geo-Pilot system introducesa new approach to rotary steerable drilling – point the bit. Using SecurityDBS’ FullDrift™ extended-gauge bits, the Geo-Pilot system producesunparalleled borehole quality, improved drilling efficiency and reliability,and lower drilling costs – even under extreme North Slope conditionswhere wellheads must be housed in special buildings (see above). Coupledwith the Geo-Span downlink system™ that provides full-time, two-waycommunication, the Geo-Pilot system can change directions on-the-fly whileon bottom drilling. It’s the new benchmark in rotary steerable technology.

12 2 0 0 2 H A L L I B U R T O N A N N U A L R E P O R T

132 0 0 2 H A L L I B U R T O N A N N U A L R E P O R T
G E T T I N G G R E E N
GREAT FOR THE ENVIRONMENT, GREAT FOR BUSINESS. Accolade’s exceptional properties provideminimized swab and surge pressures, one of the most desired qualities in deepwater drilling fluids.It reduces lost circulation, supplies better hole-cleaning efficiency and stability, and provides superior rates of penetration. It also dramatically cuts fluid losses and consumption – in some cases by 80 percent. For one customer, Accolade saved $3.8 million in reduced mud costs and rigtime. That’s great for the environment. Great for business.

2 0 0 2 H A L L I B U R T O N A N N U A L R E P O R T 14
152 0 0 2 H A L L I B U R T O N A N N U A L R E P O R T
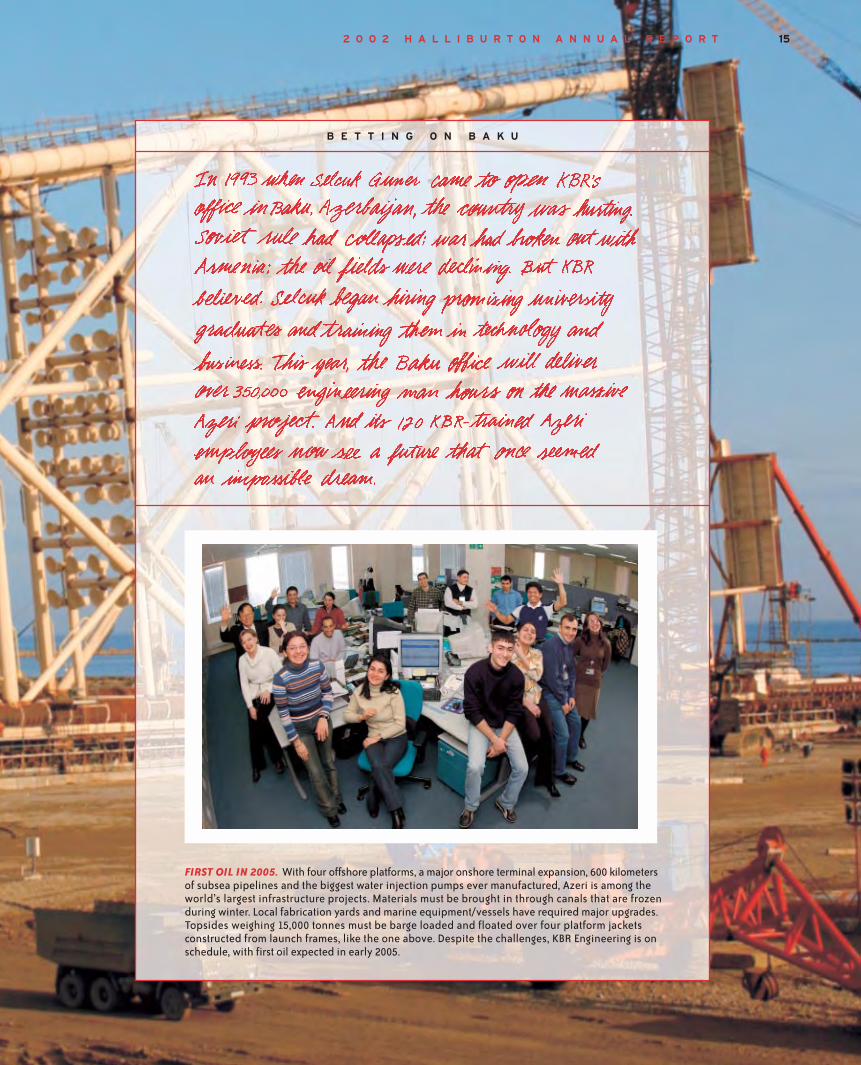
B E T T I N G O N B A K U
FIRST OIL IN 2005. With four offshore platforms, a major onshore terminal expansion, 600 kilometersof subsea pipelines and the biggest water injection pumps ever manufactured, Azeri is among theworld’s largest infrastructure projects. Materials must be brought in through canals that are frozenduring winter. Local fabrication yards and marine equipment/vessels have required major upgrades.Topsides weighing 15,000 tonnes must be barge loaded and floated over four platform jacketsconstructed from launch frames, like the one above. Despite the challenges, KBR Engineering is onschedule, with first oil expected in early 2005.

2 0 0 2 H A L L I B U R T O N A N N U A L R E P O R T 16
S T E P C H A N G E R S
THE ULTIMATE VISION. For years, it has beena goal within the oilfield services industryto drill a mono-diameter well. A wellbore withthe same diameter top to bottom would allowoperators to drill deeper, faster, more costeffectively – and with much less impact onthe environment. Enventure’s MonoDiameter™system, the ultimate application of SET tech-nology, along with Halliburton’s PoroFlex™expandable screens, VersaFlex™ expandableliner hangers (a section of which is shownin the printout, left) and the ChannelSeal™selective-set cementing system, brings the reality even closer. At right, parts of anexpansion assembly of the SET system.

172 0 0 2 H A L L I B U R T O N A N N U A L R E P O R T

2 0 0 2 H A L L I B U R T O N A N N U A L R E P O R T 18
G I A N T I N T H E D E S E R T
WHAT KBR DOES BEST. Many of KBR’s activities may seem surprising for an E&C company. Liketeaching people to make bricks and build homes, running a health clinic, or enabling home loans.But the client is committed to responsible development. Meanwhile, with 270 well sites, miles ofgathering lines and related facilities, and an ambitious schedule, it’s an immense undertaking, andKBR must deliver. So far, KBR has achieved 25 million incident-free work hours – and counting.

192 0 0 2 H A L L I B U R T O N A N N U A L R E P O R T2 0 0 2 H A L L I B U R T O N A N N U A L R E P O R T

A D R I V E F O R S A F E T Y
THE TRIPLE BOTTOM LINE. A winner of Halliburton’s HSE Award this year, Halliburton de Mexico hasan incredible safety record. After starting a driver safety program in 1997, the vehicle accident rateplunged. But the team members weren’t satisfied. They started training families covered by Halliburton’semployee medical insurance plan. Now, they’re training drivers who interact with Halliburton everyday, reducing the accident rate and serving the community at the same time – the bottom line of asuccessful HSE policy.
2 0 0 2 H A L L I B U R T O N A N N U A L R E P O R T 20

212 0 0 2 H A L L I B U R T O N A N N U A L R E P O R T

2 0 0 2 H A L L I B U R T O N A N N U A L R E P O R T 22
Value for service, or Service Quality,
isn’t a new concept. It is the age-old
expectation of every buyer, and it’s
at the heart of every service transac-
tion. But how do you define it? Is it
cost, or timeliness, or convenience? Is it
shiny new technology introduced
every year?
At Halliburton, we believe that
Service Quality comes from knowing
what our customers need and deliv-
ering it, when they need it and how
they need it. Service Quality is not
simply executing a job, but rather
doing it to meet or exceed our
customers’ expectations. It’s results,
pure and simple.
This is the story of how Halliburton
made Service Quality a business
strategy and a passionate focus –
starting where it counts, from within.
SERVICE QUALITY AND PEOPLE
One thing that we know with certain-
ty: Important organizational change
requires a cultural change. We’re not
just changing actions; we’re changing
a belief system.
Halliburton has experience doing
that. In 1997, the Energy Services
Group (ESG) and KBR made a com-
mitment to be the industry leaders in
Health, Safety and the Environment
(HSE). At the time, most people agreed
that HSE was a good idea. And there
were already a significant number of
Halliburton employees who had been
dedicated to these principles for years.
To strengthen this dedication, we made
HSE a focus of our business objectives
with a strong commitment – from
the Board of Directors on down – and
systems to measure our progress.
Today, HSE is ingrained into the
culture at Halliburton and is a core
value. We are one of the industry
leaders in safety performance. In 2002,
we had a remarkable 30 percent
decrease in the United States in our
Occupational Safety and Health
Administration (OSHA) recordable
incident rate, and this has been
reflected in our global operations.
If we can accomplish so much in a
short amount of time, who knows what
we can achieve with the same focus
on Service Quality?
SERVICE QUALITY AND THE
ENERGY SERVICES GROUP
For years, Halliburton has been known
as the hardest-working, most-reliable
energy services company in the oil
patch. “You call, we haul, that’s all.”
But is it? After all, as an energy
services company, it’s our responsibility
to find out what challenges our cus-
tomers are facing and give them the
means to meet them.
This year, “Done Right” became the
ESG’s Service Quality strategy, a key
part of our business strategy and our
mantra. Poor Service Quality costs
companies millions of dollars every
year and can end up costing some-
thing more valuable – a customer’s
trust. While our end-of-job customer
surveys say that 97 percent of our
customers are satisfied with the job
we do, we aim for nothing less than
100 percent. To do that takes refo-
cusing on what great customer satis-
faction really means.
A year ago, we said that Halliburton
was transforming the way we deliver
solutions in order to help our customers
maximize the economic recovery of
their hydrocarbon reservoirs. By that
standard, Service Quality involves
more than excellent job execution. It’s
about using our resources and experi-
ence to help our customers optimize
reservoirs and produce a profitable
well – without significant failures or
down time, and with environmental
compliance and zero incidents.
It’s about delivering the best solutions
in four areas that are of particular
concern to our customers: locating hydro-
carbons, creating the hole, putting in-
frastructure into the hole to move fluids
and gases, and optimizing production.
In this context, Service Quality
doesn’t necessarily mean designing a
new drill bit, but rather finding the
T H E Y E A R O F S E R V I C E Q U A L I T Y

232 0 0 2 H A L L I B U R T O N A N N U A L R E P O R T
best way to get our customers to the
reservoir. Whatever way that might
be. So we’re challenging the notion of
what it means to be an energy services
company and to become what the
industry needs us to be. That may
mean partnering with our customers
when we develop a special technology
for them, or getting involved in project
planning upfront and taking more
responsibility for results. Service
done right.
SERVICE QUALITY AND
TECHNOLOGY
In 2002, the ESG spent $247 million on
technology development. Halliburton
was awarded 194 patents in the U.S.
Due to this commitment, Halliburton
ranks among the top 100 U.S. technol-
ogy development companies. Our tech-
nologies are boosting our customers’
production, increasing reserves, and
reducing capital and operating
expenses. Can we do better?
Halliburton’s Innovative Product
Commercialization (IPC) provides a
clear path for identifying, developing
and commercializing new technologies.
The IPC framework enables
Halliburton to look into the future and
uncover innovative, new ideas and
opportunities that will help us solve
customer needs and profitably grow
our business. The underlying purpose
of IPC is to help us identify, develop
and commercialize technology quickly
AN ENVIABLE RECORD. Enventure employees continue to demonstrate their commit-ment to safety by completing a fourth year without a lost-time injury, a safety-performancelevel they take pride in.
SAFETY MEETING. Before leaving for the job site, the Mission, Texas, frac crew gathersfor its first safety meeting of the day. Such meetings help reinforce safe behavior and cutdown on recordable incidents.
... the Service Qualitythat we deliver todaywith our existingtechnology is whatforeshadows thedelivery of technologyfor tomorrow ...
2 0 0 2 H A L L I B U R T O N A N N U A L R E P O R T 24
and effectively in order to bring value
to Halliburton and our customers: the
right technology for right now.
It takes a world-class organization
to consistently deliver the finest appli-
cations of technology to the well site.
And because customers vote “yes” or
“no” in the marketplace, the Service
Quality that we deliver today with our
existing technology is what foreshadows
the delivery of technology for tomorrow.
In 2002, the ESG introduced some
truly ground-breaking technologies.
But it’s technology with a purpose.
Such is the case at Landmark
Graphics, where the first criterion of
any new technology is: How will it
help our customers find, develop and
produce their oil and gas resources
more quickly and efficiently? Last year,
Landmark led the oil and gas industry
by making its entire suite of integrated
software technology available to run
on Linux systems. Not only are they
providing customers with greater
platform choice and independence,
but the cost-effective Linux platforms
are producing measurable boosts in
performance of 10 times or more
and creating a significant customer
advantage by lowering costs and
reducing cycle times.
Throughout the world, nine out of
10 leading oil and gas companies are
using Landmark products to dramati-
cally compress many business-critical
workflows while increasing efficiencies.
Tasks that used to take days or weeks
can now be done in a matter of hours
or even minutes.
Landmark is currently developing
technologies in the areas of prospect
generation, field development and plan-
ning, well design, and drilling and pro-
duction optimization. When combined
with leading-edge technologies from
Halliburton, these products will further
increase the percentage of recoverable
reserves from new and existing reser-
voirs, while significantly reducing
finding and lifting costs.
Halliburton is also creating a new
generation of drilling, completion and
production enhancement products that
solve an entire range of needs. One
of them, Halliburton MicropolymerSM
,
is a non-surfactant based fluid system.
Using polymer chains 20 to 30 times
smaller than conventional polymers,
these micropolymer systems greatly
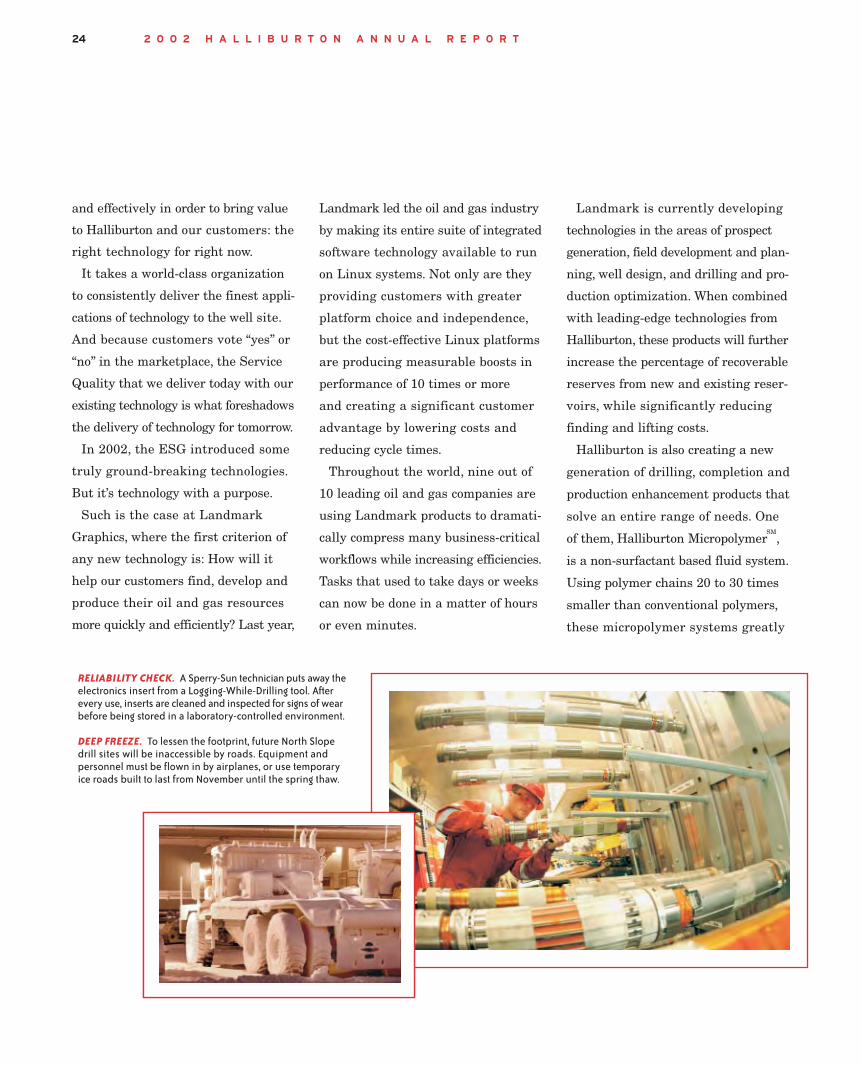
RELIABILITY CHECK. A Sperry-Sun technician puts away theelectronics insert from a Logging-While-Drilling tool. Afterevery use, inserts are cleaned and inspected for signs of wearbefore being stored in a laboratory-controlled environment.
DEEP FREEZE. To lessen the footprint, future North Slopedrill sites will be inaccessible by roads. Equipment andpersonnel must be flown in by airplanes, or use temporaryice roads built to last from November until the spring thaw.

252 0 0 2 H A L L I B U R T O N A N N U A L R E P O R T
improve conductivity and increase
initial hydrocarbon production rates
by up to 67 percent. Better still,
Halliburton Micropolymer is the
industry’s first and only reusable
frac fluid, making it much more cost
efficient and environmentally
responsible, too. That’s technology
done right.
Maximum profitability today has
a new definition. Companies in
the 21st century need to be socially
responsible and environmentally
conscious because their profitability
depends on it, and it’s the right thing
to do. Successful services companies
will deliver the products and services
that make this possible.
SERVICE QUALITY AND KBR
Service Quality is referred to at KBR
as Performance Excellence. A different
name, but the meaning is the same:
innovation and knowledge manage-
ment, excellent execution, predictable
results and customer value.
The idea of Performance Excellence
seems natural to a company like
KBR. After all, we are known for
our ability to execute some of the
most complex and exacting projects
anywhere. Whether it’s designing
and building a billion-dollar liquefied
natural gas (LNG) plant in Algeria
or rebuilding the U.S. Embassy in
Kabul, Afghanistan, KBR delivers.
But in the engineering and con-
struction industry these days, the
margins are thinner, room for error
is narrower, the landing zone smaller.
It can take three to five years from
contract to completion, and there
are hundreds of chances for a project
to fail. Our customers, our investors
and the marketplace demand pre-
dictability and certainty.
Performance Excellence is driven
by implementing innovative ideas
submitted by KBR employees. Their
ideas help us work faster and more
efficiently, without compromising
project integrity.
EXAMPLES OF INNOVATION
Years ago, we dreamed of the
24-hours-a-day, seven-days-a-week
virtual project. After all, sharing
work is shortening time to market in
the motor and aircraft industries.
Why not global work sharing in the
world of process plant design?
Today, technology is providing this
capability, and KBR has embraced it.
In a recent project, KBR and its
German joint venture partner collabo-
rated over a common 3-D CAD system
to design a phenol and acetone plant.
The teams worked concurrently,
sharing files between offices on two
continents and delivering a fully
integrated and successful design on
a very aggressive schedule.
This is also taking place in KBR’s
Infrastructure business product line,
where design and engineering work
transcend geographical boundaries.
On one of KBR’s large U.K. road
concessions involving the upgrade of
a major road to motorway standard,
... Performance Excellence is driven byimplementing innovative ideas submittedby KBR employees. Their ideas help uswork faster and more efficiently ...

2 0 0 2 H A L L I B U R T O N A N N U A L R E P O R T 26
MOVING OIL. Workers finish construction on Pump Station Three at the Belabo site in Cameroon.
... Halliburton has a workforce of83,000 people in more than 100 countries.With so many chances to do good orharm, we choose to do what is right ...

272 0 0 2 H A L L I B U R T O N A N N U A L R E P O R T
bridge design and the development of
the CAD design model are being
carried out in Australia, while the
road design is undertaken in the U.K.
KBR’s Engineering Excellence
Group is working to make these break-
through scenarios routine. A laboratory
for purposeful engineering innovation,
the group is blending process engi-
neers, layout engineers and cost
engineers to create a new engineer –
the concept engineer – and improving
how a project gets done.
One approach being studied is using
object-oriented data dynamically.
Project teams around the globe will
access warehoused data through a
secure Web-based portal and provide
input to its development as it moves
through the system. This multi-dis-
ciplinary involvement at every stage
helps to enhance overall knowledge,
eliminate rework, compress schedules
and deliver a better project – the very
definition of Performance Excellence.
PEOPLE EXCELLENCE
“Entrepreneurs innovate,” writes Peter
Drucker. But innovation isn’t only
technical. Throughout KBR, innovation
champions are helping people apply
creative problem-solving techniques
and tools to daily tasks. Employees
are encouraged to challenge the existing
business model and remake critical
business processes, and to submit
ideas for transforming work through
an online Idea Zone.
Innovation is becoming part of
the KBR psyche, and Knowledge
Management goes hand in hand with
it. Using Knowledge Management
techniques, we are capturing the very
best of our expertise and our practices
and making it accessible to our people
through knowledge portals – providing
the right information at the right time.
We are also connecting people
through global discipline teams and
communities of practice to systemati-
cally capture, share and integrate
information throughout KBR. The
effective utilization of our intellectual
capital enables us to achieve Perfor-
mance Excellence and to produce value
for our shareholders and customers.
Like the ESG, KBR believes that
by improving our people’s skills,
Performance Excellence will follow.
A key piece – our Company-wide
People, Performance, Results pro-
gram – aligns performance goals
and career objectives with business
strategy and ties compensation to
accomplishment.
Also taking aim at people excellence,
a worldwide taskforce is presently
defining the competencies needed for
every job at KBR. By evaluating
employees against this standard, we
can assess their skills and provide
training where there are gaps.
Employees will use the critical skills
we’ve identified for all levels of man-
agement, from first-time managers to
the executive team, as a fast track for
career development. KBR’s executive
team will assess its senior and middle
managers through the Leadership
Performance Program. Already, KBR’s
president and CEO met personally
with more than 100 senior managers
to evaluate their direct reports, guide
them in succession planning and
identify high-potential employees to
be the KBR leaders of tomorrow.
Nurturing young talent is our invest-
ment in the future. IMPACT, the global
network for KBR’s young engineers,
was founded last year and now has
more than 1,000 members. Committed
to career and personal development
and making an “impact” on the compa-
ny’s future, these enthusiastic young
professionals are, in turn, visiting area
schools, colleges and universities, talk-
ing to students and planting the seeds
for KBR’s next generation.
Our Performance Excellence focus
began just a little over a year ago.
But the idea has caught on, and it’s
quickly becoming our way of life.
Evidence of our success rests in our
new and repeat business. KBR
booked an average of $1 billion in new

business each quarter of 2002.
It’s also evident as you walk our
hallways and hear the buzz. E&C
firms, especially the size and scope
of KBR, aren’t expected to have this
kind of excitement. But our aim is to
refashion KBR into a different kind
of company that will be a model for
the new millennium. And it’s working.
SERVICE QUALITY BEYOND
PROFITS
As human beings and citizens of this
planet, we are inextricably linked.
While we understand that as a com-
pany we cannot expect to solve all the
world’s problems, we also believe that
we have a responsibility to make our
world a better place. To Halliburton,
Service Quality also means service to
a greater good.
Halliburton has a workforce of
83,000 people in more than 100 coun-
tries. With so many chances to do
good or harm, we choose to do what
is right. We conduct business ethics
training and have a strong code of
conduct that applies to all employees
since we highly value principled busi-
ness practices.
Health is the first word of our HSE
initiative, and we take a proactive
approach to health management. We’re
teaching workers in Africa about
AIDS and mosquito-borne diseases,
and office workers about high blood
pressure and cholesterol. Our office in
Chad is helping to fund a center to
study tropical diseases that shorten
lives and affect the quality of life for
that country’s citizens.
We also believe that every employee
has the right to expect a safe, healthy
workplace. We begin meetings with
an HSE or safety moment, dis-
cussing specific on-the-job risks and
how to mitigate them. Everywhere we
operate, drivers receive safety training,
seatbelts are mandatory, and the use
of business cell phones while driving
is prohibited.
It’s the norm that during booming
markets in our industry, increased
activity makes accident rates go up.
Yet, Halliburton’s incident rate has
actually dropped for the last several
years in a row, including during the
strong market of 2001. We are proud
that our incident rate is much lower
than the industry average because
of our commitment to safety and our
processes. In 2002 at Halliburton,
we drove more than 400 million miles
– that’s about twice around the planet
every hour – and we did it without a
single employee driving-related
fatality.
We’re also creating technologies
that are reusable, sustainable and
environmentally responsible. We’ve
developed drilling systems that
reduce waste; we’re removing toxic
components from our formulations
and eliminating flaring; and we’re
researching solutions that will allow
us to clean and re-use water while
drilling. Our real time technologies
for remote monitoring of reservoirs
are reducing our footprint at the well
site, and by reducing travel, we’re
also reducing our emissions.
Halliburton is a company of people,
and it is to them that we owe our
best effort. We have a 91 percent
nationalized workforce. We provide
jobs to local people, fair trade oppor-
tunities to local companies and
support to local communities. We’re
encouraging young people to enter
our industry by subsidizing student
membership dues in professional
organizations so they have a practical
and university education. Halliburton
people commit thousands of hours to
community outreach projects – sup-
porting schools, cleaning beaches and
deserts, planting trees – because that’s
what it means to be a good neighbor.
We do these things because we
understand that we are – all of us –
dependent on each other for the
survival of our planet, and we realize
that our actions have consequences.
We are keenly aware that to lead is
more than to make the most money.
We know that to lead is to serve.
2 0 0 2 H A L L I B U R T O N A N N U A L R E P O R T 28

MAKING A CONTRIBUTION.A mother and her young child standoutside their home in a Chadianvillage. Around the world, familieslike this one often benefit from the employment opportunities andcommunity involvement thatHalliburton brings to their homelands.
ABCs. Chadian children start theirday in the new village school. Theone-room schoolhouse was built withdonated materials and assistance fromKBR and its joint venture partners, andholds around 30 students.
… Halliburton peoplecommit thousands ofhours to communityoutreach projects – supporting schools,cleaning beaches anddeserts, planting trees – because that’swhat it means to bea good neighbor …
292 0 0 2 H A L L I B U R T O N A N N U A L R E P O R T

2 0 0 2 H A L L I B U R T O N A N N U A L R E P O R T 30
H A L L I B U R T O N B O A R D O F D I R E C T O R S
ROBERT L . CRANDALL
( 1986) (a), (b), (c)
Chairman Emeritus
AMRCorporation/AmericanAirlines, Inc.Irving, Texas
KENNETH T. DERR
(2001 ) (a), (c), (e)
Retired Chairman of the
Board
Chevron CorporationSan Francisco, California
CHARLES J. D IBONA
( 1997) (a), (b), (d)
Retired President and
Chief Executive Officer
American PetroleumInstitute Great Falls, Virginia
L AW R E N C E S .
E A G L E B U R G E R
( 1 9 9 8 ) (a), (c), (e)
Senior Foreign Policy
Advisor
Baker, Donelson,Bearman & Caldwell Washington, D.C.
J . L A N D I S M A R T I N
( 1 9 9 8 ) (a), (d), (e)
President and
Chief Executive Officer
NL Industries, Inc.Houston, TexasChairman and
Chief Executive Officer
Titanium MetalsCorporation Denver, Colorado
JAY A . PRECOURT
( 1998 ) (a), (b), (d)
Chairman of the Board
and Chief Executive Officer
Scissor Tail Energy, LLC Vail, Colorado
DEBRA L . REED
(2001 ) (a), (d), (e)
President and
Chief Financial Officer
Southern California GasCompany and San Diego Gas & Electric Company San Diego, California
C. J. S ILAS
( 1993) (a), (b), (c)
Retired Chairman of the
Board and Chief Executive
Officer
Phillips PetroleumCompany Bartlesville, Oklahoma

312 0 0 2 H A L L I B U R T O N A N N U A L R E P O R T2 0 0 2 H A L L I B U R T O N A N N U A L R E P O R T
(a) Member of the Management Oversight Committee
(b) Member of the Compensation Committee
(c) Member of the Audit Committee
(d) Member of the Health, Safetyand Environment Committee
(e) Member of the Nominatingand Corporate GovernanceCommittee
W.R. HOWELL
( 199 1 ) (a), (b), (c)
Chairman Emeritus
J.C. Penney Company,Inc.Dallas, Texas
RAY L . HUNT
( 1998) (a), (c), (e)
Chairman of the Board
and Chief Executive Officer
Hunt Oil Company Dallas, Texas
DAVID J. LESAR
(2000)
Chairman of the Board,
President and Chief
Executive Officer
Halliburton Company Houston, Texas
AYLWIN B. LEWIS
(2001 ) (a), (b), (d)
President, Chief Multibranding
& Operating Officer
YUM! Brands, Inc.Louisville, Kentucky
32 2 0 0 2 H A L L I B U R T O N A N N U A L R E P O R T
CORPORATE OFFICERS
DAVID J. LESAR
Chairman of the Board,President and Chief Executive Officer
DOUGLAS L . FOSHEE
Executive Vice President and Chief Operating Officer
C. CHRISTOPHER GAUT
Executive Vice President and Chief Financial Officer
ALBERT O. CORNELISON JR.
Executive Vice President and General Counsel
JERRY H . BLURTON
Vice President and Treasurer
CEDRIC W. BURGHER
Vice President, Investor Relations
WELDON J. MIRE
Vice President, Human Resources
CHARLES E . DOMINY
Vice President, GovernmentRelations
ARTHUR D. HUFFMAN
Vice President and Chief Information Officer
MARGARET E . CARRIERE
Vice President, Secretary and Corporate Counsel
R. CHARLES MUCHMORE JR.
Vice President and Controller
DAVID R. SMITH
Vice President, Tax
ENERGY SERVICES GROUP
JOHN W. G IBSON JR.
President and Chief Executive Officer
ENGINEERING AND
CONSTRUCTION GROUP
KBR
ALBERT J. STANLEY
Chairman
ROBERT R. HARL
President and Chief Executive Officer
SHAREHOLDER INFORMATION
Corporate Office 5 Houston Center1401 McKinney, Suite 2400Houston, TX 77010
S H A R E S L I S T E D
New York Stock ExchangeSwiss ExchangeSymbol: HAL
T R A N S F E R A G E N T A N D
R E G I S T R A R
Mellon Investor Services LLC85 Challenger Road Ridgefield Park New Jersey 07660-21041-800-279-1227www.melloninvestor.com
F O R M 1 0-K R E P O R T
Shareholders can obtain a copy of the Company’s annual report to theSecurities and Exchange CommissionForm 10-K by contacting:Vice President, Investor Relations Halliburton Company 5 Houston Center1401 McKinney, Suite 2400Houston, TX 77010
For up-to-date information onHalliburton Company, shareholdersmay use the Company’s toll-freetelephone-based information serviceavailable 24 hours a day at 1-888-669-3920 or contact theHalliburton Company homepage onthe Internet’s World Wide Web atwww.halliburton.com.
M A N A G E M E N T A N D C O R P O R A T E I N F O R M A T I O N

M A N A G E M E N T ’ S D I S C U S S I O N A N D A N A L Y S I S
332 0 0 2 H A L L I B U R T O N A N N U A L R E P O R T
In this section, we discuss the business environment,
operating results and general financial condition of
Halliburton Company and its subsidiaries. We explain:
• factors and risks that impact our business;
• why our earnings and expenses for the year 2002 varyfrom 2001 and why our earnings and expenses for 2001vary from 2000;
• capital expenditures;
• factors that impacted our cash flows; and
• other items that materially affect our financial conditionor earnings.
BUSINESS ENVIRONMENT
Our business is organized in the following two business
segments:
• Energy Services Group; and
• Engineering and Construction Group.
We currently operate in over 100 countries throughout the
world, providing a comprehensive range of discrete and
integrated products and services to the energy industry and
to other industrial and governmental customers. The
majority of our consolidated revenues is derived from the
sale of services and products, including engineering and
construction activities to major, national and independent
oil and gas companies. These services and products are used
throughout the energy industry from the earliest phases
of exploration, development and production of oil and gas
resources through refining, processing and marketing.
The industries we serve are highly competitive with
many substantial competitors for each segment. In 2002, the
United States represented 33% of our total revenue and the
United Kingdom represented 12%. No other country
accounted for more than 10% of our operations. Unsettled
political conditions, social unrest, acts of terrorism, force
majeure, war or other armed conflict, expropriation or other
governmental actions, inflation, exchange controls or
currency devaluation may result in increased business risk
in any one country. We believe the geographic diversification
of our business activities reduces the risk that loss of
business in any one country would be material to our
consolidated results of operations.
Hal l ibur ton Company
Activity levels within our two business segments are
significantly impacted by the following:
• spending on upstream exploration, development andproduction programs by major, national and independentoil and gas companies;
• capital expenditures for downstream refining, processing,petrochemical and marketing facilities by major, nationaland independent oil and gas companies; and
• government spending levels.
Also impacting our activity is the status of the global
economy, which indirectly impacts oil and gas consumption,
demand for petrochemical products and investment in
infrastructure projects.
Some of the more significant barometers of current and
future spending levels of oil and gas companies are oil and
gas prices, exploration and production drilling prospects, the
world economy and global stability which together drive
worldwide drilling activity. As measured by rig count, high
levels of worldwide drilling activity during the first half of
2001 began to decline in the latter part of that year. Drilling
levels reached a low, particularly in the United States for
gas drilling, in April 2002. The decline was partially due to
general business conditions caused by global economic
uncertainty which was accelerated by the terrorist attacks
on September 11, 2001. An abnormally warm 2001/2002
winter season in the United States also resulted in
increased working gas in storage. The high level of gas in
storage put pressure on gas prices, which resulted in
reduced gas drilling activity particularly in the Western
portion of the United States.
For the year 2002, natural gas prices at Henry Hub
averaged $3.33 per million cubic feet, commonly referred to
as mcf, compared to $4.07 per mcf in 2001. Gas prices
continued to decline during the first two months of 2002 and
2 0 0 2 H A L L I B U R T O N A N N U A L R E P O R T 34
then steadily increased throughout the year ending at an
average of $4.65 per mcf in December. Based upon data from
a leading research association at the end of 2002, the gas
price at Henry Hub was expected to average slightly above
$3.73 per mcf for all of 2003 and $4.00 per mcf for the 2003
first quarter. However, actual prices have been
significantly higher averaging $6.33 per mcf during
January and February. These higher gas prices have not
translated into significantly increased gas drilling rig
activity as of the end of February.
Natural gas prices have been impacted by an abnormally
cold 2002/2003 winter season thus far in the United States,
resulting in reduced gas storage levels. As of January 31,
2003, working gas in storage was 1,521 billion cubic feet,
commonly referred to as bcf, according to Energy
Information Administration estimates. These stocks were
811 bcf less than last year at this time and 287 bcf below
the 5-year average of 1,808 bcf. At 1,521 bcf, total working
gas in storage is within the 5-year historical range. While
gas prices in the United States have historically varied
somewhat geographically, this winter we have seen
significantly higher fluctuations in regional gas prices in the
United States. For example, while the price averaged
$4.27 per mcf in the fourth quarter at Henry Hub, it was
less than $2.00 per mcf in various parts of the Western
United States. This is resulting in significant variation in
gas drilling activity by region in the United States and
much lower drilling and stimulation activity in the gas
basins of the Western United States.
Crude oil prices for West Texas Intermediate, commonly
referred to as WTI, averaged $25.92 per barrel for all of
2002 compared to $26.02 per barrel for 2001. Oil prices have
continued to trend upward since the beginning of 2002.
Quarterly average WTI increased from $20.52 in the 2001
fourth quarter, to $28.23 in the 2002 third quarter and
increased slightly to $28.34 during the 2002 fourth quarter.
We believe that current oil prices reflect the disruption of
supplies from Venezuela due to political unrest related to
the national strike and a war premium due to the risk of
M A N A G E M E N T ’ S D I S C U S S I O N A N D A N A L Y S I S
supply disruption as a result of the armed conflict in the
Middle East. OPEC, on January 12, 2003, agreed to raise its
output ceiling by 1.5 million barrels per day or 6.5% to 24.5
million barrels per day. Prices for the first and second
quarters of 2003 will be impacted by the length of disruption
of Venezuelan crude oil supplies, the ability of OPEC to
manage country production quotas, political tensions in the
Middle East, global demand and the level of production by
major non-OPEC countries, including Norway, Russia and
other members of the former Soviet Union.
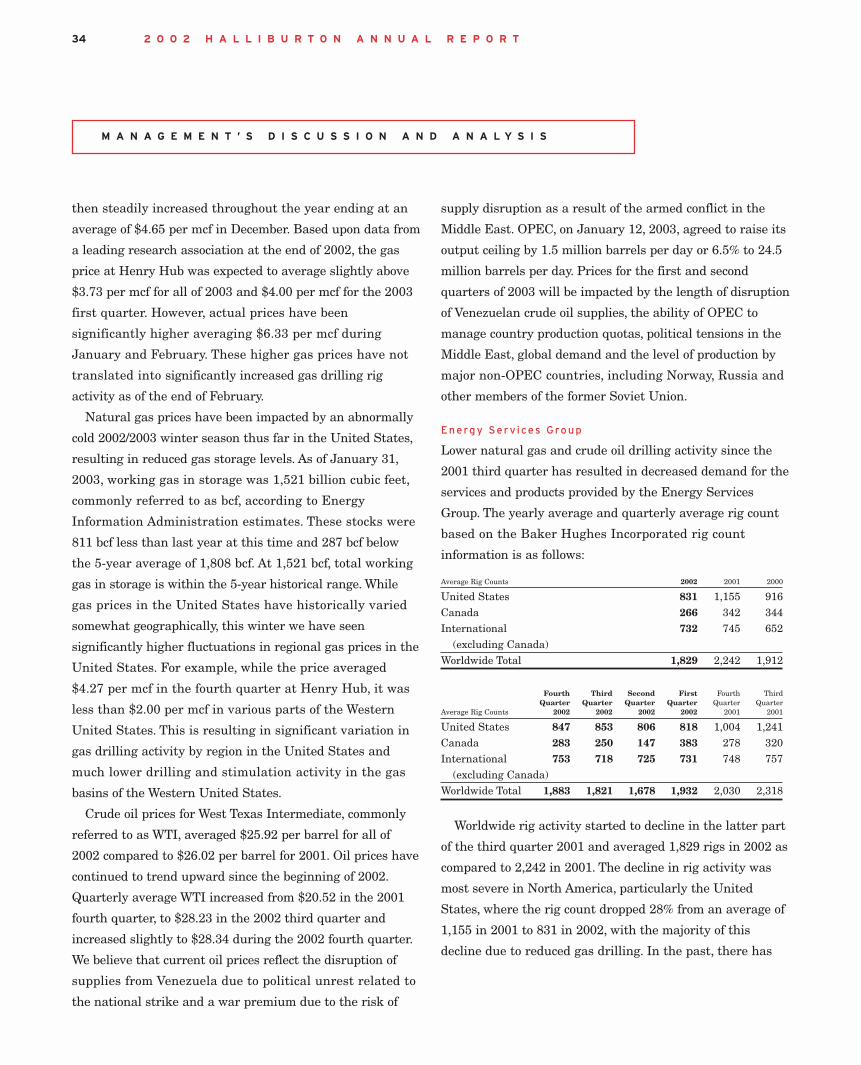
Energy Serv ices Group
Lower natural gas and crude oil drilling activity since the
2001 third quarter has resulted in decreased demand for the
services and products provided by the Energy Services
Group. The yearly average and quarterly average rig count
based on the Baker Hughes Incorporated rig count
information is as follows:
Average Rig Counts 2002 2001 2000
United States 831 1,155 916 Canada 266 342 344 International 732 745 652
(excluding Canada)Worldwide Total 1,829 2,242 1,912
Fourth Third Second First Fourth ThirdQuarter Quarter Quarter Quarter Quarter Quarter
Average Rig Counts 2002 2002 2002 2002 2001 2001
United States 847 853 806 818 1,004 1,241 Canada 283 250 147 383 278 320 International 753 718 725 731 748 757
(excluding Canada)Worldwide Total 1,883 1,821 1,678 1,932 2,030 2,318
Worldwide rig activity started to decline in the latter part
of the third quarter 2001 and averaged 1,829 rigs in 2002 as
compared to 2,242 in 2001. The decline in rig activity was
most severe in North America, particularly the United
States, where the rig count dropped 28% from an average of
1,155 in 2001 to 831 in 2002, with the majority of this
decline due to reduced gas drilling. In the past, there has

M A N A G E M E N T ’ S D I S C U S S I O N A N D A N A L Y S I S
352 0 0 2 H A L L I B U R T O N A N N U A L R E P O R T
generally been a good correlation between the price of oil
and gas in the United States and rig activity. However, this
has not been the case in recent months where the rig count
has declined as compared to the fourth quarter 2001, while
WTI oil and Henry Hub gas prices have increased. We
believe this is due to economic uncertainty, which we expect
to continue into at least the next quarter or two, created by
the following:
• volatility of oil and gas prices;
• disruption of oil supplies from Venezuela;
• differences in gas prices geographically in the UnitedStates;
• less spending due to current uncertain global economicenvironment;
• the armed conflict in the Middle East;
• budgetary constraints of some of our customers;
• focus on debt reduction by some of our customers;
• lack of quality drilling prospects by exploration andproduction companies; and
• level of United States working gas in storage during thewinter heating season.
It is common practice in the United States oilfield services
industry to sell services and products based on a price
book and then apply discounts to the price book based upon
a variety of factors. The discounts applied typically increase
to partially or substantially offset price book increases
in the weeks immediately following a price increase. The
discount applied normally decreases over time if the
activity levels remain strong. During periods of reduced
activity, discounts normally increase, reducing the net
revenue for our services and conversely during periods of
higher activity, discounts normally decline resulting in
net revenue increasing for our services.
During 2000 and 2001, we implemented several price
book increases. In July 2000, as a result of increased
consumable materials costs and a tight labor market causing
higher labor costs, we increased prices in the United States
for most product and service lines on average between 2%
and 12%. In January 2001, as a result of continued labor
shortages and increased labor and materials costs, we
increased prices in the United States on average between
5% and 12%. In July 2001, as a result of continuing
personnel and consumable material cost increases, we
increased prices on average between 6% and 15%.
The decreased rig activity in 2002 from 2001 in the United
States has increased pressure on the oilfield services
product service lines to discount prices. The price increases
we implemented last year have mostly been eroded by
additional discounts. Our pressure pumping product service
line has been significantly impacted by the current economic
slowdown due to its dependence on United States gas drilling.
Our deepwater activity has not been as adversely
impacted as land activity by the downturn in the energy
industry, due to the level of investment and the long-term
nature of contracts. Our drilling systems product service
line, which currently has a large percentage of its business
outside the United States and is currently heavily involved
in deepwater oil and gas exploration and development
drilling and longer term contracts, has remained relatively
strong despite the overall decline in the energy industry.
Our operations have also been impacted by political and
economic instability in Indonesia and in Latin America. In
Latin America, the impact was primarily in Argentina in
the earlier part of 2002 and then in Venezuela toward the
end of 2002, due to political unrest related to the national
strike. We also experienced disruptions due to Tropical
Storm Isidore and Hurricane Lili in the Gulf of Mexico.
Based upon data from Spears and Associates, drilling
activity in the United States and Canada in 2003 is expected
to increase compared to overall 2002 levels and compared
to the fourth quarter 2002. This reflects the current level of
oil and gas prices and tight supplies. International drilling
activity is expected to remain constant with fourth quarter
2002 levels.

2 0 0 2 H A L L I B U R T O N A N N U A L R E P O R T 36
At the end of 2002, two brokerage firms released
exploration and production expenditure surveys for 2003.
Salomon Smith Barney reported that worldwide exploration
and production spending is expected to increase 3.8% in
2003. North America spending was forecasted to rise 1.5%.
The report also noted that a lack of quality drilling
prospects and uncertainty over Iraq have also contributed
to a weaker initial spending forecast. Lehman Brothers
made similar predictions. They are projecting a 4.2%
increase in worldwide exploration and production
expenditures for 2003, but a slight decrease in United States
spending. Canadian exploration and production spending
is estimated to increase 7.2%. International exploration and
production expenditures are estimated to grow 5.5% in
2003, led by national oil companies and European majors.
According to the Lehman report, exploration and
production company budgets were based upon an average
oil price estimate of $23.22 per barrel (WTI) and $3.42 per
mcf for natural gas (Henry Hub).
Until economic and political uncertainties impacting
customer spending become clearer, we expect oilfield
services activity to be essentially flat in the short-term and
improve in the second half of 2003. The armed conflict in
the Middle East could disrupt our operations in the region
and elsewhere for the duration of the conflict. In the
longer-term, we expect increased global demand for oil and
natural gas, additional customer spending to replace
depleting reserves and our continued technological advances
to provide growth opportunities.
Eng ineer ing and Construct ion Group
Our engineering and construction projects are longer term
in nature than our energy services projects and are not
significantly impacted by short-term fluctuations in oil and
gas prices. We believe that the global economy’s recovery
is continuing, but its strength and sustainability are not
assured. Based on the uncertain economic recovery and
continuing excess capacity in petrochemical supplies,
customers have continued to delay project awards or reduce
the scope of projects involving hydrocarbons and
M A N A G E M E N T ’ S D I S C U S S I O N A N D A N A L Y S I S
manufacturing. A number of large-scale gas and liquefied
natural gas development, offshore deepwater, government
and infrastructure projects are being awarded or actively
considered. However, in light of terrorist threats, the armed
conflict and increasing instability in the Middle East and
the modest growth of the global economy, many customers
are delaying some of their capital commitments and
international investments.
We expect growth opportunities to exist for additional
security and defense support to government agencies in the
United States and other countries. Demand for these
services is expected to grow as a result of the armed conflict
in the Middle East and as governmental agencies seek to
control costs and promote efficiencies by outsourcing these
functions. We also expect growth due to new demands
created by increased efforts to combat terrorism and
enhance homeland security.
Engineering and construction contracts can be broadly
categorized as fixed-price, sometimes referred to as lump
sum, or cost reimbursable contracts. Some contracts can
involve both fixed-price and cost reimbursable elements.
Fixed-price contracts are for a fixed sum to cover all costs
and any profit element for a defined scope of work. Fixed-
price contracts entail more risk to us as we must pre-
determine both the quantities of work to be performed and
the costs associated with executing the work. The risks to us
arise, among other things, from:
• having to judge the technical aspects and effort involvedto accomplish the work within the contract schedule;
• labor availability and productivity; and
• supplier and subcontractor pricing and performance.
Fixed-price engineering, procurement and construction and
fixed-price engineering, procurement, installation and
commissioning contracts involve even greater risks including:
• bidding a fixed-price and completion date before detailedengineering work has been performed;
• bidding a fixed-price and completion date before lockingin price and delivery of significant procurement
M A N A G E M E N T ’ S D I S C U S S I O N A N D A N A L Y S I S
372 0 0 2 H A L L I B U R T O N A N N U A L R E P O R T
components (often items which are specifically designedand fabricated for the project);
• bidding a fixed-price and completion date beforefinalizing subcontractors terms and conditions;
• subcontractors individual performance and combinedinterdependencies of multiple subcontractors (themajority of all construction and installation work isperformed by subcontractors);
• contracts covering long periods of time;
• contract values generally for large amounts; and
• contracts containing significant liquidated damagesprovisions.
Cost reimbursable contracts include contracts where the
price is variable based upon actual costs incurred for time
and materials, or for variable quantities of work priced at
defined unit rates. Profit elements on cost reimbursable
contracts may be based upon a percentage of costs incurred
and/or a fixed amount. Cost reimbursable contracts are
generally less risky, since the owner retains many of the
risks. While fixed-price contracts involve greater risk,
they also potentially are more profitable for the contractor,
since the owner pays a premium to transfer many risks to
the contractor.
After careful consideration, we have decided no longer to
pursue riskier fixed-price engineering, procurement,
installation and commissioning contracts for the offshore
oil and gas industry. An important aspect of our 2002
reorganization was to look closely at each of our businesses
to ensure that they are self-sufficient, including their use of
capital and liquidity. In that process, we found that the
engineering, procurement, installation and commissioning
offshore business was using a disproportionate share of our
bonding and letter of credit capacity relative to its profit
contribution. The risk/reward relationship in that segment
is no longer attractive to us. We provide a range of
engineering, fabrication and project management services to
the offshore industry, which we will continue to service
through a variety of other contracting forms. We have seven
fixed-price engineering, procurement, installation and
commissioning offshore projects underway and we are fully
committed to successful completion of these projects, several
of which are substantially complete. We plan to retain our
offshore engineering and services capabilities.
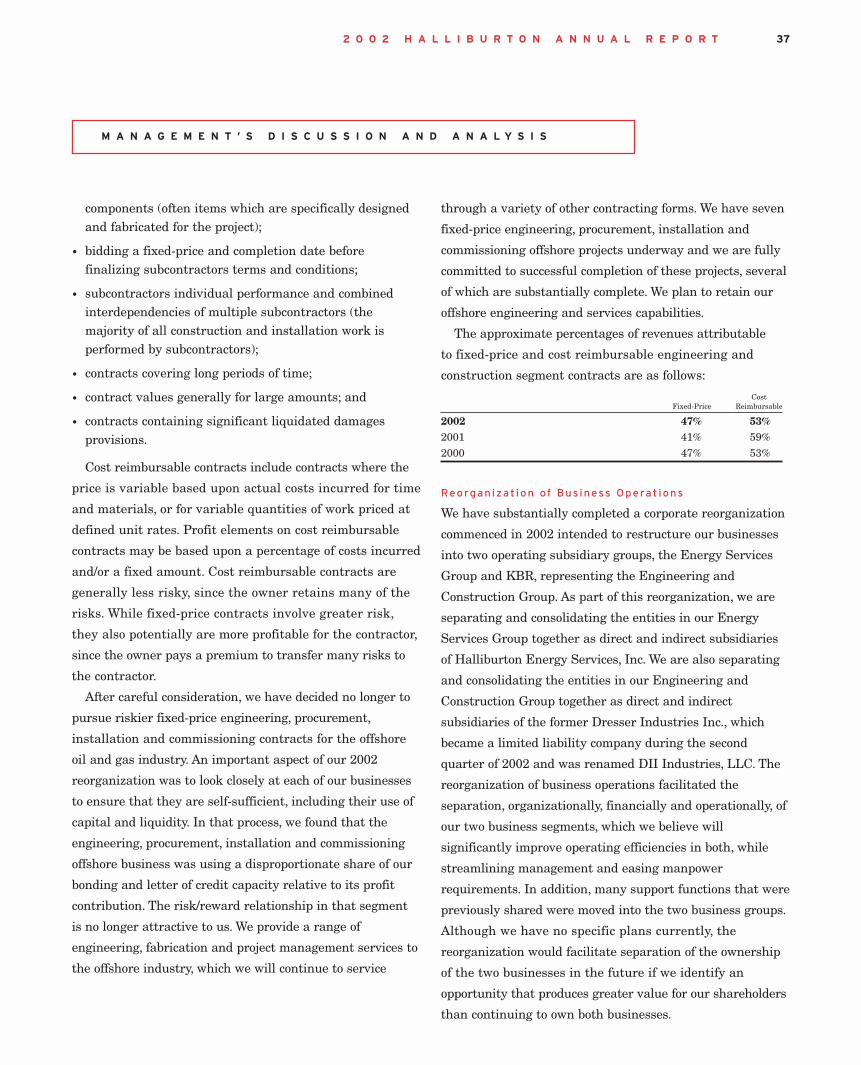
The approximate percentages of revenues attributable
to fixed-price and cost reimbursable engineering and
construction segment contracts are as follows:
CostFixed-Price Reimbursable
2002 47% 53%2001 41% 59% 2000 47% 53%
Reorgan izat ion of Bus iness Operat ions
We have substantially completed a corporate reorganization
commenced in 2002 intended to restructure our businesses
into two operating subsidiary groups, the Energy Services
Group and KBR, representing the Engineering and
Construction Group. As part of this reorganization, we are
separating and consolidating the entities in our Energy
Services Group together as direct and indirect subsidiaries
of Halliburton Energy Services, Inc. We are also separating
and consolidating the entities in our Engineering and
Construction Group together as direct and indirect
subsidiaries of the former Dresser Industries Inc., which
became a limited liability company during the second
quarter of 2002 and was renamed DII Industries, LLC. The
reorganization of business operations facilitated the
separation, organizationally, financially and operationally, of
our two business segments, which we believe will
significantly improve operating efficiencies in both, while
streamlining management and easing manpower
requirements. In addition, many support functions that were
previously shared were moved into the two business groups.
Although we have no specific plans currently, the
reorganization would facilitate separation of the ownership
of the two businesses in the future if we identify an
opportunity that produces greater value for our shareholders
than continuing to own both businesses.

2 0 0 2 H A L L I B U R T O N A N N U A L R E P O R T 38
We expect only a minimal amount of restructuring costs
to be incurred in 2003. In 2002, we incurred approximately
$107 million in restructuring charges consisting of
the following:
• $64 million in personnel related expense;
• $17 million of asset related write-downs;
• $20 million in professional fees related to therestructuring; and
• $6 million related to contract terminations.
We anticipate annualized cost savings of $200 million
compared to costs prior to the corporate reorganization.
As a part of the reorganization, we decided that the
operations of Major Projects, Granherne and Production
Services were better aligned with KBR in the current
business environment and these businesses were moved
from the Energy Services Group to the Engineering and
Construction Group during the second quarter of 2002. All
prior period segment results have been restated to reflect
this change. Major Projects, which currently consists of the
Barracuda-Caratinga project in Brazil, is now reported
through the Offshore operations product line, Granherne is
now reported in the Onshore operations product line, and
Production Services is now reported under the Operations
and Maintenance product line.
Asbestos and S i l i ca
On December 18, 2002, we announced that we had reached
an agreement in principle that, if and when consummated,
would result in a global settlement of all asbestos and silica
personal injury claims. The agreement in principle covers all
current and future personal injury asbestos claims against
DII Industries, Kellogg, Brown & Root and their current and
former subsidiaries, as well as all current silica claims
asserted presently or in the future. We revised our best
estimate of our asbestos and silica liability based on
information obtained while negotiating the agreement in
principle, and adjusted our asbestos and silica liability to
$3.425 billion, recorded additional probable insurance
M A N A G E M E N T ’ S D I S C U S S I O N A N D A N A L Y S I S
recoveries resulting in a total of $2.1 billion as of December
31, 2002 and recorded a net pretax charge of $799 million
($675 million after-tax) in the fourth quarter of 2002.
Should the proposed global settlement become probable
under Statement of Financial Accounting Standards No. 5,
we would adjust our accrual for probable and reasonably
estimable liabilities for current and future asbestos and
silica claims. The settlement amount initially would be up to
$4.0 billion, consisting of up to $2.775 billion in cash, 59.5
million Halliburton shares of common stock and notes with
a net present value expected to be less than $100 million.
Assuming the revised liability would be $4.0 billion, we
would also increase our probable insurance recoveries to
$2.3 billion. The impact on our income statement would be
an additional pretax charge of $322 million ($288 million
after-tax). This accrual (which values our stock to be
contributed at $1.1 billion using our stock price at December
31, 2002 of $18.71) would then be adjusted periodically
based on changes in the market price of our common stock
until the common stock was contributed to a trust for the
benefit of the claimants.
RESULTS OF OPERATIONS IN 2002
COMPARED TO 2001
REVENUES
Increase/ Millions of dollars 2002 2001 (Decrease)
Energy Services Group $ 6,836 $ 7,811 $(975) Engineering and Construction Group 5,736 5,235 501 Total revenues $12,572 $13,046 $(474)
Consolidated revenues for 2002 were $12.6 billion, a
decrease of 4% compared to 2001. International revenues
comprised 67% of total revenues in 2002 and 62% in 2001.
International revenues increased $298 million in 2002
partially offsetting a $772 million decline in the United States
where oilfield services drilling activity declined 28%,
putting pressure on pricing.
Energy Serv ices Group revenues declined 12%, or $975
million, in 2002 from 2001. International revenues were 60%
of total revenues for 2002 as compared to 54% for 2001.

M A N A G E M E N T ’ S D I S C U S S I O N A N D A N A L Y S I S
392 0 0 2 H A L L I B U R T O N A N N U A L R E P O R T
Revenues from our oilfield services product service lines
were $6.2 billion for 2002 compared to $6.8 billion for 2001.
The decline in revenue is attributable to lower levels of
activity in North America across all product service lines,
putting pressure on pricing of work in the United States.
The decrease in North America revenue was offset by 8%
higher international revenue. The change in revenues in
oilfield services is shown by product service line as follows:
• pressure pumping revenue declined 13% due to reducedrig counts and activity in North America, partially offsetby increased activity internationally in Algeria, Nigeria,Mexico, Brazil, Saudi Arabia, Oman, Egypt and China;
• logging revenue was down 13% due to lower NorthAmerican activity, partially offset by increased activity inNigeria, Mexico, Saudi Arabia and China;
• completion products revenue was down 10% due to lowerNorth American activity, partially offset by increasedactivity in the UK, Nigeria, Indonesia and Malaysia;
• drilling fluids revenue was down 10%, principally inNorth America, partially offset by increased sales inNigeria, Angola, Mexico, Saudi Arabia and Indonesia;
• drill bits revenue was down 12% principally due to lowerNorth American activity, partially offset by increasedsales in Algeria, UK, Angola, Mexico, Brazil, Saudi Arabiaand Indonesia; and
• drilling systems revenue was up 8% due to increasedactivity in Saudi Arabia, Thailand, Mexico, Braziland the United Arab Emirates, offset by lower NorthAmerican activity.
On a geographic basis, our oilfield services revenues were
as follows:
• North American revenue decreased 24% across all productservice lines due to lower rig activity;
• Latin American revenue decreased 8% primarily as aresult of decreases in Argentina due to currencydevaluation and in Venezuela due to lower activitybrought on by uncertain market and political conditionsand the national strike; and
• revenues increased in Europe/Africa, the Middle East,and Asia Pacific due to increased activity.
Revenues for the remainder of the segment decreased
$308 million year-over-year. We account for our 50%
ownership interest in Subsea 7, which began operations in
May 2002, on the equity method of accounting. Prior to
the formation of Subsea 7, the revenue of our subsea
operations was included in our consolidated results. Had it
not been for the change to the equity method of accounting
in connection with the transaction, revenues for the balance
of the segment would have decreased $79 million for 2002
as compared to 2001 due to lower subsea activity. Partially
offsetting the lower subsea activity, Landmark revenues
increased 12% compared to 2001 due to increased software
and professional services revenues.
Engineer ing and Construct ion Group revenues increased
$501 million, or 10%, in 2002 compared to 2001. Year-over-
year revenues were 10% higher in North America and 9%
higher outside North America. Our revenue comparison by
product line is as follows:
• Offshore revenues increased 26% due to progress on theBarracuda-Caratinga project in Brazil and the Belenakproject in Indonesia;
• Infrastructure revenues increased by 22% due toincreased progress on the Alice Springs to Darwin RailLine project in Australia and revenues fromEurope/Africa;
• Onshore revenues increased by 25% primarily due toprogress on several new projects in 2002 including gasand LNG projects in Algeria, Nigeria, Chad, Cameroonand Egypt;
• Government Operations revenues were 15% lower due tocompletion of a major project at our shipyard in theUnited Kingdom and lower volumes of logistical supportin the Balkans; and
• Operations and Maintenance revenue declined 3%primarily due to reduced downstream maintenance activity.

2 0 0 2 H A L L I B U R T O N A N N U A L R E P O R T 40
OPERATING INCOME
Increase/ Millions of dollars 2002 2001 (Decrease)
Energy Services Group $ 638 $1,036 $ (398) Engineering and Construction Group (685) 111 (796) General corporate (65) (63) (2) Operating income (loss) $(112) $1,084 $(1,196)
Consolidated operating loss was $112 million for 2002
compared to operating income of $1.1 billion in 2001. In
2002, our results of operations included:
• $107 million in pretax expense related to restructuringcharges, of which $64 million related to the EnergyServices Group, $18 million related to the Engineeringand Construction Group and $25 million related toGeneral corporate;
• $117 million pretax loss in the Engineering andConstruction Group on the Barracuda-Caratinga projectin Brazil;
• $564 million pretax expense in the Engineering andConstruction Group related to asbestos and silica liabilities;
• $79 million pretax loss in the Energy Services Groupon the sale of our 50% equity investment in the Bredero-Shaw joint venture;
• $108 million pretax gain in the Energy Services Groupon the sale of our 50% interest in European MarineContractors;
• $98 million pretax expense in the Energy Services Grouprelated to patent infringement litigation;
• $80 million pretax expense resulting from write-offof billed and accrued receivables related to the HighlandsInsurance Company litigation in the Engineeringand Construction Group, formerly reported in Generalcorporate; and
• $29 million pretax gain for the value of stock receivedfrom the demutualization of an insurance provider inGeneral corporate.
In 2002, we recorded no amortization of goodwill due to
the adoption of SFAS No. 142. For the year ended 2001, we
recorded $42 million in goodwill amortization, of which
$24 million related to the Energy Services Group and $18
million related to the Engineering and Construction Group.
M A N A G E M E N T ’ S D I S C U S S I O N A N D A N A L Y S I S
Energy Serv ices Group operating income for 2002
declined $398 million, or 38%, as compared to 2001.
Excluding a $79 million loss on the sale of our 50% interest
in the Bredero-Shaw joint venture, a $108 million gain on
the sale of our interest in European Marine Contractors, a
$98 million accrual related to the BJ Services litigation and
$64 million in restructuring charges in 2002, and goodwill
amortization of $24 million in 2001, operating income
declined 27%. On the same basis, operating margin for 2002
was 11% compared to 14% for 2001.
Operating income in our oilfield services product service
line declined $469 million or 46% compared to 2001.
Excluding the above-noted items, the decline was $323
million or 32%, reflecting lower rig activity primarily
in North America and net pretax losses of $51 million on
integrated solutions properties. The change in operating
income in oilfield services is detailed by product service line
as follows:
• pressure pumping operating income decreased 35%, asa result of reduced oil and gas drilling in North America,offset by increased international activity;
• our logging, drilling fluids and drill bits product serviceslines were also affected by the reduced oil and gasdrilling in North America with operating incomedeclining 64% in logging, 42% in drilling fluids and 30%in drill bits;
• our drilling systems product service line operating incomeincreased 19%, benefiting from improved internationalactivity; and
• our completion products and services product service linehad a 6% increase in operating income.
We also recorded impairments of $66 million on integrated
solutions properties primarily in the United States, Indonesia
and Colombia, net of gains of $45 million on disposals of
integrated solutions properties in the United States.
Operating income in the United States for our oilfield
services product service line decreased $459 million due to
lower activity levels and pricing pressures. International

M A N A G E M E N T ’ S D I S C U S S I O N A N D A N A L Y S I S
412 0 0 2 H A L L I B U R T O N A N N U A L R E P O R T
operating income decreased $10 million where losses on
integrated solutions properties of $37 million offset improved
operating results of Sperry-Sun, pressure pumping and
completion products and services.
Operating income for the remainder of the segment
increased $71 million in 2002 compared to 2001. Excluding
the $79 million loss on the sale of our 50% interest in the
Bredero-Shaw joint venture, a $108 million gain on the sale
of our interest in European Marine Contractors and $9
million in restructuring charges in 2002, and goodwill
amortization of $17 million in 2001, operating income for
the remainder of the segment increased $34 million due
to improved profitability in software sales and professional
services at Landmark and in our subsea operations.
Eng ineer ing and Construct ion Group operating income
declined by $796 million compared to 2001. Excluding the
$117 million loss on the Barracuda-Caratinga project in
Brazil, $644 million of expenses related to net asbestos
and silica liabilities, $18 million in restructuring costs,
goodwill amortization in 2001 of $18 million and asbestos
charges for 2001 of $11 million, operating income declined
$46 million. On the same basis, operating margin for 2002
was 2% as compared to 3% for 2001. Operating income in
Offshore operations decreased $40 million in 2002 compared
to 2001 primarily due to a $36 million loss on a project in
the Philippines. Operating income decreased in Onshore
operations by $30 million in 2002 compared to 2001 due to
lower results in the construction segment and completion of
a project in Algeria. Offsetting the declines was increased
operating income of $21 million in Infrastructure primarily
due to the Alice Springs to Darwin Rail Line project, and in
Government operations where operating income increased
$22 million due to improved results from projects in Asia
Pacific, Europe/Africa and in the Americas.
Recognizing income due to an increase in our total
probable unapproved claims during 2002 reduced reported
losses by approximately $158 million.
Genera l corporate expenses were $65 million for 2002
as compared to $63 million in 2001. Excluding restructuring
charges and gain from the value of stock received from
demutualization of an insurance provider, expenses would
have been $69 million.
NONOPERATING ITEMS
Interest expense of $113 million for 2002 decreased $34
million compared to 2001. The decrease is due to repayment
of debt and lower average borrowings in 2002, partially
offset by the $5 million in interest related to the patent
infringement judgment which we are appealing.
I n terest income was $32 million in 2002 compared to
$27 million in 2001. The increased interest income is for
interest on a note receivable from a customer which had
been deferred until collection.
Fore ign currency losses , net were $25 million in 2002
compared to $10 million in 2001. The increase is due to
negative developments in Brazil, Argentina and Venezuela.
Other, net was a loss of $10 million in 2002, which
includes a $9.1 million loss on the sale of ShawCor Ltd.
common stock acquired in the sale of our 50% interest in
Bredero-Shaw.
Prov is ion for income taxes was $80 million in 2002
compared to a provision for income taxes of $384 million in
2001. Exclusive of the tax effect on the asbestos and silica
accrual (net of insurance recoveries) and the loss on sale of
Bredero-Shaw, our 2002 effective tax rate from continuing
operations was 38.9% for 2002 compared to 40.3% in 2001.
The asbestos and silica accrual generates a United States
Federal deferred tax asset which was not fully benefited
because we anticipate that a portion of the asbestos and silica
deduction will displace foreign tax credits and those
credits will expire unutilized. As a result, we have recorded a
$114 million valuation allowance in continuing operations
and $119 million in discontinued operations associated with
the asbestos and silica accrual, net of insurance recoveries.
In addition, continuing operations has recorded a valuation
allowance of $49 million related to potential excess foreign

2 0 0 2 H A L L I B U R T O N A N N U A L R E P O R T 42
tax credit carryovers. Further, our impairment loss on
Bredero-Shaw cannot be fully benefited for tax purposes due
to book and tax basis differences in that investment and the
limited benefit generated by a capital loss carryback.
Settlement of unrealized prior period tax exposures had a
favorable impact to the overall tax rate.
Minor i ty in terest in net income of subs id ia r ies in
2002 was $38 million as compared to $19 million in 2001.
The increase was primarily due to increased activity in
Devonport Management Limited.
Loss f rom cont inu ing operat ions was $346 million in
2002 compared to income from continuing operations of
$551 million in 2001.
Loss f rom d iscont inued operat ions was $806 million
pretax, $652 million after-tax, or $1.51 per diluted share in
2002 compared to a loss of $62 million pretax, $42 million
after-tax, or $0.10 per diluted share in 2001. The loss in
2002 was due primarily to charges recorded for asbestos
and silica liabilities. The pretax loss for 2001 represents
operating income of $37 million from Dresser Equipment
Group through March 31, 2001 offset by a $99 million pretax
asbestos accrual primarily related to Harbison-Walker.
Ga in on d i sposa l of d i scont inued operat ions of
$299 million after-tax, or $0.70 per diluted share, in 2001
resulted from the sale of our remaining businesses in the
Dresser Equipment Group in April 2001.
Cumulat ive e f fect of account ing change, net in 2001
of $1 million reflects the impact of adoption of Statement of
Financial Accounting Standards No. 133, “Accounting for
Derivative Instruments and for Hedging Activities.” After
recording the cumulative effect of the change our estimated
annual expense under Financial Accounting Standards
No. 133 is not expected to be materially different from
amounts expensed under the prior accounting treatment.
Net loss for 2002 was $998 million, or $2.31 per diluted
share. Net income for 2001 was $809 million, or $1.88 per
diluted share.
M A N A G E M E N T ’ S D I S C U S S I O N A N D A N A L Y S I S
RESULTS OF OPERATIONS IN 2001
COMPARED TO 2000
REVENUES
Increase/ Millions of dollars 2001 2000 (Decrease)
Energy Services Group $ 7,811 $ 6,233 $1,578Engineering and Construction Group 5,235 5,711 (476)Total revenues $13,046 $11,944 $1,102
Consolidated revenues for 2001 were $13.0 billion, an
increase of 9% compared to 2000. International revenues
comprised 62% of total revenues in 2001 and 66% in 2000 as
activity and pricing increased in our Energy Services Group
more rapidly in the United States and internationally
particularly in the first half of 2001. Our Engineering and
Construction Group revenues, which did not benefit from
the positive factors contributing to the growth of the Energy
Services Group, decreased 8%. Engineering and construction
projects are long-term in nature and customers continued
to delay major projects with the slowdown in the economy
occurring in the latter part of 2001.
Energy Serv ices Group revenues increased by $1.6
billion, or 25%, in 2001 from 2000. International revenues
were 54% of the total segment revenues in 2001 compared
to 59% in 2000. Revenues in 2001 from our oilfield services
product service lines were $6.8 billion. Our oilfield services
product service lines experienced revenue growth of 29%
despite a 14% decline in oil prices and a 3% decrease in
natural gas prices between December 2000 and December
2001. The revenue increase was primarily due to higher
drilling activity, as measured by the annual average oil and
gas rig counts, and pricing improvements, particularly in the
United States. Revenues increased across all product
service lines in 2001 compared to 2000 as follows:
• pressure pumping product service lines experiencedgrowth of 34% in 2001;
• logging, drilling services and drilling fluids revenuesincreased approximately 28%;
• drill bit revenues were 19% higher in 2001; and
• completion products revenues increased 13%.

M A N A G E M E N T ’ S D I S C U S S I O N A N D A N A L Y S I S
432 0 0 2 H A L L I B U R T O N A N N U A L R E P O R T
Logging and drilling services revenues increases occurred
primarily in the United States, as the product service lines
benefited from higher prices and increased drilling activity.
Geo-PilotTM and other new products introduced in the drilling
services product service line improved revenue in 2001 by
approximately $50 million. We design and assemble the
Geo-PilotTM tool from parts manufactured to our specifications
by third parties. Drilling fluid revenues increased in 2001
with higher activity levels in the Gulf of Mexico.
Geographically, all regions within the oilfield services
product service lines prospered with North America
revenues increasing 37% from 2000 to 2001 as follows:
• pressure pumping revenues in North America were48% higher in 2001 primarily due to higher levels ofdrilling activity;
• revenues from Latin America increased 27% withsignificant increases in Venezuela and Brazil; and
• Europe/Africa and Middle East revenues were about 20%higher in 2001 than 2000, arising primarily in Russiaand Egypt.
Revenues for the remainder of the segment of $980 million
increased by $58 million, or 6%, primarily due to Landmark.
Landmark revenues were higher by 19% partially due to the
acquisition of PGS Data Management as well as growth in
software sales and professional services.
Engineer ing and Construct ion Group revenues decreased
$476 million, or 8%, from 2000 to 2001. The decline was
primarily due to the completion of several large international
onshore and offshore projects which had not yet been fully
replaced with new project awards and delays in the awards
of new projects. International revenues were approximately
75% in 2001 as compared to 73% in 2000. Revenues for the
Asia/Pacific region were down nearly 40% due to the effects
of completing two major projects, partially offset by a new
liquefied natural gas project and the start-up of construction
on the Alice Springs to Darwin Rail Line project. In
Europe/Africa, revenues were down 6%. The decline was
primarily due to the completion of a major project in
Norway and lower activity on the logistical support contract
in the Balkans which moved to the sustainment phase,
which involved providing support at the facilities which were
constructed during the initial phase of the contract. The
decline was partially offset by increases in activities at our
shipyard in the United Kingdom of approximately $67
million which related to a contract with the United Kingdom
Ministry of Defense. North American revenues declined in
2001 partially due to the completion of highway and paving
construction jobs and the baseball stadium in Houston.
These declines in North America were partially offset by a
slight increase in operations and maintenance revenues
as our customers focused on maintaining current facilities
and plant operations rather than adding new facilities.
These declines were partially offset by increases in revenue
in Latin America due to the Barracuda-Caratinga project
in Brazil which began in the third quarter of 2000.
OPERATING INCOME
Increase/ Millions of dollars 2001 2000 (Decrease)
Energy Services Group $1,036 $589 $447 Engineering and Construction Group 111 (54) 165 General corporate (63) (73) 10 Operating income $1,084 $462 $622
Consolidated operating income increased $622 million, or
135%, from 2000 to 2001. In 2000 our results of operations
include two significant items: an $88 million pretax gain on
the sale of marine vessels and a pretax charge of $36 million
related to the restructuring of the engineering and
construction businesses. Excluding these items, operating
income increased by more than 160%.
Energy Serv ices Group operating income increased $447
million, or 76%, in 2001 over 2000. Excluding the sale of
marine vessels, operating income increased more than 100%
compared to 2000. Increased operating income reflects
increased activity levels, higher equipment utilization and
improved pricing, particularly in the United States in the
first nine months of 2001. Our oilfield services product
2 0 0 2 H A L L I B U R T O N A N N U A L R E P O R T 44
service lines operating income in 2001 exceeded $1 billion,
more than double from 2000. Operating margins for our
oilfield services product service lines increased from 8.6% in
2000 to 14.8% in 2001, resulting in an incremental margin
of 37%. Incremental margins are calculated by taking the
change in operating income over the applicable periods and
dividing by the change in revenues over the same period.
Operating income was higher in 2001 as compared to 2000
in all product service lines and geographic regions. The
largest increase was in pressure pumping in North America,
which rose by over 130%. Substantial increases in operating
income were also made in the logging, drill bits and drilling
services product service lines. Operating income in North
America was higher by 72% in 2001 as compared to 2000.
International regions, particularly Latin America and
Europe/Africa, made significant improvements in operating
income. Excluding the sale of marine vessels in 2000,
operating income for the remainder of the segment decreased
$27 million, primarily due to lower operating margins in
our Surface/Subsea product service line.
Eng ineer ing and Construct ion Group operating income
increased $165 million from 2000 to 2001. Operating
margins improved to 2.1% in 2001. This increase was
primarily due to the $167 million recorded in the fourth
quarter of 2000 as a result of higher than estimated costs on
specific jobs and unfavorable claims negotiations on other
jobs. We also recorded a restructuring charge of $36 million
in the fourth quarter of 2000 related to the reorganization of
the engineering and construction businesses under Kellogg,
Brown & Root. Excluding these fourth quarter 2000
charges, operating income decreased $38 million, or 26%,
consistent with the decline in revenues and due to a revised
profit estimate on the Barracuda-Caratinga project.
Genera l corporate expenses were $63 million for 2001
as compared to $73 million in 2000. In 2000 general corporate
expenses included $9 million of costs related to the early
retirement of our previous chairman and chief executive
officer, which was recorded in the third quarter of 2000.
M A N A G E M E N T ’ S D I S C U S S I O N A N D A N A L Y S I S
NONOPERATING ITEMS
Interest expense of $147 million in 2001 was $1 million
higher than in 2000. Our outstanding short-term debt
was substantially higher in the first part of 2001 due to
repurchases of our common stock in the fourth quarter of
2000 under our repurchase program and borrowings
associated with the acquisition of PGS Data Management
in March 2001. Cash proceeds of $1.27 billion received in
April 2001 from the sale of the remaining businesses within
the Dresser Equipment Group were used to repay our
short-term borrowings; however, our average borrowings for
2001 were slightly higher than in 2000. The impact of
higher average borrowings was mostly offset by lower interest
rates on short-term borrowings.
I n terest income was $27 million in 2001, an increase of
$2 million from 2000.
Fore ign currency losses , net were $10 million in 2001
as compared to $5 million in 2000. Argentina’s financial
crisis accounted for $4 million of the $5 million increase.
Other, net was a loss of $1 million in 2000 and less than
a $1 million gain in 2001.
Prov is ion for income taxes was $384 million for
an effective tax rate of 40.3% in 2001 compared to 38.5%
in 2000.
Minor i ty in terest in net income of subs id ia r ies in
2001 was $19 million as compared to $18 million in 2000.
I n c o m e ( l o s s) f ro m d i s c o n t i n u e d o p e ra t i o n s in 2001
was a $42 million loss, or $0.10 per diluted share, due to
accrued expenses associated with asbestos claims of
disposed businesses. See Note 3. The loss was partially offset
by net income for the first quarter of 2001 from Dresser
Equipment Group of $0.05 per diluted share. Income from
discontinued operations of $98 million, or $0.22 per diluted
share, represents the net income of Dresser Equipment
Group for the full year of 2000.
Ga in on d i sposa l of d i scont inued operat ions in
2001 was $299 million after-tax, or $0.70 per diluted share.
The 2001 gain resulted from the sale of our remaining
businesses within the Dresser Equipment Group in April
M A N A G E M E N T ’ S D I S C U S S I O N A N D A N A L Y S I S
452 0 0 2 H A L L I B U R T O N A N N U A L R E P O R T
2001. The gain of $215 million after-tax, or $0.48 per diluted
share, in 2000 resulted from the sale of our 51% interest in
Dresser-Rand, formerly a part of Dresser Equipment Group,
in January 2000.
C u m u l a t i v e e f f e c t o f a c c o u n t i n g c h a n g e , n e t of
$1 million reflects the adoption of SFAS No. 133 “Accounting
for Derivative Instruments and Hedging Activities” in the
first quarter of 2001.
Net income for 2001 was $809 million, or $1.88 per
diluted share, as compared to net income of $501 million, or
$1.12 per diluted share in 2000.
LIQUIDITY AND CAPITAL RESOURCES
We ended 2002 with cash and cash equivalents of $1.1 billion
compared with $290 million at the end of 2001 and $231
million at the end of 2000.
C a s h f l o w s f ro m o p e ra t i n g a c t i v i t i e s provided $1.6
billion for 2002 compared to providing $1.0 billion in 2001
and using $57 million in 2000. The net loss in 2002 was due
to an after-tax asbestos and silica charge of $1.1 billion
which has no effect on 2002 cash flows. Some factors which
accounted for cash flows from operations for 2002 were
as follows:
• we collected large milestone payments on several long-term contracts;
• we collected several large receivables during 2002 in ourEnergy Services Group;
• we sold an undivided ownership interest to unaffiliatedcompanies under the accounts receivable securitizationagreement for a net cash inflow of $180 million (see Note 6to the financial statements); and
• we managed inventory at lower levels during 2002.
Cash f lows f rom invest ing act iv i t i es used $473 million
for 2002, $858 million for 2001 and $411 million for 2000.
Capital expenditures of $764 million in 2002 were about 4%
lower than in 2001 and about 32% higher than in 2000.
Capital spending in 2002 continued to be primarily directed
to Halliburton Energy Services, for fracturing equipment and
directional and logging-while-drilling equipment. In
addition, we invested $60 million in an integrated solutions
project. Included in sales of property, plant and equipment
is $130 million collected from the sale of integrated solutions
properties and cash collected from other asset sales.
Dispositions of businesses in 2002 include $134 million
collected from the sale of our European Marine Contractors
Ltd. joint venture. Proceeds from the sale of securities of
$62 million was for the sale of ShawCor shares. Included in
the restricted cash balance for 2002 are the following:
• $107 million deposit that collateralizes a bond fora patent infringement judgment and interest, whichjudgment is on appeal;
• $57 million as collateral for potential future insuranceclaim reimbursements; and
• $26 million primarily related to cash collateralagreements for outstanding letters of credit for severalconstruction projects.
In March 2001, we acquired the PGS Data Management
division of Petroleum Geo-Services ASA for $164 million
cash. In addition we spent $56 million for various other
acquisitions in 2001.
Cash f lows f rom f inanc ing act iv i t i es used $248 million
in 2002, $1.4 billion in 2001 and $584 million in 2000.
Proceeds from exercises of stock options provided cash flows
of less than $1 million in 2002, $27 million in 2001 and
$105 million in 2000. We paid dividends of $219 million to
our shareholders in 2002, $215 million in 2001 and $221
million in 2000.
Included in payments on long-term borrowings of $81
million in 2002 is a repayment of a $75 million medium-
term note. In the fourth quarter of 2002, our 51% owned
and consolidated subsidiary, Devonport Management
Limited, signed an agreement for a credit facility of £80
million ($126 million as of December 31, 2002) maturing
in September 2009. Devonport Management Limited drew
down $66 million from this facility in the fourth quarter.

2 0 0 2 H A L L I B U R T O N A N N U A L R E P O R T 46
Proceeds from the sale of the remaining businesses in
Dresser Equipment Group in April 2001, the sale of Dresser-
Rand in early 2000 and the collection of a note from the
fourth quarter 1999 sale of Ingersoll-Dresser Pump received
in early 2000 were used to reduce short-term debt. On July
12, 2001, we issued $425 million in two and five year
medium-term notes under our medium-term note program.
The notes consist of $275 million of 6% fixed rate notes due
August 1, 2006 and $150 million of floating rate notes due
July 16, 2003. Net proceeds from the two medium-term note
offerings were also used to reduce short-term debt. Net
repayments of short-term debt in 2001 used $1.5 billion.
On April 25, 2000, our Board of Directors approved plans
to implement a share repurchase program for up to 44
million shares. We repurchased 1.2 million shares at a cost
of $25 million in 2001 and 20.4 million shares at a cost of
$759 million in 2000. We currently have no plan to
repurchase the remaining shares under the approved plan.
In addition, we repurchased $4 million of common stock in
2002, $9 million in 2001 and $10 million in 2000 from
employees to settle their income tax liabilities primarily for
restricted stock lapses.
Ca s h f l ows f ro m d i s co n t i n u e d o p e ra t i o n s provided
$1.3 billion in 2001 and $826 million in 2000. No cash flows
from discontinued operations were provided in 2002. Cash
flows for 2001 included proceeds from the sale of Dresser
Equipment Group of approximately $1.27 billion. Cash
flows for 2000 include proceeds from the sale of Dresser-
Rand and Ingersoll-Dresser Pump of $913 million.
Cap i ta l resources from internally generated funds and
access to capital markets are sufficient to fund our working
capital requirements and investing activities. Our combined
short-term notes payable and long-term debt was 30% of
total capitalization at the end of 2002, 24% at the end of
2001, and 40% at the end of 2000. Short-term debt was
reduced significantly in the second quarter of 2001 with the
proceeds from the sale of Dresser Equipment Group and in
the third quarter from the issuance of $425 million of
medium-term notes. In 2000 we reduced our short-term debt
M A N A G E M E N T ’ S D I S C U S S I O N A N D A N A L Y S I S
with proceeds from the sales of Ingersoll-Dresser Pump and
Dresser-Rand joint ventures early in the year. We increased
short-term debt in the third quarter of 2000 to fund share
repurchases. At December 31, 2002, we had $190 million in
restricted cash included in “Other assets.” See Note 5 to the
financial statements. In addition on April 15, 2002, we
entered into an agreement to sell accounts receivable to
provide additional liquidity. See Note 6 to the financial
statements. Currently, we expect capital expenditures in
2003 to be about $700 million. We have not finalized our
capital expenditures budget for 2004 or later periods.
P ro p o s e d g l o b a l s e t t l e m e n t . On December 18, 2002,
we announced that we had reached an agreement in principle
that, if and when consummated, would result in a global
settlement of all asbestos and silica personal injury claims
against DII Industries, Kellogg, Brown & Root and their
current and former subsidiaries. The agreement in principle
provides that:
• up to $2.775 billion in cash, 59.5 million Halliburtonshares (valued at $1.1 billion using the stock price atDecember 31, 2002 of $18.71) and notes with a netpresent value expected to be less than $100 million willbe paid to a trust for the benefit of current and futureasbestos personal injury claimants and current silicapersonal injury claimants upon receiving final and non-appealable court confirmation of a plan of reorganization;
• DII Industries and Kellogg, Brown & Root will retainrights to the first $2.3 billion of any insurance proceedswith any proceeds received between $2.3 billion and $3.0billion going to the trust;
• the agreement is to be implemented through a pre-packaged Chapter 11 filing for DII Industries andKellogg, Brown & Root, and some of their subsidiaries; and
• the funding of the settlement amounts would occur uponreceiving final and non-appealable court confirmationof a plan of reorganization of DII Industries and Kellogg,Brown & Root and their subsidiaries in the Chapter 11proceeding.
Subsequently, as of March 2003, DII Industries and
Kellogg, Brown & Root have entered into definitive written

M A N A G E M E N T ’ S D I S C U S S I O N A N D A N A L Y S I S
472 0 0 2 H A L L I B U R T O N A N N U A L R E P O R T
agreements finalizing the terms of the agreement in
principle. The proposed global settlement also includes silica
claims as a result of current or past exposure. These silica
claims are less than 1% of the personal injury claims included
in the proposed global settlement. We have approximately
2,500 open silica claims.
Among the prerequisites for reaching a conclusion of the
settlement are:• agreement on the amounts to be contributed to the trust
for the benefit of silica claimants;
• our review of the more than 347,000 current claims toestablish that the claimed injuries are based on exposureto products of DII Industries, Kellogg, Brown & Root,their subsidiaries or former businesses or subsidiaries;
• completion of our medical review of the injuries allegedto have been sustained by plaintiffs to establish a medicalbasis for payment of settlement amounts;
• finalizing the principal amount of the notes to becontributed to the trust;
• agreement with a proposed representative of futureclaimants and attorneys representing current claimantson procedures for distribution of settlement funds toindividuals claiming personal injury;
• definitive agreement with the attorneys representingcurrent asbestos claimants and a proposed representativeof future claimants on a plan of reorganization for theChapter 11 filings of DII Industries, Kellogg, Brown &Root and some of their subsidiaries; and agreement withthe attorneys representing current asbestos claimantswith respect to, and completion and mailing of, adisclosure statement explaining the pre-packaged plan ofreorganization to the more than 347,000 current claimants;
• arrangement of financing on terms acceptable to us tofund the cash amounts to be paid in the settlement;
• Halliburton board approval;
• obtaining affirmative votes to the plan of reorganizationfrom at least the required 75% of known present asbestosclaimants and from a requisite number of silica claimantsneeded to complete the plan of reorganization; and
• obtaining final and non-appealable bankruptcy courtapproval and federal district court confirmation of theplan of reorganization.
Many of these prerequisites are subject to matters and
uncertainties beyond our control. There can be no assurance
that we will be able to satisfy the prerequisites for
completion of the settlement. If we were unable to complete
the proposed settlement, we would be required to resolve
current and future asbestos claims in the tort system or, in
the case of Harbison-Walker claims (see Note 12 to the
financial statements), possibly through the Harbison-Walker
bankruptcy proceedings.
The template settlement agreement with attorneys
representing current claimants grants the attorneys a right
to terminate the definitive settlement agreement on ten
days’ notice if DII Industries does not file a plan of
reorganization on or before April 1, 2003. We are conducting
due diligence on the asbestos claims, which is not expected
to be completed by April 1, 2003. Therefore, we do not
expect DII Industries to file a plan of reorganization prior to
April 1. Although there can be no assurances, we do not
believe the claimants’ attorneys will terminate the
settlement agreements on April 1, 2003 as long as adequate
progress is being made toward a Chapter 11 filing.
We have begun our due diligence review of current
asbestos claims. While these results are preliminary and
not necessarily indicative of the eventual results of a
completed review of all current asbestos claims, it appears
that a substantial portion of the records for claims reviewed
to date do not provide detailed product identification. We
expect that many of these records could be supplemented
by attorneys representing the claimants to provide
additional information on product identification. However,
no assurance can be given that the additional product
identification documentation will be timely provided or
sufficient for us or the plaintiffs to proceed with the proposed
global settlement. In addition, although the medical
information in the files we preliminarily reviewed appears

2 0 0 2 H A L L I B U R T O N A N N U A L R E P O R T 48
significantly more complete, if a material number of claims
ultimately do not meet the medical criteria for alleged
injuries, no assurance can be given that a sufficient number
of plaintiffs would vote to ratify the plan of reorganization
that would implement the global settlement. In such case,
we would not proceed with a Chapter 11 filing.
In March 2003, we agreed with Harbison-Walker and
the asbestos creditors committee in the Harbison-Walker
bankruptcy to consensually extend the period of the stay
contained in the Bankruptcy Court’s temporary restraining
order until July 21, 2003. The court’s temporary restraining
order, which was originally entered on February 14, 2002,
stays more than 200,000 pending asbestos claims against
DII Industries. The agreement provides that if the pre-
packaged Chapter 11 filing by DII Industries, Kellogg, Brown
& Root and their subsidiaries is not made by July 14, 2003,
the Bankruptcy Court will hear motions to lift the stay on
July 21, 2003. The asbestos creditors committee also
reserves the right to monitor progress toward the filing of
the Chapter 11 proceeding and seek an earlier hearing
to lift the stay if satisfactory progress toward the Chapter 11
filing is not being made.
Of the up to $2.775 billion cash amount included as part
of the proposed global settlement, approximately $450
million primarily relates to claims previously settled but
unpaid by Harbison-Walker (see Note 12 to the financial
statements), but not previously agreed to by us. As part of
the proposed settlement, we have agreed that, if a Chapter
11 filing by DII Industries, Kellogg, Brown & Root and
their subsidiaries were to occur, we would pay this amount
within four years if not paid sooner pursuant to a final
bankruptcy court approved plan of reorganization for DII
Industries, Kellogg, Brown & Root and their subsidiaries.
Effective November 30, 2002, we are making cash
payments in lieu of interest at a rate of 5% per annum to
the holders of these claims. These cash payments in lieu
of interest are being made in arrears at the end of February,
M A N A G E M E N T ’ S D I S C U S S I O N A N D A N A L Y S I S
May, August and November, beginning after certain
conditions are met, until the earlier of the date that the
$450 million is paid or the date the proposed settlement is
abandoned.
Proposed bankruptcy of D I I I ndust r ies , Ke l logg ,
Brown & Root and subs id ia r ies . Under the terms of the
proposed global settlement, the settlement would be
implemented through a pre-packaged Chapter 11 filing for
DII Industries, Kellogg, Brown & Root and some of their
subsidiaries. Other than those debtors, none of the
subsidiaries of Halliburton (including Halliburton Energy
Services) or Halliburton itself will be a debtor in the
Chapter 11 proceedings. We anticipate that Halliburton,
Halliburton Energy Services and each of the debtors’ non-
debtor affiliates will continue normal operations and
continue to fulfill all of their respective obligations in the
ordinary course as they become due.
As part of any proposed plan of reorganization, the
debtors intend to seek approval of the bankruptcy court
for debtor-in-possession financing to provide for operating
needs and to provide additional liquidity during the
pendency of the Chapter 11 proceeding. We currently are
negotiating with several banks and non-bank lenders
over the terms of such facility. See “ – Financing the
proposed settlement”. Obtaining a commitment for debtor-
in-possession financing is a condition precedent to the filing
of any Chapter 11 proceeding.
Any plan of reorganization will provide that all of the
debtors’ obligations under letters of credit, surety bonds,
corporate guaranties and indemnity agreements (except for
agreements relating to asbestos claims or silica claims) will
be unimpaired. In addition, the Bankruptcy Code allows a
debtor to assume most executory contracts without regard to
bankruptcy default provisions, and it is the intention of
DII Industries, Kellogg, Brown & Root and the other filing
entities to assume and continue to perform all such
executory contracts. Representatives of DII Industries,
Kellogg, Brown & Root and their subsidiaries have advised
their customers of this intention.

M A N A G E M E N T ’ S D I S C U S S I O N A N D A N A L Y S I S
492 0 0 2 H A L L I B U R T O N A N N U A L R E P O R T
After filing any Chapter 11 proceeding, the debtors would
seek an order of the bankruptcy court scheduling a hearing
to consider confirmation of the plan of reorganization. In
order to be confirmed, the Bankruptcy Code requires that an
impaired class of creditors vote to accept the plan of
reorganization submitted by the debtors. In order to carry a
class, approval of over one-half in number and at least
two-thirds in amount are required. In addition, to obtain an
injunction under Section 524(g) of the Bankruptcy Code, at
least 75% of current asbestos claimants must vote to accept
the plan of reorganization. In addition to obtaining the
required votes, the requirements for a bankruptcy court to
approve a plan of reorganization include, among other
judicial findings, that:
• the plan of reorganization complies with applicableprovisions of the Bankruptcy Code;
• the debtors have complied with the applicable provisionsof the Bankruptcy Code;
• the trust will value and pay similar present and futureclaims in substantially the same manner;
• the plan of reorganization has been proposed in good faithand not by any means forbidden by law; and
• any payment made or promised by the debtors to anyperson for services, costs or expenses in or inconnection with the Chapter 11 proceeding or the planof reorganization has been or is reasonable.
Section 524(g) of the Bankruptcy Code authorizes the
bankruptcy court to enjoin entities from taking action to
collect, recover or receive payment or recovery with respect
to any asbestos claim or demand that is to be paid in whole
or in part by a trust created by a plan of reorganization that
satisfies the requirements of the Bankruptcy Code. Section
105 of the Bankruptcy Code authorizes a similar injunction
for silica claims. The injunction also may bar any action
based on such claims or demands against the debtors that
are directed at third parties. The order confirming the plan
must be issued or affirmed by the federal district court
that has jurisdiction over the case. After the expiration of the
time for appeal of the order, the injunction becomes valid
and enforceable.
The debtors believe that, if they proceed with a Chapter
11 filing, they will be able to satisfy all the requirements
of Section 524(g), so long as the requisite number of holders
of asbestos claims vote in favor of the plan of reorganization.
If the 524(g) and 105 injunctions are issued, all unsettled
current asbestos claims, all future asbestos claims and all
silica claims based on exposure that has already occurred
will be channeled to a trust for payment, and the debtors
and related parties (including Halliburton, Halliburton
Energy Services and other subsidiaries and affiliates of
Halliburton and the debtors) will be released from any
further liability under the plan of reorganization.
A prolonged Chapter 11 proceeding could adversely affect
the debtor’s relationships with customers, suppliers and
employees, which in turn could adversely affect the debtors’
competitive position, financial condition and results of
operations. A weakening of the debtors’ financial condition
and results of operations could adversely affect the debtors’
ability to implement the plan of reorganization.
F i n a n c i n g t h e p ro p o s e d s e t t l e m e n t . The plan of
reorganization through which the proposed settlement will
be implemented will require us to contribute up to $2.775
billion in cash to the Section 524(g)/105 trust established for
the benefit of claimants, which we will need to finance on
terms acceptable to us. We are pursuing a number of
financing alternatives for the cash amount to be contributed
to the trust. The availability of these alternatives depend in
large part on market conditions. We are currently negotiating
with several banks and non-bank lenders over the terms of
multiple credit facilities. A proposed banking syndicate is
currently performing due diligence in an effort to make a
funding commitment before the bankruptcy filing. We will
not proceed with the Chapter 11 filing for DII Industries,
Kellogg, Brown & Root and some of their subsidiaries until
financing commitments are in place.

2 0 0 2 H A L L I B U R T O N A N N U A L R E P O R T 50
The anticipated credit facilities include:
• debtor-in-possession financing to provide for theoperating needs of the filing entities;
• a revolving line of credit for general working capitalpurposes;
• a master letter of credit facility intended to ensure thatexisting letters of credit supporting our contracts remainin place during the filing; and
• a delayed-draw term facility to be available for funding ofup to $2.775 billion to the trust for the benefit of claimants.
The delayed-draw term facility is intended to eliminate
uncertainty the capital markets might have concerning our
ability to meet our funding requirement once final and non-
appealable court confirmation of a plan of reorganization
has been obtained.
None of these credit facilities are currently in place, and
there can be no assurances that we will complete these
facilities. We are not obligated to enter into these facilities if
the terms are not acceptable to us. Moreover, these facilities
would only be available for limited periods of time. As a
result, if we were delayed in filing the Chapter 11 proceeding
or delayed in completing the plan of reorganization after a
Chapter 11 filing, the credit facilities may expire and no
longer be available. In such circumstances, we would have
to terminate the proposed settlement if replacement financing
were not available on acceptable terms.
We have sufficient authorized and unrestricted shares
to issue 59.5 million shares to the trust. No shareholder
approval is required for issuance of the shares.
Cred i t ra t ings . Late in 2001 and early in 2002, Moody’s
Investors’ Services lowered its ratings of our long-term senior
unsecured debt to Baa2 and our short-term credit and
commercial paper ratings to P-2. In addition, Standard &
Poor’s lowered its ratings of our long-term senior unsecured
debt to A- and our short-term credit and commercial paper
ratings to A-2 in late 2001. In December 2002, Standard &
Poor’s lowered these ratings to BBB and A-3. These ratings
were lowered primarily due to our asbestos exposure, and
both agencies have indicated that the ratings continue
M A N A G E M E N T ’ S D I S C U S S I O N A N D A N A L Y S I S
under consideration for possible downgrade pending the
results of the proposed global settlement. Although our
long-term ratings continue at investment grade levels, the
cost of new borrowing is higher and our access to the debt
markets is more volatile at the new rating levels.
Investment grade ratings are BBB- or higher for Standard
& Poor’s and Baa3 or higher for Moody’s Investors’
Services. Our current ratings are one level above BBB- on
Standard & Poor’s and one level above Baa3 on Moody’s
Investors’ Services.
We have $350 million of committed lines of credit from
banks that are available if we maintain an investment
grade rating. This facility expires on August 16, 2006. As of
December 31, 2002, no amounts have been borrowed under
these lines.
If our debt ratings fall below investment grade, we would
also be in technical breach of a bank agreement covering
$160 million of letters of credit at December 31, 2002, which
might entitle the bank to set-off rights. In addition, a $151
million letter of credit line, of which $121 million has been
issued, includes provisions that allow the banks to require
cash collateralization for the full line if debt ratings of either
rating agency fall below the rating of BBB by Standard &
Poor’s or Baa2 by Moody’s Investors’ Services, one
downgrade from our current ratings. These letters of credit
and bank guarantees generally relate to our guaranteed
performance or retention payments under our long-term
contracts and self-insurance.
In the event the ratings of our debt by either agency fall,
we may have to issue additional debt or equity securities
or obtain additional credit facilities in order to satisfy the
cash collateralization requirements under the instruments
referred to above and meet our other liquidity needs. We
anticipate that any such new financing would not be on terms
as attractive as those we have currently and that we
would also be subject to increased borrowing costs and
interest rates. Our Halliburton Elective Deferral Plan has a
provision which states that if the Standard & Poor’s rating

M A N A G E M E N T ’ S D I S C U S S I O N A N D A N A L Y S I S
512 0 0 2 H A L L I B U R T O N A N N U A L R E P O R T
falls below BBB the amounts credited to the participants’
accounts will be paid to the participants in a lump-sum
within 45 days. At December 31, 2002 this was approximately
$49 million.
Le tte rs o f c re d i t . In the normal course of business, we
have agreements with banks under which approximately
$1.4 billion of letters of credit or bank guarantees were
issued, including at least $204 million which relate to our
joint ventures’ operations. The agreements with these
banks contain terms and conditions that define when the
banks can require cash collateralization of the entire line.
Agreements with banks covering at least $150 million of
letters of credit allow the bank to require cash collaterali-
zation for the full line for any reason, and agreements
covering another at least $890 million of letters of credit
allow the bank to require cash collateralization for the
entire line in the event of a bankruptcy or insolvency event
involving one of our subsidiaries.
Our letters of credit also contain terms and conditions
that define when they may be drawn. At least $230 million
of letters of credit permit the beneficiary of such letters of
credit to draw against the line for any reason and another at
least $560 million of letters of credit permit the beneficiary
of such letters of credit to draw against the line in the event
of a bankruptcy or insolvency event involving one of our
subsidiaries who will be party to the proposed reorganization.
Our anticipated credit facilities described above would
include a master letter of credit facility intended to replace
any cash collateralization rights of issuers of substantially
all our existing letters of credit during the pendency of the
anticipated Chapter 11 proceedings by DII Industries and
Kellogg, Brown & Root. The master letter of credit facility is
also intended to provide reasonably sufficient credit lines
for us to be able to fund any such cash requirements. If any
of such existing letters of credit are drawn during the
bankruptcy and we are required to provide cash to
collateralize or reimburse for such draws, it is anticipated
that the letter of credit facility would provide the cash
needed for such draws, with any borrowings being converted
into term loans. However, this letter of credit facility is not
currently in place, and, if we were required to cash
collateralize letters of credit prior to obtaining the facility,
we would be required to use cash on hand or existing credit
facilities. We will not enter into the pre-packaged Chapter 11
filing without having this credit facility in place. In
addition, representatives of DII Industries, Kellogg, Brown &
Root and their subsidiaries have been in discussions with
their customers in order to reduce the possibility that any
material draw on the existing letters of credit will occur
due to the anticipated Chapter 11 proceedings.
Effective October 9, 2002, we amended an agreement
with banks under which $261 million of letters of credit
have been issued on the Barracuda-Caratinga project. The
amended agreement removes the provision that previously
allowed the banks to require collateralization if ratings of
Halliburton debt fell below investment grade ratings. The
revised agreement includes provisions that require us to
maintain ratios of debt to total capital and of total earnings
before interest, taxes, depreciation and amortization to
interest expense. The definition of debt includes our asbestos
liability. The definition of total earnings before interest,
taxes, depreciation and amortization excludes any non-cash
charges related to the proposed global settlement through
December 31, 2003.
In the past, no significant claims have been made against
letters of credit issued on our behalf.
B a r ra c u d a - Ca ra t i n g a P ro j e c t . In June 2000, KBR
entered into a contract with the project owner, Barracuda
& Caratinga Leasing Company B.V., to develop the
Barracuda and Caratinga crude oil fields, which are located
off the coast of Brazil. The project manager and owner
representative is Petrobras, the Brazilian national oil
company. See Note 12 to the financial statements.
KBR’s performance under the contract is secured by:
• two performance letters of credit, which together havean available credit of approximately $261 million

2 0 0 2 H A L L I B U R T O N A N N U A L R E P O R T 52
and which represent approximately 10% of the contractamount, as amended to date by change orders;
• a retainage letter of credit in an amount equal to $121million as of December 31, 2002 and which will increasein order to continue to represent 10% of the cumulativecash amounts paid to KBR; and
• a guarantee of KBR’s performance of the contract byHalliburton Company in favor of the project owner.
As of December 31, 2002, the project was approximately
63% complete and KBR had recorded a loss of $117 million
related to the project. The probable recovery from unapproved
claims included in determining the loss on the project was
$182 million as of December 31, 2002.
The project owner has procured project finance funding
obligations from various banks to finance the payments due
to KBR under the contract. The project owner currently has
no other committed source of funding on which we can
necessarily rely other than the project finance funding for
the project. While we believe the banks have an incentive to
complete the financing of the project, there is no assurance
that they would do so. If the banks ceased funding the
project, we believe that Petrobras would provide for or secure
other funding to complete the project, although there is no
assurance that it will do so. To date, the banks have made
funds available, and the project owner has continued to
disburse funds to KBR as payment for its work on the
project, even though the project completion has been delayed.
In the event that KBR is alleged to be in default under
the contract, the project owner may assert a right to draw
upon the letters of credit. If the letters of credit were drawn,
KBR would be required to fund the amount of the draw to
the issuing bank. In the event that KBR was determined
after an arbitration proceeding to have been in default
under the contract, and if the project was not completed by
KBR as a result of such default (i.e., KBR’s services are
terminated as a result of such default), the project owner
may seek direct damages (including completion costs in
excess of the contract price and interest on borrowed funds,
M A N A G E M E N T ’ S D I S C U S S I O N A N D A N A L Y S I S
but excluding consequential damages) against KBR for up to
$500 million plus the return of up to $300 million in advance
payments that would otherwise have been credited back
to the project owner had the contract not been terminated.
In addition, although the project financing includes
borrowing capacity in excess of the original contract amount,
only $250 million of this additional borrowing capacity is
reserved for increases in the contract amount payable to
KBR and its subcontractors other than Petrobras. Because
our claims, together with change orders that are currently
under negotiation, exceed this amount, we cannot give
assurance that there is adequate funding to cover current or
future KBR claims. Unless the project owner provides
additional funding or permits us to defer repayment of the
$300 million advance, and assuming the project owner
does not allege default on our part, we may be obligated to
fund operating cash flow shortages over the remaining
project life in an amount we currently estimate to be up to
approximately $400 million.
The possible Chapter 11 pre-packaged bankruptcy filing
by Kellogg, Brown & Root in connection with the
settlement of its asbestos and silica claims would constitute
an event of default under the loan documents with the
banks unless waivers are obtained. KBR believes that it is
unlikely that the banks will exercise any right to cease
funding given the current status of the project and the fact
that a failure to pay KBR may allow KBR to cease work
on the project without Petrobras having a readily available
substitute contractor.
Current matur i t ies . We have approximately $295 million
of current maturities of long-term debt as of December 31,
2002. This includes a repayment of a $139 million senior
note due April 2003 and a $150 million medium-term note
due July 2003.
Cash and cash equ iva lents . We ended 2002 with cash
and equivalents of $1.1 billion.

M A N A G E M E N T ’ S D I S C U S S I O N A N D A N A L Y S I S
532 0 0 2 H A L L I B U R T O N A N N U A L R E P O R T
CRIT ICAL ACCOUNTING ESTIMATES
The preparation of financial statements requires the use of
judgments and estimates. Our critical accounting policies
are described below to provide a better understanding of
how we develop our judgments about future events and
related estimations and how they can impact our financial
statements. A critical accounting policy is one that requires
our most difficult, subjective or complex estimates and
assessments and is fundamental to our results of operations.
We identified our most critical accounting policies to be:
• percentage of completion accounting for our long-termengineering and construction contracts;
• allowance for bad debts;
• forecasting our effective tax rate, including our ability toutilize foreign tax credits and the realizability of deferredtax assets; and
• loss contingencies, primarily related to:
– asbestos litigation; and
– other litigation.
We base our estimates on historical experience and on
various other assumptions we believe to be reasonable
under the circumstances, the results of which form the basis
for making judgments about the carrying values of assets
and liabilities that are not readily apparent from other
sources. This discussion and analysis should be read in
conjunction with our consolidated financial statements and
related notes included in this report.
Percentage of complet ion
We account for our revenues on long-term engineering and
construction contracts on the percentage-of-completion
method. This method of accounting requires us to calculate job
profit to be recognized in each reporting period for each job
based upon our predictions of future outcomes which include:
• estimates of the total cost to complete the project;
• estimates of project schedule and completion date;
• estimates of the percentage the project is complete; and
• amounts of any probable unapproved claims and changeorders included in revenues.
At the onset of each contract, we prepare a detailed
analysis of our estimated cost to complete the project. Risks
relating to service delivery, usage, productivity and other
factors are considered in the estimation process. Our project
personnel periodically evaluate the estimated costs, claims
and change orders, and percentage of completion at the
project level. The recording of profits and losses on long-term
contracts requires an estimate of the total profit or loss
over the life of each contract. This estimate requires
consideration of contract revenue, change orders and claims,
less costs incurred and estimated costs to complete.
Anticipated losses on contracts are recorded in full in the
period in which they become evident. Profits are recorded
based upon the total estimated contract profit times the
current percentage complete for the contract.
When calculating the amount of total profit or loss on a
long-term contract, we include unapproved claims as
revenue when the collection is deemed probable based upon
the four criteria for recognizing unapproved claims under
the American Institute of Certified Public Accountants’
Statement of Position 81-1 “Accounting for Performance of
Construction-Type and Certain Production-Type Contracts.”
Including probable unapproved claims in this calculation
increases the operating income or decreases the operating
loss that would otherwise be recorded without consideration
of the probable unapproved claims. Probable unapproved
claims are recorded to the extent of costs incurred and include
no profit element. In substantially all cases, the probable
unapproved claims included in determining contract profit or
loss are less than the actual claim that will be or has been
presented to the customer. We actively engage in claims
negotiations with our customers and the success of claims
negotiations have a direct impact on the profit or loss
recorded for any related long-term contract. Unsuccessful
claims negotiations could result in decreases in estimated
contract profits or additional contract losses and
successful claims negotiations could result in increases in

2 0 0 2 H A L L I B U R T O N A N N U A L R E P O R T 54
estimated contract profits or recovery of previously recorded
contract losses.
Significant projects are reviewed in detail by senior
engineering and construction management at least quarterly.
Preparing project cost estimates and percentages of
completion is a core competency within our engineering and
construction businesses. We have a long history of dealing
with multiple types of projects and in preparing cost
estimates. However, there are many factors that impact
future costs, including but not limited to weather,
inflation, labor disruptions and timely availability of
materials, and other factors as outlined in our “Forward-
Looking Information” section. These factors can affect
the accuracy of our estimates and materially impact our
future reported earnings.
Al lowance for bad debts
We evaluate our accounts receivable through a continuous
process of assessing our portfolio on an individual customer
and overall basis. This process comprises a thorough review
of historical collection experience, current aging status of
the customer accounts, financial condition of our customers,
and other factors such as whether the receivables involve
retentions or billing disputes. We also consider the economic
environment of our customers, both from a marketplace and
geographic perspective, in evaluating the need for an
allowance. Based on our review of these factors, we establish
or adjust allowances for specific customers and the accounts
receivable portfolio as a whole. This process involves a high
degree of judgment and estimation and frequently involves
significant dollar amounts. Accordingly, our results of
operations can be affected by adjustments to the allowance
due to actual write-offs that differ from estimated amounts.
Tax account ing
We account for our income taxes in accordance with
Statement of Financial Accounting Standards No. 109
“Accounting for Income Taxes”, which requires the
recognition of the amount of taxes payable or refundable for
M A N A G E M E N T ’ S D I S C U S S I O N A N D A N A L Y S I S
the current year; and an asset and liability approach in
recognizing the amount of deferred tax liabilities and assets
for the future tax consequences of events that have been
recognized in our financial statements or tax returns. We
apply the following basic principles in accounting for our
income taxes at the date of the financial statements:
• a current tax liability or asset is recognized for theestimated taxes payable or refundable on tax returns forthe current year;
• a deferred tax liability or asset is recognized for theestimated future tax effects attributable to temporarydifferences and carryforwards;
• the measurement of current and deferred tax liabilitiesand assets is based on provisions of the enacted tax lawand the effects of potential future changes in tax laws orrates are not considered; and
• the value of deferred tax assets is reduced, if necessary,by the amount of any tax benefits that, based on availableevidence, are not expected to be realized.
We determine deferred taxes separately for each tax-paying
component (an entity or a group of entities that is
consolidated for tax purposes) in each tax jurisdiction. That
determination includes the following procedures:
• identify the types and amounts of existing temporarydifferences;
• measure the total deferred tax liability for taxabletemporary differences using the applicable tax rate;
• measure the total deferred tax asset for deductibletemporary differences and operating loss carryforwardsusing the applicable tax rate;
• measure the deferred tax assets for each type of taxcredit carryforward; and
• reduce the deferred tax assets by a valuation allowanceif, based on available evidence, it is more likely thannot that some portion or all of the deferred tax assetswill not be realized prior to expiration, or that futuredeductibility is uncertain.
This methodology requires a significant amount of
judgment regarding assumptions and the use of estimates,
M A N A G E M E N T ’ S D I S C U S S I O N A N D A N A L Y S I S
552 0 0 2 H A L L I B U R T O N A N N U A L R E P O R T
which can create significant variances between actual
results and estimates. Examples include the forecasting of
our effective tax rate and the potential realization of
deferred tax assets in the future, such as utilization of
foreign tax credits. This process involves making forecasts of
current and future years’ United States taxable income,
foreign taxable income and related taxes in order to
estimate the foreign tax credits. Unforeseen events, such as
the timing of asbestos or silica settlements, and other tax
timing issues may significantly affect these estimates. These
factors can affect the accuracy of our tax account balances
and impact our future reported earnings.
Loss cont ingenc ies
Asbestos . Prior to June 2002, we provided for known out-
standing asbestos and silica claims because we did not have
sufficient information to make a reasonable estimate of
future unknown asbestos claims liability. DII Industries
retained Dr. Francine F. Rabinovitz of Hamilton,
Rabinovitz & Alschuler, Inc. to estimate the probable number
and value, including defense costs, of unresolved current
and future asbestos and silica related bodily injury claims
asserted against DII Industries and its subsidiaries.
Dr. Rabinovitz is a nationally renowned expert in conducting
such analyses.
The methodology utilized by Dr. Rabinovitz to project
DII Industries and its subsidiaries’ asbestos and silica
related liabilities and defense costs relied upon and included:
• an analysis of historical asbestos and silica settlementsand defense costs;
• an analysis of the pending inventory of asbestos andsilica related claims;
• an analysis of the claims filing history for asbestos andsilica related claims since January 2000 (two-year claimhistory) and alternatively since January 1997 (five-yearclaim history);
• an analysis of the population likely to have been exposedor claim exposure to specific products or construction andrenovation projects; and
• epidemiological studies to estimate the number of peoplewho might allege exposure to products.
Dr. Rabinovitz’s estimates are based on historical data
supplied by DII Industries, KBR and Harbison-Walker and
publicly available studies, including annual surveys by the
National Institutes of Health concerning the incidence of
mesothelioma deaths. In her analysis, Dr. Rabinovitz
projected that the elevated and historically unprecedented
rate of claim filings of the last two years (particularly in
2000 and 2001), especially as expressed by the ratio of
nonmalignant claim filings to malignant claim filings, would
continue into the future for five more years. After that,
Dr. Rabinovitz projected that the ratio of nonmalignant
claim filings to malignant claim filings will gradually
decrease for a 10 year period ultimately returning to the
historical claiming rate and claiming ratio. In making her
calculation, Dr. Rabinovitz alternatively assumed a
somewhat lower rate of claim filings, based on an average of
the last five years of claims experience, would continue into
the future for five more years and decrease thereafter.
Other important assumptions utilized in Dr. Rabinovitz’s
estimates, which we relied upon in making our accrual are:
• an assumption that there will be no legislative or othersystemic changes to the tort system;
• that we will continue to aggressively defend againstasbestos and silica claims made against us;
• an inflation rate of 3% annually for settlement paymentsand an inflation rate of 4% annually for defense costs; and
• we would receive no relief from our asbestos obligationdue to actions taken in the Harbison-Walker bankruptcy.
Through 2052, Dr. Rabinovitz estimated the current and
future total undiscounted liability for personal injury
asbestos and silica claims, including defense costs, would be
a range between $2.2 billion and $3.5 billion as of June 30,
2002 (which includes payments related to the approximately
347,000 claims currently pending). The lower end of the
range is calculated by using an average of the last five years
of asbestos and silica claims experience and the upper end
of the range is calculated using the more recent two-year

2 0 0 2 H A L L I B U R T O N A N N U A L R E P O R T 56
elevated rate of asbestos and silica claim filings in projecting
the rate of future claims.
P ro p ose d G l o ba l Sett l e m e n t . On December 18, 2002,
we announced that we had reached an agreement
in principle that, if and when consummated, would result
in a global settlement of all asbestos and silica personal
injury claims against DII Industries, Kellogg, Brown & Root
and their current and former subsidiaries. The agreement in
principle provides that:
• up to $2.775 billion in cash, 59.5 million Halliburtonshares (valued at $1.1 billion using the stock price atDecember 31, 2002 of $18.71) and notes with a netpresent value expected to be less than $100 million willbe paid to a trust for the benefit of current and futureasbestos personal injury claimants and current silicapersonal injury claimants upon receiving final and non-appealable court confirmation of a plan of reorganization;
• DII Industries and Kellogg, Brown & Root will retainrights to the first $2.3 billion of any insurance proceedswith any proceeds received between $2.3 billion and $3.0billion going to the trust;
• the agreement is to be implemented through a pre-packaged Chapter 11 filing for DII Industries, Kellogg,Brown & Root, and some of their subsidiaries; and
• the funding of the settlement amounts would occur uponreceiving final and non-appealable court confirmation of aplan of reorganization of DII Industries, Kellogg, Brown &Root and their subsidiaries on the Chapter 11 proceeding.
Subsequently, as of March 2003, DII Industries and
Kellogg, Brown & Root have entered into definitive written
agreements finalizing the terms of the agreement in principle.
Please see “Liquidity and Capital Resources” for a
discussion of the prerequisites to reaching a conclusion of
the settlement.
Asbestos and Sil ica Liabil ity Estimate as of December 31,
2002. We currently do not believe that completion of the
proposed global settlement is probable as defined by State-
ment of Financial Accounting Standards No. 5. If the
proposed global settlement is not completed, we will continue
to resolve asbestos and silica claims in the tort system or, in
M A N A G E M E N T ’ S D I S C U S S I O N A N D A N A L Y S I S
the case of Harbison-Walker claims (See Note 12 to the
financial statements), possibly through the Harbison-
Walker bankruptcy proceedings. Given the uncertainties
surrounding the completion of the global settlement and
the uncertainty as to the amounts that could be paid under
the proposed global settlement, we believe Dr. Rabinovitz’s
study continues to provide the best possible range of
estimated loss associated with known and future asbestos
and silica claims liabilities. As a result of negotiating the
proposed global settlement, we have determined that the
best estimate of the probable loss is $3.4 billion ($3.5 billion
estimate as of June 30, 2002 in Dr. Rabinovitz’s study
less $50 million in payments in the third and fourth
quarter of 2002) and we have adjusted our liability to this
amount at December 31, 2002.
I nsurance Recover ies . In 2002, we retained Peterson
Consulting, a nationally-recognized consultant in liability
and insurance, to work with us to project the amount of
probable insurance recoveries using the current and future
asbestos and silica liabilities recorded by us at December 31,
2002. Using Dr. Rabinovitz’s estimate of liabilities through
2052 using the two-year elevated rate of asbestos and silica
claim filings, Peterson Consulting assisted us in conducting
an analysis to determine the amount of insurance that we
estimate is probable that we will recover in relation to
the projected claims and defense costs. In conducting this
analysis, Peterson Consulting:
• reviewed DII Industries’ historical course of dealingswith its insurance companies concerning the payment ofasbestos and silica related claims, including DIIIndustries’ 15 year litigation and settlement history;
• reviewed the terms of DII Industries’ prior and currentcoverage-in-place settlement agreements;
• reviewed the status of DII Industries’ and Kellogg, Brown& Root’s current insurance-related lawsuits and thevarious legal positions of the parties in those lawsuits inrelation to the developed and developing case law andthe historic positions taken by insurers in the earlier filedand settled lawsuits;
• engaged in discussions with our counsel; and

M A N A G E M E N T ’ S D I S C U S S I O N A N D A N A L Y S I S
572 0 0 2 H A L L I B U R T O N A N N U A L R E P O R T
• analyzed publicly-available information concerningthe ability of the DII Industries’ insurers to meet theirobligations.
Based on these reviews, analyses and discussions, Peterson
Consulting assisted us in making judgments concerning
insurance coverage that we believe are reasonable and
consistent with our historical course of dealings with our
insurers and the relevant case law to determine the
probable insurance recoveries for asbestos and silica
liabilities. This analysis factored in the probable effects of
self-insurance features, such as self-insured retentions,
policy exclusions, liability caps and the financial status of
applicable insurers, and various judicial determinations
relevant to DII Industries’ insurance programs.
Based on Peterson Consulting analysis of the probable
insurance recoveries, we increased our insurance receivable
to $2.1 billion at December 31, 2002. The insurance
receivable recorded by us does not assume any recovery
from insolvent carriers and assumes that those carriers which
are currently solvent will continue to be solvent through-
out the period of the applicable recoveries in the
projections. However, there can be no assurance that these
assumptions will be accurate. The insurance receivables
recorded at December 31, 2002 do not exhaust applicable
insurance coverage for asbestos and silica related liabilities.
Projecting future events is subject to many uncertainties
that could cause the asbestos and silica related liabilities
and insurance recoveries to be higher or lower than those
projected and accrued, such as:
• the number of future asbestos and silica relatedlawsuits to be filed against DII Industries and Kellogg,Brown & Root;
• the average cost to resolve such future lawsuits;
• coverage issues among layers of insurers issuing differentpolicies to different policyholders over extended periodsof time;
• the impact on the amount of insurance recoverable inlight of the Harbison-Walker and Federal-Mogulbankruptcies; and
• the continuing solvency of various insurance companies.
Poss i b l e Ad d i t i o n a l Acc r u a l s . Should the proposed
global settlement become probable as defined by Statement
of Financial Accounting Standards No. 5, we would
adjust our accrual for probable and reasonably estimable
liabilities for current and future asbestos and silica
claims. The settlement amount would be up to $4.0 billion,
consisting of up to $2.775 billion in cash, 59.5 million
Halliburton shares and notes with a net present value
expected to be less than $100 million. Assuming the revised
liability would be $4.0 billion, we would also increase our
probable insurance recoveries to $2.3 billion. The impact
on our income statement would be an additional pretax
charge of $322 million ($288 million after-tax). This accrual
(which values our stock to be contributed at $1.1 billion
using our stock price at December 31, 2002 of $18.71) would
then be adjusted periodically based on changes in the
market price of our common stock until the common stock is
contributed to a trust for the benefit of the claimants.
Cont inu ing Rev iew. Given the inherent uncertainty in
making future projections, we plan to have the projections
periodically reexamined, and update them based on our
experience and other relevant factors such as changes in the
tort system, the resolution of the bankruptcies of various
asbestos defendants, and our proposed global settlement.
Similarly, we will re-evaluate our projections concerning our
probable insurance recoveries in light of any updates to Dr.
Rabinovitz’s projections, developments in DII Industries’ and
Kellogg, Brown & Root’s various lawsuits against their
insurance companies, factors related to the global
settlement, if consummated, and other developments that
may impact the probable insurance recoveries.
L i t igat ion . We are currently involved in other legal
proceedings not involving asbestos and silica. As discussed
in Note 12 of our consolidated financial statements, as of
December 31, 2002, we have accrued an estimate of the
probable costs for the resolution of these claims. Attorneys
2 0 0 2 H A L L I B U R T O N A N N U A L R E P O R T 58
in our legal department specializing in litigation claims,
monitor and manage all claims filed against us. The estimate
of probable costs related to these claims is developed in
consultation with outside legal counsel representing us in
the defense of these claims. Our estimates are based upon
an analysis of potential results, assuming a combination of
litigation and settlement strategies. We attempt to resolve
claims through mediation and arbitration where possible. If
the actual settlement costs and final judgments, after
appeals, differ from our estimates, our future financial
results may be adversely affected.
OFF BALANCE SHEET RISK
On April 15, 2002, we entered into an agreement to sell
certain of our accounts receivable to a bankruptcy-remote
limited-purpose funding subsidiary. Under the terms of the
agreement, new receivables are added on a continuous basis
to the pool of receivables, and collections reduce previously
sold accounts receivable. This funding subsidiary sells an
undivided ownership interest in this pool of receivables to
entities managed by unaffiliated financial institutions under
another agreement. Sales to the funding subsidiary have
been structured as “true sales” under applicable bankruptcy
laws, and the assets of the funding subsidiary are not
available to pay any creditors of Halliburton or of its
subsidiaries or affiliates, until such time as the agreement
with the unaffiliated companies is terminated following
sufficient collections to liquidate all outstanding undivided
ownership interests. The funding subsidiary retains the
interest in the pool of receivables that are not sold to the
unaffiliated companies, and is fully consolidated and
reported in our financial statements.
The amount of undivided interests, which can be sold
under the program, varies based on the amount of eligible
Energy Services Group receivables in the pool at any given
time and other factors. The funding subsidiary sold a $200
million undivided ownership interest to the unaffiliated
companies, and may from time to time sell additional
M A N A G E M E N T ’ S D I S C U S S I O N A N D A N A L Y S I S
undivided ownership interests. No additional amounts were
received from our accounts receivable facility since the
second quarter of 2002. The total amount outstanding under
this facility was $180 million as of December 31, 2002. We
continue to service, administer and collect the receivables on
behalf of the purchaser. The amount of undivided ownership
interest in the pool of receivables sold to the unaffiliated
companies is reflected as a reduction of accounts receivable
in our consolidated balance sheet and as an increase in cash
flows from operating activities in our consolidated statement
of cash flows.
LONG-TERM CONTRACTUAL OBLIGATIONS AND
COMMERCIAL COMMITMENTS
The following table summarizes our various long-term
contractual obligations:Payments due
Millions of dollars 2003 2004 2005 2006 2007 Thereafter Total
Long-term debt $295 $ 21 $20 $293 $ 8 $ 826 $1,463 Operating leases 119 83 63 55 40 249 609 Capital leases 1 1 1 — — — 3 Total contractual
obligations $415 $105 $84 $348 $48 $1,075 $2,075
Included in long-term debt is an additional $13 million
at December 31, 2002 related to the terminated interest
rate swaps.
We also have $350 million of committed lines of credit
from banks that are available if we maintain an investment
grade rating. Investment grade ratings are BBB- or higher
for Standard & Poor’s and Baa3 or higher for Moody’s
Investors’ Services and we are currently above these levels.
In the normal course of business we have agreements with
banks under which approximately $1.4 billion of letters of
credit or bank guarantees were issued, including $204
million which relate to our joint ventures’ operations.
Effective October 9, 2002, we amended an agreement with
banks under which $261 million of letters of credit have
been issued. The amended agreement removes the provision
that previously allowed the banks to require collateralization
if ratings of Halliburton debt fell below investment grade
ratings. The revised agreements include provisions that

require us to maintain ratios of debt to total capital and of
total earnings before interest, taxes, depreciation and
amortization to interest expense. The definition of debt
includes our asbestos and silica liability. The definition of
total earnings before interest, taxes, depreciation and
amortization excludes any non-cash charges related to the
proposed global settlement through December 31, 2003.
If our debt ratings fall below investment grade, we would
also be in technical breach of a bank agreement covering
another $160 million of letters of credit at December 31,
2002, which might entitle the bank to set-off rights. In
addition, a $151 million letter of credit line, of which $121
million has been issued, includes provisions that allow the
banks to require cash collateralization for the full line if
debt ratings of either rating agency fall below the rating of
BBB by Standard & Poor’s or Baa2 by Moody’s Investors’
Services, one downgrade from our current ratings. These
letters of credit and bank guarantees generally relate to our
guaranteed performance or retention payments under our
long-term contracts and self-insurance.
FINANCIAL INSTRUMENT MARKET RISK
We are exposed to financial instrument market risk from
changes in foreign currency exchange rates, interest rates
and to a limited extent, commodity prices. We selectively
manage these exposures through the use of derivative
instruments to mitigate our market risk from these
exposures. The objective of our risk management program is
to protect our cash flows related to sales or purchases of
goods or services from market fluctuations in currency rates.
Our use of derivative instruments includes the following
types of market risk:
• volatility of the currency rates;
• time horizon of the derivative instruments;
• market cycles; and
• the type of derivative instruments used.
M A N A G E M E N T ’ S D I S C U S S I O N A N D A N A L Y S I S
We do not use derivative instruments for trading
purposes. We do not consider any of these risk management
activities to be material. See Note 1 to the financial
statements for additional information on our accounting
policies on derivative instruments. See Note 19 to the
financial statements for additional disclosures related to
derivative instruments.
I n terest ra te r i sk . We have exposure to interest rate risk
from our long-term debt and related interest rate swaps.
The following table represents principal amounts of our
long-term debt at December 31, 2002 and related weighted
average interest rates by year of maturity for our long-
term debt.
Millions of dollars 2003 2004 2005 2006 2007 Thereafter Total
Long-term debt:Fixed rate debt $140 $ 2 $ 1 $274 $ — $825 $1,242Weighted average
interest rate 8.0% 7.7% 7.0% 6.0% — 7.4% 7.1%
Variable rate debt $155 $ 19 $ 19 $ 19 $ 8 $ 1 $ 221 Weighted average
interest rate 2.3% 5.4% 5.4% 5.4% 5.4% 5.8% 3.2%
Fair market value of long-term debt was $1.3 billion as of
December 31, 2002.
In the second quarter 2002, we terminated our interest
rate swap agreement on our 8% senior note. The notional
amount of the swap agreement was $139 million. This
interest rate swap was designated as a fair value hedge
under SFAS No. 133. Upon termination, the fair value of the
interest rate swap was $0.5 million. In the fourth quarter
2002, we terminated our interest rate swap agreement on
our 6% fixed rate medium-term notes. The notional amount
of the swap agreement was $150 million. This interest rate
swap was designated as a fair value hedge under SFAS No.
133. Upon termination, the fair value of the interest rate
swap was $13 million. These swaps had previously been
classified in “Other assets” on the balance sheet. The fair
value adjustment to these debt instruments that were
hedged will remain and be amortized as a reduction in
interest expense using the “Effective Yield Method” over the
remaining life of the notes.
592 0 0 2 H A L L I B U R T O N A N N U A L R E P O R T

2 0 0 2 H A L L I B U R T O N A N N U A L R E P O R T 60
REORGANIZATION OF BUSINESS OPERATIONS
On March 18, 2002 we announced plans to restructure our
businesses into two operating subsidiary groups, the Energy
Services Group and KBR, representing the Engineering and
Construction Group. As part of this reorganization, we are
separating and consolidating the entities in our Energy
Services Group together as direct and indirect subsidiaries
of Halliburton Energy Services, Inc. We are also separating
and consolidating the entities in our Engineering and
Construction Group together as direct and indirect
subsidiaries of the former Dresser Industries, Inc., which
became a limited liability company during the second
quarter of 2002 and was renamed DII Industries, LLC. The
reorganization of business operations facilitated the
separation, organizationally, financially, and operationally, of
our two business segments, which we believe will
significantly improve operating efficiencies in both, while
streamlining management and easing manpower
requirements. In addition, many support functions, which
were previously shared, were moved into the two business
groups. As a result, we took actions during 2002 to reduce
our cost structure by reducing personnel, moving previously
shared support functions into the two business groups and
realigning ownership of international subsidiaries by group.
In 2002, we incurred approximately $107 million for the year
of personnel reduction costs and asset related write-offs. Of
this amount, $8 million remains in accruals for severance
arrangements and approximately $2 million for other items.
We expect these remaining payments will be made during
2003. Reorganization charges for 2002 consisted of the
following:
• $64 million in personnel related expense;
• $17 million of asset related write-downs;
• $20 million in professional fees related to therestructuring; and
• $6 million related to contract terminations.
Although we have no specific plans currently, the
M A N A G E M E N T ’ S D I S C U S S I O N A N D A N A L Y S I S
reorganization would facilitate separation of the ownership
of the two businesses in the future if we identify an
opportunity that produces greater value for our shareholders
than continuing to own both businesses. See Note 14 to the
financial statements.
In the fourth quarter of 2000 we approved a plan to
reorganize our engineering and construction businesses into
one business unit. This restructuring was undertaken
because our engineering and construction businesses
continued to experience delays in customer commitments for
new upstream and downstream projects. With the exception
of deepwater projects, short-term prospects for increased
engineering and construction activities in either the
upstream or downstream businesses were not positive. As a
result of the reorganization of the engineering and
construction businesses, we took actions to rationalize our
operating structure, including write-offs of equipment and
licenses of $10 million, engineering reference designs of $4
million and capitalized software of $6 million, and recorded
severance costs of $16 million. Of these charges, $30 million
was reflected under the captions cost of services and $6
million as general and administrative in our 2000
consolidated statements of income. Severance and related
costs of $16 million were for the reduction of approximately
30 senior management positions. In January 2002, the last
of the personnel actions was completed and we have no
remaining accruals related to the 2000 restructuring. See
Note 14 to the financial statements.
ENVIRONMENTAL MATTERS
We are subject to numerous environmental, legal and
regulatory requirements related to our operations
worldwide. In the United States, these laws and regulations
include the Comprehensive Environmental Response,
Compensation and Liability Act, the Resources Conservation
and Recovery Act, the Clean Air Act, the Federal Water
Pollution Control Act and the Toxic Substances Control Act,
among others. In addition to the federal laws and regulations,
states where we do business may have equivalent laws and
M A N A G E M E N T ’ S D I S C U S S I O N A N D A N A L Y S I S
612 0 0 2 H A L L I B U R T O N A N N U A L R E P O R T
regulations by which we must also abide.
We evaluate and address the environmental impact of our
operations by assessing and remediating contaminated
properties in order to avoid future liabilities and comply with
environmental, legal and regulatory requirements. On
occasion we are involved in specific environmental litigation
and claims, including the remediation of properties we
own or have operated as well as efforts to meet or correct
compliance-related matters.
We do not expect costs related to these remediation
requirements to have a material adverse effect on our
consolidated financial position or our results of operations.
We have subsidiaries that have been named as potentially
responsible parties along with other third parties for ten
federal and state superfund sites for which we have
established a liability. As of December 31, 2002, those ten
sites accounted for $8 million of our total $48 million
liability. See Note 12 to the financial statements.
FORWARD-LOOKING INFORMATION
The Private Securities Litigation Reform Act of 1995 provides
safe harbor provisions for forward-looking information.
Forward-looking information is based on projections and
estimates, not historical information. Some statements in
this Form 10-K are forward-looking and use words like
“may,” “may not,” “believes,” “do not believe,” “expects,” “do
not expect,” “do not anticipate,” and other expressions. We
may also provide oral or written forward-looking information
in other materials we release to the public. Forward-
looking information involves risks and uncertainties and
reflects our best judgment based on current information.
Our results of operations can be affected by inaccurate
assumptions we make or by known or unknown risks and
uncertainties. In addition, other factors may affect the
accuracy of our forward-looking information. As a result, no
forward-looking information can be guaranteed. Actual
events and the results of operations may vary materially.
While it is not possible to identify all factors, we continue
to face many risks and uncertainties that could cause
actual results to differ from our forward-looking statements
and potentially adversely affect our financial condition and
results of operations, including risks relating to:
Asbestos
• completion of the proposed global settlement, prerequisitesto which include:
– agreement on the amounts to be contributed to the trustfor the benefit of current silica claimants;
– our due diligence review for product exposure and medical basis for claims;
– agreement on procedures for distribution of settlement funds to individuals claiming personal injury;
– definitive agreement on a plan of reorganization and disclosure statement relating to the proposed settlement;
– arrangement of acceptable financing to fund the proposed settlement;
– Board of Directors approval;
– obtaining approval from 75% of current asbestos claimants to the plan of reorganization implementing the proposed global settlement; and
– obtaining final and non-appealable bankruptcy court approval and federal district court confirmation of the plan of reorganization;
• the results of being unable to complete the proposedglobal settlement, including:
– continuing asbestos and silica litigation against us,which would include the possibility of substantial adverse judgments, the timing of which could not be controlled or predicted, and the obligation to provide appeals bonds pending any appeal of any such judgment, some or all of which may require us to post cash collateral;
– current and future asbestos claims settlement and defense costs, including the inability to completely control the timing of such costs and the possibility of increased costs to resolve personal injury claims;
– the possibility of an increase in the number and type of asbestos and silica claims against us in the future;
2 0 0 2 H A L L I B U R T O N A N N U A L R E P O R T 62
– future events in the Harbison-Walker bankruptcy proceeding, including the possibility of discontinuation of the temporary restraining order entered by the Harbison-Walker bankruptcy court that applies to over 200,000 pending claims againt DII Industries; and
– any adverse changes to the tort system allowing additional claims or judgments against us;
• the results of being unable to recover, or being delayed inrecovering, insurance reimbursement in the amountsanticipated to cover a part of the costs incurred defendingasbestos and silica claims, and amounts paid to settleclaims or as a result of court judgments, due to:
– the inability or unwillingness of insurers to timely reimburse for claims in the future;
– disputes as to documentation requirements for DII Industries in order to recover claims paid;
– the inability to access insurance policies shared with,or the dissipation of shared insurance assets by,Harbison-Walker Refractories Company or Federal-Mogul Products, Inc.;
– the insolvency or reduced financial viability of insurers;
– the cost of litigation to obtain insurance reimbursement;and
– adverse court decisions as to our rights to obtain insurance reimbursement;
• the results of recovering, or agreeing in settlement oflitigation to recover, less insurance reimbursement thanthe insurance receivable recorded in our financialstatements;
• continuing exposure to liability even after the proposedsettlement is completed, including exposure to:
– any claims by claimants exposed outside of the United States;
– possibly any claims based on future exposure to silica;
– property damage claims as a result of asbestos and silica use; or
– any claims against any other subsidiaries or business units of Halliburton that would not be released in the Chapter 11 proceeding through the 524(g) injunction;
M A N A G E M E N T ’ S D I S C U S S I O N A N D A N A L Y S I S
• liquidity risks resulting from being unable to completea global settlement or timely recovery of insurancereimbursement for amounts paid, each as discussedfurther below; and
• an adverse effect on our financial condition or results ofoperations as a result of any of the foregoing;
L iqu id i ty
• adverse financial developments that could affect ouravailable cash or lines of credit, including:
– the effects described above of not completing theproposed global settlement or not being able to timely recover insurance reimbursement relating to amounts paid as part of a global settlement or as a result of judgments against us or settlements paid in the absenceof a global settlement;
– our inability to provide cash collateral for letters of credit or any bonding requirements from customers or as a result of adverse judgments that we are appealing; and
– a reduction in our credit ratings as a result of the aboveor due to other adverse developments;
• requirements to cash collateralize letters of credit andsurety bonds by issuers and beneficiaries of theseinstruments in reaction to:
– our plans to place DII Industries, Kellogg, Brown & Root and some of their subsidiaries into a pre-packagedChapter 11 bankruptcy as part of the proposed global settlement;
– in the absence of a global settlement, one or more substantial adverse judgments;
– not being able to timely recover insurance reimbursement; or
– a reduction in credit ratings;
• our ability to secure financing on acceptable terms to fundour proposed global settlement;
• defaults that could occur under our and our subsidiaries’debt documents as a result of a Chapter 11 filing unlesswe are able to obtain consents or waivers to those eventsof default, which events of default could cause defaultsunder other of our credit facilities and possibly result in

M A N A G E M E N T ’ S D I S C U S S I O N A N D A N A L Y S I S
632 0 0 2 H A L L I B U R T O N A N N U A L R E P O R T
an obligation to immediately pay amounts duethereunder;
• actions by issuers and beneficiaries of current letters ofcredit to draw under such letters of credit prior to ourcompletion of a new letter of credit facility that isintended to provide reasonably sufficient credit lines forus to be able to fund any such cash requirements;
• obtaining debtor-in-possession financing for DII Industries,Kellogg, Brown & Root and their subsidiaries prior tofiling a Chapter 11 proceeding;
• reductions in our credit ratings by rating agencies, whichcould result in:
– the unavailability of borrowing capacity under our existing $350 million line of credit facility, which is onlyavailable to us if we maintain an investment grade credit rating;
– reduced access to lines of credit, credit markets and credit from suppliers under acceptable terms;
– borrowing costs in the future; and
– inability to issue letters of credit and surety bonds withor without cash collateral;
• debt and letter of credit covenants;
• volatility in the surety bond market;
• availability of financing from the United StatesExport/Import Bank;
• ability to raise capital via the sale of stock; and
• an adverse effect on our financial condition or results ofoperations as a result of any of the foregoing;
Lega l
• litigation, including, for example, class action shareholderand derivative lawsuits, contract disputes, patentinfringements, and environmental matters;
• any adverse outcome of the SEC’s current investigationinto Halliburton’s accounting policies, practices andprocedures that could result in sanctions and the paymentof fines or penalties, restatement of financials for yearsunder review or additional shareholder lawsuits;
• trade restrictions and economic embargoes imposed by theUnited States and other countries;
• restrictions on our ability to provide products and servicesto Iran, Iraq and Libya, all of which are significantproducers of oil and gas;
• protective government regulation in many of thecountries where we operate, including, for example,regulations that:
– encourage or mandate the hiring of local contractors;and
– require foreign contractors to employ citizens of, or purchase supplies from, a particular jurisdiction;
• potentially adverse reaction, and time and expenseresponding to, the increased scrutiny of Halliburton byregulatory authorities, the media and others;
• potential liability and adverse regulatory reaction inNigeria to the theft from us of radioactive material usedin wireline logging operations;
• environmental laws and regulations, including, forexample, those that:
– require emission performance standards for facilities; and
– the potential regulation in the United States of our Energy Services Group’s hydraulic fracturing services and products as underground injection; and
• the proposed excise tax in the United States targeted atheavy equipment of the type we own and use in ouroperations would negatively impact our Energy ServicesGroup operating income;
Effect of Chapter 1 1 Proceed ings
• the adverse effect on the ability of the subsidiaries thatare proposed to file a Chapter 11 proceeding to obtain neworders from current or prospective customers;
• the potential reluctance of current and prospectivecustomers and suppliers to honor obligations or continueto transact business with the Chapter 11 filing entities;
• the potential adverse effect of the Chapter 11 filing ofnegotiating favorable terms with customers, suppliers andother vendors;
• a prolonged Chapter 11 proceeding that could adverselyaffect relationships with customers, suppliers andemployees, which in turn could adversely affect our
2 0 0 2 H A L L I B U R T O N A N N U A L R E P O R T 64
competitive position, financial condition and results ofoperations and our ability to implement the proposedplan of reorganization; and
• the adverse affect on our financial condition or results ofoperations as a result of the foregoing;
Geopo l i t i ca l
• armed conflict in the Middle East that could:
– impact the demand and pricing for oil and gas;
– disrupt our operations in the region and elsewhere; and
– increase our costs for security worldwide;
• unsettled political conditions, consequences of war orother armed conflict, the effects of terrorism, civil unrest,strikes, currency controls and governmental actions inmany oil producing countries and countries in which weprovide governmental logistical support that couldadversely affect our revenues and profit. Countries wherewe operate which have significant amounts of politicalrisk include Afghanistan, Algeria, Angola, Colombia,Indonesia, Libya, Nigeria, Russia, and Venezuela. Forexample, the national strike in Venezuela as well asseizures of offshore oil rigs by protestors and cessation ofoperations by some of our customers in Nigeria havedisrupted our Energy Services Group’s ability to provideservices and products to our customers in thesecountries during 2002 and likely will continue to do so in2003; and
• changes in foreign exchange rates and exchange controlsas were experienced in Argentina in late 2001 and early2002. For example, the changes in Argentina exchangerates in late 2001 and early 2002 were detrimentalto results of our Energy Services Group operations inArgentina;
Weather re la ted
• severe weather that impacts our business, particularly inthe Gulf of Mexico where we have significant operations.Impacts may include:
– evacuation of personnel and curtailment of services;
– weather related damage to offshore drilling rigs resulting in suspension of operations;
M A N A G E M E N T ’ S D I S C U S S I O N A N D A N A L Y S I S
– weather related damage to our facilities;
– inability to deliver materials to jobsites in accordance with contract schedules; and
– loss of productivity; and
• demand for natural gas in the United States drives adisproportionate amount of our Energy Services Group’sUnited States business. As a result, warmer than normalwinters in the United States are detrimental to thedemand for our services to gas producers. Conversely,colder than normal winters in the United States result inincreased demand for our services to gas producers;
Customers
• the magnitude of governmental spending and outsourcingfor military and logistical support of the type that weprovide, including, for example, support services in theBalkans;
• changes in capital spending by customers in the oil andgas industry for exploration, development, production,processing, refining, and pipeline delivery networks;
• changes in capital spending by governments forinfrastructure projects of the sort that we perform;
• consolidation of customers including, for example, themerger of Conoco and Phillips Petroleum, has causedcustomers to reduce their capital spending which hasnegatively impacted the demand for our services andproducts;
• potential adverse customer reaction, including potentialdraws upon letters of credit, due to their concernsabout our plans to place DII Industries, Kellogg, Brown &Root and some of their subsidiaries into a pre-packagedbankruptcy as part of the global settlement;
• customer personnel changes due to mergers andconsolidation which impacts the timing of contractnegotiations and settlements of claims;
• claim negotiations with engineering and constructioncustomers on cost and schedule variances and changeorders on major projects, including, for example, theBarracuda-Caratinga project in Brazil; and
• ability of our customers to timely pay the amounts due us;
M A N A G E M E N T ’ S D I S C U S S I O N A N D A N A L Y S I S
652 0 0 2 H A L L I B U R T O N A N N U A L R E P O R T
I ndust ry
• changes in oil and gas prices, among other things,result from:
– the armed conflict in the Middle East;
– OPEC’s ability to set and maintain production levels and prices for oil;
– the level of oil production by non-OPEC countries;
– the policies of governments regarding exploration for and production and development of their oil and natural gas reserves; and
– the level of demand for oil and natural gas, especially natural gas in the United States;
• obsolescence of our proprietary technologies, equipmentand facilities, or work processes;
• changes in the price or the availability of commoditiesthat we use;
• our ability to obtain key insurance coverage on acceptableterms;
• nonperformance, default or bankruptcy of joint venturepartners, key suppliers or subcontractors;
• performing fixed-price projects, where failure to meetschedules, cost estimates or performance targets couldresult in reduced profit margins or losses;
• entering into complex business arrangements fortechnically demanding projects where failure by one ormore parties could result in monetary penalties; and
• the use of derivative instruments of the sort that we usewhich could cause a change in value of the derivativeinstruments as a result of:
– adverse movements in foreign exchange rates, interest rates, or commodity prices; or
– the value and time period of the derivative being different than the exposures or cash flows being hedged;
Systems
• the successful identification, procurement and installationof a new financial system to replace the current systemfor the Engineering and Construction Group;
Personne l and mergers/reorgan izat ions/d ispos i t ions
• integration of acquired businesses into Halliburton,including:
– standardizing information systems or integrating data from multiple systems;
– maintaining uniform standards, controls, procedures,and policies; and
– combining operations and personnel of acquired businesses with ours;
• effectively restructuring operations and personnel withinHalliburton including, for example, the segregation of ourbusiness into two operating subsidiary groups underHalliburton;
• ensuring acquisitions and new products and services addvalue and complement our core businesses; and
• successful completion of planned dispositions.
In addition, future trends for pricing, margins, revenues
and profitability remain difficult to predict in the industries
we serve. We do not assume any responsibility to publicly
update any of our forward-looking statements regardless of
whether factors change as a result of new information,
future events or for any other reason. You should review any
additional disclosures we make in our press releases and
Forms 10-K, 10-Q and 8-K filed with the United States
Securities and Exchange Commission. We also suggest that
you listen to our quarterly earnings release conference calls
with financial analysts.
No assurance can be given that our financial condition or
results of operations would not be materially and adversely
affected by some of the events described above, including:
• the inability to complete a global settlement;
• in the absence of a global settlement, adverse developmentsin the tort system, including adverse judgments andincreased defense and settlement costs relating to claimsagainst us;
• liquidity issues resulting from failure to complete a globalsettlement, adverse developments in the tort system,including adverse judgments and increased defense andsettlement costs, and resulting or concurrent credit
2 0 0 2 H A L L I B U R T O N A N N U A L R E P O R T 66
ratings downgrades and/or demand for cash collateral-ization of letters of credit or surety bonds;
• the filing of Chapter 11 proceedings by some of oursubsidiaries or a prolonged Chapter 11 proceeding; and
• adverse geopolitical developments, including armedconflict, civil disturbance and unsettled political conditionsin foreign countries in which we operate.
NEW ACCOUNTING PRONOUNCEMENTS
In August 2001, the Financial Accounting Standards Board
issued SFAS No. 143, “Accounting for Asset Retirement
Obligations” which addresses the financial accounting and
reporting for obligations associated with the retirement of
tangible long-lived assets and the associated assets’
retirement costs. SFAS No. 143 requires that the fair value
of a liability associated with an asset retirement be
recognized in the period in which it is incurred if a reasonable
estimate of fair value can be made. The associated
retirement costs are capitalized as part of the carrying
amount of the long-lived asset and subsequently depreciated
over the life of the asset. We currently account for
liabilities associated with asset retirement obligations
under existing accounting standards, such as SFAS 19,
SFAS 5, SOP 96-1, and EITF 89-30, which do not require
the asset retirement obligations to be recorded at fair value
and in some instances do not require the costs to be
recognized in the carrying amount of the related asset. The
new standard is effective for us beginning January 1, 2003,
and the effects of this standard will be immaterial to our
future financial condition and we estimate will require a
charge of less than $10 million after tax as a cumulative
effect of a change in accounting principle.
In July 2002 the Financial Accounting Standards Board
issued SFAS No. 146, “Accounting for Costs Associated with
Exit or Disposal Activities”. The standard requires
companies to recognize costs associated with exit or disposal
activities when the liabilities are incurred rather than at
the date of a commitment to an exit or disposal plan.
Examples of costs covered by the standard include lease
M A N A G E M E N T ’ S D I S C U S S I O N A N D A N A L Y S I S
termination costs and some employee severance costs that
are associated with a restructuring, discontinued operation,
plant closing, or other exit or disposal activity. SFAS No.
146 is to be applied prospectively to exit or disposal
activities initiated after December 31, 2002 and would only
affect the timing of charges associated with any future exit
or disposal activity.
In November 2002, the Financial Accounting Standards
Board issued FASB Interpretation No. 45, “Guarantor’s
Accounting and Disclosure Requirements for Guarantees,
Including Indirect Guarantees of Indebtedness of Others”
(FIN 45). This statement requires that a liability be
recorded in the guarantor’s balance sheet upon issuance of a
guarantee. In addition, FIN 45 requires disclosures about
the guarantees that an entity has issued, including a
rollforward of the entity’s product warranty liabilities. We
will apply the recognition provisions of FIN 45 prospectively
to guarantees issued after December 31, 2002. The disclosure
provisions of FIN 45 are effective for financial statements of
interim and annual periods ending December 15, 2002.
The adoption of FIN 45 will not have a material effect on
our consolidated financial position and results of operations.
In January 2003, the Financial Accounting Standards
Board issued FASB Interpretation No. 46, “Consolidation of
Variable Interest Entities, an Interpretation of ARB No. 51”
(FIN 46). This statement requires specified variable interest
entities to be consolidated by the primary beneficiary of the
entity if the equity investors in the entity do not have the
characteristics of a controlling financial interest or do not
have sufficient equity at risk for the entity to finance its
activities without additional subordinated financial support
from other parties. FIN 46 is effective for all new variable
interest entities created or acquired after January 31, 2003
and beginning July 1, 2003 for variable interest entities
created or acquired prior to February 1, 2003. Our exposure
to variable interest entities is limited and, therefore, the
adoption of FIN 46 is not expected to have a material
impact on our consolidated financial position and results
of operations.

R E S P O N S I B I L I T Y F O R F I N A N C I A L R E P O R T I N G
672 0 0 2 H A L L I B U R T O N A N N U A L R E P O R T
We are responsible for the preparation and integrity of our
published financial statements. The financial statements
have been prepared in accordance with accounting principles
generally accepted in the United States of America and,
accordingly, include amounts based on judgments and
estimates made by our management. We also prepared the
other information included in the annual report and
are responsible for its accuracy and consistency with the
financial statements.
Our 2002 financial statements have been audited by the
independent accounting firm, KPMG LLP. KPMG LLP
was given unrestricted access to all financial records and
related data, including minutes of all meetings of
stockholders, the Board of Directors and committees of the
Board. Halliburton’s Audit Committee of the Board of
Directors consists of directors who, in the business judgment
of the Board of Directors, are independent under the
New York Stock Exchange listing standards. The Board of
Directors, operating through its Audit Committee,
provides oversight to the financial reporting process. Integral
to this process is the Audit Committee’s review and
discussion with management and the external auditors of
the quarterly and annual financial statements prior to
their respective filing.
We maintain a system of internal control over financial
reporting, which is intended to provide reasonable assurance
to our management and Board of Directors regarding the
reliability of our financial statements. The system includes:
• a documented organizational structure and division ofresponsibility;
• established policies and procedures, including a codeof conduct to foster a strong ethical climate which iscommunicated throughout the company; and
• the careful selection, training and development of ourpeople.
Internal auditors monitor the operation of the internal
control system and report findings and recommendations to
management and the Board of Directors. Corrective actions
are taken to address control deficiencies and other
opportunities for improving the system as they are
identified. In accordance with the Securities and Exchange
Commission’s rules to improve the reliability of financial
statements, our 2002 interim financial statements were
reviewed by KPMG LLP.
There are inherent limitations in the effectiveness of any
system of internal control, including the possibility of human
error and the circumvention or overriding of controls.
Accordingly, even an effective internal control system can
provide only reasonable assurance with respect to the
reliability of our financial statements. Also, the effectiveness
of an internal control system may change over time.
We have assessed our internal control system in relation
to criteria for effective internal control over financial
reporting described in “Internal Control-Integrated
Framework” issued by the Committee of Sponsoring
Organizations of the Treadway Commission. Based upon
that assessment, we believe that, as of December 31, 2002,
our system of internal control over financial reporting met
those criteria.
HALLIBURTON COMPANY
by
David J. Lesar
Chairman of the Board,
President and
Chief Executive Officer
Douglas L. Foshee
Executive Vice President and
Chief Financial Officer

2 0 0 2 H A L L I B U R T O N A N N U A L R E P O R T 68
I N D E P E N D E N T A U D I T O R ’ S R E P O R T
TO THE SHAREHOLDERS AND
BOARD OF DIRECTORS
OF HALLIBURTON COMPANY:
We have audited the accompanying consolidated balance
sheet of Halliburton Company and subsidiaries as of
December 31, 2002, and the related consolidated statements
of operations, shareholders’ equity, and cash flows for the
year then ended. These consolidated financial statements
are the responsibility of the Company’s management. Our
responsibility is to express an opinion on these consolidated
financial statements based on our audit. The accompanying
2001 and 2000 consolidated financial statements of
Halliburton Company and subsidiaries were audited by other
auditors who have ceased operations. Those auditors
expressed an unqualified opinion on those consolidated
financial statements, before the restatement described in
Note 4 to the consolidated financial statements and before
the revision described in Note 22 to the consolidated financial
statements, in their report dated January 23, 2002 (except
with respect to matters discussed in Note 9 to those financial
statements, as to which the date was February 21, 2002).
We conducted our audit in accordance with auditing
standards generally accepted in the United States of America.
Those standards require that we plan and perform the audit
to obtain reasonable assurance about whether the financial
statements are free of material misstatement. An audit
includes examining, on a test basis, evidence supporting the
amounts and disclosures in the financial statements. An
audit also includes assessing the accounting principles used
and significant estimates made by management, as well
as evaluating the overall financial statement presentation.
We believe that our audit provides a reasonable basis for
our opinion.
In our opinion, the 2002 consolidated financial statements
referred to above present fairly, in all material respects,
the financial position of Halliburton Company and
subsidiaries as of December 31, 2002, and the results of
their operations and their cash flows for the year then
ended in conformity with accounting principles generally
accepted in the United States of America.
As discussed above, the 2001 and 2000 consolidated
financial statements of Halliburton Company and
subsidiaries were audited by other auditors who have
ceased operations. As described in Note 4, the Company
changed the composition of its reportable segments in 2002,
and the amounts in the 2001 and 2000 consolidated
financial statements relating to reportable segments have
been restated to conform to the 2002 composition of
reportable segments. We audited the adjustments that were
applied to restate the disclosures for reportable segments
reflected in the 2001 and 2000 consolidated financial
statements. In our opinion, such adjustments are appropriate
and have been properly applied. Also, as described in Note
22, these consolidated financial statements have been
revised to include the transitional disclosures required by
Statement of Financial Accounting Standards No. 142,
Goodwill and Other Intangible Assets, which was adopted by
the Company as of January 1, 2002. In our opinion, the
disclosures for 2001 and 2000 in Note 22 are appropriate.
However, we were not engaged to audit, review, or apply any
procedures to the 2001 and 2000 consolidated financial
statements of Halliburton Company and subsidiaries other
than with respect to such adjustments and revisions and,
accordingly, we do not express an opinion or any other form
of assurance on the 2001 and 2000 consolidated financial
statements taken as a whole.
KPMG LLP
Houston, Texas
March 13, 2003
692 0 0 2 H A L L I B U R T O N A N N U A L R E P O R T
R E P O R T O F I N D E P E N D E N T P U B L I C A C C O U N T A N T S
This report is a copy of a previously issued report, thepredecessor auditor has not reissued this report, the previouslyissued report refers to financial statements not physicallyincluded in this document, and the prior-period financialstatements have been revised or restated.
TO THE SHAREHOLDERS AND
BOARD OF DIRECTORS
OF HALLIBURTON COMPANY:
We have audited the accompanying consolidated balance
sheets of Halliburton Company (a Delaware corporation)
and subsidiary companies as of December 31, 2001 and
2000, and the related consolidated statements of income,
cash flows, and shareholders’ equity for each of the three
years in the period ended December 31, 2001. These
financial statements are the responsibility of the Company’s
management. Our responsibility is to express an opinion on
these financial statements based on our audits.
We conducted our audits in accordance with auditing
standards generally accepted in the United States of
America. Those standards require that we plan and perform
the audit to obtain reasonable assurance about whether
the financial statements are free of material misstatement.
An audit includes examining, on a test basis, evidence
supporting the amounts and disclosures in the financial
statements. An audit also includes assessing the accounting
principles used and significant estimates made by
management, as well as evaluating the overall financial
statement presentation. We believe that our audits provide a
reasonable basis for our opinion.
In our opinion, the financial statements referred to above
present fairly, in all material respects, the financial
position of Halliburton Company and subsidiary companies
as of December 31, 2001 and 2000, and the results of
their operations and their cash flows for each of the three
years in the period ended December 31, 2001, in
conformity with accounting principles generally accepted in
the United States of America.
ARTHUR ANDERSEN LLP
Dallas, Texas
January 23, 2002
(Except with respect to certain matters discussed in Note 9,
as to which the date is February 21, 2002.)

2 0 0 2 H A L L I B U R T O N A N N U A L R E P O R T 70
C O N S O L I D A T E D S T A T E M E N T S O F O P E R A T I O N S
Years ended December 31(Millions of dollars and shares except per share data) 2002 2001 2000 REVENUES:
Services $10,658 $10,940 $10,185 Product sales 1,840 1,999 1,671 Equity in earnings of unconsolidated affiliates 74 107 88
Total revenues $12,572 $13,046 $11,944 OPERATING COSTS AND EXPENSES:
Cost of services $10,737 $ 9,831 $ 9,755 Cost of sales 1,642 1,744 1,463 General and administrative 335 387 352 Gain on sale of marine vessels — — (88) Gain on sale of business assets (30) — —
Total operating costs and expenses $12,684 $11,962 $11,482 OPERATING INCOME (LOSS) (112) 1,084 462 Interest expense (113) (147) (146) Interest income 32 27 25 Foreign currency losses, net (25) (10) (5) Other, net (10) — (1) INCOME (LOSS) FROM CONTINUING OPERATIONS BEFORE INCOME TAXES,
MINORITY INTEREST, AND CHANGE IN ACCOUNTING METHOD, NET (228) 954 335 Provision for income taxes (80) (384) (129) Minority interest in net income of subsidiaries (38) (19) (18) INCOME (LOSS) FROM CONTINUING OPERATIONS BEFORE CHANGE IN
ACCOUNTING METHOD, NET (346) 551 188 DISCONTINUED OPERATIONS:
Income (loss) from discontinued operations, net of tax (provision) benefit of $154, $20, and ($60) (652) (42) 98
Gain on disposal of discontinued operations, net of tax provision of $0, $199, and $141 — 299 215
Income (loss) from discontinued operations, net ( 652) 257 313 Cumulative effect of change in accounting method, net — 1 — NET INCOME (LOSS) $ (998) $ 809 $ 501 BASIC INCOME (LOSS) PER SHARE:
Income (loss) from continuing operations before change in accounting method, net $ (0.80) $ 1.29 $ 0.42
Income (loss) from discontinued operations (1.51) (0.10) 0.22 Gain on disposal of discontinued operations — 0.70 0.49 Net income (loss) $ (2.31) $ 1.89 $ 1.13 DILUTED INCOME (LOSS) PER SHARE:
Income (loss) from continuing operations before change in accounting method, net $ (0.80) $ 1.28 $ 0.42
Income (loss) from discontinued operations (1.51) (0.10) 0.22 Gain on disposal of discontinued operations — 0.70 0.48 Net income (loss) $ (2.31) $ 1.88 $ 1.12 Basic average common shares outstanding 432 428 442 Diluted average common shares outstanding 432 430 446
See notes to annual financial statements.
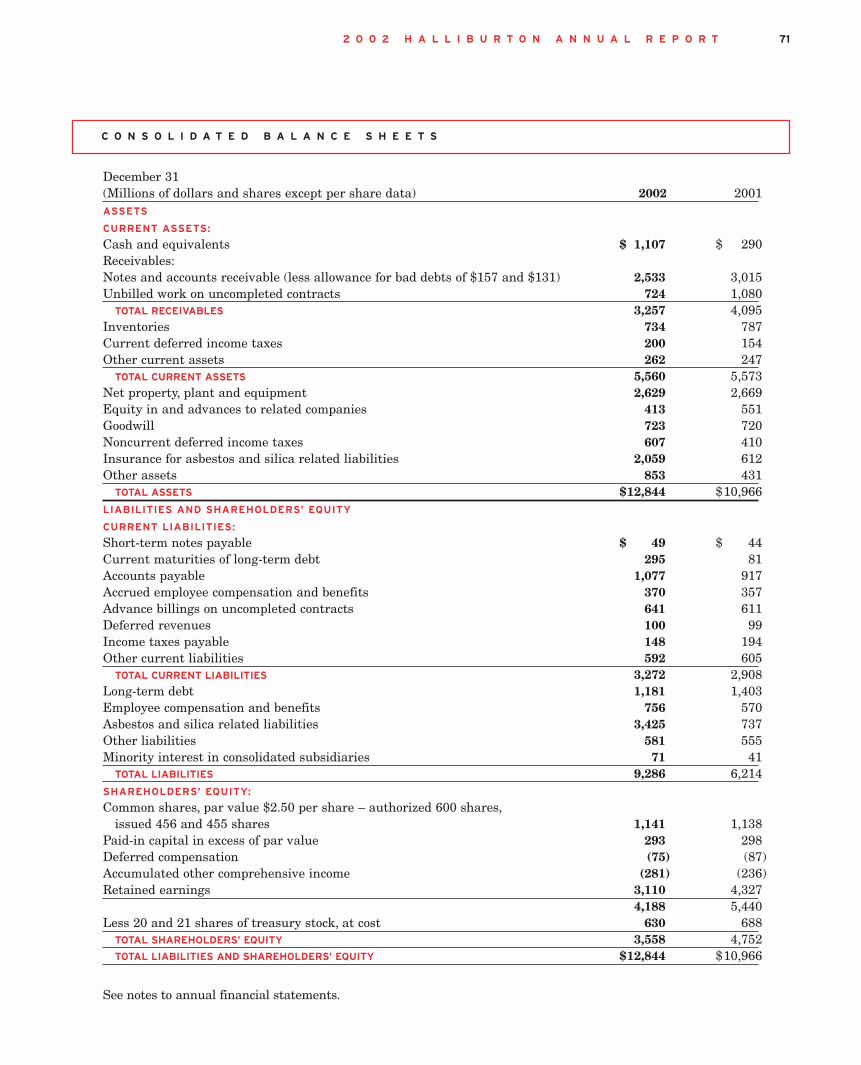
C O N S O L I D A T E D B A L A N C E S H E E T S
712 0 0 2 H A L L I B U R T O N A N N U A L R E P O R T
December 31(Millions of dollars and shares except per share data) 2002 2001 ASSETS
CURRENT ASSETS:
Cash and equivalents $ 1,107 $ 290 Receivables:Notes and accounts receivable (less allowance for bad debts of $157 and $131) 2,533 3,015 Unbilled work on uncompleted contracts 724 1,080
TOTAL RECEIVABLES 3,257 4,095 Inventories 734 787 Current deferred income taxes 200 154 Other current assets 262 247
TOTAL CURRENT ASSETS 5,560 5,573 Net property, plant and equipment 2,629 2,669 Equity in and advances to related companies 413 551 Goodwill 723 720 Noncurrent deferred income taxes 607 410 Insurance for asbestos and silica related liabilities 2,059 612 Other assets 853 431
TOTAL ASSETS $12,844 $10,966 LIABILITIES AND SHAREHOLDERS’ EQUITY
CURRENT LIABILITIES:
Short-term notes payable $ 49 $ 44 Current maturities of long-term debt 295 81 Accounts payable 1,077 917 Accrued employee compensation and benefits 370 357 Advance billings on uncompleted contracts 641 611 Deferred revenues 100 99 Income taxes payable 148 194 Other current liabilities 592 605
TOTAL CURRENT LIABILITIES 3,272 2,908 Long-term debt 1,181 1,403 Employee compensation and benefits 756 570 Asbestos and silica related liabilities 3,425 737 Other liabilities 581 555 Minority interest in consolidated subsidiaries 71 41
TOTAL LIABILITIES 9,286 6,214 SHAREHOLDERS’ EQUITY:
Common shares, par value $2.50 per share – authorized 600 shares,issued 456 and 455 shares 1,141 1,138
Paid-in capital in excess of par value 293 298 Deferred compensation (75) (87) Accumulated other comprehensive income (281) (236) Retained earnings 3,110 4,327
4,188 5,440 Less 20 and 21 shares of treasury stock, at cost 630 688
TOTAL SHAREHOLDERS’ EQUITY 3,558 4,752 TOTAL LIABILITIES AND SHAREHOLDERS’ EQUITY $12,844 $10,966
See notes to annual financial statements.
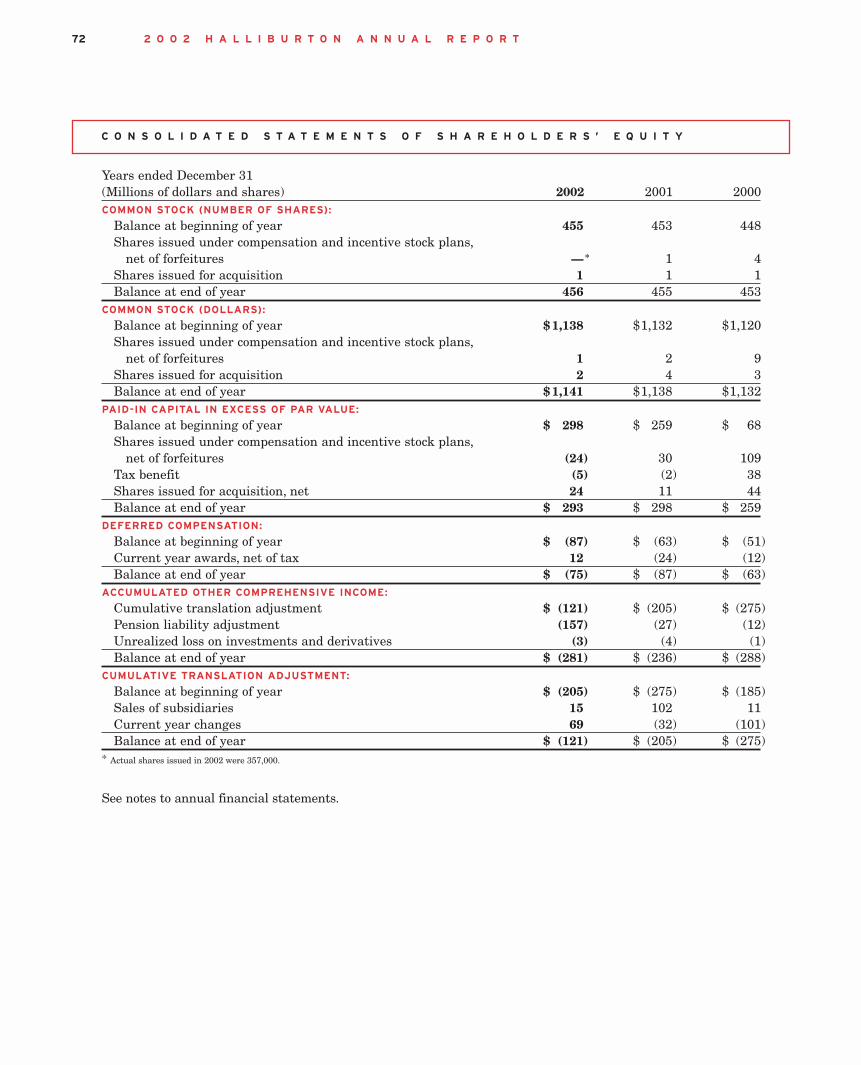
C O N S O L I D A T E D S T A T E M E N T S O F S H A R E H O L D E R S ’ E Q U I T Y
2 0 0 2 H A L L I B U R T O N A N N U A L R E P O R T 72
Years ended December 31(Millions of dollars and shares) 2002 2001 2000 COMMON STOCK (NUMBER OF SHARES):
Balance at beginning of year 455 453 448 Shares issued under compensation and incentive stock plans,
net of forfeitures —* 1 4 Shares issued for acquisition 1 1 1 Balance at end of year 456 455 453
COMMON STOCK (DOLLARS):
Balance at beginning of year $ 1,138 $1,132 $1,120 Shares issued under compensation and incentive stock plans,
net of forfeitures 1 2 9 Shares issued for acquisition 2 4 3 Balance at end of year $ 1,141 $1,138 $1,132
PAID-IN CAPITAL IN EXCESS OF PAR VALUE:
Balance at beginning of year $ 298 $ 259 $ 68 Shares issued under compensation and incentive stock plans,
net of forfeitures (24) 30 109 Tax benefit (5) (2) 38 Shares issued for acquisition, net 24 11 44 Balance at end of year $ 293 $ 298 $ 259
DEFERRED COMPENSATION:
Balance at beginning of year $ (87) $ (63) $ (51) Current year awards, net of tax 12 (24) (12) Balance at end of year $ (75) $ (87) $ (63)
ACCUMULATED OTHER COMPREHENSIVE INCOME:
Cumulative translation adjustment $ (121) $ (205) $ (275) Pension liability adjustment (157) (27) (12) Unrealized loss on investments and derivatives (3) (4) (1) Balance at end of year $ (281) $ (236) $ (288)
CUMULATIVE TRANSLATION ADJUSTMENT:
Balance at beginning of year $ (205) $ (275) $ (185) Sales of subsidiaries 15 102 11 Current year changes 69 (32) (101) Balance at end of year $ (121) $ (205) $ (275)
* Actual shares issued in 2002 were 357,000.
See notes to annual financial statements.
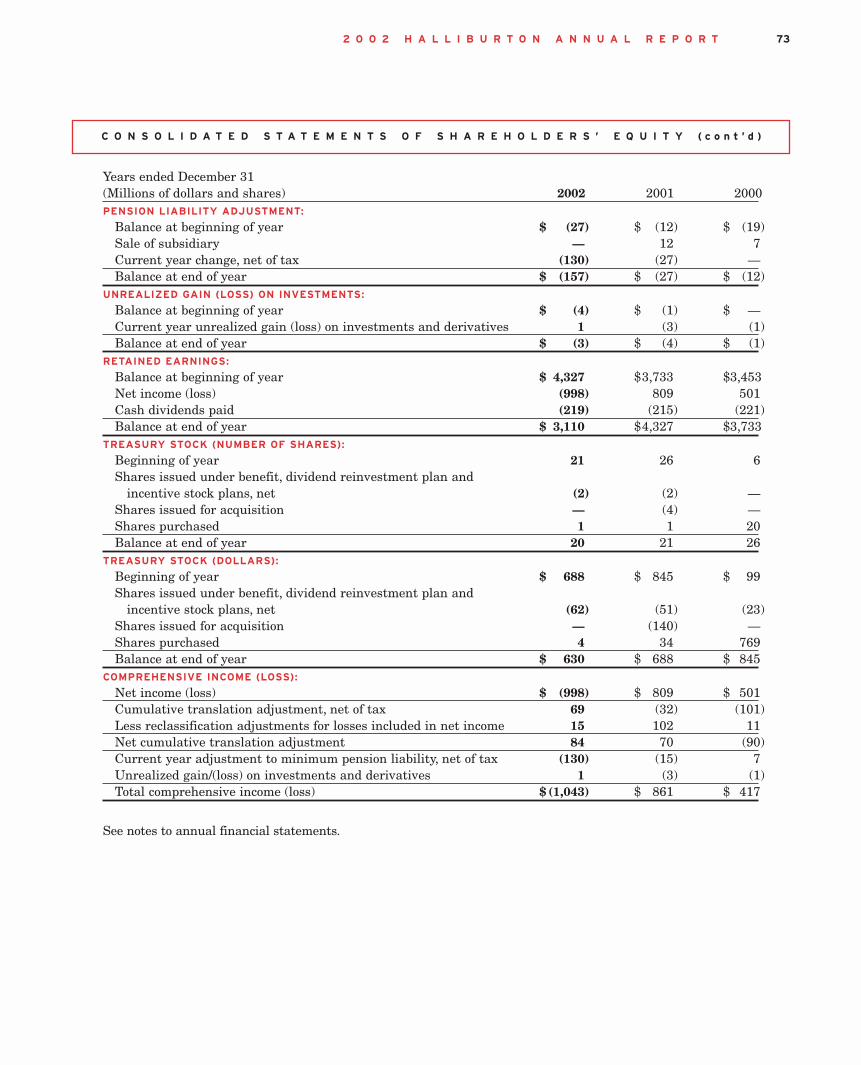
C O N S O L I D A T E D S T A T E M E N T S O F S H A R E H O L D E R S ’ E Q U I T Y ( c o n t ’ d )
732 0 0 2 H A L L I B U R T O N A N N U A L R E P O R T
Years ended December 31(Millions of dollars and shares) 2002 2001 2000 PENSION LIABILITY ADJUSTMENT:
Balance at beginning of year $ (27) $ (12) $ (19) Sale of subsidiary — 12 7 Current year change, net of tax (130) (27) — Balance at end of year $ (157) $ (27) $ (12)
UNREALIZED GAIN (LOSS) ON INVESTMENTS:
Balance at beginning of year $ (4) $ (1) $ — Current year unrealized gain (loss) on investments and derivatives 1 (3) (1) Balance at end of year $ (3) $ (4) $ (1)
RETAINED EARNINGS:
Balance at beginning of year $ 4,327 $3,733 $3,453 Net income (loss) (998) 809 501 Cash dividends paid (219) (215) (221) Balance at end of year $ 3,110 $4,327 $3,733
TREASURY STOCK (NUMBER OF SHARES):
Beginning of year 21 26 6 Shares issued under benefit, dividend reinvestment plan and
incentive stock plans, net (2) (2) — Shares issued for acquisition — (4) — Shares purchased 1 1 20 Balance at end of year 20 21 26
TREASURY STOCK (DOLLARS):
Beginning of year $ 688 $ 845 $ 99 Shares issued under benefit, dividend reinvestment plan and
incentive stock plans, net (62) (51) (23) Shares issued for acquisition — (140) — Shares purchased 4 34 769Balance at end of year $ 630 $ 688 $ 845
COMPREHENSIVE INCOME (LOSS):
Net income (loss) $ (998) $ 809 $ 501Cumulative translation adjustment, net of tax 69 (32) (101)Less reclassification adjustments for losses included in net income 15 102 11Net cumulative translation adjustment 84 70 (90)Current year adjustment to minimum pension liability, net of tax (130) (15) 7Unrealized gain/(loss) on investments and derivatives 1 (3) (1)Total comprehensive income (loss) $ (1,043) $ 861 $ 417
See notes to annual financial statements.

C O N S O L I D A T E D S T A T E M E N T S O F C A S H F L O W S
2 0 0 2 H A L L I B U R T O N A N N U A L R E P O R T 74
Years ended December 31(Millions of dollars) 2002 2001 2000 CASH FLOWS FROM OPERATING ACTIVITIES:
Net income (loss) $ (998) $ 809 $ 501 Adjustments to reconcile net income to net cash from operations:
Loss (income) from discontinued operations 652 (257) (313) Depreciation, depletion and amortization 505 531 503 Provision (benefit) for deferred income taxes (151) 26 (6) Distributions from (advances to) related companies, net of equity
in (earnings) losses 3 8 (64) Change in accounting method, net — (1) — Gain on sale of assets (22) — — Gain on option component of joint venture sale (3) — — Asbestos and silica related liabilities, net 588 96 4 Accrued special charges — (6) (63) Other non-cash items 101 (3) (22) Other changes, net of non-cash items:
Receivables and unbilled work on uncompleted contracts 675 (199) (896) Sale of receivables, net 180 — — Inventories 62 (91) 8 Accounts payable 71 118 170 Other working capital, net (78) 122 155 Other operating activities (23) (124) (34)
Total cash flows from operating activities 1,562 1,029 (57) CASH FLOWS FROM INVESTING ACTIVITIES:
Capital expenditures (764) (797) (578) Sales of property, plant and equipment 266 120 209 Acquisitions of businesses, net of cash acquired — (220) (10) Dispositions of businesses, net of cash disposed 170 61 19 Proceeds from sale of securities 62 — — Investments – restricted cash (187) 4 5 Other investing activities (20) (26) (56) Total cash flows from investing activities (473) (858) (411)
CASH FLOWS FROM FINANCING ACTIVITIES:
Proceeds from long-term borrowings 66 425 — Payments on long-term borrowings (81) (13) (308) (Repayments) borrowings of short-term debt, net (2) (1,528) 629 Payments of dividends to shareholders (219) (215) (221) Proceeds from exercises of stock options — 27 105 Payments to reacquire common stock (4) (34) (769) Other financing activities (8) (17) (20) Total cash flows from financing activities (248) (1,355) (584)
Effect of exchange rate changes on cash (24) (20) (9) Net cash flows from discontinued operations (1) — 1,263 826 Increase (decrease) in cash and equivalents 817 59 (235) Cash and equivalents at beginning of year 290 231 466 CASH AND EQUIVALENTS AT END OF YEAR $ 1,107 $ 290 $ 231 SUPPLEMENTAL DISCLOSURE OF CASH FLOW INFORMATION:
Cash payments during the year for:Interest $ 104 $ 132 $ 144 Income taxes $ 94 $ 382 $ 310
Non-cash investing and financing activities:Liabilities assumed in acquisitions of businesses $ — $ 92 $ 95 Liabilities disposed of in dispositions of businesses $ — $ 500 $ 499
(1) Net cash flows from discontinued operations in 2001 include proceeds of $1.27 billion from the sale of the remaining businesses in Dresser Equipment Group and in2000 proceeds of $913 million from the sales of Dresser-Rand in 2000 and Ingersoll-Dresser Pump in 1999. See Note 3.
See notes to annual financial statements.

N O T E S T O A N N U A L F I N A N C I A L S T A T E M E N T S
752 0 0 2 H A L L I B U R T O N A N N U A L R E P O R T
NOTE 1 .
S IGNIF ICANT ACCOUNTING POLICIES
We employ accounting policies that are in accordance with
accounting principles generally accepted in the United
States of America. The preparation of financial statements
in conformity with accounting principles generally accepted
in the United States of America requires us to make
estimates and assumptions that affect:
• the reported amounts of assets and liabilities anddisclosure of contingent assets and liabilities at the dateof the financial statements; and
• the reported amounts of revenues and expenses duringthe reporting period.
Ultimate results could differ from those estimates.
Descr ip t ion of Company. Halliburton Company’s
predecessor was established in 1919 and incorporated under
the laws of the State of Delaware in 1924. Halliburton
Company provides a variety of services, products,
maintenance, engineering and construction to energy,
industrial and governmental customers. We operate in two
business segments:
• Energy Services Group; and
• Engineering and Construction Group.
The Energy Services Group segment provides discrete
services and products and integrated solutions ranging from
the initial evaluation of producing formations to drilling,
completion, production and well maintenance. In addition,
the segment is the leading supplier of integrated exploration
and production software information systems as well as
professional and data management services for the upstream
oil and gas industry. The Engineering and Construction
Group segment, operating as KBR, provides a wide range of
services to energy and industrial customers and government
entities worldwide.
Pr inc ip les of conso l idat ion . The consolidated financial
statements include the accounts of our company and all of
our subsidiaries in which we own greater than 50% interest
or control. All material intercompany accounts and
transactions are eliminated. Investments in companies in
which we own a 50% interest or less and have a significant
influence are accounted for using the equity method and if
we do not have significant influence we use the cost method.
Prior year amounts have been reclassified to conform to the
current year presentation.
R e v e n u e r e c o g n i t i o n . We recognize revenues as
services are rendered or products are shipped. Generally the
date of shipment corresponds to the date upon which the
customer takes title to the product and assumes all risk and
rewards of ownership. The distinction between services
and product sales is based upon the overall activity of the
particular business operation. Training and consulting
service revenues are recognized as the services are performed.
Sales of perpetual software licenses, net of deferred
maintenance fees, are recorded as revenue upon shipment.
Sales of use licenses are recognized as revenue over the
license period. Post-contract customer support agreements
are recorded as deferred revenues and recognized as
revenue ratably over the contract period of generally one
year’s duration.
Eng ineer ing and construct ion contracts . Revenues
from engineering and construction contracts are reported on
the percentage of completion method of accounting using
measurements of progress toward completion appropriate
for the work performed. Progress is generally based upon
physical progress, man-hours or costs incurred based upon
the appropriate method for the type of job. When revenue
and costs are recorded from engineering and construction
contracts, we comply with paragraph 81 of American Institute
of Certified Public Accountants Statement of Position 81-1,
also known as SOP 81-1. Under this method, revenues are
recognized as the sum of costs incurred during the period
plus the gross profit earned, measured using the percentage
of completion method of accounting. All known or
anticipated losses on contracts are provided for when they
become evident in accordance with paragraph 85 of SOP
81-1. Claims and change orders which are in the process
of being negotiated with customers, for extra work or
changes in the scope of work, are included in revenue when
N O T E S T O A N N U A L F I N A N C I A L S T A T E M E N T S
2 0 0 2 H A L L I B U R T O N A N N U A L R E P O R T 76
collection is deemed probable. For more details of revenue
recognition, including other aspects of engineering and
construction accounting, including billings, claims and change
orders and liquidated damages, see Note 8 and Note 12.
Research and deve lopment . Research and development
expenses are charged to income as incurred. See Note 4
for research and development expense by business segment.
Software deve lopment costs . Costs of developing
software for sale are charged to expense when incurred, as
research and development, until technological feasibility
has been established for the product. Once technological
feasibility is established, software development costs are
capitalized until the software is ready for general release to
customers. We capitalized costs related to software
developed for resale of $11 million in 2002, $19 million in
2001 and $7 million in 2000. Amortization expense of
software development costs was $19 million for 2002, $16
million for 2001 and $12 million for 2000. Once the
software is ready for release, amortization of the software
development costs begins. Capitalized software
development costs are amortized over periods which do not
exceed five years.
I n c o m e p e r s h a re . Basic income per share is based
on the weighted average number of common shares
outstanding during the year. Diluted income per share
includes additional common shares that would have been
outstanding if potential common shares with a dilutive
effect had been issued. See Note 13 for a reconciliation of
basic and diluted income per share.
C a s h e q u i va l e n t s . We consider all highly liquid
investments with an original maturity of three months or
less to be cash equivalents.
I nventor ies . Inventories are stated at the lower of cost or
market. Cost represents invoice or production cost for new
items and original cost less allowance for condition for used
material returned to stock. Production cost includes
material, labor and manufacturing overhead. Some United
States manufacturing and field services finished products
and parts inventories for drill bits, completion products and
bulk materials are recorded using the last-in, first-out
method. The cost of over 90% of the remaining inventory is
recorded on the average cost method, with the remainder
on the first-in, first-out method. See Note 7.
Proper ty, p lant and equ ipment . Property, plant and
equipment are reported at cost less accumulated
depreciation, which is generally provided on the straight-
line method over the estimated useful lives of the assets.
Some assets are depreciated on accelerated methods.
Accelerated depreciation methods are also used for tax
purposes, wherever permitted. Upon sale or retirement of an
asset, the related costs and accumulated depreciation are
removed from the accounts and any gain or loss is
recognized. When events or changes in circumstances
indicate that assets may be impaired, an evaluation is
performed. The estimated future undiscounted cash flows
associated with the asset are compared to the asset’s
carrying amount to determine if a write-down to fair value
is required. We follow the successful efforts method of
accounting for oil and gas properties. See Note 9.
Maintenance and repa i rs . Expenditures for maintenance
and repairs are expensed; expenditures for renewals and
improvements are generally capitalized. We use the accrue-
in-advance method of accounting for major maintenance
and repair costs of marine vessel dry docking expense and
major aircraft overhauls and repairs. Under this method
we anticipate the need for major maintenance and repairs
and charge the estimated expense to operations before the
actual work is performed. At the time the work is
performed, the actual cost incurred is charged against the
amounts that were previously accrued with any deficiency
or excess charged or credited to operating expense.
Goodwi l l . For acquisitions occurring prior to July 1, 2001,
goodwill was amortized on a straight-line basis over periods
not exceeding 40 years through December 31, 2001.
Effective July 1, 2001, we adopted SFAS No. 141, “Business
Combinations” and SFAS No. 142, “Goodwill and Other
Intangible Assets”, which precludes amortization of goodwill
related to acquisitions completed subsequent to June 30,
2001. Additionally, SFAS No. 142 precludes the amortization
N O T E S T O A N N U A L F I N A N C I A L S T A T E M E N T S
772 0 0 2 H A L L I B U R T O N A N N U A L R E P O R T
of existing goodwill related to acquisitions completed prior
to July 1, 2001 for periods beginning January 1, 2002. See
Note 22 for discussion of this accounting change. SFAS No.
142 requires an entity to segregate its operations into
“reporting units,” which we have determined to be the same
as our reportable operating segments, or the Energy
Services Group and Engineering and Construction Group.
Additionally, all goodwill has been assigned to one of these
reporting units for purposes of determining impairment of
the goodwill. Because goodwill and some intangible assets
are no longer amortized, the reported amounts of goodwill
and intangible assets are reviewed for impairment on an
annual basis and more frequently when negative conditions
such as significant current or projected operating losses
exist. The annual impairment test is a two-step process and
involves comparing the estimated fair value of each
reporting unit to the reporting unit’s carrying value, including
goodwill. If the fair value of a reporting unit exceeds its
carrying amount, goodwill of the reporting unit is not
considered impaired, and the second step of the impairment
test is unnecessary. If the carrying amount of a reporting
unit exceeds its fair value, the second step of the goodwill
impairment test would be performed to measure the amount
of impairment loss to be recorded, if any.
I n c o m e t a x e s . Deferred tax assets and liabilities are
recognized for the expected future tax consequences of
events that have been recognized in the financial statements
or tax returns. A valuation allowance is provided for
deferred tax assets if it is more likely than not that these
items will either expire before we are able to realize their
benefit, or that future deductibility is uncertain.
D e r i va t i ve i n s t r u m e n t s . We enter into derivative
financial transactions to hedge existing or projected exposures
to changing foreign currency exchange rates, interest rates
and commodity prices. We do not enter into derivative
transactions for speculative or trading purposes. Effective
January 1, 2001, we adopted SFAS No. 133 “Accounting
for Derivative Instruments and Hedging Activities.” SFAS
No. 133 requires that we recognize all derivatives on the
balance sheet at fair value. Derivatives that are not hedges
must be adjusted to fair value and reflected immediately
through the results of operations. If the derivative is
designated as a hedge under SFAS No. 133, depending on
the nature of the hedge, changes in the fair value of
derivatives are either offset against:
• the change in fair value of the hedged assets, liabilities orfirm commitments through earnings; or
• recognized in other comprehensive income until thehedged item is recognized in earnings.
The ineffective portion of a derivative’s change in fair
value is immediately recognized in earnings. Recognized
gains or losses on derivatives entered into to manage foreign
exchange risk are included in foreign currency gains and
losses on the consolidated statements of operations. Gains or
losses on interest rate derivatives are included in interest
expense and gains or losses on commodity derivatives are
included in operating income. During the three years ended
December 31, 2002, we did not enter into any significant
transactions to hedge commodity prices. See Note 11 for
discussion of interest rate swaps and Note 19 for further
discussion of foreign currency exchange derivatives.
Fo re i g n c u r re n cy t ra n s l a t i o n . Foreign entities whose
functional currency is the United States dollar translate
monetary assets and liabilities at year-end exchange rates,
and non-monetary items are translated at historical rates.
Income and expense accounts are translated at the average
rates in effect during the year, except for depreciation, cost
of product sales and revenues, and expenses associated with
non-monetary balance sheet accounts which are translated
at historical rates. Gains or losses from changes in exchange
rates are recognized in consolidated income in the year of
occurrence. Foreign entities whose functional currency is the
local currency translate net assets at year-end rates and
income and expense accounts at average exchange rates.
Adjustments resulting from these translations are reflected
in the consolidated statements of shareholders’ equity under
“Cumulative translation adjustment”.
2 0 0 2 H A L L I B U R T O N A N N U A L R E P O R T 78
N O T E S T O A N N U A L F I N A N C I A L S T A T E M E N T S
L o s s c o n t i n g e n c i e s . We accrue for loss contingencies
based upon our best estimates in accordance with SFAS
No. 5, “Accounting for Contingencies”. See Note 12 for
discussion of our significant loss contingencies.
Stock-Based Compensat ion . At December 31, 2002, we
have six stock-based employee compensation plans, which are
described more fully in Note 17. We account for those plans
under the recognition and measurement principles of APB
Opinion No. 25, “Accounting for Stock Issued to Employees”,
and related Interpretations. No cost for stock options granted
is reflected in net income, as all options granted under our
plans have an exercise price equal to the market value of the
underlying common stock on the date of grant.
The fair value of options at the date of grant was estimated
using the Black-Scholes option pricing model. The weighted
average assumptions and resulting fair values of options
granted are as follows:
AssumptionsWeighted
Average FairRisk-Free Expected Expected Value ofInterest Dividend Life Expected Options
Rate Yield (in years) Volatility Granted
2002 2.9% 2.7% 5 63% $ 6.892001 4.5% 2.3% 5 58% $19.112000 5.2% 1.3% 5 54% $21.57
The following table illustrates the effect on net income
and earnings per share if we had applied the fair value
recognition provisions of FASB Statement No. 123,
“Accounting for Stock-Based Compensation”, to stock-based
employee compensation.
Years ended December 31 Millions of dollars except per share data 2002 2001 2000
Net income (loss), as reported $ (998) $ 809 $ 501 Total stock-based employee compensation
expense determined under fair value based method for all awards, net of related tax effects (26) (42) (41)
Net income (loss), pro forma $(1,024) $ 767 $ 460 Basic earnings (loss) per share:As reported $ (2.31) $1.89 $1.13 Pro forma $ ( 2.37) $1.79 $1.04 Diluted earnings (loss) per share:As reported $ ( 2.31) $1.88 $1.12 Pro forma $ ( 2.37) $1.77 $1.03
NOTE 2 .
ACQUISIT IONS AND DISPOSIT IONS
Magic Ear th acqu is i t ion . We acquired Magic Earth, Inc., a
3-D visualization and interpretation technology company
with broad applications in the area of data interpretation in
November 2001 for common shares with a value of $100
million. At the consummation of the transaction, we issued
4.2 million shares, valued at $23.93 per share, to complete
the purchase. Magic Earth became a wholly-owned
subsidiary and is reported within our Energy Services
Group segment. We recorded goodwill of $71 million, all of
which is nondeductible for tax purposes. In addition, we
recorded intangible assets of $19 million, which are being
amortized based on a five-year life.
PES acqu is i t ion . In February 2000, we acquired the
remaining 74% of the shares of PES (International) Limited
that we did not already own for a value of $126.7 million.
This was based on 3.3 million shares of Halliburton common
stock valued at $37.75 per share which was the closing stock
price on January 12, 2000. PES is based in Aberdeen,
Scotland, and has developed technology that complements
Halliburton Energy Services’ real time reservoir solutions.
To acquire the remaining 74% of PES, we issued 1.2 million
shares of Halliburton common stock in February 2002, and
we also issued rights that resulted in the issuance of 2.1
million additional shares of Halliburton common stock
between February 2001 and February 2002. We issued 1
million shares in February 2001; 400,000 shares in June
2001; and the remaining 700,000 shares in February 2002
under these rights. These shares were included in the
cost of the acquisition as a contingent liability. We recorded
$115 million of goodwill, all of which is non-deductible
for tax purposes.
During the second quarter of 2001, we contributed the
majority of PES’ assets and technologies, including $130
million of goodwill associated with the purchase of PES, to a
newly formed joint venture with Shell Technology Ventures
BV, WellDynamics. We received $39 million in cash as an
equity equalization adjustment, which we recorded as a

792 0 0 2 H A L L I B U R T O N A N N U A L R E P O R T
N O T E S T O A N N U A L F I N A N C I A L S T A T E M E N T S
reduction in our investment in the joint venture. We own
50% of WellDynamics and account for this investment using
the equity method. The formation of WellDynamics resulted
in a difference of $90 million between the carrying amount
of our investment and our equity in the underlying net assets
of the joint venture, which has been recorded as goodwill
under “Equity in and advances to related companies”. The
remaining assets and goodwill of PES relating to completions
and well intervention products have been combined with our
existing completion products product service line.
PGS Data Management acqu is i t ion . In March 2001, we
acquired the PGS Data Management division of Petroleum
Geo-Services ASA (PGS) for $164 million in cash. The
acquisition agreement also calls for Landmark to provide, for
a fee, strategic data management and distribution services
to PGS for three years from the date of acquisition. We
recorded intangible assets of $14 million and goodwill of $149
million in our Energy Services Group segment, $9 million of
which is non-deductible for tax purposes. The intangible
assets are being amortized based on a three-year life.
European Mar ine Contractors Ltd . d i spos i t ion . In
January 2002, we sold our 50% interest in European Marine
Contractors Ltd., an unconsolidated joint venture reported
within our Energy Services Group, to our joint venture
partner, Saipem. At the date of sale, we received $115 million
in cash and a contingent payment option valued at $16
million resulting in a pretax operating income gain of $108
million. The contingent payment option was based on a
formula linked to performance of the Oil Service Index. In
February 2002, we exercised our option receiving an
additional $19 million and recorded a pretax gain of $3
million in “Other, net” in the statement of operations as a
result of the increase in value of this option. The total
transaction resulted in an after-tax gain of $68 million, or
$0.16 per diluted share.
Subsea 7 format ion . In May 2002, we contributed
substantially all of our Halliburton Subsea assets to a newly
formed company, Subsea 7, Inc. We contributed assets with a
book value of approximately $82 million. The contributed
assets were recorded by the new company at a fair value of
approximately $94 million. The $12 million difference is
being amortized over ten years representing the average
remaining useful life of the assets contributed. We own 50%
of Subsea 7 and account for this investment using the equity
method. The remaining 50% is owned by DSND Subsea ASA.
Bredero-Shaw d ispos i t ion . On September 30, 2002 we
sold our 50% interest in the Bredero-Shaw joint venture to
our partner ShawCor Ltd. The purchase price of $149
million is comprised of $53 million in cash, a short-term
note for $25 million and 7.7 million of ShawCor Class A
Subordinate shares. In addition to our second quarter
impairment charge of $61 million ($0.14 per diluted share
after-tax) related to the pending sale of Bredero-Shaw, we
recorded a third quarter pretax loss on sale of $18 million,
or $0.04 per diluted share. Included in this loss was $15
million of cumulative translation adjustment loss which was
realized upon the disposition of our investment in Bredero-
Shaw. During the 2002 fourth quarter, we recorded in “Other,
net” a $9.1 million loss on the sale of ShawCor shares, or
$0.02 per diluted share.
Dresser Equ ipment Group d i spos i t ion . In April 2001,
we disposed of the remaining businesses in the Dresser
Equipment Group. See Note 3.
NOTE 3.
D ISCONTINUED OPERATIONS
For the twelve months ended December 31, 2002, we
recorded a $806 million pretax charge in discontinued
operations. The $806 million charge is primarily comprised
of the following:
• a $567 million charge during the fourth quarter due toa revision of our best estimate of our asbestos and silicaliability based upon knowledge gained throughout thedevelopment of the agreement in principle for ourproposed global settlement. The charge consisted of $1,047million related to the asbestos and silica claims grossliability, which was offset by $480 million in anticipatedrelated insurance recoveries;
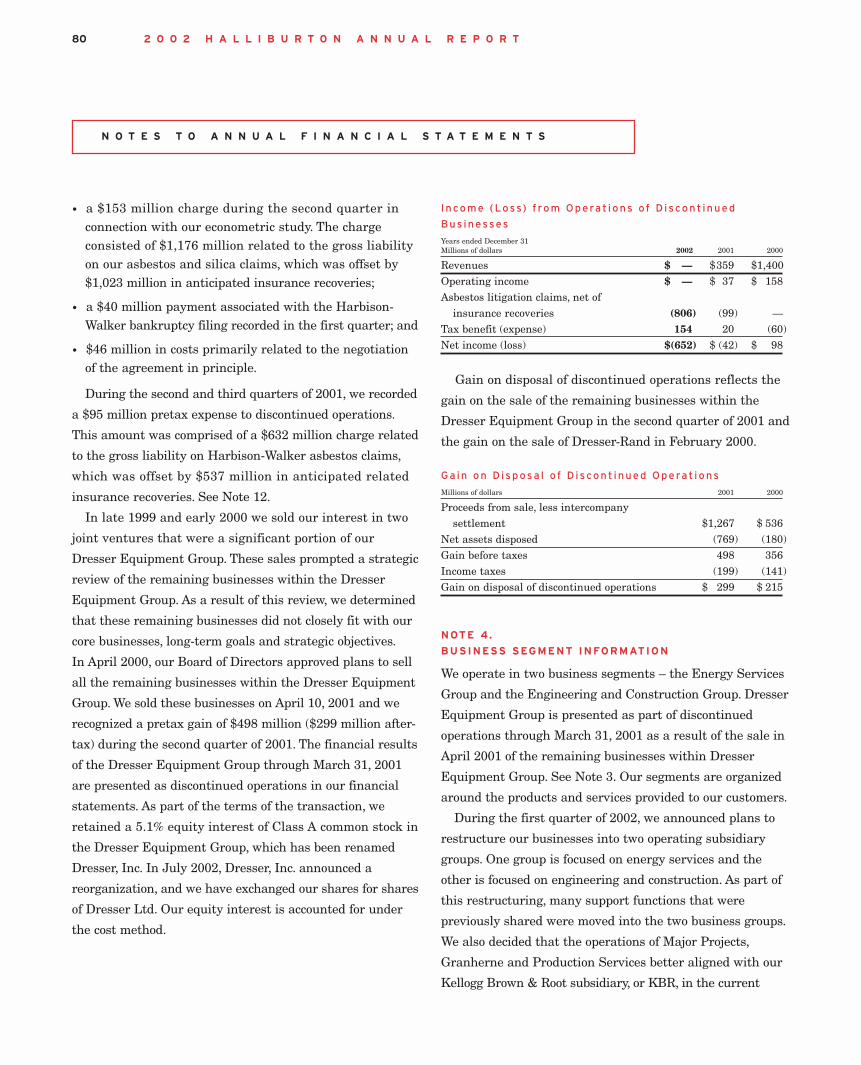
N O T E S T O A N N U A L F I N A N C I A L S T A T E M E N T S
2 0 0 2 H A L L I B U R T O N A N N U A L R E P O R T 80
• a $153 million charge during the second quarter inconnection with our econometric study. The chargeconsisted of $1,176 million related to the gross liabilityon our asbestos and silica claims, which was offset by$1,023 million in anticipated insurance recoveries;
• a $40 million payment associated with the Harbison-Walker bankruptcy filing recorded in the first quarter; and
• $46 million in costs primarily related to the negotiationof the agreement in principle.
During the second and third quarters of 2001, we recorded
a $95 million pretax expense to discontinued operations.
This amount was comprised of a $632 million charge related
to the gross liability on Harbison-Walker asbestos claims,
which was offset by $537 million in anticipated related
insurance recoveries. See Note 12.
In late 1999 and early 2000 we sold our interest in two
joint ventures that were a significant portion of our
Dresser Equipment Group. These sales prompted a strategic
review of the remaining businesses within the Dresser
Equipment Group. As a result of this review, we determined
that these remaining businesses did not closely fit with our
core businesses, long-term goals and strategic objectives.
In April 2000, our Board of Directors approved plans to sell
all the remaining businesses within the Dresser Equipment
Group. We sold these businesses on April 10, 2001 and we
recognized a pretax gain of $498 million ($299 million after-
tax) during the second quarter of 2001. The financial results
of the Dresser Equipment Group through March 31, 2001
are presented as discontinued operations in our financial
statements. As part of the terms of the transaction, we
retained a 5.1% equity interest of Class A common stock in
the Dresser Equipment Group, which has been renamed
Dresser, Inc. In July 2002, Dresser, Inc. announced a
reorganization, and we have exchanged our shares for shares
of Dresser Ltd. Our equity interest is accounted for under
the cost method.
I ncome (Loss) f rom Operat ions of D iscont inued
Bus inesses
Years ended December 31 Millions of dollars 2002 2001 2000
Revenues $ — $359 $1,400 Operating income $ — $ 37 $ 158 Asbestos litigation claims, net of
insurance recoveries (806) (99) — Tax benefit (expense) 154 20 (60) Net income (loss) $(652) $ (42) $ 98
Gain on disposal of discontinued operations reflects the
gain on the sale of the remaining businesses within the
Dresser Equipment Group in the second quarter of 2001 and
the gain on the sale of Dresser-Rand in February 2000.
Ga in on D isposa l of D iscont inued Operat ions
Millions of dollars 2001 2000
Proceeds from sale, less intercompany settlement $1,267 $ 536
Net assets disposed (769) (180) Gain before taxes 498 356 Income taxes (199) (141) Gain on disposal of discontinued operations $ 299 $ 215
NOTE 4.
BUSINESS SEGMENT INFORMATION
We operate in two business segments – the Energy Services
Group and the Engineering and Construction Group. Dresser
Equipment Group is presented as part of discontinued
operations through March 31, 2001 as a result of the sale in
April 2001 of the remaining businesses within Dresser
Equipment Group. See Note 3. Our segments are organized
around the products and services provided to our customers.
During the first quarter of 2002, we announced plans to
restructure our businesses into two operating subsidiary
groups. One group is focused on energy services and the
other is focused on engineering and construction. As part of
this restructuring, many support functions that were
previously shared were moved into the two business groups.
We also decided that the operations of Major Projects,
Granherne and Production Services better aligned with our
Kellogg Brown & Root subsidiary, or KBR, in the current

N O T E S T O A N N U A L F I N A N C I A L S T A T E M E N T S
812 0 0 2 H A L L I B U R T O N A N N U A L R E P O R T
business environment. These businesses were moved for
management and reporting purposes from the Energy
Services Group segment to the Engineering and Construction
Group segment during the second quarter of 2002. Major
Projects, which consisted of the Barracuda-Caratinga project
in Brazil, is now reported through the Offshore Operations
product line, Granherne is now reported in the Onshore
product line, and Production Services is now reported under
the Operations and Maintenance product line.
In addition, during the fourth quarter of 2000, we
combined all engineering, construction, fabrication and
project management operations into one segment, reporting
as our Engineering and Construction Group. This
restructuring resulted in some activities moving from the
Energy Services Group to the Engineering and Construction
Group, effective January 1, 2001.
All prior period segment results have been restated to
reflect these changes.
E n e r g y S e r v i c e s G r o u p . The Energy Services Group
provides a wide range of discrete services and products and
integrated solutions to customers for the exploration,
development, and production of oil and gas. The customers
for this segment are major, national and independent oil and
gas companies. This segment consists of:
• Halliburton Energy Services provides oilfield services andproducts including discrete products and services andintegrated solutions ranging from the initial evaluationof producing formations to drilling, completion,production and well maintenance. Products and servicesinclude pressure pumping equipment and services,logging and perforating, drilling systems and services,drilling fluids systems, drill bits, specialized completionand production equipment and services, well control andintegrated solutions;
• Landmark Graphics provides integrated exploration andproduction software information systems, datamanagement services, and professional services for theupstream oil and gas industry; and
• Other product service lines provide installation andservicing of subsea facilities and pipelines. In January2002, we sold to Saipem, our joint venture partner, our50% interest in European Marine Contractors Ltd., ajoint venture that provided pipeline services for offshorecustomers. In May 2002, we contributed substantiallyall of our Halliburton Subsea assets to a newly formedcompany, Subsea 7, Inc. We own 50% of Subsea 7, Inc.and DSND Subsea ASA owns the other 50%. InSeptember 2002, we sold our 50% interest in Bredero-Shaw, a pipecoating joint venture, to our partnerShawCor Ltd. See Note 2.
E n g i n e e r i n g a n d C o n s t r u c t i o n G r o u p . The
Engineering and Construction Group provides engineering,
procurement, construction, project management, and
facilities operation and maintenance for oil and gas and
other industrial and governmental customers. The
Engineering and Construction Group, operating as KBR,
offers the following five product lines:
• Onshore operations consist of engineering and constructionactivities, including engineering and construction ofliquefied natural gas, ammonia and crude oil refineriesand natural gas plants;
• Offshore operations include specialty offshore deepwaterengineering and marine technology and worldwidefabrication capabilities;
• Government operations provide operations, construction,maintenance and logistics activities for governmentfacilities and installations;
• Operations and maintenance services include plantoperations, maintenance, and start-up services for bothupstream and downstream oil, gas and petrochemicalfacilities as well as operations, maintenance and logisticsservices for the power, commercial and industrialmarkets; and
• Infrastructure provides civil engineering, consulting andproject management services.

N O T E S T O A N N U A L F I N A N C I A L S T A T E M E N T S
2 0 0 2 H A L L I B U R T O N A N N U A L R E P O R T 82
Genera l corporate. General corporate represents assets
not included in a business segment and is primarily
composed of cash and cash equivalents, deferred tax assets
and insurance for asbestos and silica litigation claims.
Intersegment revenues included in the revenues of the
business segments and revenues between geographic areas
are immaterial. Our equity in pretax earnings and losses of
unconsolidated affiliates that are accounted for on the
equity method is included in revenues and operating income
of the applicable segment.
The tables below present information on our continuing
operations business segments.
Operat ions by Bus iness Segment
Years ended December 31 Millions of dollars 2002 2001 2000
REVENUES:
Energy Services Group $ 6,836 $ 7,811 $ 6,233Engineering and Construction Group 5,736 5,235 5,711 Total $12,572 $13,046 $11,944
OPERATING INCOME (LOSS) :
Energy Services Group $ 638 $ 1,036 $ 589 Engineering and Construction Group (685) 111 (54) General corporate (65) (63) (73) Total $ (112) $ 1,084 $ 462
CAPITAL EXPENDITURES:
Energy Services Group $ 603 $ 743 $ 533 Engineering and Construction Group 161 54 44 General corporate — — 1 Total $ 764 $ 797 $ 578
DEPRECIATION, DEPLETION AND AMORTIZATION:
Energy Services Group $ 475 $ 474 $ 435 Engineering and Construction Group 29 56 65 General corporate 1 1 3 Total $ 505 $ 531 $ 503
TOTAL ASSETS :
Energy Services Group $ 5,944 $ 6,564 $ 5,964 Engineering and Construction Group 3,104 3,187 2,885 Net assets of discontinued operations — — 690 General corporate 3,796 1,215 653 Total $12,844 $10,966 $10,192
RESEARCH AND DEVELOPMENT:
Energy Services Group $ 228 $ 226 $ 224 Engineering and Construction Group 5 7 7 Total $ 233 $ 233 $ 231
Operat ions by Geograph ic Area
Years ended December 31 Millions of dollars 2002 2001 2000
REVENUES:
United States $ 4,139 $ 4,911 $ 4,073 United Kingdom 1,521 1,800 1,512 Other areas (numerous countries) 6,912 6,335 6,359 Total $12,572 $13,046 $11,944
LONG-L IVED ASSETS :
United States $ 4,617 $ 3,030 $ 2,068 United Kingdom 691 617 525 Other areas (numerous countries) 711 744 776 Total $ 6,019 $ 4,391 $ 3,369
NOTE 5.
RESTRICTED CASH
At December 31, 2002, we had restricted cash of $190 million
included in “Other assets”. Restricted cash consists of:
• $107 million deposit that collateralizes a bond for apatent infringement judgment on appeal;
• $57 million as collateral for potential future insuranceclaim reimbursements; and
• $26 million primarily related to cash collateralagreements for outstanding letters of credit for variousconstruction projects.
At December 31, 2001, we had $3 million of restricted
cash in “Other assets”.
NOTE 6 .
RECEIVABLES
Our receivables are generally not collateralized. Included in
notes and accounts receivable are notes with varying
interest rates totaling $53 million at December 31, 2002 and
$19 million at December 31, 2001.
On April 15, 2002, we entered into an agreement to sell
accounts receivable to a bankruptcy-remote limited-purpose
funding subsidiary. Under the terms of the agreement, new
receivables are added on a continuous basis to the pool of
receivables, and collections reduce previously sold accounts
receivable. This funding subsidiary sells an undivided
ownership interest in this pool of receivables to entities
managed by unaffiliated financial institutions under

832 0 0 2 H A L L I B U R T O N A N N U A L R E P O R T
N O T E S T O A N N U A L F I N A N C I A L S T A T E M E N T S
another agreement. Sales to the funding subsidiary have
been structured as “true sales” under applicable bankruptcy
laws, and the assets of the funding subsidiary are not
available to pay any creditors of Halliburton or of its
subsidiaries or affiliates, until such time as the agreement
with the unaffiliated companies is terminated following
sufficient collections to liquidate all outstanding undivided
ownership interests. The funding subsidiary retains the
interest in the pool of receivables that are not sold to the
unaffiliated companies, and is fully consolidated and
reported in our financial statements.
The amount of undivided interests, which can be sold
under the program, varies based on the amount of eligible
Energy Services Group receivables in the pool at any given
time and other factors. The funding subsidiary sold a $200
million undivided ownership interest to the unaffiliated
companies, and may from time to time sell additional
undivided ownership interests. No additional amounts were
received from our accounts receivable facility since the
second quarter of 2002. The total amount outstanding under
this facility was $180 million as of December 31, 2002. We
continue to service, administer and collect the receivables on
behalf of the purchaser. The amount of undivided ownership
interest in the pool of receivables sold to the unaffiliated
companies is reflected as a reduction of accounts receivable
in our consolidated balance sheet and as an increase
in cash flows from operating activities in our consolidated
statement of cash flows.
NOTE 7.
INVENTORIES
Inventories are stated at the lower of cost or market. Some
United States manufacturing and field service finished
products and parts inventories for drill bits, completion
products and bulk materials are recorded using the last-in,
first-out method, totaling $43 million at December 31, 2002
and $54 million at December 31, 2001. If the average cost
method had been used, total inventories would have been
$17 million higher than reported at December 31, 2002 and
$20 million higher than reported at December 31, 2001.
Over 90% of remaining inventory is recorded on the
average cost method, with the remainder on the first-in,
first-out method.
Inventories at December 31, 2002 and December 31, 2001
are composed of the following:
December 31 Millions of dollars 2002 2001
Finished products and parts $545 $520 Raw materials and supplies 141 192 Work in process 48 75 Total $734 $787
NOTE 8 .
UNAPPROVED CLAIMS AND LONG-TERM
CONSTRUCTION CONTRACTS
Billing practices for engineering and construction projects
are governed by the contract terms of each project based
upon costs incurred, achievement of milestones or pre-agreed
schedules. Billings do not necessarily correlate with revenues
recognized under the percentage of completion method of
accounting. Billings in excess of recognized revenues are
recorded in “Advance billings on uncompleted contracts”.
When billings are less than recognized revenues, the
difference is recorded in “Unbilled work on uncompleted
contracts”. With the exception of claims and change orders
which are in the process of being negotiated with customers,
unbilled work is usually billed during normal billing pro-
cesses following achievement of the contractual requirements.
Recording of profits and losses on long-term contracts
requires an estimate of the total profit or loss over the life of
each contract. This estimate requires consideration of
contract revenue, change orders and claims reduced by costs
incurred and estimated costs to complete. Anticipated losses
on contracts are recorded in full in the period they become
evident. Profits are recorded based upon the total estimated
contract profit multiplied by the current percentage
complete for the contract.
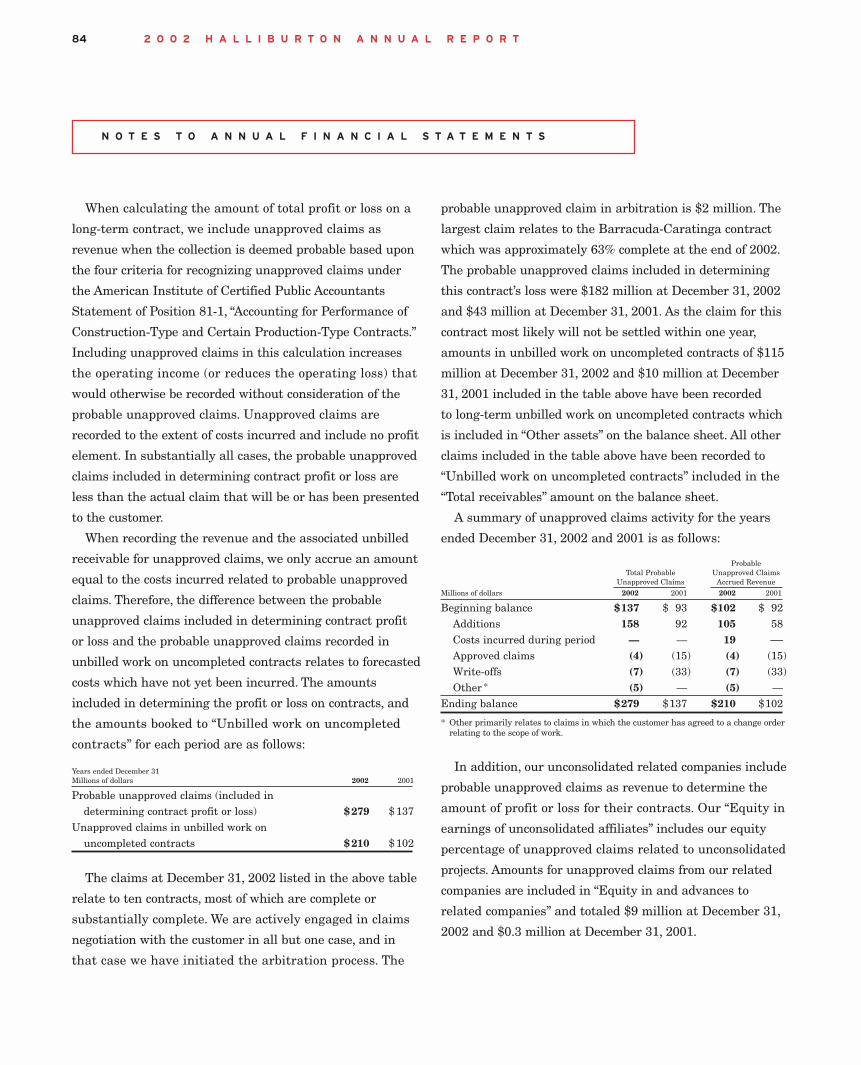
N O T E S T O A N N U A L F I N A N C I A L S T A T E M E N T S
2 0 0 2 H A L L I B U R T O N A N N U A L R E P O R T 84
When calculating the amount of total profit or loss on a
long-term contract, we include unapproved claims as
revenue when the collection is deemed probable based upon
the four criteria for recognizing unapproved claims under
the American Institute of Certified Public Accountants
Statement of Position 81-1, “Accounting for Performance of
Construction-Type and Certain Production-Type Contracts.”
Including unapproved claims in this calculation increases
the operating income (or reduces the operating loss) that
would otherwise be recorded without consideration of the
probable unapproved claims. Unapproved claims are
recorded to the extent of costs incurred and include no profit
element. In substantially all cases, the probable unapproved
claims included in determining contract profit or loss are
less than the actual claim that will be or has been presented
to the customer.
When recording the revenue and the associated unbilled
receivable for unapproved claims, we only accrue an amount
equal to the costs incurred related to probable unapproved
claims. Therefore, the difference between the probable
unapproved claims included in determining contract profit
or loss and the probable unapproved claims recorded in
unbilled work on uncompleted contracts relates to forecasted
costs which have not yet been incurred. The amounts
included in determining the profit or loss on contracts, and
the amounts booked to “Unbilled work on uncompleted
contracts” for each period are as follows:
Years ended December 31 Millions of dollars 2002 2001
Probable unapproved claims (included indetermining contract profit or loss) $279 $137
Unapproved claims in unbilled work onuncompleted contracts $210 $102
The claims at December 31, 2002 listed in the above table
relate to ten contracts, most of which are complete or
substantially complete. We are actively engaged in claims
negotiation with the customer in all but one case, and in
that case we have initiated the arbitration process. The
probable unapproved claim in arbitration is $2 million. The
largest claim relates to the Barracuda-Caratinga contract
which was approximately 63% complete at the end of 2002.
The probable unapproved claims included in determining
this contract’s loss were $182 million at December 31, 2002
and $43 million at December 31, 2001. As the claim for this
contract most likely will not be settled within one year,
amounts in unbilled work on uncompleted contracts of $115
million at December 31, 2002 and $10 million at December
31, 2001 included in the table above have been recorded
to long-term unbilled work on uncompleted contracts which
is included in “Other assets” on the balance sheet. All other
claims included in the table above have been recorded to
“Unbilled work on uncompleted contracts” included in the
“Total receivables” amount on the balance sheet.
A summary of unapproved claims activity for the years
ended December 31, 2002 and 2001 is as follows:
Probable Total Probable Unapproved Claims
Unapproved Claims Accrued RevenueMillions of dollars 2002 2001 2002 2001
Beginning balance $137 $ 93 $102 $ 92 Additions 158 92 105 58Costs incurred during period — — 19 —Approved claims (4) (15) (4) (15)Write-offs (7) (33) (7) (33)Other * (5) — (5) —
Ending balance $279 $137 $210 $102
* Other primarily relates to claims in which the customer has agreed to a change order relating to the scope of work.
In addition, our unconsolidated related companies include
probable unapproved claims as revenue to determine the
amount of profit or loss for their contracts. Our “Equity in
earnings of unconsolidated affiliates” includes our equity
percentage of unapproved claims related to unconsolidated
projects. Amounts for unapproved claims from our related
companies are included in “Equity in and advances to
related companies” and totaled $9 million at December 31,
2002 and $0.3 million at December 31, 2001.

N O T E S T O A N N U A L F I N A N C I A L S T A T E M E N T S
852 0 0 2 H A L L I B U R T O N A N N U A L R E P O R T
NOTE 9.
PROPERTY, PLANT AND EQUIPMENT
Property, plant and equipment at December 31, 2002 and
2001 are composed of the following:
Millions of dollars 2002 2001
Land $ 86 $ 82 Buildings and property improvements 1,024 942 Machinery, equipment and other 4,842 4,926 Total 5,952 5,950 Less accumulated depreciation 3,323 3,281 Net property, plant and equipment $2,629 $2,669
Buildings and property improvements are depreciated
over 5-40 years; machinery, equipment and other are
depreciated over 3-25 years.
Machinery, equipment and other includes oil and gas
investments of $356 million at December 31, 2002 and
$423 million at December 31, 2001.
NOTE 10.
RELATED COMPANIES
We conduct some of our operations through various joint
ventures which are in partnership, corporate and other
business forms, and are principally accounted for using the
equity method. Financial information pertaining to related
companies for our continuing operations is set out below.
This information includes the total related company
balances and not our proportional interest in those balances.
Our larger unconsolidated entities include Subsea 7,
Inc., a 50% owned subsidiary, formed in May of 2002 and
the partnerships created to construct the Alice Springs
to Darwin rail line in Australia. During 2002, we sold our
50% interest in European Marine Contractors and
Bredero-Shaw. See Note 2.
Combined summarized financial information for all jointly
owned operations that are not consolidated is as follows:
Combined Operat ing Resu l ts
Years ended December 31 Millions of dollars 2002 2001 2000
Revenues $1,948 $1,987 $3,098 Operating income $ 200 $ 231 $ 192 Net income $ 159 $ 169 $ 169
Combined F inanc ia l Pos i t ion
December 31 Millions of dollars 2002 2001
Current assets $1,404 $1,818 Noncurrent assets 1,876 1,672 Total $3,280 $3,490 Current liabilities $1,155 $1,522 Noncurrent liabilities 1,367 1,272 Minority interests — 2 Shareholders’ equity 758 694 Total $3,280 $3,490
NOTE 1 1 .
L INES OF CREDIT, NOTES PAYABLE AND
LONG-TERM DEBT
At December 31, 2002, we had committed lines of credit
totaling $350 million which expire in August 2006. There
were no borrowings outstanding under these lines of credit.
These lines are not available if our senior unsecured
long-term debt is rated lower than BBB- by Standard &
Poor’s Ratings Service Group or lower than Baa3 by
Moody’s Investors’ Services. Fees for committed lines of
credit were immaterial.
Short-term debt at December 31, 2002 consists primarily
of $37 million in overdraft facilities and $12 million of other
facilities with varying rates of interest.
Long-term debt at the end of 2002 and 2001 consists of
the following:
Millions of dollars 2002 2001
7.6% debentures due August 2096 $ 300 $ 300 8.75% debentures due February 2021 200 200 8% senior notes due April 2003 139 139 Variable interest credit facility maturing
September 2009 66 — Medium-term notes due 2002 through 2027 750 825 Effect of interest rate swaps 13 3 Term loans at LIBOR (GBP) plus 0.75% payable in
semiannual installments through March 2002 — 4 Other notes with varying interest rates 8 13 Total long-term debt 1,476 1,484 Less current portion 295 81 Noncurrent portion of long-term debt $1,181 $1,403
The 7.6% debentures due 2096, 8.75% debentures due
2021, and 8% senior notes due 2003 may not be redeemed
prior to maturity and do not have sinking fund requirements.

N O T E S T O A N N U A L F I N A N C I A L S T A T E M E N T S
2 0 0 2 H A L L I B U R T O N A N N U A L R E P O R T 86
In the fourth quarter of 2002, our 51% owned and
consolidated subsidiary, Devonport Management Limited
(DML), signed an agreement for a credit facility of £80
million ($126 million as of December 31, 2002) maturing
in September 2009. This credit facility has a variable
interest rate that was equal to 5.375% on December 31,
2002. There are various financial covenants which must
be maintained by DML. DML has drawn down an initial
amount of $66 million as of December 31, 2002. Under
this agreement, payments of approximately $4.5 million
are due in quarterly installments. As of December 31,
2002, the available credit under this facility was
approximately $60 million.
On July 12, 2001, we issued $425 million of two and five-
year notes under our medium-term note program. The notes
consist of $275 million 6% fixed rate notes due August 2006
and $150 million LIBOR + 0.15% floating rate notes due
July 2003. At December 31, 2002, we have outstanding notes
under our medium-term note program as follows:Issue
Amount Due Rate Price
$150 million 07/2003 Floating% Par $275 million 08/2006 6.00% 99.57% $150 million 12/2008 5.63% 99.97% $ 50 million 05/2017 7.53% Par $125 million 02/2027 6.75% 99.78%
Each holder of the 6.75% medium-term notes has the
right to require us to repay the holder’s notes in whole or in
part on February 1, 2007. We may redeem the 5.63% and
6.00% medium-term notes in whole or in part at any time.
Other notes issued under the medium-term note program
may not be redeemed prior to maturity. The medium-term
notes do not have sinking fund requirements.
In the second quarter of 2002, we terminated our interest
rate swap agreement on our 8% senior note. The notional
amount of the swap agreement was $139 million. This
interest rate swap was designated as a fair value hedge
under SFAS No. 133. Upon termination, the fair value of the
interest rate swap was $0.5 million. In the fourth quarter
2002, we terminated the interest rate swap agreement on
our 6% fixed rate medium-term note. The notional amount of
the swap agreement was $150 million. This interest rate
swap was designated as a fair value hedge under SFAS No.
133. Upon termination, the fair value of the interest rate
swap was $13 million. These swaps had previously been
classified in “Other assets” on the balance sheet. The fair
value adjustment to these debt instruments that were
hedged will remain and be amortized as a reduction in
interest expense using the “Effective Yield Method” over
the remaining life of the notes.
Our debt, excluding the effects of our interest rate swaps,
matures as follows: $295 million in 2003; $21 million in
2004; $20 million in 2005; $293 million in 2006; $8 million
in 2007; and $826 million thereafter.
NOTE 12 .
COMMITMENTS AND CONTINGENCIES
L e a s e s . At year-end 2002, we were obligated under
noncancelable operating leases, principally for the use of
land, offices, equipment, field facilities and warehouses.
Total rentals, net of sublease rentals, for noncancelable
leases in 2002, 2001 and 2000 were as follows:
Millions of dollars 2002 2001 2000
Rental expense $ 149 $172 $149
Future total rentals on noncancelable operating leases are
as follows: $119 million in 2003; $83 million in 2004; $63
million in 2005; $55 million in 2006; $40 million in 2007; and
$249 million thereafter.
Asbestos l i t igat ion . Several of our subsidiaries,
particularly DII Industries, LLC (DII Industries) and
Kellogg, Brown & Root, Inc. (Kellogg, Brown & Root), are
defendants in a large number of asbestos-related lawsuits.
The plaintiffs allege injury as a result of exposure to asbestos
in products manufactured or sold by former divisions
of DII Industries or in materials used in construction or
maintenance projects of Kellogg, Brown & Root. These claims
are in three general categories:
• refractory claims;
• other DII Industries claims; and
• construction claims.

N O T E S T O A N N U A L F I N A N C I A L S T A T E M E N T S
872 0 0 2 H A L L I B U R T O N A N N U A L R E P O R T
Refractory c la ims. Asbestos was used in a small number
of products manufactured or sold by Harbison-Walker
Refractories Company, which DII Industries acquired in
1967. The Harbison-Walker operations were conducted as a
division of DII Industries (then named Dresser Industries,
Inc.) until those operations were transferred to another then-
existing subsidiary of DII Industries in preparation for a
spin-off. Harbison-Walker was spun-off by DII Industries in
July 1992. At that time, Harbison-Walker assumed liability
for asbestos claims filed after the spin-off and it agreed to
defend and indemnify DII Industries from liability for those
claims, although DII Industries continues to have direct
liability to tort claimants for all post spin-off refractory
claims. DII Industries retained responsibility for all
asbestos claims pending as of the date of the spin-off.
The agreement governing the spin-off provided that
Harbison-Walker would have the right to access DII
Industries’ historic insurance coverage for the asbestos-
related liabilities that Harbison-Walker assumed in the
spin-off. After the spin-off, DII Industries and Harbison-
Walker jointly negotiated and entered into coverage-in-place
agreements with a number of insurance companies that
had issued historic general liability insurance policies which
both DII Industries and Harbison-Walker had the right
to access for, among other things, bodily injury occurring
between 1963 and 1985. These coverage-in-place
agreements provide for the payment of defense costs,
settlements and court judgments paid to resolve refractory
asbestos claims.
As Harbison-Walker’s financial condition worsened in late
2000 and 2001, Harbison-Walker began agreeing to pay
more in settlement of the post spin-off refractory claims
than it historically had paid. These increased settlement
amounts led to Harbison-Walker making greater demands
on the shared insurance asset. By July 2001, DII Industries
determined that the demands that Harbison-Walker was
making on the shared insurance policies were not acceptable
to DII Industries and that Harbison-Walker probably would
not be able to fulfill its indemnification obligation to DII
Industries. Accordingly, DII Industries took up the defense
of unsettled post spin-off refractory claims that name it
as a defendant in order to prevent Harbison-Walker from
unnecessarily eroding the insurance coverage both
companies access for these claims. These claims are now
stayed in the Harbison-Walker bankruptcy proceeding.
As of December 31, 2002, there were approximately
6,000 open and unresolved pre-spin-off refractory claims
against DII Industries. In addition, there were
approximately 142,000 post spin-off claims that name DII
Industries as a defendant.
Other D I I I ndust r ies c la ims. As of December 31, 2002,
there were approximately 147,000 open and unresolved
claims alleging injuries from asbestos used in other products
formerly manufactured by DII Industries. Most of these
claims involve gaskets and packing materials used in pumps
and other industrial products.
Construct ion c la ims. Our Engineering and Construction
Group includes engineering and construction businesses
formerly operated by The M.W. Kellogg Company and Brown
& Root, Inc., now combined as Kellogg, Brown & Root. As of
December 31, 2002, there were approximately 52,000 open
and unresolved claims alleging injuries from asbestos in
materials used in construction and maintenance projects,
most of which were conducted by Brown & Root, Inc.
Approximately 2,200 of these claims are asserted against
The M.W. Kellogg Company. We believe that Kellogg, Brown
& Root has a good defense to these claims, and a prior
owner of The M.W. Kellogg Company provides Kellogg,
Brown & Root a contractual indemnification for claims
against The M.W. Kellogg Company.
Harb ison-Wa lker Chapter 1 1 bankruptcy. On February
14, 2002, Harbison-Walker filed a voluntary petition for
reorganization under Chapter 11 of the United States
Bankruptcy Code in the Bankruptcy Court in Pittsburgh,
Pennsylvania. In its bankruptcy-related filings, Harbison-
Walker said that it would seek to utilize Sections 524(g) and
105 of the Bankruptcy Code to propose and seek

N O T E S T O A N N U A L F I N A N C I A L S T A T E M E N T S
2 0 0 2 H A L L I B U R T O N A N N U A L R E P O R T 88
confirmation of a plan of reorganization that would provide
for distributions for all legitimate, pending and future
asbestos claims asserted directly against Harbison-Walker
or asserted against DII Industries for which Harbison-
Walker is required to indemnify and defend DII Industries.
Harbison-Walker’s failure to fulfill its indemnity
obligations, and its erosion of insurance coverage shared
with DII Industries, required DII Industries to assist
Harbison-Walker in its bankruptcy proceeding in order to
protect the shared insurance from dissipation. At the time
that Harbison-Walker filed its bankruptcy, DII Industries
agreed to provide up to $35 million of debtor-in-possession
financing to Harbison-Walker during the pendency of the
Chapter 11 proceeding, of which $5 million was advanced
during the first quarter of 2002. On February 14, 2002, in
accordance with the terms of a letter agreement, DII
Industries also paid $40 million to Harbison-Walker’s
United States parent holding company, RHI Refractories
Holding Company. This payment was charged to
discontinued operations in our financial statements in the
first quarter of 2002.
The terms of the letter agreement also requires DII
Industries to pay to RHI Refractories an additional $35
million if a plan of reorganization is proposed in the
Harbison-Walker bankruptcy proceedings, and an additional
$85 million if a plan is confirmed in the Harbison-Walker
bankruptcy proceedings, in each case acceptable to DII
Industries in its sole discretion. The letter agreement
provides that a plan acceptable to DII Industries must
include an injunction channeling to a Section 524(g)/105
trust all present and future asbestos claims against DII
Industries, arising out of the Harbison-Walker business or
other DII Industries’ businesses that share insurance with
Harbison-Walker.
By contrast, the global settlement being pursued by
Halliburton contemplates that DII Industries and Harbison-
Walker, among others including Halliburton, would receive
in a DII Industries and Kellogg, Brown & Root bankruptcy
the benefits of an injunction channeling to a Section
524(g)/105 trust all present and future asbestos claims,
including with respect to DII Industries, Kellogg, Brown &
Root and Halliburton, claims that do not relate to the
Harbison-Walker business or share insurance with
Harbison-Walker.
Harbison-Walker has not yet submitted a proposed plan of
reorganization to the Bankruptcy Court. Moreover,
although possible, at this time we do not believe it likely
that Harbison-Walker will propose or ultimately there would
be confirmed a plan of reorganization in its bankruptcy
proceeding that is acceptable to DII Industries. In general,
in order for a Harbison-Walker plan of reorganization
involving a Section 524(g)/105 trust to be confirmed, among
other things the creation of the trust would require the
approval of 75% of the asbestos claimant creditors of
Harbison-Walker. There can be no assurance that any plan
proposed by Harbison-Walker would obtain the necessary
approval or that it would provide for an injunction
channeling to a Section 524(g)/105 trust all present and
future asbestos claims against DII Industries arising out of
the Harbison-Walker business or that share insurance with
Harbison-Walker.
In addition, we anticipate that a significant financial
contribution to the Harbison-Walker estate could be
required from DII Industries to obtain confirmation of a
Harbison-Walker plan of reorganization if that plan were to
include an injunction channeling to a Section 524(g)/105
trust all present and future asbestos claims against DII
Industries arising out of the Harbison-Walker business or
that have claims to shared insurance with the Harbison-
Walker business. This contribution to the estate would be in
addition to DII Industries’ contribution of its interest to
insurance coverage for refractory claims to the Section
524(g)/105 trust. At this time, we are not able to quantify
the amount of this contribution in light of numerous
uncertainties. These include the amount of Harbison-Walker

N O T E S T O A N N U A L F I N A N C I A L S T A T E M E N T S
892 0 0 2 H A L L I B U R T O N A N N U A L R E P O R T
assets available to satisfy its asbestos and trade creditors
and the results of negotiations that must be completed
among Harbison-Walker, the asbestos claims committee
under its Chapter 11 proceeding, a legal representative for
future asbestos claimants (which has not yet been appointed
by the Bankruptcy Court), DII Industries and the relevant
insurance companies.
Whether or not Halliburton has completed, is still
pursuing or has abandoned its previously announced global
settlement, DII Industries would be under no obligation
to make a significant financial contribution to the Harbison-
Walker estate, although Halliburton intends to consider
all of its options if in the future it ceased pursuing the
global settlement.
For the reasons outlined above among others, we do not
believe it probable that DII Industries will be obligated to
make either of the additional $35 million and $85 million
payments to RHI Refractories described above. During
February 2003, representatives of RHI A.G., the ultimate
corporate parent of RHI Refractories, met with represen-
tatives of DII Industries and indicated that they believed
that DII Industries would be obligated to pay RHI
Refractories the $35 million and the $85 million described
above in the event that our proposed global settlement
were to be consummated. For a number of reasons, DII
Industries believes that the global settlement would not be
the cause of a failure of a Harbison-Walker plan to be
acceptable to DII Industries, and intends vigorously to
defend against this claim if formally asserted.
In connection with the Chapter 11 filing by Harbison-
Walker, the Bankruptcy Court on February 14, 2002 issued
a temporary restraining order staying all further litigation
of more than 200,000 asbestos claims currently pending
against DII Industries in numerous courts throughout the
United States. The period of the stay contained in the
temporary restraining order has been extended to July 21,
2003. Currently, there is no assurance that a stay will
remain in effect beyond July 21, 2003, that a plan of
reorganization will be proposed or confirmed for Harbison-
Walker, or that any plan that is confirmed will provide relief
to DII Industries.
The stayed asbestos claims are those covered by insurance
that DII Industries and Harbison-Walker each access to
pay defense costs, settlements and judgments attributable to
both refractory and non-refractory asbestos claims. The
stayed claims include approximately 142,000 post-1992
spin-off refractory claims, 6,000 pre-spin-off refractory claims
and approximately 135,000 other types of asbestos claims
pending against DII Industries. Approximately 51,000 of the
claims in the third category are claims made against DII
Industries based on more than one ground for recovery and
the stay affects only the portion of the claim covered by the
shared insurance. The stay prevents litigation from
proceeding while the stay is in effect and also prohibits the
filing of new claims. One of the purposes of the stay is to
allow Harbison-Walker and DII Industries time to develop
and propose a plan of reorganization.
A s b e s to s i n s u ra n ce cove ra g e . DII Industries has
substantial insurance for reimbursement for portions of
the costs incurred defending asbestos and silica claims, as
well as amounts paid to settle claims and court judgments.
This coverage is provided by a large number of insurance
policies written by dozens of insurance companies. The
insurance companies wrote the coverage over a period of
more than 30 years for DII Industries, its predecessors or its
subsidiaries and their predecessors. Large amounts of this
coverage are now subject to coverage-in-place agreements
that resolve issues concerning amounts and terms of
coverage. The amount of insurance available to DII
Industries and its subsidiaries depends on the nature and
time of the alleged exposure to asbestos or silica, the
specific subsidiary against which an asbestos or silica claim
is asserted and other factors.
Refractory c la ims insurance. DII Industries has
approximately $2.1 billion in aggregate limits of insurance
coverage for refractory asbestos and silica claims, of which
over one-half is with Equitas or other London-based
insurance companies. Most of this insurance is shared with

N O T E S T O A N N U A L F I N A N C I A L S T A T E M E N T S
2 0 0 2 H A L L I B U R T O N A N N U A L R E P O R T 90
Harbison-Walker. Many of the issues relating to the majority
of this coverage have been resolved by coverage-in-place
agreements with dozens of companies, including Equitas
and other London-based insurance companies. Coverage-in-
place agreements are settlement agreements between
policyholders and the insurers specifying the terms and
conditions under which coverage will be applied as claims
are presented for payment. These agreements in an asbestos
claims context govern such things as what events will be
deemed to trigger coverage, how liability for a claim will be
allocated among insurers and what procedures the
policyholder must follow in order to obligate the insurer to
pay claims. Recently, however, Equitas and other London-
based companies have attempted to impose new restrictive
documentation requirements on DII Industries and other
insureds. Equitas and the other London-based companies
have stated that the new requirements are part of an effort
to limit payment of settlements to claimants who are truly
impaired by exposure to asbestos and can identify the
product or premises that caused their exposure.
On March 21, 2002, Harbison-Walker filed a lawsuit in
the United States Bankruptcy Court for the Western
District of Pennsylvania in its Chapter 11 bankruptcy
proceeding. This lawsuit is substantially similar to DII
Industries’ lawsuit filed in Texas State Court in 2001 and
seeks, among other relief, a determination as to the rights of
DII Industries and Harbison-Walker to the shared general
liability insurance. The lawsuit also seeks damages against
specific insurers for breach of contract and bad faith, and a
declaratory judgment concerning the insurers’ obligations
under the shared insurance. Although DII Industries is also
a defendant in this lawsuit, it has asserted its own claim
to coverage under the shared insurance and is cooperating
with Harbison-Walker to secure both companies’ rights to
the shared insurance. The Bankruptcy Court has ordered
the parties to this lawsuit to engage in non-binding
mediation. The first mediation session was held on July 26,
2002 and additional sessions have since taken place and
further sessions are scheduled to take place, provided the
Bankruptcy Court’s mediation order remains in effect.
Given the early stages of these negotiations, DII Industries
cannot predict whether a negotiated resolution of this
dispute will occur or, if such a resolution does occur, the
precise terms of such a resolution.
Prior to the Harbison-Walker bankruptcy, on August 7,
2001, DII Industries filed a lawsuit in Dallas County, Texas,
against a number of these insurance companies asserting
DII Industries rights under an existing coverage-in-place
agreement and under insurance policies not yet subject to
coverage-in-place agreements. The coverage-in-place
agreements allow DII Industries to enter into settlements
for small amounts without requiring claimants to produce
detailed documentation to support their claims, when DII
Industries believes the settlements are an effective claims
management strategy. DII Industries believes that the new
documentation requirements are inconsistent with the
current coverage-in-place agreements and are unenforceable.
The insurance companies that DII Industries has sued have
not refused to pay larger claim settlements where documen-
tation is obtained or where court judgments are entered.
On May 10, 2002, the London-based insuring entities and
companies removed DII Industries’ Dallas County State
Court Action to the United States District Court for the
Northern District of Texas alleging that federal court
jurisdiction existed over the case because it is related to the
Harbison-Walker bankruptcy. DII Industries has filed an
opposition to that removal and has asked the federal court
to remand the case back to the Dallas County state court.
On June 12, 2002, the London-based insuring entities and
companies filed a motion to transfer the case to the federal
court in Pittsburgh, Pennsylvania. DII Industries has filed
an opposition to that motion to transfer. The federal court
in Dallas has yet to rule on any of these motions. Regardless
of the outcome of these motions, because of the similar
insurance coverage lawsuit filed by Harbison-Walker in its
bankruptcy proceeding, it is unlikely that DII Industries’
case will proceed independently of the bankruptcy.

912 0 0 2 H A L L I B U R T O N A N N U A L R E P O R T
N O T E S T O A N N U A L F I N A N C I A L S T A T E M E N T S
Other D I I I ndust r ies c la ims insurance. DII Industries
has substantial insurance to cover other non-refractory
asbestos claims. Two coverage-in-place agreements cover
DII Industries for companies or operations that DII
Industries either acquired or operated prior to November 1,
1957. Asbestos claims that are covered by these
agreements are currently stayed by the Harbison-Walker
bankruptcy because the majority of this coverage also
applies to refractory claims and is shared with Harbison-
Walker. Other insurance coverage is provided by a number
of different policies that DII Industries acquired rights to
access when it acquired businesses from other companies.
Three coverage-in-place agreements provide reimbursement
for asbestos claims made against DII Industries’ former
Worthington Pump division. There is also other substantial
insurance coverage with approximately $2.0 billion in
aggregate limits that has not yet been reduced to coverage-
in-place agreements.
On August 28, 2001, DII Industries filed a lawsuit in the
192nd Judicial District of the District Court for Dallas
County, Texas against specific London-based insuring
entities that issued insurance policies that provide coverage
to DII Industries for asbestos-related liabilities arising out
of the historical operations of Worthington Corporation or its
successors. This lawsuit raises essentially the same issue as
to the documentation requirements as the August 7, 2001
Harbison-Walker lawsuit filed in the same court. The
London-based insuring entities filed a motion in that case
seeking to compel the parties to binding arbitration. The
trial court denied that motion and the London-based
insuring entities appealed that decision to the state appellate
court. The state appellate courts denied the appeal and,
most recently, the London-based insuring entities have
removed the case from the state court to the federal court.
DII Industries was successful in remanding the case back to
the state court.
A significant portion of the insurance coverage applicable
to Worthington claims is alleged by Federal-Mogul Products,
Inc. to be shared with it. In 2001, Federal-Mogul Products,
Inc. and a large number of its affiliated companies filed a
voluntary petition for reorganization under Chapter 11 of
the Bankruptcy Code in the Bankruptcy Court in
Wilmington, Delaware.
In response to Federal-Mogul’s allegations, on December
7, 2001, DII Industries filed a lawsuit in the Delaware
Bankruptcy Court asserting its rights to insurance coverage
under historic general liability policies issued to
Studebaker-Worthington, Inc. and its successor for asbestos-
related liabilities arising from, among other operations,
Worthington’s and its successors’ historic operations. This
lawsuit also seeks a judicial declaration concerning the
competing rights of DII Industries and Federal-Mogul, if
any, to this insurance coverage. DII Industries recently filed
a second amended complaint in that lawsuit and the parties
are now beginning the discovery process. The parties to
this litigation, including Federal-Mogul, have agreed to
mediate this dispute. The first mediation session is
scheduled for April 2, 2003. Unlike the Harbison-Walker
insurance coverage litigation, in which the litigation is
stayed while the mediation proceeds, the insurance coverage
litigation concerning the Worthington-related asbestos
liabilities has not been stayed and such litigation will proceed
simultaneously with the mediation.
At the same time, DII Industries filed its insurance
coverage action in the Federal-Mogul bankruptcy, DII
Industries also filed a second lawsuit in which it has filed a
motion for preliminary injunction seeking a stay of all
Worthington asbestos-related lawsuits against DII
Industries that are scheduled for trial within the six months
following the filing of the motion. The stay that DII
Industries seeks, if granted, would remain in place until the
competing rights of DII Industries and Federal-Mogul to
the allegedly shared insurance are resolved. The Court has
yet to schedule a hearing on DII Industries’ motion for
preliminary injunction.
A number of insurers who have agreed to coverage-in-
place agreements with DII Industries have suspended

N O T E S T O A N N U A L F I N A N C I A L S T A T E M E N T S
2 0 0 2 H A L L I B U R T O N A N N U A L R E P O R T 92
payment under the shared Worthington policies until the
Federal-Mogul Bankruptcy Court resolves the insurance
issues. Consequently, the effect of the Federal-Mogul
bankruptcy on DII Industries’ rights to access this shared
insurance is uncertain.
Construct ion c la ims insurance. Nearly all of our
construction asbestos claims relate to Brown & Root, Inc.
operations before the 1980s. Our primary insurance
coverage for these claims was written by Highlands
Insurance Company during the time it was one of our
subsidiaries. Highlands was spun-off to our shareholders in
1996. On April 5, 2000, Highlands filed a lawsuit against us
in the Delaware Chancery Court. Highlands asserted that
the insurance it wrote for Brown & Root, Inc. that covered
construction asbestos claims was terminated by agreements
between Halliburton and Highlands at the time of the 1996
spin-off. In March 2001, the Chancery Court ruled that a
termination did occur and that Highlands was not obligated
to provide coverage for Brown & Root, Inc.’s asbestos
claims. This decision was affirmed by the Delaware Supreme
Court on March 13, 2002. As a result of this ruling, we
wrote-off approximately $35 million in accounts receivable
for amounts paid for claims and defense costs and $45 million
of accrued receivables in relation to estimated insurance
recoveries claims settlements from Highlands in the first
quarter 2002. In addition, we dismissed the April 24, 2000
lawsuit we filed against Highlands in Harris County, Texas.
As noted in our 2001 Form 10-K, the amount of the billed
insurance receivable related to Highlands Insurance
Company included in “Accounts receivable” was $35 million.
As a consequence of the Delaware Supreme Court’s
decision, Kellogg, Brown & Root no longer has primary
insurance coverage from Highlands for asbestos claims.
However, Kellogg, Brown & Root has significant excess
insurance coverage. The amount of this excess coverage that
will reimburse us for an asbestos claim depends on a variety
of factors. On March 20, 2002, Kellogg, Brown & Root filed
a lawsuit in the 172nd Judicial District of the District Court
of Jefferson County, Texas, against Kellogg, Brown & Root’s
historic insurers that issued these excess insurance policies.
In the lawsuit, Kellogg, Brown & Root seeks to establish
the specific terms under which it can seek reimbursement for
costs it incurs in settling and defending asbestos claims
from its historic construction operations. On January 6, 2003,
this lawsuit was transferred to the 11th Judicial District of
the District Court of Harris County, Texas. Until this lawsuit
is resolved, the scope of the excess insurance will remain
uncertain. We do not expect the excess insurers will
reimburse us for asbestos claims until this lawsuit is resolved.
Sign i f i cant asbestos judgments on appea l . During
2001, there were several adverse judgments in trial court
proceedings that are in various stages of the appeal process.
All of these judgments concern asbestos claims involving
Harbison-Walker refractory products. Each of these appeals,
however, has been stayed by the Bankruptcy Court in the
Harbison-Walker Chapter 11 bankruptcy.
On November 29, 2001, the Texas District Court in Orange,
Texas, entered judgments against Dresser Industries, Inc.
(now DII Industries) on a $65 million jury verdict rendered in
September 2001 in favor of five plaintiffs. The $65 million
amount includes $15 million of a $30 million judgment
against DII Industries and another defendant. DII Industries
is jointly and severally liable for $15 million in addition to
$65 million if the other defendant does not pay its share of
this judgment. Based upon what we believe to be controlling
precedent, which would hold that the judgment entered is
void, we believe that the likelihood of the judgment being
affirmed in the face of DII Industries’ appeal is remote.
As a result, we have not accrued any amounts for this
judgment. However, a favorable outcome from the appeal
is not assured.
On November 29, 2001, the same District Court in Orange,
Texas, entered three additional judgments against Dresser
Industries, Inc. (now DII Industries) in the aggregate
amount of $35.7 million in favor of 100 other asbestos
plaintiffs. These judgments relate to an alleged breach of
purported settlement agreements signed early in 2001 by

N O T E S T O A N N U A L F I N A N C I A L S T A T E M E N T S
932 0 0 2 H A L L I B U R T O N A N N U A L R E P O R T
a New Orleans lawyer hired by Harbison-Walker, which had
been defending DII Industries pursuant to the agreement
by which Harbison-Walker was spun-off by DII Industries in
1992. These settlement agreements expressly bind
Harbison-Walker Refractories Company as the obligated
party, not DII Industries, which is not a party to the
agreements. For that reason, and based upon what we believe
to be controlling precedent which would hold that the
judgment entered is void, we believe that the likelihood of
the judgment being affirmed in the face of DII Industries’
appeal is remote. As a result, we have not accrued any
amounts for this judgment. However, a favorable outcome
from the appeal is not assured.
On December 5, 2001, a jury in the Circuit Court for
Baltimore County, Maryland, returned verdicts against
Dresser Industries, Inc. (now DII Industries) and other
defendants following a trial involving refractory asbestos
claims. Each of the five plaintiffs alleges exposure to
Harbison-Walker products. DII Industries’ portion of the
verdicts was approximately $30 million, which we have fully
accrued at December 31, 2002. DII Industries intends to
appeal the judgment to the Maryland Supreme Court. While
we believe we have a valid basis for appeal and intend to
vigorously pursue our appeal, any favorable outcome from
that appeal is not assured.
On October 25, 2001, in the Circuit Court of Holmes
County, Mississippi, a jury verdict of $150 million was
rendered in favor of six plaintiffs against Dresser Industries,
Inc. (now DII Industries) and two other companies. DII
Industries’ share of the verdict was $21.3 million which
we have fully accrued at December 31, 2002. The award was
for compensatory damages. The jury did not award any
punitive damages. The trial court has entered judgment on
the verdict. While we believe we have a valid basis for
appeal and intend to vigorously pursue our appeal, any
favorable outcome from that appeal is not assured.
A s b e s to s c l a i m s h i s to r y. Since 1976, approximately
578,000 asbestos claims have been filed against us. Almost
all of these claims have been made in separate lawsuits in
which we are named as a defendant along with a number of
other defendants, often exceeding 100 unaffiliated defendant
companies in total. During the fourth quarter of 2002,
we received approximately 32,000 new claims and we closed
approximately 13,000 claims. The number of open claims
pending against us is as follows:
Period Ending Total Open Claims
December 31, 2002 347,000 September 30, 2002 328,000 June 30, 2002 312,000 March 31, 2002 292,000 December 31, 2001 274,000 September 30, 2001 146,000 June 30, 2001 145,000 March 31, 2001 129,000 December 31, 2000 117,000
The claims include approximately 142,000 at December
31, 2002 and September 30, 2002, 139,000 at June 30, 2002,
133,000 at March 31, 2002 and 125,000 at December 31,
2001 of post spin-off Harbison-Walker refractory related
claims that name DII Industries as a defendant. All such
claims have been factored into the calculation of our
asbestos liability.
We manage asbestos claims to achieve settlements of
valid claims for reasonable amounts. When reasonable
settlement is not possible, we contest claims in court. Since
1976, we have closed approximately 231,000 claims
through settlements and court proceedings at a total cost of
approximately $202 million. We have received or expect to
receive from our insurers all but approximately $93 million
of this cost, resulting in an average net cost per closed
claim of about $403.
A s b e s to s s t u d y a n d t h e va l u a t i o n o f u n re s o l ve d
c u r re n t a n d f u t u re a s b e s to s c l a i m s .
A s b e s t o s S t u d y. In late 2001, DII Industries retained
Dr. Francine F. Rabinovitz of Hamilton, Rabinovitz &
Alschuler, Inc. to estimate the probable number and value,
including defense costs, of unresolved current and future
asbestos and silica-related bodily injury claims asserted

N O T E S T O A N N U A L F I N A N C I A L S T A T E M E N T S
2 0 0 2 H A L L I B U R T O N A N N U A L R E P O R T 94
against DII Industries and its subsidiaries. Dr. Rabinovitz is
a nationally renowned expert in conducting such analyses,
has been involved in a number of asbestos-related and other
toxic tort-related valuations of current and future liabilities,
has served as the expert for three representatives of future
claimants in asbestos related bankruptcies and has had her
valuation methodologies accepted by numerous courts.
Further, the methodology utilized by Dr. Rabinovitz is the
same methodology that is utilized by the expert who is
routinely retained by the asbestos claimants committee in
asbestos-related bankruptcies. Dr. Rabinovitz estimated
the probable number and value of unresolved current and
future asbestos and silica-related bodily injury claims
asserted against DII Industries and its subsidiaries over a
50 year period. The report took approximately seven
months to complete.
Methodo logy. The methodology utilized by Dr. Rabinovitz
to project DII Industries’ and its subsidiaries’ asbestos-
related liabilities and defense costs relied upon and included:
• an analysis of DII Industries, Kellogg, Brown & Root’sand Harbison-Walker Refractories Company’s historicalasbestos settlements and defense costs to developaverage settlement values and average defense costs forspecific asbestos-related diseases and for the specificbusiness operation or entity allegedly responsible for theasbestos-related diseases;
• an analysis of DII Industries’, Kellogg, Brown & Root’sand Harbison-Walker Refractories Company’s pendinginventory of asbestos-related claims by specific asbestos-related diseases and by the specific business operation orentity allegedly responsible for the asbestos-related disease;
• an analysis of the claims filing history for asbestos-related claims against DII Industries, Kellogg, Brown &Root and Harbison-Walker Refractories Company forthe approximate two-year period from January 2000 toMay 31, 2002, and for the approximate five-year periodfrom January 1997 to May 31, 2002 by specific asbestos-related disease and by business operation or entityallegedly responsible for the asbestos-related disease;
• an analysis of the population likely to have been exposedor claim exposure to products manufactured by DIIIndustries, its predecessors and Harbison-Walker or toBrown & Root construction and renovation projects; and
• epidemiological studies to estimate the number of peoplewho might allege exposure to products manufacturedby DII Industries, its predecessors and Harbison-Walkeror to Brown & Root construction and renovation projectsthat would be likely to develop asbestos-related diseases.Dr. Rabinovitz’s estimates are based on historicaldata supplied by DII Industries, Kellogg, Brown & Rootand Harbison-Walker and publicly available studies,including annual surveys by the National Institutes ofHealth concerning the incidence of mesothelioma deaths.
In her estimates, Dr. Rabinovitz relied on the source data
provided by our management; she did not independently
verify the accuracy of the source data. The source data
provided by us was based on our 24-year history in
gathering claimant information and defending and settling
asbestos claims.
In her analysis, Dr. Rabinovitz projected that the elevated
and historically unprecedented rate of claim filings of the
last several years (particularly in 2000 and 2001), especially
as expressed by the ratio of nonmalignant claim filings to
malignant claim filings, would continue into the future for
five more years. After that, Dr. Rabinovitz projected that the
ratio of nonmalignant claim filings to malignant claim
filings will gradually decrease for a 10 year period
ultimately returning to the historical claiming rate and
claiming ratio. In making her calculation, Dr. Rabinovitz
alternatively assumed a somewhat lower rate of claim
filings, based on an average of the last five years of claims
experience, would continue into the future for five more
years and decrease thereafter.
Other important assumptions utilized in Dr. Rabinovitz’s
estimates, which we relied upon in making our accrual are:
• there will be no legislative or other systemic changes tothe tort system;
• that we will continue to aggressively defend againstasbestos claims made against us;

N O T E S T O A N N U A L F I N A N C I A L S T A T E M E N T S
952 0 0 2 H A L L I B U R T O N A N N U A L R E P O R T
• an inflation rate of 3% annually for settlementpayments and an inflation rate of 4% annually fordefense costs; and
• we would receive no relief from our asbestos obligationdue to actions taken in the Harbison-Walker bankruptcy.
Range of L iab i l i t i es . Based upon her analysis, Dr.
Rabinovitz estimated total, undiscounted asbestos and silica
liabilities, including defense costs, of DII Industries,
Kellogg, Brown & Root and some of their current and
former subsidiaries. Through 2052, Dr. Rabinovitz estimated
the current and future total undiscounted liability for
personal injury asbestos and silica claims, including defense
costs, would be a range between $2.2 billion and $3.5 billion
as of June 30, 2002 (which includes payments related to
the claims currently pending). The lower end of the range is
calculated by using an average of the last five years of
asbestos claims experience and the upper end of the range is
calculated using the more recent two-year elevated rate of
asbestos claim filings in projecting the rate of future claims.
2nd Quar ter 2002 Accrua l . Based on that estimate, in
the second quarter of 2002, we accrued asbestos and silica
claims liability and defense costs for both known outstanding
and future refractory, other DII Industries, and construction
asbestos and silica claims using the low end of the range of
Dr. Rabinovitz’s study, or approximately $2.2 billion. In
establishing our liability for asbestos, we included all post
spin-off claims against Harbison-Walker that name DII
Industries as a defendant. Our accruals are based on an
estimate of personal injury asbestos claims through 2052
based on the average claims experience of the last five
years. At the end of the second quarter of 2002, we did not
believe that any point in the expert’s range was better
than any other point, and accordingly, based our accrual on
the low end of the range in accordance with FIN 14.
Agreement Regard ing Proposed G loba l Sett lement .
In December 2002, we announced that we had reached an
agreement in principle that could result in a global
settlement of all personal injury asbestos and silica claims
against us. The proposed settlement provides that up to
$2.775 billion in cash, 59.5 million shares of our common
stock (with a value of $1.1 billion using the stock price at
December 31, 2002 of $18.71) and notes with a net present
value expected to be less than $100 million would be
paid to a trust for the benefit of current and future asbestos
personal injury claimants and current silica personal injury
claimants. Under the proposed agreement, Kellogg, Brown
& Root and DII Industries will retain the rights to the first
$2.3 billion of any insurance proceeds with any proceeds
received between $2.3 billion and $3.0 billion going to the
trust. The proposed settlement will be implemented through
a pre-packaged Chapter 11 filing of DII Industries and
Kellogg, Brown & Root as well as some other DII
Industries and Kellogg, Brown & Root subsidiaries with
U.S. operations. The funding of the settlement amounts
would occur upon receiving final and non-appealable court
confirmation of a plan of reorganization of DII Industries
and Kellogg, Brown & Root and their subsidiaries in the
Chapter 11 proceeding.
Subsequently, as of March 2003, DII Industries and
Kellogg, Brown & Root have entered into definitive written
agreements finalizing the terms of the agreement in
principle. The proposed global settlement also includes
silica claims as a result of current or past exposure. These
silica claims are less than 1% of the personal injury
claims included in the proposed global settlement. We have
approximately 2,500 open silica claims.
The agreement contemplated that we would conduct due
diligence on the claims, and that we and attorneys for the
claimants would use reasonable efforts to execute definitive
settlement agreements. While all the required settlement
agreements have not yet been executed, we and attorneys
for some of the asbestos claimants have now reached
agreement on what they believe will be a template for such
settlement agreements. These agreements are subject to a
number of conditions, including agreement on a Chapter 11
plan of reorganization for DII Industries, Kellogg, Brown
& Root and some of their subsidiaries, approval by 75% of
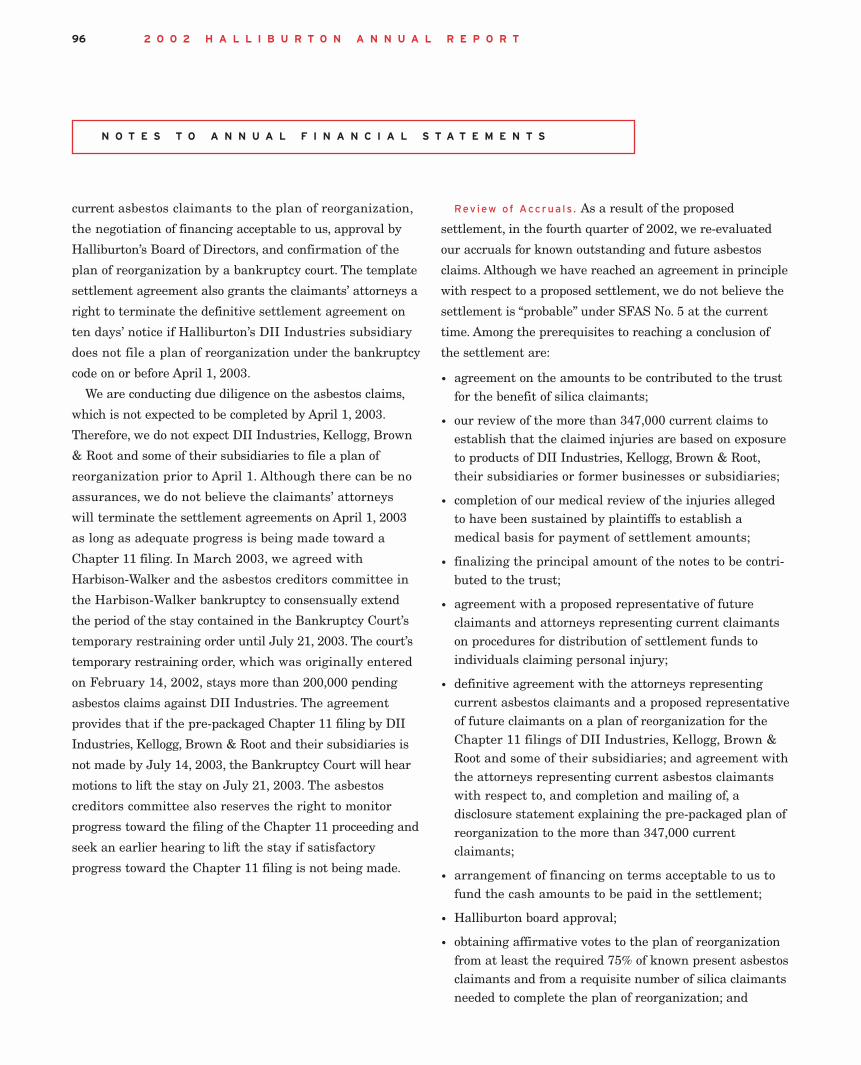
N O T E S T O A N N U A L F I N A N C I A L S T A T E M E N T S
2 0 0 2 H A L L I B U R T O N A N N U A L R E P O R T 96
current asbestos claimants to the plan of reorganization,
the negotiation of financing acceptable to us, approval by
Halliburton’s Board of Directors, and confirmation of the
plan of reorganization by a bankruptcy court. The template
settlement agreement also grants the claimants’ attorneys a
right to terminate the definitive settlement agreement on
ten days’ notice if Halliburton’s DII Industries subsidiary
does not file a plan of reorganization under the bankruptcy
code on or before April 1, 2003.
We are conducting due diligence on the asbestos claims,
which is not expected to be completed by April 1, 2003.
Therefore, we do not expect DII Industries, Kellogg, Brown
& Root and some of their subsidiaries to file a plan of
reorganization prior to April 1. Although there can be no
assurances, we do not believe the claimants’ attorneys
will terminate the settlement agreements on April 1, 2003
as long as adequate progress is being made toward a
Chapter 11 filing. In March 2003, we agreed with
Harbison-Walker and the asbestos creditors committee in
the Harbison-Walker bankruptcy to consensually extend
the period of the stay contained in the Bankruptcy Court’s
temporary restraining order until July 21, 2003. The court’s
temporary restraining order, which was originally entered
on February 14, 2002, stays more than 200,000 pending
asbestos claims against DII Industries. The agreement
provides that if the pre-packaged Chapter 11 filing by DII
Industries, Kellogg, Brown & Root and their subsidiaries is
not made by July 14, 2003, the Bankruptcy Court will hear
motions to lift the stay on July 21, 2003. The asbestos
creditors committee also reserves the right to monitor
progress toward the filing of the Chapter 11 proceeding and
seek an earlier hearing to lift the stay if satisfactory
progress toward the Chapter 11 filing is not being made.
Rev iew of Accrua ls . As a result of the proposed
settlement, in the fourth quarter of 2002, we re-evaluated
our accruals for known outstanding and future asbestos
claims. Although we have reached an agreement in principle
with respect to a proposed settlement, we do not believe the
settlement is “probable” under SFAS No. 5 at the current
time. Among the prerequisites to reaching a conclusion of
the settlement are:
• agreement on the amounts to be contributed to the trustfor the benefit of silica claimants;
• our review of the more than 347,000 current claims toestablish that the claimed injuries are based on exposureto products of DII Industries, Kellogg, Brown & Root,their subsidiaries or former businesses or subsidiaries;
• completion of our medical review of the injuries allegedto have been sustained by plaintiffs to establish amedical basis for payment of settlement amounts;
• finalizing the principal amount of the notes to be contri-buted to the trust;
• agreement with a proposed representative of futureclaimants and attorneys representing current claimantson procedures for distribution of settlement funds toindividuals claiming personal injury;
• definitive agreement with the attorneys representingcurrent asbestos claimants and a proposed representativeof future claimants on a plan of reorganization for theChapter 11 filings of DII Industries, Kellogg, Brown &Root and some of their subsidiaries; and agreement withthe attorneys representing current asbestos claimantswith respect to, and completion and mailing of, adisclosure statement explaining the pre-packaged plan ofreorganization to the more than 347,000 currentclaimants;
• arrangement of financing on terms acceptable to us tofund the cash amounts to be paid in the settlement;
• Halliburton board approval;
• obtaining affirmative votes to the plan of reorganizationfrom at least the required 75% of known present asbestosclaimants and from a requisite number of silica claimantsneeded to complete the plan of reorganization; and
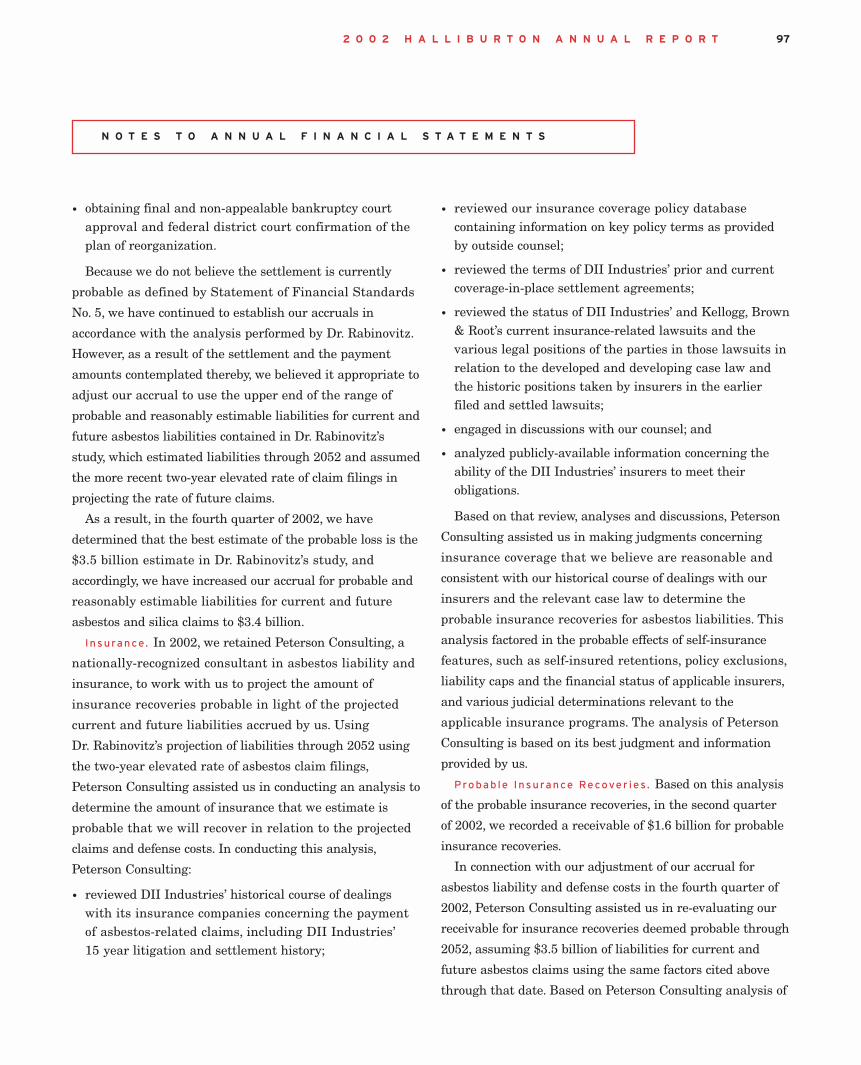
N O T E S T O A N N U A L F I N A N C I A L S T A T E M E N T S
972 0 0 2 H A L L I B U R T O N A N N U A L R E P O R T
• obtaining final and non-appealable bankruptcy courtapproval and federal district court confirmation of theplan of reorganization.
Because we do not believe the settlement is currently
probable as defined by Statement of Financial Standards
No. 5, we have continued to establish our accruals in
accordance with the analysis performed by Dr. Rabinovitz.
However, as a result of the settlement and the payment
amounts contemplated thereby, we believed it appropriate to
adjust our accrual to use the upper end of the range of
probable and reasonably estimable liabilities for current and
future asbestos liabilities contained in Dr. Rabinovitz’s
study, which estimated liabilities through 2052 and assumed
the more recent two-year elevated rate of claim filings in
projecting the rate of future claims.
As a result, in the fourth quarter of 2002, we have
determined that the best estimate of the probable loss is the
$3.5 billion estimate in Dr. Rabinovitz’s study, and
accordingly, we have increased our accrual for probable and
reasonably estimable liabilities for current and future
asbestos and silica claims to $3.4 billion.
I nsurance. In 2002, we retained Peterson Consulting, a
nationally-recognized consultant in asbestos liability and
insurance, to work with us to project the amount of
insurance recoveries probable in light of the projected
current and future liabilities accrued by us. Using
Dr. Rabinovitz’s projection of liabilities through 2052 using
the two-year elevated rate of asbestos claim filings,
Peterson Consulting assisted us in conducting an analysis to
determine the amount of insurance that we estimate is
probable that we will recover in relation to the projected
claims and defense costs. In conducting this analysis,
Peterson Consulting:
• reviewed DII Industries’ historical course of dealingswith its insurance companies concerning the paymentof asbestos-related claims, including DII Industries’15 year litigation and settlement history;
• reviewed our insurance coverage policy databasecontaining information on key policy terms as providedby outside counsel;
• reviewed the terms of DII Industries’ prior and currentcoverage-in-place settlement agreements;
• reviewed the status of DII Industries’ and Kellogg, Brown& Root’s current insurance-related lawsuits and thevarious legal positions of the parties in those lawsuits inrelation to the developed and developing case law andthe historic positions taken by insurers in the earlierfiled and settled lawsuits;
• engaged in discussions with our counsel; and
• analyzed publicly-available information concerning theability of the DII Industries’ insurers to meet theirobligations.
Based on that review, analyses and discussions, Peterson
Consulting assisted us in making judgments concerning
insurance coverage that we believe are reasonable and
consistent with our historical course of dealings with our
insurers and the relevant case law to determine the
probable insurance recoveries for asbestos liabilities. This
analysis factored in the probable effects of self-insurance
features, such as self-insured retentions, policy exclusions,
liability caps and the financial status of applicable insurers,
and various judicial determinations relevant to the
applicable insurance programs. The analysis of Peterson
Consulting is based on its best judgment and information
provided by us.
Probab le Insurance Recover ies . Based on this analysis
of the probable insurance recoveries, in the second quarter
of 2002, we recorded a receivable of $1.6 billion for probable
insurance recoveries.
In connection with our adjustment of our accrual for
asbestos liability and defense costs in the fourth quarter of
2002, Peterson Consulting assisted us in re-evaluating our
receivable for insurance recoveries deemed probable through
2052, assuming $3.5 billion of liabilities for current and
future asbestos claims using the same factors cited above
through that date. Based on Peterson Consulting analysis of

N O T E S T O A N N U A L F I N A N C I A L S T A T E M E N T S
2 0 0 2 H A L L I B U R T O N A N N U A L R E P O R T 98
the probable insurance recoveries, we increased our
insurance receivable to $2.1 billion as of the fourth quarter
of 2002. The insurance receivable recorded by us does not
assume any recovery from insolvent carriers and assumes
that those carriers which are currently solvent will continue
to be solvent throughout the period of the applicable
recoveries in the projections. However, there can be no
assurance that these assumptions will be correct. These
insurance receivables do not exhaust the applicable insurance
coverage for asbestos-related liabilities.
Current Accrua ls . The current accrual of $3.4 billion for
probable and reasonably estimable liabilities for current and
future asbestos and silica claims and the $2.1 billion in
insurance receivables are included in noncurrent assets and
liabilities due to the extended time periods involved to settle
claims. In the second quarter of 2002, we recorded a pretax
charge of $483 million, and, in the fourth quarter of 2002,
we recorded a pretax charge of $799 million ($675 million
after-tax).
In the fourth quarter of 2002, we recorded pretax charges
of $232 million ($212 million after-tax) for claims related
to Brown & Root construction and renovation projects under
the Engineering and Construction Group segment. The
balance of $567 million ($463 million after-tax) related to
claims associated with businesses no longer owned by
us and was recorded as discontinued operations. The low
effective tax rate on the asbestos charge is due to the
recording of a valuation allowance against the United States
Federal deferred tax asset associated with the accrual as
the deferred tax asset may not be fully realizable based upon
future taxable income projections.
The total estimated claims through 2052, including the
347,000 current open claims, are approximately one million.
A summary of our accrual for all claims and corresponding
insurance recoveries is as follows:
December 31 Millions of dollars 2002 2001
Gross liability – beginning balance $ 737 $ 80Accrued liability 2,820 696Payments on claims (132) (39)
Gross liability – ending balance $ 3,425 $ 737 Estimated insurance recoveries:
Highlands Insurance Company – beginning balance $ (45) $ (39)Accrued insurance recoveries — (18)Write-off of recoveries 45 —Insurance billings — 12
Highlands Insurance Company – ending balance — (45)
Other insurance carriers – beginning balance $ (567) $ (12)Accrued insurance recoveries (1,530) (563)Insurance billings 38 8
Other insurance carriers – ending balance $(2,059) $ (567)Total estimated insurance recoveries $(2,059) $ (612)Net liability for known asbestos claims $ 1,366 $ 125
Accounts receivable for billings to insurance companies
for payments made on asbestos claims were $44 million at
December 31, 2002, and $18 million at December 31, 200l,
excluding $35 million in accounts receivable written off at
the conclusion of the Highlands litigation.
Poss ib le Add i t iona l Accrua ls . When and if the
currently proposed global settlement becomes
probable under SFAS No. 5, we would increase our accrual
for probable and reasonably estimable liabilities for current
and future asbestos claims up to $4.0 billion, reflecting
the amount in cash and notes we would pay to fund the
settlement combined with the value of 59.5 million shares of
Halliburton common stock using $18.71, which was trading
value of the stock at the end of the fourth quarter of 2002.
In addition, at such time as the settlement becomes
probable, we would adjust our accrual for liabilities for
current and future asbestos claims and we would expect
to increase the amount of our insurance receivables to $2.3
billion. As a result, we would record at such time an
additional pretax charge of $322 million ($288 million after-
tax). Beginning in the first quarter in which the settlement

N O T E S T O A N N U A L F I N A N C I A L S T A T E M E N T S
992 0 0 2 H A L L I B U R T O N A N N U A L R E P O R T
becomes probable, the accrual would then be adjusted
from period to period based on positive and negative
changes in the market price of our common stock until the
payment of the shares into the trust.
Cont inu ing Rev iew. Projecting future events is subject to
many uncertainties that could cause the asbestos-related
liabilities and insurance recoveries to be higher or lower
than those projected and booked such as:
• the number of future asbestos-related lawsuits to be filedagainst DII Industries, and Kellogg, Brown & Root;
• the average cost to resolve such future lawsuits;
• coverage issues among layers of insurers issuing differentpolicies to different policyholders over extended periodsof time;
• the impact on the amount of insurance recoverable inlight of the Harbison-Walker and Federal-Mogulbankruptcies; and
• the continuing solvency of various insurance companies.
Given the inherent uncertainty in making future
projections, we plan to have the projections of current and
future asbestos and silica claims periodically reexamined,
and we will update them if needed based on our experience
and other relevant factors such as changes in the tort
system, the resolution of the bankruptcies of various
asbestos defendants and the probability of our settlement of
all claims becoming effective. Similarly, we will re-evaluate
our projections concerning our probable insurance recoveries
in light of any updates to Dr. Rabinovitz’s projections,
developments in DII Industries’ and Kellogg, Brown & Root’s
various lawsuits against its insurance companies and other
developments that may impact the probable insurance.
Barracuda-Carat inga Pro ject . In June 2000, KBR
entered into a contract with the project owner, Barracuda &
Caratinga Leasing Company B.V., to develop the
Barracuda and Caratinga crude oil fields, which are located
off the coast of Brazil. The project manager and owner
representative is Petrobras, the Brazilian national oil
company. When completed, the project will consist of two
converted supertankers which will be used as floating
production, storage and offloading platforms, or FPSO’s, 33
hydrocarbon production wells, 18 water injection wells,
and all sub-sea flow lines and risers necessary to connect the
underwater wells to the FPSO’s.
KBR’s performance under the contract is secured by:
• two performance letters of credit, which together have anavailable credit of approximately $261 million andwhich represent approximately 10% of the contractamount, as amended to date by change orders;
• a retainage letter of credit in an amount equal to $121million as of December 31, 2002 and which will increasein order to continue to represent 10% of the cumulativecash amounts paid to KBR; and
• a guarantee of KBR’s performance of the agreement byHalliburton Company in favor of the project owner.
The project owner has procured project finance funding
obligations from various banks to finance the payments due
to KBR under the contract.
As of December 31, 2002, the project was approximately
63% complete and KBR had recorded a loss of $117 million
related to the project. The probable unapproved claims
included in determining the loss on the project were $182
million as of December 31, 2002. The claims for the project
most likely will not be settled within one year. Accordingly,
probable unapproved claims of $115 million at December 31,
2002 have been recorded to long-term unbilled work on
uncompleted contracts. Those amounts are included in
“Other assets” on the balance sheet. KBR has asserted claims
for compensation substantially in excess of $182 million. The
project owner, through its project manager, Petrobras, has
denied responsibility for all such claims. Petrobras has,
however, agreed in principle to the scope, but not yet the
amount, of issues valued by KBR approximately $29 million
which are not related to the $182 million in probable
unapproved claims. Additionally we are in discussion with
Petrobras about responsibility for $78 million of new tax
costs that were not foreseen in the contract price.
N O T E S T O A N N U A L F I N A N C I A L S T A T E M E N T S
2 0 0 2 H A L L I B U R T O N A N N U A L R E P O R T 100
KBR expects the project will likely be completed more
than 12 months later than the original contract completion
date. KBR believes that the project’s delay is due primarily
to the actions of Petrobras. In the event that any portion of
the delay is determined to be attributable to KBR and any
phase of the project is completed after the milestone dates
specified in the contract, KBR could be required to pay
liquidated damages. These damages would be calculated on
an escalating basis of up to $1 million per day of delay
caused by KBR subject to a total cap on liquidated damages
of 10% of the final contract amount (yielding a cap of
approximately $263 million as of December 31, 2002). We are
in discussions with Petrobras regarding a settlement of the
amount of unapproved claims. There can be no assurance
that we will reach any settlement regarding these
claims. We expect any settlement, if reached, will result in a
schedule extension that would eliminate liability for
liquidated damages based on the currently forecasted
schedule. We have not accrued any amounts for liquidated
damages, since we consider the imposition of liquidated
damages to be unlikely.
The project owner currently has no other committed
source of funding on which we can necessarily rely other
than the project finance funding for the project. If the banks
cease to fund the project, the project owner may not have
the ability to continue to pay KBR for its services. The
original bank documents provide that the banks are not
obligated to continue to fund the project if the project has
been delayed for more than 6 months. In November 2002,
the banks agreed to extend the 6-month period to 12 months.
Other provisions in the bank documents may provide for
additional time extensions. However, delays beyond 12
months may require bank consent in order to obtain
additional funding. While we believe the banks have an
incentive to complete the financing of the project, there is no
assurance that they would do so. If the banks did not
consent to extensions of time or otherwise ceased funding the
project, we believe that Petrobras would provide for or
secure other funding to complete the project, although there
is no assurance that it would do so. To date, the banks have
made funds available, and the project owner has continued to
disburse funds to KBR as payment for its work on the
project even though the project completion has been delayed.
In the event that KBR is alleged to be in default under
the contract, the project owner may assert a right to draw
upon the letters of credit. If the letters of credit were drawn,
KBR would be required to fund the amount of the draw to
the issuing bank. In the event that KBR was determined
after an arbitration proceeding to have been in default
under the contract, and if the project was not completed by
KBR as a result of such default (i.e., KBR’s services are
terminated as a result of such default), the project owner
may seek direct damages (including completion costs in
excess of the contract price and interest on borrowed funds,
but excluding consequential damages) against KBR for
up to $500 million plus the return of up to $300 million in
advance payments that would otherwise have been
credited back to the project owner had the contract not
been terminated.
In addition, although the project financing includes
borrowing capacity in excess of the original contract
amount, only $250 million of this additional borrowing
capacity is reserved for increases in the contract amount
payable to KBR and its subcontractors other than
Petrobras. Because our claims, together with change
orders that are currently under negotiation, exceed this
amount, we cannot give assurance that there is adequate
funding to cover current or future KBR claims. Unless the
project owner provides additional funding or permits us to
defer repayment of the $300 million advance, and assuming
the project owner does not allege default on our part, we
may be obligated to fund operating cash flow shortages over
the remaining project life in an amount we currently
estimate to be up to approximately $400 million.
The possible Chapter 11 pre-packaged bankruptcy filing
by KBR in connection with the settlement of its asbestos
claims would constitute an event of default under the loan

N O T E S T O A N N U A L F I N A N C I A L S T A T E M E N T S
1012 0 0 2 H A L L I B U R T O N A N N U A L R E P O R T
documents with the banks unless waivers are obtained.
KBR believes that it is unlikely that the banks will exercise
any right to cease funding given the current status of the
project and the fact that a failure to pay KBR may allow KBR
to cease work on the project without Petrobras having a
readily available substitute contractor.
KBR and Petrobras are currently attempting to resolve
any disputes through ongoing negotiations between
the parties and each has appointed a high-level team for
this purpose.
Secur i t ies and Exchange Commiss ion ( “SEC”)
Invest igat ion and For tune 500 Rev iew. In late May 2002,
we received a letter from the Fort Worth District Office of
the Securities and Exchange Commission stating that it was
initiating a preliminary inquiry into some of our accounting
practices. In mid-December 2002, we were notified by the
SEC that a formal order of investigation had been issued.
Since that time, the SEC has issued subpoenas calling for
the production of documents and requiring the appearance
of a number of witnesses to testify regarding those
accounting practices, which relate to the recording of
revenues associated with cost overruns and unapproved
claims on long-term engineering and construction projects.
Throughout the informal inquiry and during the
pendency of the formal investigation, we have provided
approximately 300,000 documents to the SEC. The
production of documents is essentially complete and the
process of providing witnesses to testify is ongoing. To our
knowledge, the SEC’s investigation has focused on the
compliance with generally accepted accounting principles
of our recording of revenues associated with cost overruns
and unapproved claims for long-term engineering and
construction projects, and the disclosure of our accrual
practice. Accrual of revenue from unapproved claims is an
accepted and widely followed accounting practice for
companies in the engineering and construction business.
Although we accrued revenue related to unapproved
claims in 1998, we first made disclosures regarding the
accruals in our 1999 Annual Report on Form 10-K. We
believe we properly applied the required methodology of the
American Institute of Certified Public Accountants’
Statement of Position 81-1, “Accounting for Performance of
Construction-Type and Certain Production-Type
Contracts,” and satisfied the relevant criteria for accruing
this revenue, although the SEC may conclude otherwise.
On December 21, 2001, the SEC’s Division of Corporation
Finance announced that it would review the annual reports
of all Fortune 500 companies that file periodic reports with
the SEC. We received the SEC’s initial comments in letter
form dated September 20, 2002 and responded on October 31,
2002. Since then, we have received and responded to three
follow-up sets of comments, most recently in March 2003.
Secur i t ies and re la ted l i t i gat ion . On June 3, 2002, a
class action lawsuit was filed against us in the United
States District Court for the Northern District of Texas on
behalf of purchasers of our common stock alleging
violations of the federal securities laws. After that date,
approximately twenty similar class actions were filed
against us in that or other federal district courts. Several of
those lawsuits also named as defendants Arthur Andersen,
LLP (“Arthur Andersen”), our independent accountants for
the period covered by the lawsuit, and several of our
present or former officers and directors. Those lawsuits
allege that we violated federal securities laws in failing to
disclose a change in the manner in which we accounted for
revenues associated with unapproved claims on long-term
engineering and construction contracts, and that we
overstated revenue by accruing the unapproved claims. One
such action was subsequently dismissed voluntarily, without
prejudice, upon motion by the filing plaintiff. The federal
securities fraud class actions have all been transferred to
the U.S. District Court for the Northern District of Texas
and consolidated before the Honorable Judge David Godbey.
The amended consolidated class action complaint in that
case, styled Richard Moore v. Halliburton, was scheduled to
be filed in February 2003, but that date has been extended
by agreement of the parties. It is unclear as of this time
when the amended consolidated class action complaint will

N O T E S T O A N N U A L F I N A N C I A L S T A T E M E N T S
2 0 0 2 H A L L I B U R T O N A N N U A L R E P O R T 102
be filed. However, we believe that we have meritorious
defenses to the claims and intend to vigorously defend
against them.
Another case, also filed in the United States District
Court for the Northern District of Texas on behalf of three
individuals, and based upon the same revenue recognition
practices and accounting treatment that is the subject of the
securities class actions, alleges only common law and
statutory fraud in violation of Texas state law. We moved to
dismiss that action on October 24, 2002, as required by
the court’s scheduling order, on the bases of lack of federal
subject matter jurisdiction and failure to plead with that
degree of particularity required by the rules of procedure.
That motion has now been fully briefed and is before the
court awaiting ruling.
In addition to the securities class actions, one additional
class action, alleging violations of ERISA in connection with
the Company’s Benefits Committee’s purchase of our stock
for the accounts of participants in our 401 (k) retirement
plan during the period we allegedly knew or should have
known that our revenue was overstated as a result of the
accrual of revenue in connection with unapproved claims,
was filed and subsequently voluntarily dismissed.
Finally, on October 11, 2002, a shareholder derivative
action against present and former directors and our former
CFO was filed alleging breach of fiduciary duty and
corporate waste arising out of the same events and
circumstances upon which the securities class actions are
based. We have moved to dismiss that action and a hearing
on that motion has taken place in March 2003. We believe
the action is without merit and we intend to vigorously
defend it.
BJ Serv ices Company patent l i t i gat ion . On April 12,
2002, a federal court jury in Houston, Texas, returned a
verdict against Halliburton Energy Services, Inc. in a patent
infringement lawsuit brought by BJ Services Company, or
BJ. The lawsuit alleged that our Phoenix fracturing fluid
infringed a patent issued to BJ in January 2000 for a
method of well fracturing using a specific fracturing fluid.
The jury awarded BJ approximately $98 million in damages,
plus pre-judgment interest, which was less than one-quarter
of BJ’s claim at the beginning of the trial. A total of $102
million was accrued in the first quarter, which was
comprised of the $98 million judgment and $4 million in
pre-judgment interest costs. The jury also found that there
was no intentional infringement by Halliburton Energy
Services. As a result of the jury’s determination of
infringement, the court has enjoined us from further use of
our Phoenix fracturing fluid. We have posted a supersedeas
bond in the amount of approximately $107 million to
cover the damage award, pre-judgment and post-judgment
interest, and awardable costs. We timely appealed the
judgment and the appeal has now been fully briefed and we
are awaiting notice of a date of hearing before the United
States Court of Appeals for the Federal Circuit, which hears
all appeals of patent cases. While we believe we have a
valid basis for appeal and intend to vigorously pursue our
appeal, any favorable outcome from that appeal is not
assured. We have alternative products to use in our
fracturing operations, and do not expect the loss of the use
of the Phoenix fracturing fluid to have a material adverse
impact on our overall energy services business.
Ang lo -Dutch (Tenge) . We have been sued in the District
Court of Harris County, Texas by Anglo-Dutch (Tenge)
L.L.C. and Anglo-Dutch Petroleum International, Inc. for
allegedly breaching a confidentiality agreement related to
an investment opportunity we considered in the late 1990s
in an oil field in the former Soviet republic of Kazakhstan.
While we believe the claims raised in that lawsuit are
without merit and are vigorously defending against them,
the plaintiffs have announced their intention to seek
approximately $680 million in damages. We have moved for
summary judgment and a hearing on that motion was
held on March 12 of 2003. The court’s ruling on this motion
is still pending. Trial is set for April 21, 2003.
Improper payments repor ted to the Secur i t ies and
Exchange Commiss ion . We have reported to the SEC that
one of our foreign subsidiaries operating in Nigeria made

N O T E S T O A N N U A L F I N A N C I A L S T A T E M E N T S
1032 0 0 2 H A L L I B U R T O N A N N U A L R E P O R T
improper payments of approximately $2.4 million to an
entity owned by a Nigerian national who held himself out as
a tax consultant when in fact he was an employee of a local
tax authority. The payments were made to obtain favorable
tax treatment and clearly violated our Code of Business
Conduct and our internal control procedures. The payments
were discovered during an audit of the foreign subsidiary.
We have conducted an investigation assisted by outside
legal counsel. Based on the findings of the investigation we
have terminated several employees. None of our senior
officers were involved. We are cooperating with the SEC in
its review of the matter. We plan to take further action to
ensure that our foreign subsidiary pays all taxes owed in
Nigeria, which may be as much as an additional $3 million,
which amount was fully accrued as of March 31, 2002.
The integrity of our Code of Business Conduct and our
internal control procedures are essential to the way we
conduct business.
Env i ronmenta l . We are subject to numerous
environmental, legal and regulatory requirements related to
our operations worldwide. In the United States, these laws
and regulations include the Comprehensive Environmental
Response, Compensation and Liability Act, the Resources
Conservation and Recovery Act, the Clean Air Act, the
Federal Water Pollution Control Act and the Toxic Substances
Control Act, among others. In addition to the federal laws
and regulations, states where we do business may have
equivalent laws and regulations by which we must also
abide. We evaluate and address the environmental impact of
our operations by assessing and remediating contaminated
properties in order to avoid future liabilities and comply
with environmental, legal and regulatory requirements. On
occasion, we are involved in specific environmental litigation
and claims, including the remediation of properties we own
or have operated as well as efforts to meet or correct
compliance-related matters.
We do not expect costs related to these remediation
requirements to have a material adverse effect on our
consolidated financial position or our results of operations.
Our accrued liabilities for environmental matters were $48
million as of December 31, 2002 and $49 million as of
December 31, 2001. The liability covers numerous properties
and no individual property accounts for more than 10% of
the current liability balance. In some instances, we have
been named a potentially responsible party by a regulatory
agency, but in each of those cases, we do not believe we have
any material liability. We have subsidiaries that have
been named as potentially responsible parties along with
other third parties for ten federal and state superfund sites
for which we have established liabilities. As of December 31,
2002, those ten sites accounted for $8 million of our total
$48 million liability.
Letters of c red i t . In the normal course of business, we
have agreements with banks under which approximately
$1.4 billion of letters of credit or bank guarantees were
issued, including $204 million which relate to our joint
ventures’ operations. Effective October 9, 2002, we amended
an agreement with banks under which $261 million of
letters of credit have been issued. The amended agreement
removes the provision that previously allowed the banks to
require collateralization if ratings of Halliburton debt fell
below investment grade ratings. The revised agreements
include provisions that require us to maintain ratios of
debt to total capital and of total earnings before interest,
taxes, depreciation and amortization to interest expense.
The definition of debt includes our asbestos liability. The
definition of total earnings before interest, taxes, depreciation
and amortization excludes any non-cash charges related
to the proposed global asbestos settlement through
December 31, 2003.
If our debt ratings fall below investment grade, we would
be in technical breach of a bank agreement covering another
$160 million of letters of credit at December 31, 2002, which
might entitle the bank to set-off rights. In addition, a $151
million letter of credit line, of which $121 million has been
issued, includes provisions that allow the bank to require
cash collateralization for the full line if debt ratings of either
rating agency fall below the rating of BBB by Standard &

N O T E S T O A N N U A L F I N A N C I A L S T A T E M E N T S
2 0 0 2 H A L L I B U R T O N A N N U A L R E P O R T 104
Poor’s or Baa2 by Moody’s Investors’ Services. These letters
of credit and bank guarantees generally relate to our
guaranteed performance or retention payments under our
long-term contracts and self-insurance.
In the past, no significant claims have been made
against letters of credit we have issued. We do not
anticipate material losses to occur as a result of these
financial instruments.
L iqu idated damages . Many of our engineering and
construction contracts have milestone due dates that must
be met or we may be subject to penalties for liquidated
damages if claims are asserted and we were responsible for
the delays. These generally relate to specified activities
within a project by a set contractual date or achievement of
a specified level of output or throughput of a plant we
construct. Each contract defines the conditions under which
a customer may make a claim for liquidated damages. In
most instances, liquidated damages are never asserted by
the customer but the potential to do so is used in
negotiating claims and closing out the contract. We had not
accrued a liability for $364 million at December 31, 2002
and $97 million at December 31, 2001 of possible liquidated
damages as we consider the imposition of liquidated
damages to be unlikely. We believe we have valid claims for
schedule extensions against the customers which would
eliminate any liability for liquidated damages. Of the total
liquidated damages, $263 million at December 31, 2002 and
$77 million at December 31, 2001 relate to unasserted
liquidated damages for the Barracuda-Caratinga project.
The estimated schedule impact of change orders requested
by the customer is expected to cover approximately one-half
of the $263 million exposure at December 31, 2002 and
claims for schedule extension are expected to cover the
remaining exposure.
Other. We are a party to various other legal proceedings.
We expense the cost of legal fees related to these
proceedings as incurred. We believe any liabilities we may
have arising from these proceedings will not be material to
our consolidated financial position or results of operations.
NOTE 13.
INCOME (LOSS) PER SHARE
Millions of dollars and shares except per share data 2002 2001 2000
Income (loss) from continuing operations before change in accounting method, net $ (346) $ 551 $ 188
Basic weighted average shares 432 428 442 Effect of common stock equivalents — 2 4 Diluted weighted average shares 432 430 446 Income (loss) per common share
from continuing operations before change in accounting method, net:Basic $(0.80) $1.29 $0.42 Diluted $(0.80) $1.28 $0.42
Basic income (loss) per share is based on the weighted
average number of common shares outstanding during the
period. Diluted income (loss) per share includes additional
common shares that would have been outstanding if
potential common shares with a dilutive effect had been
issued. For 2002, we have used the basic weighted average
shares in the calculation as the effect of the common stock
equivalents would be antidilutive based upon the net loss
from continuing operations. Included in the computation
of diluted income per share in 2001 and 2000 are rights we
issued in connection with the PES acquisition for between
850,000 and 2.1 million shares of Halliburton common stock.
Excluded from the computation of diluted income per
share are options to purchase 10 million shares of common
stock in 2001 and 1 million shares in 2000. These options
were outstanding during these years, but were excluded
because the option exercise price was greater than the
average market price of the common shares.
NOTE 14.
REORGANIZATION OF BUSINESS OPERATIONS
On March 18, 2002 we announced plans to restructure our
businesses into two operating subsidiary groups, the Energy
Services Group and the Engineering and Construction
Group. As part of this reorganization, we separated and
consolidated the entities in our Energy Services Group
together as direct and indirect subsidiaries of Halliburton

1052 0 0 2 H A L L I B U R T O N A N N U A L R E P O R T
N O T E S T O A N N U A L F I N A N C I A L S T A T E M E N T S
Energy Services, Inc. We also separated and consolidated the
entities in our Engineering and Construction Group
together as direct and indirect subsidiaries of the former
Dresser Industries, Inc., which became a limited liability
company during the second quarter of 2002 and was
renamed DII Industries. The reorganization of business
operations facilitated the separation, organizationally,
financially, and operationally, of our two business segments,
which we believe will significantly improve operating
efficiencies in both, while streamlining management and
easing manpower requirements. In addition, many support
functions, which were previously shared, were moved into
the two business groups. As a result, we took actions during
2002 to reduce our cost structure by reducing personnel,
moving previously shared support functions into the two
business groups and realigning ownership of international
subsidiaries by group.
In 2002, we incurred costs related to the restructuring of
approximately $107 million which consisted of the following:
• $64 million in personnel related expense;
• $17 million of asset related write-downs;
• $20 million in professional fees related to therestructuring; and
• $6 million related to contract terminations.
Of this amount, $8 million remains in accruals for
severance arrangements and approximately $2 million for
other items. We expect these remaining payments will be
made during 2003.
Although we have no specific plans currently, the
reorganization would facilitate separation of the ownership
of the two businesses in the future if we identify an
opportunity that produces greater value for our shareholders
than continuing to own both businesses.
In the fourth quarter of 2000 we approved a plan to
reorganize our engineering and construction businesses into
one business unit. This restructuring was undertaken
because our engineering and construction businesses
continued to experience delays in customer commitments for
new upstream and downstream projects. With the exception
of deepwater projects, short-term prospects for increased
engineering and construction activities in either the
upstream or downstream businesses were not positive. As a
result of the reorganization of the engineering and
construction businesses, we took actions to rationalize our
operating structure including write-offs of equipment and
licenses of $10 million, engineering reference designs of $4
million, capitalized software of $6 million, and recorded
severance costs of $16 million. Of these charges, $30 million
was reflected under the captions Cost of services and $6
million as General and administrative in our 2000
consolidated statements of income. Severance and related
costs of $16 million were for the reduction of approximately
30 senior management positions. In January 2002, the
last of the personnel actions was completed and we have no
remaining accruals related to the 2000 restructuring.
NOTE 15.
CHANGE IN ACCOUNTING METHOD
In July 2001, the Financial Accounting Standards Board
issued SFAS No. 142, “Goodwill and Other Intangible
Assets.” Effective January 1, 2002, goodwill is no longer
amortized but is tested for impairment as set forth in the
statement. We now perform our goodwill impairment test
for each of our reporting units in accordance with SFAS
No. 142 and those tests indicate that none of the goodwill we
currently have recorded is impaired. Amortization of
goodwill for 2001 totaled $42 million pretax and $38 million
after-tax.
In July 2001, the Financial Accounting Standards Board
issued SFAS No. 141, “Business Combinations” which
requires the purchase method of accounting for business
combination transactions initiated after June 30, 2001. The
statement requires that goodwill recorded on acquisitions
completed prior to July 1, 2001 be amortized through
December 31, 2001. Goodwill amortization is precluded on
acquisitions completed after June 30, 2001. We ceased
amortization of goodwill on December 31, 2001.

N O T E S T O A N N U A L F I N A N C I A L S T A T E M E N T S
2 0 0 2 H A L L I B U R T O N A N N U A L R E P O R T 106
NOTE 16 .
INCOME TAXES
The components of the (provision) benefit for income taxes are:Years ended December 31 Millions of dollars 2002 2001 2000
Current income taxes:Federal $ 71 $(146) $ (16) Foreign (173) (157) (114) State 4 (20) (5) Total (98) (323) (135) Deferred income taxes:Federal (11) (58) (20) Foreign and state 29 (3) 26 Total 18 (61) 6 Total continuing operations $ (80) $(384) $(129) Discontinued operations:
Current income taxes 21 (15) (60) Deferred income taxes 133 35 —
Disposal of discontinued operations — (199) (141) Total $ 74 $(563) $(330)
Included in the current (provision) benefit for income
taxes are foreign tax credits of $89 million in 2002, $106
million in 2001 and $113 million in 2000. The United States
and foreign components of income before income taxes,
minority interests, discontinued operations, and change in
accounting method are as follows:
Years ended December 31 Millions of dollars 2002 2001 2000
United States $(537) $565 $128 Foreign 309 389 207 Total $(228) $954 $335
The primary components of our deferred tax assets and
liabilities and the related valuation allowances, including
federal deferred tax assets of discontinued operations are
as follows:
December 31 Millions of dollars 2002 2001
Gross deferred tax assets:Employee compensation and benefits $ 282 $ 214Capitalized research and experimentation 75 46Accrued liabilities 102 121Insurance accruals 78 82Construction contract accounting methods 114 100Inventory 46 53Asbestos and silica related liabilities 1,201 258Intercompany profit 32 54Net operating loss carryforwards 81 44Foreign tax credit carryforward 49 —AMT credit carryforward 5 —Intangibles 6 18Allowance for bad debt 40 36Other 23 41
Total $ 2,134 $1,067Gross deferred tax liabilities:
Insurance for asbestos and silica related liabilities $ 724 $ 214 Depreciation and amortization 188 106Nonrepatriated foreign earnings 36 36All other 13 101
Total $ 961 $ 457 Valuation allowances:
Net operating loss carryforwards $ 77 $ 38Future tax attributes related to asbestos
litigation 233 —Foreign tax credit limitation 49 —All other 7 8
Total 366 46 Net deferred income tax asset $ 807 $ 564
We have $158 million of net operating loss carryforwards
that expire from 2003 through 2011 and net operating loss
carryforwards of $71 million with indefinite expiration
dates. The federal alternative minimum tax credits are
available to reduce future U.S. federal income taxes on an
indefinite basis.
We have accrued for the potential repatriation of
undistributed earnings of our foreign subsidiaries and
consider earnings above the amounts on which tax has been
provided to be permanently reinvested. While these
additional earnings could become subject to additional tax if
repatriated, repatriation is not anticipated. Any additional
amount of tax is not practicable to estimate.
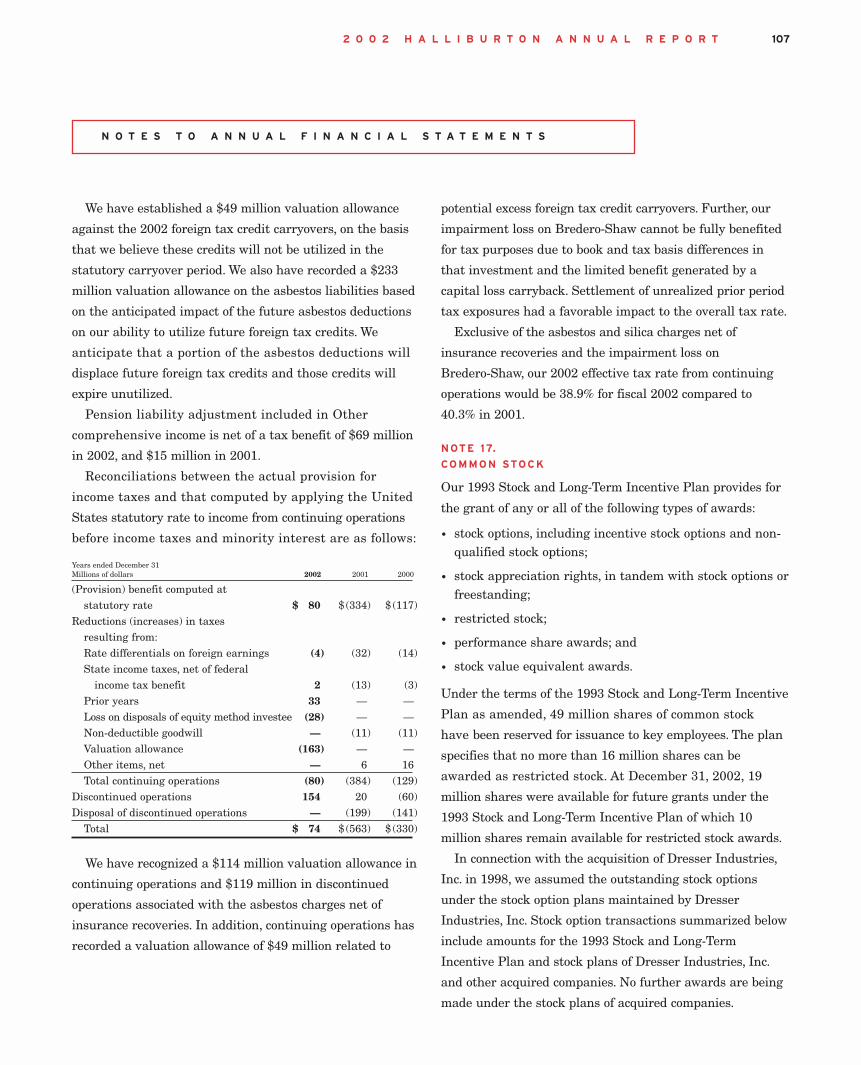
N O T E S T O A N N U A L F I N A N C I A L S T A T E M E N T S
1072 0 0 2 H A L L I B U R T O N A N N U A L R E P O R T
We have established a $49 million valuation allowance
against the 2002 foreign tax credit carryovers, on the basis
that we believe these credits will not be utilized in the
statutory carryover period. We also have recorded a $233
million valuation allowance on the asbestos liabilities based
on the anticipated impact of the future asbestos deductions
on our ability to utilize future foreign tax credits. We
anticipate that a portion of the asbestos deductions will
displace future foreign tax credits and those credits will
expire unutilized.
Pension liability adjustment included in Other
comprehensive income is net of a tax benefit of $69 million
in 2002, and $15 million in 2001.
Reconciliations between the actual provision for
income taxes and that computed by applying the United
States statutory rate to income from continuing operations
before income taxes and minority interest are as follows:
Years ended December 31 Millions of dollars 2002 2001 2000
(Provision) benefit computed at statutory rate $ 80 $ (334) $ (117)
Reductions (increases) in taxes resulting from:Rate differentials on foreign earnings (4) (32) (14) State income taxes, net of federal
income tax benefit 2 (13) (3)Prior years 33 — —Loss on disposals of equity method investee (28) — —Non-deductible goodwill — (11) (11)Valuation allowance (163) — —Other items, net — 6 16Total continuing operations (80) (384) (129)
Discontinued operations 154 20 (60)Disposal of discontinued operations — (199) (141)
Total $ 74 $ (563) $ (330)
We have recognized a $114 million valuation allowance in
continuing operations and $119 million in discontinued
operations associated with the asbestos charges net of
insurance recoveries. In addition, continuing operations has
recorded a valuation allowance of $49 million related to
potential excess foreign tax credit carryovers. Further, our
impairment loss on Bredero-Shaw cannot be fully benefited
for tax purposes due to book and tax basis differences in
that investment and the limited benefit generated by a
capital loss carryback. Settlement of unrealized prior period
tax exposures had a favorable impact to the overall tax rate.
Exclusive of the asbestos and silica charges net of
insurance recoveries and the impairment loss on
Bredero-Shaw, our 2002 effective tax rate from continuing
operations would be 38.9% for fiscal 2002 compared to
40.3% in 2001.
NOTE 17.
COMMON STOCK
Our 1993 Stock and Long-Term Incentive Plan provides for
the grant of any or all of the following types of awards:
• stock options, including incentive stock options and non-qualified stock options;
• stock appreciation rights, in tandem with stock options orfreestanding;
• restricted stock;
• performance share awards; and
• stock value equivalent awards.
Under the terms of the 1993 Stock and Long-Term Incentive
Plan as amended, 49 million shares of common stock
have been reserved for issuance to key employees. The plan
specifies that no more than 16 million shares can be
awarded as restricted stock. At December 31, 2002, 19
million shares were available for future grants under the
1993 Stock and Long-Term Incentive Plan of which 10
million shares remain available for restricted stock awards.
In connection with the acquisition of Dresser Industries,
Inc. in 1998, we assumed the outstanding stock options
under the stock option plans maintained by Dresser
Industries, Inc. Stock option transactions summarized below
include amounts for the 1993 Stock and Long-Term
Incentive Plan and stock plans of Dresser Industries, Inc.
and other acquired companies. No further awards are being
made under the stock plans of acquired companies.

N O T E S T O A N N U A L F I N A N C I A L S T A T E M E N T S
2 0 0 2 H A L L I B U R T O N A N N U A L R E P O R T 108
The following table represents our stock options granted,
exercised and forfeited during the past three years:Weighted Average
Number Exercise of Shares Exercise Price Price
Stock Options (in millions) per Share per Share
Outstanding at December 31, 1999 17.1 $ 3.10 – 61.50 $32.03
Granted 1.7 34.75 – 54.00 41.61 Exercised (3.6) 3.10 – 45.63 25.89 Forfeited (0.5) 12.20 – 54.50 37.13
Outstanding at December 31, 2000 14.7 $ 8.28 – 61.50 $34.54
Granted 3.6 12.93 – 45.35 35.56 Exercised (0.7) 8.93 – 40.81 25.34 Forfeited (0.5) 12.32 – 54.50 36.83
Outstanding at December 31, 2001 17.1 $ 8.28 – 61.50 $35.10
Granted 2.6 9.10 – 19.75 12.57 Exercised —* 8.93 – 17.21 11.39 Forfeited (1.2) 8.28 – 54.50 31.94
Outstanding at December 31, 2002 18.5 $9.10 – 61.50 $32.10
*Actual exercises for 2002 were approximately 30,000 shares.
Options outstanding at December 31, 2002 are composed of
the following:Outstanding Exercisable
Weighted Average Weighted Weighted
Number of Remaining Average Number AverageRange of Shares Contractual Exercise of Shares Exercise Exercise Prices (in millions) Life Price (in millions) Price
$ 9.10 – 19.27 3.2 7.4 $13.41 0.7 $16.96$19.28 – 30.14 5.1 4.8 27.50 4.8 27.79$30.15 – 39.54 6.3 6.5 37.30 4.8 38.55$39.55 – 61.50 3.9 6.7 45.28 2.2 48.34$ 9.10 – 61.50 18.5 6.2 $32.10 12.5 $34.98
There were 10.7 million options exercisable with a
weighted average exercise price of $34.08 at December 31,
2001, and 8.8 million options exercisable with a weighted
average exercise price of $32.81 at December 31, 2000.
All stock options under the 1993 Stock and Long-Term
Incentive Plan, including options granted to employees of
Dresser Industries, Inc. since its acquisition, are granted at
the fair market value of the common stock at the grant date.
Stock options generally expire 10 years from the grant
date. Stock options under the 1993 Stock and Long-Term
Incentive Plan vest ratably over a three or four year period.
Other plans have vesting periods ranging from three to 10
years. Options under the Non-Employee Directors’ Plan vest
after six months.
Restricted shares awarded under the 1993 Stock and
Long-Term Incentive Plan were 1,706,643 in 2002, 1,484,034
in 2001, and 695,692 in 2000. The shares awarded are net
of forfeitures of 46,894 in 2002, 170,050 in 2001, and 69,402
in 2000. The weighted average fair market value per share
at the date of grant of shares granted was $14.95 in 2002,
$30.90 in 2001, and $42.25 in 2000.
Our Restricted Stock Plan for Non-Employee Directors
allows for each non-employee director to receive an annual
award of 400 restricted shares of common stock as a part
of compensation. We reserved 100,000 shares of common
stock for issuance to non-employee directors. Under this plan
we issued 4,400 restricted shares in 2002, 4,800 restricted
shares in 2001, and 3,600 restricted shares in 2000. At
December 31, 2002, 38,000 shares have been issued to non-
employee directors under this plan. The weighted average
fair market value per share at the date of grant of shares
granted was $12.56 in 2002, $34.35 in 2001, and $46.81
in 2000.
Our Employees’ Restricted Stock Plan was established for
employees who are not officers, for which 200,000 shares
of common stock have been reserved. At December 31, 2002,
152,650 shares (net of 42,750 shares forfeited) have been
issued. Forfeitures were 400 in 2002, 800 in 2001, and 6,450
in 2000. No further grants are being made under this plan.
Under the terms of our Career Executive Incentive Stock
Plan, 15 million shares of our common stock were reserved
for issuance to key officers and key employees at a
purchase price not to exceed par value of $2.50 per share. At
December 31, 2002, 11.7 million shares (net of 2.2 million
shares forfeited) have been issued under the plan. No
further grants will be made under the Career Executive
Incentive Stock Plan.

N O T E S T O A N N U A L F I N A N C I A L S T A T E M E N T S
1092 0 0 2 H A L L I B U R T O N A N N U A L R E P O R T
Restricted shares issued under the 1993 Stock and Long-
Term Incentive Plan, Restricted Stock Plan for Non-
Employee Directors, Employees’ Restricted Stock Plan and
the Career Executive Incentive Stock Plan are limited as to
sale or disposition. These restrictions lapse periodically over
an extended period of time not exceeding 10 years.
Restrictions may also lapse for early retirement and other
conditions in accordance with our established policies. Upon
termination of employment, shares in which restrictions
have not lapsed must be returned to us, resulting in
restricted stock forfeitures. The fair market value of the
stock, on the date of issuance, is being amortized and
charged to income (with similar credits to paid-in capital in
excess of par value) generally over the average period
during which the restrictions lapse. At December 31, 2002,
the unamortized amount is $75 million. We recognized
compensation costs of $38 million in 2002, $23 million in
2001, and $18 million in 2000.
During 2002, our Board of Directors approved the 2002
Employee Stock Purchase Plan (ESPP) and reserved
12 million shares for issuance. Under the ESPP, eligible
employees may have up to 10% of their earnings withheld,
subject to some limitations, to be used to purchase shares
of our common stock. Unless the Board of Directors
shall determine otherwise, each 6-month offering period
commences on January 1 and July 1 of each year. The
price at which common stock may be purchased under the
ESPP is equal to 85% of the lower of the fair market value
of the common stock on the commencement date or last
trading day of each offering period. There were approximately
541,000 shares sold through the ESPP in 2002.
On April 25, 2000, our Board of Directors approved plans to
implement a share repurchase program for up to 44 million
shares. No shares were repurchased in 2002. We repurchased
1.2 million shares at a cost of $25 million in 2001 and 20.4
million shares at a cost of $759 million in 2000.
NOTE 18 .
SERIES A JUNIOR PARTICIPATING
PREFERRED STOCK
We previously declared a dividend of one preferred stock
purchase right on each outstanding share of common stock.
The dividend is also applicable to each share of our common
stock that was issued subsequent to adoption of the Rights
Agreement entered into with Mellon Investor Services LLC.
Each preferred stock purchase right entitles its holder to
buy one two-hundredth of a share of our Series A Junior
Participating Preferred Stock, without par value, at an
exercise price of $75. These preferred stock purchase rights
are subject to anti-dilution adjustments, which are
described in the Rights Agreement entered into with Mellon.
The preferred stock purchase rights do not have any voting
rights and are not entitled to dividends.
The preferred stock purchase rights become exercisable in
limited circumstances involving a potential business
combination. After the preferred stock purchase rights
become exercisable, each preferred stock purchase right will
entitle its holder to an amount of our common stock, or in
some circumstances, securities of the acquirer, having a total
market value equal to two times the exercise price of the
preferred stock purchase right. The preferred stock purchase
rights are redeemable at our option at any time before they
become exercisable. The preferred stock purchase rights
expire on December 15, 2005. No event during 2002 made
the preferred stock purchase rights exercisable.
NOTE 19.
F INANCIAL INSTRUMENTS AND RISK MANAGEMENT
In June 1998, the Financial Accounting Standards Board
issued SFAS No. 133 “Accounting for Derivative Instruments
and for Hedging Activities”, subsequently amended by SFAS
No. 137 and SFAS No. 138. This standard requires entities
to recognize all derivatives on the balance sheet as assets or
liabilities and to measure the instruments at fair value.
Accounting for gains and losses from changes in those fair
values is specified in the standard depending on the
intended use of the derivative and other criteria. We adopted
N O T E S T O A N N U A L F I N A N C I A L S T A T E M E N T S
2 0 0 2 H A L L I B U R T O N A N N U A L R E P O R T 110
SFAS No. 133 effective January 2001 and recorded a $1
million after-tax credit for the cumulative effect of adopting
the change in accounting method. We do not expect future
measurements at fair value under the new accounting
method to have a material effect on our financial condition
or results of operations.
Fore ign exchange r i sk . Techniques in managing foreign
exchange risk include, but are not limited to, foreign
currency borrowing and investing and the use of currency
derivative instruments. We selectively manage significant
exposures to potential foreign exchange losses considering
current market conditions, future operating activities and
the associated cost in relation to the perceived risk of loss.
The purpose of our foreign currency risk management
activities is to protect us from the risk that the eventual
dollar cash flows resulting from the sale and purchase of
products and services in foreign currencies will be adversely
affected by changes in exchange rates. We do not hold
or issue derivative financial instruments for trading or
speculative purposes.
We manage our currency exposure through the use of
currency derivative instruments as it relates to the major
currencies, which are generally the currencies of the
countries for which we do the majority of our international
business. These contracts generally have an expiration
date of two years or less. Forward exchange contracts, which
are commitments to buy or sell a specified amount of a
foreign currency at a specified price and time, are generally
used to manage identifiable foreign currency commitments.
Forward exchange contracts and foreign exchange option
contracts, which convey the right, but not the obligation, to
sell or buy a specified amount of foreign currency at a
specified price, are generally used to manage exposures
related to assets and liabilities denominated in a foreign
currency. None of the forward or option contracts are
exchange traded. While derivative instruments are subject
to fluctuations in value, the fluctuations are generally offset
by the value of the underlying exposures being managed.
The use of some contracts may limit our ability to benefit
from favorable fluctuations in foreign exchange rates.
Foreign currency contracts are not utilized to manage
exposures in some currencies due primarily to the lack of
available markets or cost considerations (non-traded
currencies). We attempt to manage our working capital
position to minimize foreign currency commitments in non-
traded currencies and recognize that pricing for the
services and products offered in these countries should cover
the cost of exchange rate devaluations. We have historically
incurred transaction losses in non-traded currencies.
Assets , l i ab i l i t i es and forecasted cash f lows
d e n o m i n a t e d i n f o re i g n c u r re n c i e s . We utilize the
derivative instruments described above to manage the
foreign currency exposures related to specific assets and
liabilities, which are denominated in foreign currencies;
however, we have not elected to account for these
instruments as hedges for accounting purposes. Additionally,
we utilize the derivative instruments described above to
manage forecasted cash flows denominated in foreign
currencies generally related to long-term engineering and
construction projects. While we enter into these instruments
to manage the foreign currency risk on these projects,
we have chosen not to seek hedge accounting treatment for
these contracts. The fair value of these contracts was
immaterial as of the end of 2002 and 2001.
Not iona l amounts and fa i r market va lues . The notional
amounts of open forward contracts and options for
continuing operations were $609 million at December 31,
2002 and $505 million at December 31, 2001. The notional
amounts of our foreign exchange contracts do not generally
represent amounts exchanged by the parties, and thus, are
not a measure of our exposure or of the cash requirements
relating to these contracts. The amounts exchanged are
calculated by reference to the notional amounts and by other
terms of the derivatives, such as exchange rates.
Cred i t r i sk . Financial instruments that potentially
subject us to concentrations of credit risk are primarily cash
equivalents, investments and trade receivables. It is our

N O T E S T O A N N U A L F I N A N C I A L S T A T E M E N T S
1112 0 0 2 H A L L I B U R T O N A N N U A L R E P O R T
practice to place our cash equivalents and investments in
high-quality securities with various investment institutions.
We derive the majority of our revenues from sales and
services, including engineering and construction, to the
energy industry. Within the energy industry, trade
receivables are generated from a broad and diverse group of
customers. There are concentrations of receivables in the
United States and the United Kingdom. We maintain an
allowance for losses based upon the expected collectibility of
all trade accounts receivable.
There are no significant concentrations of credit risk with
any individual counterparty related to our derivative
contracts. We select counterparties based on their
profitability, balance sheet and a capacity for timely
payment of financial commitments which is unlikely to be
adversely affected by foreseeable events.
I n terest ra te r i sk . We have several debt instruments
outstanding which have both fixed and variable interest
rates. We manage our ratio of fixed to variable-rate debt
through the use of different types of debt instruments and
derivative instruments.
Fa i r market va lue of f inanc ia l i nst ruments . The
estimated fair market value of long-term debt at year-end
for both 2002 and 2001 was $1.3 billion as compared to the
carrying amount of $1.5 billion at year-end for both 2002
and 2001. The fair market value of fixed rate long-term debt
is based on quoted market prices for those or similar
instruments. The carrying amount of variable rate long-term
debt approximates fair market value because these
instruments reflect market changes to interest rates. See
Note 11. The carrying amount of short-term financial
instruments, cash and equivalents, receivables, short-term
notes payable and accounts payable, as reflected in the
consolidated balance sheets approximates fair market value
due to the short maturities of these instruments. The
currency derivative instruments are carried on the balance
sheet at fair value and are based upon third-party quotes.
The fair market values of derivative instruments used for
fair value hedging and cash flow hedging were immaterial.
NOTE 20.
RETIREMENT PLANS
Our Company and subsidiaries have various plans which
cover a significant number of their employees. These plans
include defined contribution plans, which provide retirement
contributions in return for services rendered, provide an
individual account for each participant and have terms that
specify how contributions to the participant’s account are to
be determined rather than the amount of pension benefits
the participant is to receive. Contributions to these plans
are based on pretax income and/or discretionary amounts
determined on an annual basis. Our expense for the defined
contribution plans for both continuing and discontinued
operations totaled $80 million in 2002 compared to $129
million in 2001 and $140 million in 2000. Other retirement
plans include defined benefit plans, which define an amount
of pension benefit to be provided, usually as a function of age,
years of service or compensation. These plans are funded to
operate on an actuarially sound basis. Plan assets are
primarily invested in cash, short-term investments, real
estate, equity and fixed income securities of entities domiciled
in the country of the plan’s operation. Plan assets, expenses
and obligations for retirement plans in the following tables
include both continuing and discontinued operations.
2002 2001
Millions of dollars U.S. Int’l. U.S. Int’l.
CHANGE IN BENEFIT
OBLIGATION
Benefit obligation at beginning of year $140 $1,968 $ 288 $1,670
Service cost 1 72 2 60 Interest cost 9 102 13 89 Plan participants’ contributions — 14 — 14 Effect of business combinations
and new plans — 70 — — Amendments 1 (4) — — Divestitures — (5) (111) (90) Settlements/curtailments (1) (1) (46) — Currency fluctuations — 102 — 15 Actuarial gain/(loss) 5 (27) 8 270 Benefits paid (11) (52) (14) (60) Benefit obligation at
end of year $144 $2,239 $ 140 $1,968

N O T E S T O A N N U A L F I N A N C I A L S T A T E M E N T S
2 0 0 2 H A L L I B U R T O N A N N U A L R E P O R T 112
2002 2001
Millions of dollars U.S. Int’l. U.S. Int’l.
CHANGE IN PLAN ASSETS
Fair value of plan assets at beginning of year $130 $1,827 $ 313 $2,165
Actual return on plan assets (6) (69) (22) (294)Employer contribution 1 36 7 30Settlements (1) — (46) —Plan participants’ contributions — 14 1 14Effect of business combinations
and new plans — 45 — —Divestitures — (5) (109) (45)Currency fluctuations — 89 — 15 Benefits paid (11) (51) (14) (58) Fair value of plan assets at
end of year $113 $1,886 $ 130 $1,827 Funded status $ (31) $ (353) $ (10) $ (141)Unrecognized transition
obligation/(asset) — (2) (1) (3)Unrecognized actuarial
(gain)/loss 56 477 34 308 Unrecognized prior service
cost/(benefit) 1 (70) (2) (96)Net amount recognized $ 26 $ 52 $ 21 $ 68
We recognized an additional minimum pension liability
for the underfunded defined benefit plans. The additional
minimum liability is equal to the excess of the accumulated
benefit obligation over plan assets and accrued liabilities. A
corresponding amount is recognized as either an intangible
asset or a reduction of shareholders’ equity. For the year
ended December 31, 2002 we recognized $212 million in
additional minimum pension liability of which $130 million
was recorded as Other comprehensive income, net of tax.
2002 2001
Millions of dollars U.S. Int’l. U.S. Int’l.
AMOUNTS RECOGNIZED IN THE
CONSOLIDATED BALANCE SHEETS
Prepaid benefit cost $ 30 $ 102 $ 7 $ 85 Accrued benefit liability including
additional minimum liability (59) (250) (10) (36) Intangible asset 2 12 1 1 Accumulated other comprehensive
income, net of tax 35 122 15 12 Deferred tax asset 18 66 8 6 Net amount recognized $ 26 $ 52 $ 21 $ 68
Assumed long-term rates of return on plan assets,
discount rates for estimating benefit obligations and rates of
compensation increases vary for the different plans according
to the local economic conditions. The rates used are as follows:
Weighted-average assumptions 2002 2001 2000
Expected return on plan assets:United States plans 9.0% 9.0% 9.0%
International plans 5.5% to 8.16% 5.5% to 9.0% 3.5% to 9.0%
Discount rate:United States plans 7.0% 7.25% 7.5%
International plans 5.25% to 20.0% 5.0% to 8.0% 4.0% to 8.0%
Rate of compensation increase:United States plans 4.5% 4.5% 4.5%
International plans 3.0% to 21.0% 3.0% to 7.0% 3.0% to 7.6%
2002 2001 2000
Millions of dollars U.S. Int’l. U.S. Int’l. U.S. Int’l.
COMPONENTS OF NET
PERIODIC BENEFIT COST
Service cost $ 1 $ 72 $ 2 $ 60 $ 4 $ 57 Interest cost 9 102 13 89 20 87 Expected return on
plan assets (13) (106) (18) (95) (26) (99) Transition amount — (2) — (2) — — Amortization of prior
service cost (2) (6) (2) (6) (1) (6)Settlements/
curtailments — (2) 16 — 10 — Recognized actuarial
(gain)/loss 1 3 (1) (9) — (10) Net periodic benefit
(income) cost $ (4) $ 61 $ 10 $ 37 $ 7 $ 29
The projected benefit obligation, accumulated benefit
obligation, and fair value of plan assets for the pension
plans with accumulated benefit obligations in excess of plan
assets as of December 31, 2002 and 2001 are as follows:
Millions of dollars 2002 2001
Projected benefit obligation $2,319 $235 Accumulated benefit obligation $2,121 $215 Fair value of plan assets $1,942 $175
Po s t re t i re m e n t m e d i ca l p l a n . We offer postretirement
medical plans to specific eligible employees. For some plans,
our liability is limited to a fixed contribution amount for
each participant or dependent. The plan participants share
the total cost for all benefits provided above our fixed

N O T E S T O A N N U A L F I N A N C I A L S T A T E M E N T S
1132 0 0 2 H A L L I B U R T O N A N N U A L R E P O R T
contribution and participants’ contributions are adjusted as
required to cover benefit payments. We have made no
commitment to adjust the amount of our contributions;
therefore, the computed accumulated postretirement benefit
obligation amount is not affected by the expected future
health care cost inflation rate.
Other postretirement medical plans are contributory but
we generally absorb the majority of the costs. We may elect
to adjust the amount of our contributions for these plans. As
a result, the expected future health care cost inflation rate
affects the accumulated postretirement benefit obligation
amount. These plans have assumed health care trend rates
(weighted based on the current year benefit obligation) for
2002 of 13% which are expected to decline to 5% by 2007.
Obligations and expenses for postretirement medical
plans in the following tables include both continuing and
discontinued operations.
Millions of dollars 2002 2001
CHANGE IN BENEFIT OBLIGATION
Benefit obligation at beginning of year $ 157 $ 296 Service cost 1 2 Interest cost 11 15 Plan participants’ contributions 11 12 Settlements/curtailments — (144) Actuarial gain 33 5 Benefits paid (27) (29) Benefit obligation at end of year $ 186 $ 157
CHANGE IN PLAN ASSETS
Fair value of plan assets at beginning of year $ — $ — Employer contribution 16 17 Plan participants’ contributions 11 12 Benefits paid (27) (29) Fair value of plan assets at end of year $ — $ — Funded status $(186) $ (157) Employer contribution 2 2 Unrecognized actuarial gain 20 (14)Unrecognized prior service cost 2 3 Net amount recognized $(162) $ (166)
Millions of dollars 2002 2001
AMOUNTS RECOGNIZED IN THE
CONSOLIDATED BALANCE SHEETS
Accrued benefit liability $(162) $ (166) Net amount recognized $(162) $ (166)
Weighted-average assumptions 2002 2001 2000
Discount rate 7.0% 7.25% 7.50%
Millions of dollars 2002 2001 2000
COMPONENTS OF NET PERIODIC
BENEFIT COST
Service cost $ 1 $ 2 $ 3 Interest cost 11 15 20 Amortization of prior service cost — (3) (7) Settlements/curtailments — (221) — Recognized actuarial gain (1) (1) (1) Net periodic benefit cost $11 $ (208) $15
Assumed health care cost trend rates have a significant
effect on the amounts reported for the total of the health
care plans. A one-percentage-point change in assumed
health care cost trend rates would have the following effects:
One-Percentage-PointMillions of dollars Increase (Decrease)
Effect on total of service and interest cost components $ 1 $ (1)
Effect on the postretirement benefit obligation $ 10 $ (9)
NOTE 21 .
DRESSER INDUSTRIES, INC .
F INANCIAL INFORMATION
Since becoming a wholly owned subsidiary of Halliburton,
DII Industries (formerly Dresser Industries, Inc.) has ceased
filing periodic reports with the United States Securities and
Exchange Commission. DII Industries 8% guaranteed senior
notes, which were initially issued by Baroid Corporation,
remain outstanding and are fully and unconditionally
guaranteed by Halliburton. Under the terms of a Fourth
Supplemental Indenture, Halliburton Company in December
2002 assumed as co-obligor the payment of principle and
interest on the notes, and the performance of all of the
covenants and conditions of the related indenture.

2 0 0 2 H A L L I B U R T O N A N N U A L R E P O R T 114
N O T E S T O A N N U A L F I N A N C I A L S T A T E M E N T S
NOTE 22 .
GOODWILL AND OTHER INTANGIBLE ASSETS
We adopted the SFAS No. 142, “Goodwill and Other
Intangible Assets”, and in accordance with the statement,
amortization of goodwill has been discontinued. Our
reporting units as defined under SFAS No. 142 are the same
as our reportable operating segments: Energy Services
Group and Engineering and Construction Group. Goodwill
for the Energy Services Group was $402 million (net of $118
million accumulated amortization) in 2002, $386 million (net
of $118 million accumulated amortization) in 2001, and
$310 million (net of $97 million accumulated amortization)
in 2000. Goodwill for the Engineering and Construction
Group was $321 million (net of $152 million accumulated
amortization) in 2002, $334 million (net of $151 million
accumulated amortization) in 2001, and $287 million (net
of $134 million accumulated amortization) in 2000.
Had we been accounting for our goodwill under SFAS No.
142 for all periods presented, our net income (loss) and
earnings (loss) per share would have been as follows:
Years ended December 31 Millions of dollars except per share data 2002 2001 2000
Reported net income (loss) $ (998) $ 809 $ 501 Goodwill amortization, net of tax — 38 36 Adjusted net income (loss) $ (998) $ 847 $ 537 Basic earnings (loss) per share:
Reported net income (loss) $(2.31) $1.89 $1.13 Goodwill amortization, net of tax — 0.09 0.08 Adjusted net income (loss) $(2.31) $1.98 $1.21
Diluted earnings (loss) per share:Reported net income (loss) $(2.31) $1.88 $1.12 Goodwill amortization, net of tax — 0.09 0.08 Adjusted net income (loss) $(2.31) $1.97 $1.20
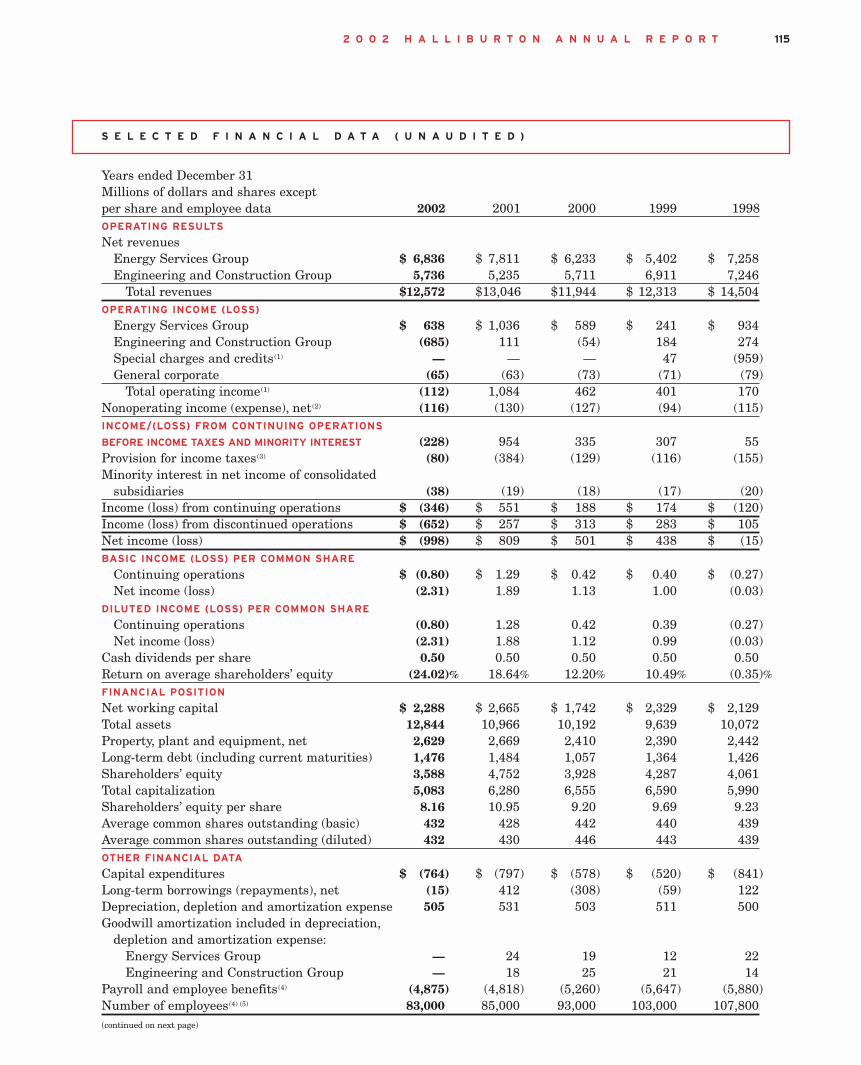
S E L E C T E D F I N A N C I A L D A T A ( U N A U D I T E D )
1152 0 0 2 H A L L I B U R T O N A N N U A L R E P O R T
Years ended December 31 Millions of dollars and shares except per share and employee data 2002 2001 2000 1999 1998 OPERATING RESULTS
Net revenues Energy Services Group $ 6,836 $ 7,811 $ 6,233 $ 5,402 $ 7,258Engineering and Construction Group 5,736 5,235 5,711 6,911 7,246
Total revenues $12,572 $13,046 $11,944 $ 12,313 $ 14,504 OPERATING INCOME (LOSS)
Energy Services Group $ 638 $ 1,036 $ 589 $ 241 $ 934 Engineering and Construction Group (685) 111 (54) 184 274Special charges and credits(1) — — — 47 (959)General corporate (65) (63) (73) (71) (79)
Total operating income(1) (112) 1,084 462 401 170 Nonoperating income (expense), net(2) (116) (130) (127) (94) (115) INCOME/(LOSS) FROM CONTINUING OPERATIONS
BEFORE INCOME TAXES AND MINORITY INTEREST (228) 954 335 307 55 Provision for income taxes(3) (80) (384) (129) (116) (155)Minority interest in net income of consolidated
subsidiaries (38) (19) (18) (17) (20)Income (loss) from continuing operations $ (346) $ 551 $ 188 $ 174 $ (120) Income (loss) from discontinued operations $ (652) $ 257 $ 313 $ 283 $ 105 Net income (loss) $ (998) $ 809 $ 501 $ 438 $ (15) BASIC INCOME (LOSS) PER COMMON SHARE
Continuing operations $ (0.80) $ 1.29 $ 0.42 $ 0.40 $ (0.27) Net income (loss) (2.31) 1.89 1.13 1.00 (0.03)
DILUTED INCOME (LOSS) PER COMMON SHARE
Continuing operations (0.80) 1.28 0.42 0.39 (0.27) Net income (loss) (2.31) 1.88 1.12 0.99 (0.03)
Cash dividends per share 0.50 0.50 0.50 0.50 0.50 Return on average shareholders’ equity (24.02)% 18.64% 12.20% 10.49% (0.35)%FINANCIAL POSITION
Net working capital $ 2,288 $ 2,665 $ 1,742 $ 2,329 $ 2,129 Total assets 12,844 10,966 10,192 9,639 10,072 Property, plant and equipment, net 2,629 2,669 2,410 2,390 2,442 Long-term debt (including current maturities) 1,476 1,484 1,057 1,364 1,426Shareholders’ equity 3,588 4,752 3,928 4,287 4,061 Total capitalization 5,083 6,280 6,555 6,590 5,990 Shareholders’ equity per share 8.16 10.95 9.20 9.69 9.23 Average common shares outstanding (basic) 432 428 442 440 439 Average common shares outstanding (diluted) 432 430 446 443 439 OTHER FINANCIAL DATA
Capital expenditures $ (764) $ (797) $ (578) $ (520) $ (841) Long-term borrowings (repayments), net (15) 412 (308) (59) 122 Depreciation, depletion and amortization expense 505 531 503 511 500 Goodwill amortization included in depreciation,
depletion and amortization expense:Energy Services Group — 24 19 12 22 Engineering and Construction Group — 18 25 21 14
Payroll and employee benefits(4) (4,875) (4,818) (5,260) (5,647) (5,880) Number of employees(4) (5) 83,000 85,000 93,000 103,000 107,800 (continued on next page)

S E L E C T E D F I N A N C I A L D A T A ( U N A U D I T E D ) ( c o n t i n u e d )
Years ended December 31 Millions of dollars and shares except per share and employee data 1997 1996 1995 1994 1993OPERATING RESULTS
Net revenuesEnergy Services Group $ 7,152 $ 5,696 $ 4,838 $ 4,548 $ 5,065Engineering and Construction Group 6,346 5,540 4,207 3,992 4,080
Total revenues $ 13,498 $11,236 $ 9,045 $ 8,540 $ 9,145 OPERATING INCOME
Energy Services Group $ 959 $ 644 $ 552 $ 411 $ 395 Engineering and Construction Group 279 188 89 66 95Special charges and credits (1) 11 (86) (8) (19) (419) General corporate (71) (72) (71) (56) (63)
Total operating income (1) 1,178 674 562 402 8 Nonoperating income (expense), net (2) (82) (70) (34) 333 (61)INCOME FROM CONTINUING OPERATIONS BEFORE
INCOME TAXES AND MINORITY INTEREST 1,096 604 528 735 (53)Provision for income taxes (3) (406) (158) (167) (275) (18)Minority interest in net income of consolidated
subsidiaries (30) — (1) (14) (24)Income (loss) from continuing operations $ 660 $ 446 $ 360 $ 446 $ (95)Income from discontinued operations $ 112 $ 112 $ 36 $ 97 $ 81 Net income (loss) $ 772 $ 558 $ 381 $ 543 $ (14)BASIC INCOME (LOSS) PER COMMON SHARE
Continuing operations $ 1.53 $ 1.04 $ 0.83 $ 1.04 $ (0.23) Net income (loss) 1.79 1.30 0.88 1.26 (0.04)
DILUTED INCOME (LOSS) PER COMMON SHARE
Continuing operations 1.51 1.03 0.83 1.03 (0.23) Net income (loss) 1.77 1.29 0.88 1.26 (0.04)
Cash dividends per share 0.50 0.50 0.50 0.50 0.50 Return on average shareholders’ equity 19.16% 15.25% 10.44% 15.47% (0.43)%FINANCIAL POSITION
Net working capital $ 1,985 $ 1,501 $ 1,477 $ 2,197 $ 1,563 Total assets 9,657 8,689 7,723 7,774 8,087 Property, plant and equipment, net 2,282 2,047 1,865 1,631 1,747 Long-term debt (including current maturities) 1,303 957 667 1,119 1,129 Shareholders’ equity 4,317 3,741 3,577 3,723 3,296 Total capitalization 5,647 4,828 4,378 4,905 4,746 Shareholders’ equity per share 9.86 8.78 8.29 8.63 7.70 Average common shares outstanding (basic) 431 429 431 431 422 Average common shares outstanding (diluted) 436 432 432 432 422 OTHER FINANCIAL DATA
Capital expenditures $ (804) $ (612) $ (474) $ (358) $ (373)Long-term borrowings (repayments), net 285 286 (481) (120) 192 Depreciation, depletion and amortization expense 465 405 380 387 574 Goodwill amortization included in depreciation,
depletion and amortization expense:Energy Services Group 20 19 17 14 11 Engineering and Construction Group 12 7 7 7 7
Payroll and employee benefits (4) (5,479) (4,674) (4,188) (4,222) (4,429)Number of employees (4), (5) 102,000 93,000 89,800 86,500 90,500 (continued on next page)
2 0 0 2 H A L L I B U R T O N A N N U A L R E P O R T 116
S E L E C T E D F I N A N C I A L D A T A ( U N A U D I T E D ) ( c o n t i n u e d )
1172 0 0 2 H A L L I B U R T O N A N N U A L R E P O R T
(1) Operating income includes the following special charges and credits:
1999 – $47 million: reversal of a portion of the 1998 special charges.
1998 – $959 million: asset related charges ($491 million), personnel reductions ($234 million), facility consolidations ($124 million), merger transaction costs ($64 million), and other related costs ($46 million).
1997 – $11 million: merger costs ($9 million), write-downs on impaired assets and early retirement incentives ($10 million), losses from the sale of assets ($12 million), and gain on extension of joint venture ($42 million).
1996 – $86 million: merger costs ($13 million), restructuring, merger and severance costs ($62 million), and write-off of acquired in-process research and development costs ($11 million).
1995 – $8 million: restructuring costs ($5 million) and write-off of acquired in-process research and development costs ($3 million).
1994 – $19 million: merger costs ($27 million), litigation ($10 million), and litigation and insurance recoveries ($18 million).
1993 – $419 million: loss on sale of business ($322 million), merger costs ($31 million), restructuring ($5 million), litigation ($65 million), and gain on curtailment of medical plan ($4 million).
(2) Nonoperating income in 1994 includes a gain of $276 million from the sale of an interest in Western Atlas International, Inc. and a gain of $102 million from the saleof our natural gas compression business.
(3) Provision for income taxes in 1996 includes tax benefits of $44 million due to the recognition of net operating loss carryforwards and the settlement of various issueswith the Internal Revenue Service.
(4) Includes employees of Dresser Equipment Group which is accounted for as discontinued operations for the years 1993 through 2000.
(5) Does not include employees of less than 50%-owned affiliated companies.
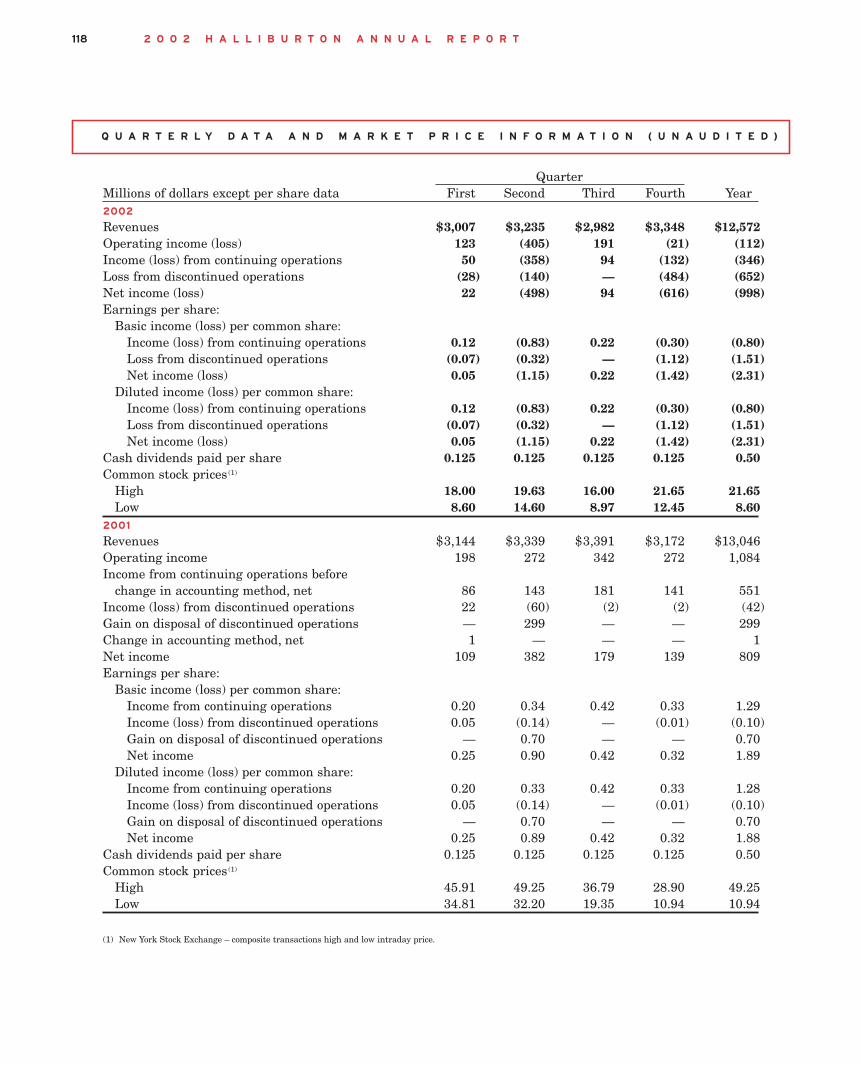
2 0 0 2 H A L L I B U R T O N A N N U A L R E P O R T 118
Q U A R T E R L Y D A T A A N D M A R K E T P R I C E I N F O R M A T I O N ( U N A U D I T E D )
Quarter Millions of dollars except per share data First Second Third Fourth Year 2002
Revenues $3,007 $3,235 $2,982 $3,348 $12,572Operating income (loss) 123 (405) 191 (21) (112) Income (loss) from continuing operations 50 (358) 94 (132) (346)Loss from discontinued operations (28) (140) — (484) (652)Net income (loss) 22 (498) 94 (616) (998)Earnings per share:
Basic income (loss) per common share:Income (loss) from continuing operations 0.12 (0.83) 0.22 (0.30) (0.80)Loss from discontinued operations (0.07) (0.32) — (1.12) (1.51)Net income (loss) 0.05 (1.15) 0.22 (1.42) (2.31)
Diluted income (loss) per common share:Income (loss) from continuing operations 0.12 (0.83) 0.22 (0.30) (0.80)Loss from discontinued operations (0.07) (0.32) — (1.12) (1.51)Net income (loss) 0.05 (1.15) 0.22 (1.42) (2.31)
Cash dividends paid per share 0.125 0.125 0.125 0.125 0.50Common stock prices(1)
High 18.00 19.63 16.00 21.65 21.65Low 8.60 14.60 8.97 12.45 8.60
2001
Revenues $3,144 $3,339 $3,391 $3,172 $13,046 Operating income 198 272 342 272 1,084 Income from continuing operations before
change in accounting method, net 86 143 181 141 551Income (loss) from discontinued operations 22 (60) (2) (2) (42)Gain on disposal of discontinued operations — 299 — — 299Change in accounting method, net 1 — — — 1 Net income 109 382 179 139 809 Earnings per share:
Basic income (loss) per common share:Income from continuing operations 0.20 0.34 0.42 0.33 1.29Income (loss) from discontinued operations 0.05 (0.14) — (0.01) (0.10)Gain on disposal of discontinued operations — 0.70 — — 0.70Net income 0.25 0.90 0.42 0.32 1.89
Diluted income (loss) per common share:Income from continuing operations 0.20 0.33 0.42 0.33 1.28Income (loss) from discontinued operations 0.05 (0.14) — (0.01) (0.10)Gain on disposal of discontinued operations — 0.70 — — 0.70Net income 0.25 0.89 0.42 0.32 1.88
Cash dividends paid per share 0.125 0.125 0.125 0.125 0.50Common stock prices(1)
High 45.91 49.25 36.79 28.90 49.25Low 34.81 32.20 19.35 10.94 10.94
(1) New York Stock Exchange – composite transactions high and low intraday price.

PRODUCTION
Halliburton Communications

C O R P O R A T E O F F I C E :5 H O U S T O N C E N T E R1 4 0 1 M c K I N N E Y , S U I T E 2 4 0 0H O U S T O N , T E X A S 7 7 0 1 0 U S AW W W . H A L L I B U R T O N . C O M
H 0 3 4 1 8