Halifax Air Cargo Market Study and Business Case Air Cargo Market Study and Business Case Prepared...
104
Halifax Air Cargo Market Study and Business Case Prepared for: Halifax Gateway Council Prepared by: Jacobs Consultancy Canada Inc. May 1 st , 2007
Transcript of Halifax Air Cargo Market Study and Business Case Air Cargo Market Study and Business Case Prepared...

Halifax Air Cargo Market Study and Business Case
Prepared for: Halifax Gateway Council
Prepared by: Jacobs Consultancy Canada Inc.
May 1st, 2007

Table of Contents - UpdateSection Page
1 Global Trends in Air Cargo
2 US Trends
3 Cargo Challenges
4 Canadian Regulatory Challenges
5 Current Competition
6 Case Studies
7 YHZ – Current Cargo Services
8 Air Cargo Demand
9 Air Cargo Infrastructure
10 Business Case
11 Next Steps

1. Global Trends in Air Cargo

Global Air Cargo Trends
‘Aircraft carry around two per cent of international trade by volume, but around 40 per cent by value’
– FedEx Chief Operating Officer, Michael Ducker
• Increasing number of companies are out-sourcing to remote locations
• Decreasing product cycles for high value, high tech goods have made fast delivery to market essential
• Air cargo operations are allowing fast, frequent and predictable transit between more and more parts of the world
• The air cargo sector has played an essential, although understated, role in the development of the global economy:– Local industries have become global traders– Consumers enjoy goods from any part of the world within a
relatively short time-frame• Air Cargo’s continued development is key to the on-going success of
international trade

Global Cargo – State of the Industry
• Global air cargo sector experienced higher growth in 2006 compared to 2005– IATA reported overall 4.6% air cargo growth in 2006:
• From regional perspective, air cargo industry had a mixed year• North American and Middle Eastern markets increased at highest rates
– 3.2% growth rate in 2005
• IATA currently has more cautious outlook for 2007– Expects slower growth to affect the sector– Early traffic results indicate annualized growth of between 2.5%
and 3.0%– Predicts improvements in cost management will not continue,
depressing margins

Global IATA Air Cargo Summary
• 2006 cargo tonnage growth by region:– Europe +1.7%– Asia-Pacific +4.7%– North America +6.0%…but only grew by 0.4% in 2005– Middle East +16.1% … the fastest growth region worldwide
• Passenger traffic is currently growing at historically high rates and load factors are increasing – Putting pressure on belly cargo capacity available for air cargo
• European and Asian air cargo growth rates lower than the global average due to:– Higher fuel costs; and– Competition from other (subsidized) transportation modes
• In contrast, US carriers report increased freight volumes– Indication of strength of the US integrated carriers such as FedEx

Evolution of the Air Cargo Industry
The integrated carrierscontinue their growth into international, supply chain services, and surface transportation
A smaller number of freight forwarders are responsible for a greater amount of freight activity due to consolidation
The “integrated forwarder” will become increasingly important to international freight movement

Key Cargo Operators/Role Within Cargo Industry
The combination of these key service providers defines the entire industry
– The integrated carriers have grown to dominate the domestic US market over the past 20 years
– Freight forwarders control approximately 75% of the world’s international freight activity
– The combination of the integrated carriers and freight forwarding community will dictate the industry’s future route (and airport) development
North American Market Only

Airlines and Cargo Activity
• Airlines that transport air cargo have significantly different characteristics – and ability to use different types of airports
– Belly and Mixed cargo carriers must operate from passenger gateways
– Integrated carriers would prefer to operate at an uncongested facility
– All-cargo carriers can effectively conduct business at a remote facility
• Freight forwarders are the key to all-cargo activity
AIR CARGO CARRIER TYPES AND THEIR BUSINESS CHARACTERISTICS
Air cargoCarriertypes Characteristics
Illustrative carriers Customers
Desired airportcharacteristics
Belly Baggage holds of passenger aircraft
Delta, Continental,US Airways
Wholesale,mail, retail
Passenger airport
Mixed Baggage holds of passenger aircraft and main decks of all- cargo aircraft
Air Canada, Northwest, Lufthansa,
EVA
Passenger airport
Integrated FedEx, UPS, DHL, Purolator
Retail Airport near population
All-cargo Main decks of all-cargo aircraft
Atlas Air, Polar, Cargolux, Arrow Air
Wholesale Remote Airport
Main decks of all-cargo aircraft
Wholesale,mail, retail

With control over 75% of the world’s international freight movement, freight forwarders are seeking operationally efficient, cost effective airports to increase shipper consolidations
As these forwarders rely on additional freighter capacity, alternative gateways (consolidation points) becoming increasingly attractive, in order to decrease costs
Those airports that offer superior market reach, efficient operations, and costs savings will benefit from this trend
Importance of the Freight Forwarders

2. Global Air Cargo Challenges

Air Cargo’s Top Five Challenges
1. Increasing Fuel PricesAverage cost of jet fuel has more than doubled since 2001Fuel costs represent approximately a third of operating costs of all-cargo carriersCargo carriers instituting surcharges to cover fuel cost increases (surcharge can be up to 30% of the total airfreight rate)
2. Security ThreatsExpect tighter air cargo security to affect operations and increase costs
3. Changing Inventory Strategies4. Modal Shifting5. Provider Consolidations
Source: Air Cargo’s High 5 Top Challenges, by Lisa Harrington (October 2006), Inboundlogistics.com
www.inboundlogistics.com/articles/features/1006_feature01.shtml

$0.00
$0.25
$0.50
$0.75
$1.00
$1.25
$1.50
$1.75
$2.00
$2.25
$2.50
Jan Feb Mar Apr May Jun Jul Aug Sep Oct Nov Dec
2001 2002 2003 2004 2005 2006
Escalating Jet Fuel Costs
• Fuel price escalation is an increasing burden on the industry driven by increasing demand, global supply concerns and refining capacity issues
Cost per Imperial Gallon –U.S. Airline Industry Average in USD

Security Regulations and Issues
• Increased security equates to additional time
– Air cargo driven by time-sensitivity – Many companies built around air transportation– Growing competition by other modes of
transportation– Increased processing time at US air cargo hubs
could enhance Halifax opportunity
• Security enhancements– Technology continues to evolve– Increased costs could make business difficult for
small and regional niche cargo carriers– Automated Gate Systems (AGS), Vehicle and
Cargo Inspection will likely be required in US– System (VAICS) II, and Pallet VAICS are possible
systems– Transport Canada is actively reviewing air cargo
security regulations for Canada
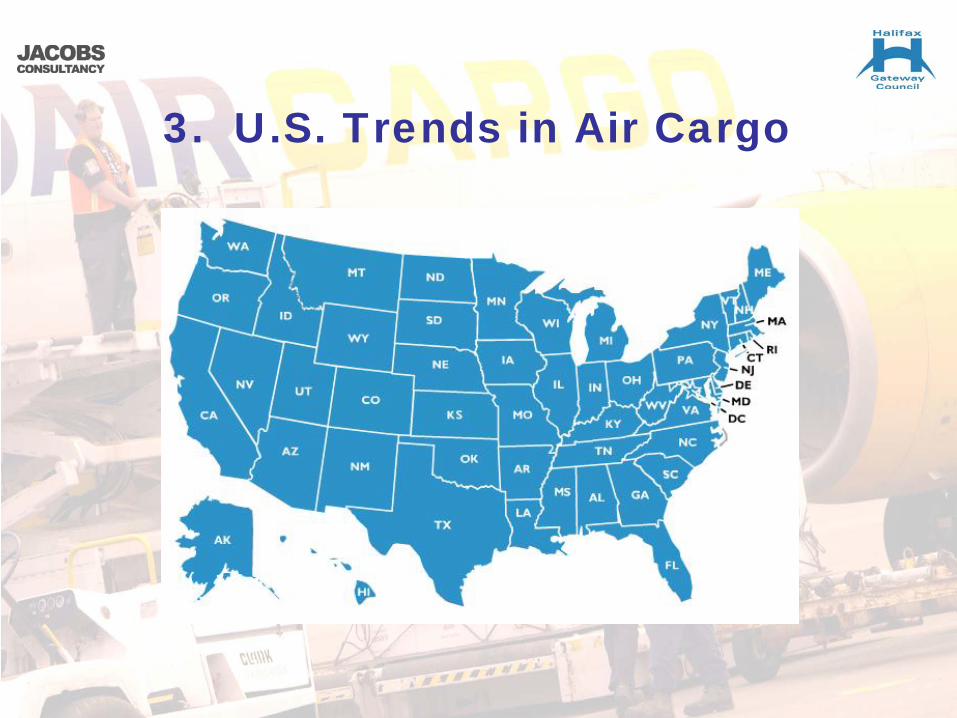
3. U.S. Trends in Air Cargo

Historical Perspective – US Air Cargo Growth
• The air cargo industry has posted 20 years of steady growth
• Periods of temporary decline coincide with external shocks:– Economic recession – Wars in Afghanistan &
Iraq– SARS outbreak– Security related issues
• Long-term growth will continue– Airports should
proactively plan to increase cargo infrastructure to accommodate growth and better serve market
HISTORICAL FREIGHT TRAFFICFreight Ton miles

Air Cargo and All-Cargo Aircraft Forecast
• The passenger/cargo “growth gap” indicates continuing use (and growth) of all-cargo aircraft
– Air cargo growth rates have exceeded those of passenger growth over the past decade – Passenger airlines will not add additional capacity to accommodate cargo – the “gap” can
only be made up with pure freighter aircraft activity– Recent growth in low-cost airlines and regional jet activity (neither focus on cargo
capacity) will increase the need for freighter capacity

Integration of multiple modes of transportation in one location is a key growth strategy of major cargo companies (as evidenced by the industry’s increasing consolidation and reorganization)Generally, commodities transported by sea are less time sensitive and lower yielding products and do not lend themselves to air transport
There are some markets, such as Hong Kong, where air-sea may work. Difficult market and limited opportunity for Halifax
Intermodal facilities and transshipment infrastructure are important for the futureCargo pre-clearance is still someway off in current secure border climate
Transborder Activity

Trends at New York’s JFK
• 51% of JFK’s international air cargo came from Asia in the first half of 2006– Last year 20% of all air cargo imports into New York
came from China and 33% from Asia• Domestic cargo forecast to grow 0.6% annually to 2016• International cargo forecast to grow 3% annually to 2016• Korean Air and Cathay Pacific, Japan Air Lines, China
Airlines, Air China and Singapore Airlines are among the leading Asian cargo carriers at JFK
"The domestic is where we've really seen the decline," said Michael Bednarz, manager of air cargo development at Kennedy Airport. “Air freight, excluding mail, was down 2 percent at JFK in the first nine months of 2006, pushed down by a 13.3 percent drop in domestic business.”

Trends at Miami International Airport
• 80% of cargo traffic at Miami (MIA) is international• August 2006: Korean added twice-weekly freighter
service to Seoul– Airport is hoping to double this to 4x weekly in 2007
• MIA’s cargo first 10 months of 2006:– Domestic cargo: -3.6%– International cargo: +5.6%
• Trucking is seen in Miami more as a complement to international air cargo than a competitive force taking domestic shipments away from airlines– In part this is due to the fact domestic volume accounts for just a
fifth of Miami's total air cargo

Wider U.S. Trends
• Delta Air Lines’ Atlanta hub:– Domestic belly capacity squeezed – Back filling narrowbody aircraft on domestic flights for
widebody aircraft redeployed onto international flights
“From Miami up to Atlanta, through Washington, New York and even Boston, Asia trade is the path to the future for airports once pointed directly at trans- Atlantic markets for their cargo expansion”
• Impact of trucking has smaller airports looking more at the international air cargo arena

4. North America Case Studies
Benchmark Airports:
Columbus Rickenbacker
Edmonton International Airport
Huntsville International Airport

Columbus Rickenbacker—Market Conditions • The area encompasses numerous
industrial parks, more than 100 companies and over 30 million square feet of development
• Types of businesses at Rickenbacker (LCK) include cargo airlines, freight forwarders, logistics companies, e- tailers, corporate aviation businesses, manufacturers and distributors
• Since the Port Authority took over as operator of FTZ No. 138 in 1998, activity within the General Purpose Zone has increased by 190%
• LCK attracted direct freighter service from Japan in 2006 (Evergreen Airlines)

LCK — Key Challenges
• The Columbus Regional Airports Authority (CRAA) realizes that much of the region’s air cargo activity is accommodated by Chicago O’Hare
• However, ORD is burdened by congestion, both airspace, airside and groundside activities, and increasing costs
• CRAA increased its focus on the international segment of the cargo market and began intense discussions with the freight forwarding community, rather than the traditional approach of primarily airline attention, to gain support for LCK and its operational and cost efficiencies
• The Authority developed several facilities designed specifically for the freight forwarder and consolidator companies and attracted several regional hubs to Rickenbacker
• This approach has led to EGL, FedEx (ground) and other companies to have sizeable operations at LCK
• In 2006, Evergreen airlines began direct service (3x per week) from Japan which is recapturing activity from ORD

Edmonton International Airport—Market Conditions
Natural Resources in AlbertaNatural Resources in Alberta
ForestryForestryOilsandsOilsandsHeavy OilHeavy OilNatural Gas & Crude OilNatural Gas & Crude Oil
• These industries require the movement of equipment and materials into and out of the area
• Edmonton is an important transportation hub for Northern Alberta and Canada including:
– Air cargo– Trucking– Rail
• The Nisku Industrial Business Park comprises:
– 500 diverse businesses– 65% of the companies
export products– Employment of 14,000
highly skilled workers and professionals
– 6,000 hectares of land
• Much of Alberta’s resource industries are located close to or north of Edmonton

YEG - Strategic Air Cargo Development Plan
Due to the greater supply of air cargo capacity out of YYC, Edmonton region cargo flows as follows:
– 20% or less actually utilizes YEG
– 40% is trucked to/from YYC for airlift
– 40% is trucked to/from YVR, YYZ and U.S. airports for airlift
In market research, regional cargo operators indicated a strong desire for support facilities at YEG
– The composition of the Edmonton cargo market includes a great deal of cargo consolidated off-airport
– Cross-dock facilities will provide the airport with necessary (non-ramp accessible) facility expansion while providing the industry a competitively priced alternative to current or redeveloped warehouse space
– The AirLINKS Business Park, closest to the terminal area, provides prime space for developing a “Cargo Center” at YEG
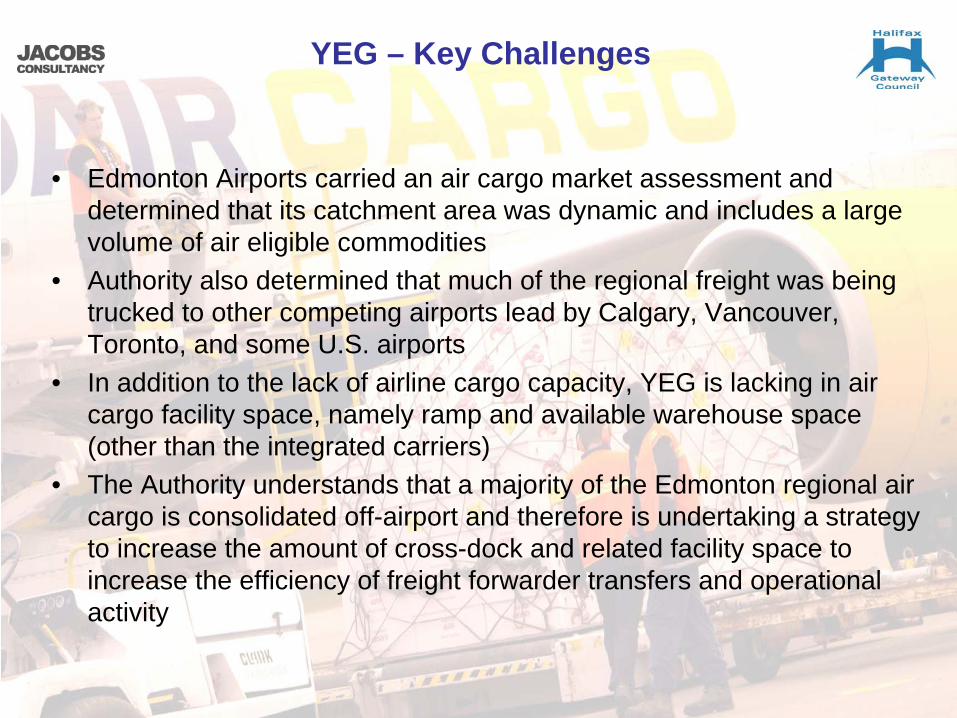
YEG – Key Challenges
• Edmonton Airports carried an air cargo market assessment and determined that its catchment area was dynamic and includes a large volume of air eligible commodities
• Authority also determined that much of the regional freight was being trucked to other competing airports lead by Calgary, Vancouver, Toronto, and some U.S. airports
• In addition to the lack of airline cargo capacity, YEG is lacking in air cargo facility space, namely ramp and available warehouse space (other than the integrated carriers)
• The Authority understands that a majority of the Edmonton regional air cargo is consolidated off-airport and therefore is undertaking a strategy to increase the amount of cross-dock and related facility space to increase the efficiency of freight forwarder transfers and operational activity

Huntsville International Airport—Market Conditions
• The historical cargo market development in Huntsville (HSV) is quite unique
• In the mid-to-late 1990’s, Panalpina undertook a market analysis to redesign their European gateway(s)
• Panalpina had three major areas of focus: • Key shipper analysis (location and transportation
requirements)• Identifying an airport with supreme facility growth
potential, optimal access to highways and other modes (i.e. rail), and cost effectiveness and operational efficiency
Ultimately, HSV was identified as leading candidate
• Finding an all-cargo airline partner that could replace capacity found at JFK and ORD
Cargolux provided the 747-200F (since changed to 400) capacity, and required mid-European destination
The Huntsville-Madison County Airport Authority was contacted by the Panalpina-Cargolux partnership and quickly created the FTZ #83 to accommodate international shipping and logistics

HSV - Development Plan
• Initially, HSV was not ready for the massive increase in cargo activity
– The airport was already blessed with long- runways (>10,000ft.)
– Cargo facilities were old and not sufficient for the Panalpina operations
– HMCAA worked with a third party to provide Panalpina with its independent facility(ies) and have gone through three expansions that total >200,000 sq ft.
• The Authority also leveraged the relocation of Panalpina into other growth opportunities
– The HMCAA immediately planned to develop the JetPlex Industrial Park…to complement the existing Intermodal Center and growing air cargo hub
– The combination of facilities and capacity attracted additional manufacturers and cargo volumes

HSV - Key Challenges
• The Huntsville-Madison County Airport Authority understands that all- cargo market development is driven by the freight forwarding community
• HMCAA aggressively reacted to market opportunity with administrative, legislative, construction, and marketing efforts
• The Authority set-up direct lines of communication with Panalpina, and its largest shippers, which paid large dividends in getting the forwarder to use not only the “airport” but also consolidate other surface (and sea container traffic) at their facilities
• The increased capacity provided by Cargolux initially linked HSV with Luxembourg, and Europe as a whole, but the operations quickly grew into Mexico and further increased the international “reach” of HSV
• The Authority continues to leverage the Panalpina - Cargolux operation and is actively being considered as a new gateway to several Asian freighter airlines to seek trans-shipment opportunities

5. Canadian Air Cargo Environment

International Air Policy Initiatives
• Historically, Canada’s approach to international air transportation has been the gradual and incremental expansion of bilateral agreements to increase the number of cities in both countries that can be served by airlines and the frequency of these services
• Often changes have been viewed through the prism of passenger carriers, rather than the wider aviation industry and the communities they serve
• Canada currently has air transport agreements or arrangements with over 70 bilateral partners, which specify the number of airlines of each side that may operate the possible routings, and the frequency of services
• Canada currently has only three open skies agreements in place (US, UK and now Ireland), while the U.S. has 77

1994 Foreign Carrier Access Provisions
• Under the 1994 Foreign Carrier Access (FCA) provisions, if a country has no air transport agreement with Canada, and if no Canadian carrier is interested in the foreign market in question, the other state may apply for one of its carriers to operate a total of two weekly scheduled services from the foreign country to one or more points in Canada of its choice, other than Toronto
• FCA provisions intended to facilitate foreign carrier access to Canada where no air transport agreement was in place and to provide Canadian communities more direct and convenient routings by foreign carriers willing to offer such service
• Only two carriers have availed themselves of the FCA provisions: Icelandair into Halifax and Cargolux which has a scheduled all-cargo service into Calgary
• Both carriers have started cargo operations based on niche perishable markets: horsemeat from Alberta transported on Cargolux; and seafood from the Maritimes transported on Icelandair

2006 Blue Skies Initiative
• Objectives include securing as much flexibility for all-cargo services as possible
• Significantly elevates importance of serving the wider - non-airline - community
• Transport Canada’s stated aims include:– Encourage competition and the development of new and expanded international air
services to benefit travellers, shippers and the tourism and business sectors– Provide opportunities for Canadian airlines to grow & compete successfully– Enable airports to market themselves in a manner that is unhindered by bilateral
constraints to the greatest extent possible– Support and facilitate Canada’s international trade objectives– Recognize that air transportation is a direct contributor to a dynamic economy and is a
leading trade facilitator– Market forces should determine price, quality, frequency & range of air services
options• Pursuing new agreements with specific areas such as Europe and Asia• Most current agreements are traditional restrictive bilateral agreements

Canadian Regulatory Environment
• US Air Service Agreement amended in November 2005• Air carriers of the US and Canada are now able to:
– Pick up all-cargo traffic in the other partner’s territory and carry it to a third country as part of a service to or from their home territory
• A US carrier can now operate a Columbus – Halifax – Frankfurt service and load/unload cargo travelling between Columbus and Halifax, Columbus and Europe, and Halifax and Europe
– Operate stand-alone all-cargo services between the other partner’s territory and third countries
• A US carrier can operate a Halifax - Europe service– Offer the lowest prices for services between the other partner’s territory
and a third country
• Came into force: March 12, 2007

Emerging Markets Air Access Policy
• Canada-India bilateral does not yet permit Halifax to be served, not even for cargo
• Canada-China bilateral does permit Halifax to be served, including for cargo. 2 Intermediate points (ex: Europe) are permitted and 2 beyond points (ex: the US) are also allowed

International Air Cargo Transshipment Program
• Allows Canadian and foreign carriers to carry international cargo transshipments coming from, and destined to, points outside Canada via approved Canadian airports even if the rights are not provided in Canada's bilateral air transport agreements
• In-transit cargo may also be stored in bond until it is transported to its final destination by air or another mode
• Initially intended to promote the use of small & under-utilized airports• Transshipment programs have now been introduced at six Canadian
airports (Mirabel, Hamilton, Windsor, Gander, Winnipeg and Edmonton)• Canada’s transshipment program has led to a marginal increase in
cargo activity at several of the designated airports• Program not achieved critical mass at most of these airports as they
don’t have international, scheduled, all-cargo services– Program has potential to enhance YHZ’s existing and expanded all-
cargo services envisaged in this business plan

Value Added for Target Client - Transshipment Program
Vendor
ElectronicParts
Manufacturer
Value Added Services Consumers
Parts MarshallingAssembly
Value Added Logistics
DeliveryNAFTA Location
Inbound:Air or Sea
OutboundAir, Truck or Rail

Cargo Co-terminalization
• Would allow a carrier to transport cargo from another country to/from a third country, even if the flight does not touch down in its home country
• Would allow US or Canadian carriers to deliver US or Canadian cargo to the other country using routes having more than one destination in the country of destination
• For example, FedEx could operate a service to YHZ and YYT, and deliver or pickup US cargo at both YHZ and YYT
• Could provide significant benefits to Canadian businesses and consumers in terms of both costs and time (due to more efficient routing and reduced ground handling)
• Co-terminalization is still not permitted by Open Skies with US

Canadian Export Distribution Centre (EDC) Legislation (2001)
• Eliminates key limitations of past regulatory provisions
• Provides a flexible tax and duty free environment for serving as a distribution centre to the US and world markets
• Cost savings for producers by transporting unfinished products close to the market and postponing customization of final product until the point of sale
• Program is open to Canadians AND to foreign operators
Canadian EDCs compared to US Foreign Trade Zones (FTZs)
• Same duty/tax advantages• EDCs allow exporters to US to
minimize US duties on goods subjected to US inverted tariff
• EDCs do not require operators to incur high US costs of providing secure areas
• EDCs not confined to specific areas that are difficult to expand or move
• Goods in EDCs may be moved to other locations
Source:• “Export Distribution Centre Program” B-088
(October 2001), CCRA• www.yvr.ca/busienss/free_trade.asp

Cargo Pre-Clearance
• Cargo pre-clearance still many years into the future• Important element to make seamless connections between Canada
and US, including international cargo arriving in North America• TSA in US believes it has a good grasp of many of the cargo
security issues but needs to move forward on solutions• YHZ could provide a test bed for Cargo Gateway Concept which will
put HIAA in a leveraged position:– Raises profile of YHZ and Halifax cargo community– Work on solutions with TC, US DHS, TSA & CATSA from Halifax
Gateway perspective– Co-opt Integrated Carriers and Freight Forwarders to help make it a
reality• Long-term commitment required (5-years)

Note: All cargo tonnages include mail, unless otherwise stated
6. Halifax Competitive Analysis

Cargo Activity: Atlantic Canada & Northeast US
• Boston Logan is the only airport (in comparison) that recorded a decline in cargo in 2006: deliberate move which could present an opportunity for YHZ
• Providence and Manchester recorded double digit increases• Halifax represents 3.8% of total cargo activity among these airports; Boston
43.9%; Montreal (combined YUL and YMX) 37.3%– Remove Boston from comparison and Halifax share increases to 6.2% and
Montreal (YMX and YUL combined) represents 61.8%
Historical Cargo Activity
0
50,000
100,000
150,000
200,000
250,000
300,000
350,000
2001 2002 2003 2004 2005 2006
Met
ric T
ons
YHZYQMYYTYULYMXBOSPWMPVDMHT
Source: individual airports
No data avail. for Bangor

Competing Airport Cargo Facilities
YHZ Halifax YQM Moncton YUL Trudeau YMX Mirabel BOS Logan BRG Bangor MHT Manchester
4 3 4 4 2 sites 1 3
Size 11,051 m2 N/K 43,664 m2 64,000 m2 51,092 m2 16,400 m2 13,526 m2Bonded N/KHeated N/K N/K x - 3 miles offsite N/KAir-Conditioned N/K N/K x - 3 miles offsite N/KRefrigerated N/K x - 3 miles offsite N/KDeep Freeze N/K N/K x - 3 miles offsite N/KAnimal Quar. N/K N/KFresh Meat Insp. N/K N/K N/KHealth OfficialsX-Ray Equip N/K N/K N/K N/KDangerous Goods N/K N/K N/KRadioactive Goods N/K N/K N/A N/KLivestock Handling N/A N/K N/K N/A N/KMortuary N/A N/K N/K N/K N/AHours 24 hrs 08:30 - 17:00 24 hrs 24 hrs 08:00 - 20:00 24 hrs (M-Sa) 10:00 - 18:00 (M-F)FTZ N/A N/A N/ATransit Zone N/A N/A N/K N/AUpper-deck Loader N/K N/A N/AMain-deck LoaderFork LiftsTransporters for PalletsExpress/Courier CentreSecurity for Valuables N/K N/K N/A x N/KDecompression Chamber N/K N/K N/K N/A N/A N/KFreighter Docks N/A N/A 4 x 747 4 x 747 N/A N/A N/AFreighter Bridges N/A N/A N/A x2 4 x 747 N/A N/A
A-Z World Airports Online; airport websites; airport personnel
Note: N/A = Not Applicable / Item Not Available at this Location N/K = Not Known / Data Not Available
Specialized Handling Equip.
Other
Data Sources
# Cargo Terminals
Warehouse
Storage
Customs
Quarantine & Inspection

Competing Airport Facilities and Operations
YHZ Halifax YQM Moncton YUL Trudeau YMX Mirabel BOS Logan BRG Bangor MHT Manchester
24 hrs 24 hrs 24 hrs 24 hrs 24 hrs 24 hrs 24 hrs
none nonetraining flights
prohibited 20:00 - 08:00
none none none none
none none some restrictions 23:59 - 07:00 none some restrictions
23:00 - 07:00 none none
# 2 2 3 2 5 1 2Length of Longest
2,632 m 2,438 m 3,609 m 3,657 m 3,073 m 3,486 m 2,168 m
N/K commercial N/K commercial commercial industrial N/K
Int'l Landing $6.55 / 1000 kg $8.68 / 1000 kg $6.07 / 1000 kg $5.66 / 1000 kg $8.06 / 1000 kg $2.74 / 1000 kg $5.20 / 1000 kgA/C Parking first 6 hrs free first 6 hrs free first 6 hrs free first 6 hrs free $201 (0-4 hrs) yes, varies private apronsFuel Surcharge $0.0501 / L none N/K N/K N/K yes, varies noneLand Lease N/K N/K N/K N/K N/K none confidential
plans for new cargo commercial area at SW end of Taxiway A (per 2003 MP)
Recent master plan identifies south field for future cargo facility development
A-Z World Airports Online; airport websites; airport personnelLanding Fees based on B747 (400F) aircraft weighing 369,900 kg and having a wingspan of 64.4 m. Represented in $Cdn
Airport Hours of Operations
Data Sources
Other
Zoning of Cargo Area
Airfield Restrictions
Airport Noise Restrictions
Fees
Runways
Note: N/A = Not Applicable / Item Not Available at this LocationN/K = Not Known / Data Not Available

Cargo Service Providers
Note: N/A = Not Applicable / Item Not Available at this LocationN/K = Not Known / Data Not Available
YHZ Halifax YQM Moncton YUL Trudeau YMX Mirabel BOS Logan BRG Bangor MHT Manchester# Cargo Carriers 11 6 > 30 8 60 5 17
# All Cargo Carriers 5 2 2 8 9 3 3Freight Forwarders 10 0 Yes - # N/A Yes - # N/A 1 + 1 in town 0Customs Brokers 4 0 Yes - # N/A Yes - # N/A 1 + 1 in town 0Integrated Couriers 3 3 0 4 N/K 2 3Other 5 cargo handlers 1 cargo handler
Data Sources A-Z World Airports Online; airport websites; airport personnel
150+ FF & Brokers

Other Air Cargo Support Facilities/Services /Special Features at Competing Airports
YHZ Halifax YQM Moncton YUL Trudeau YMX Mirabel BOS Logan BGR Bangor MHT Manchester
• Closest major continental NA link to Europe
• Port of Halifax with 20 direct liner services and Inter- modal connections
• On-dock rail service with daily departures to/from Montreal, Toronto and US Midwest
• Excellent highway connections to all inland points in Canada and US
• Excellent weather record
• No congestion• “Home to
largest warehousing and distribution centre in Atlantic Canada”
• Future development includes a planned cargo facility
• TransCanada Highway access
• On “Great Circle” route from Europe to North America
• Incentives
•A significant number of international passenger services with belly cargo capacity to Europe
• Located near a rapidly expanding industrial park
• Home of Bombardier facilities and Air Transat head office and maintenance depot
• Close to Bell Helicopter & Messier-Dowty facilities
• Near a main highway within 12 hrs drive of major centres in Ontario, as well as NE and Midwest USA.
• Rail lines near airport integrated into national network
• FTZ incentives
• “Gateway to a 6- state region with a population of 13.2 million”
• “Among American’s most efficient cargo airports”
• Land locked but direct access to highways
•Closest US port of entry to Europe•Specializes in cargo•No congestion•Immediate access to I95, several large trucking firms, convenient rail service and a deep water port (1 hr away)•Former military base – has facilities for cargo & maintenance operations•Superb weather record•Technical stop for some international flights
• During the next decade, the airport is planning for several cargo- related improvements -- construction of new cargo facilities and expansion of cargo aprons
Data Sources: A-Z World Airports Online; airport websites; airport personnel

YHZ – Competitive Advantage
• Well Supported– Available ramp and warehouse space adequate for current demand– Developable land available– On-site services from carriers, freight forwarders, customs brokers and cargo
specialists– Two integrated couriers operate daily international service
• Well Placed– Closest major continental North American link to the European Union (EU)– Unlimited 24/7 operations unlike Montréal Trudeau which has all-cargo aircraft
gauge and some operating hours restrictions• Well Priced
– Less expensive than Moncton although more expensive than Montréal, Bangor or Manchester. YHZ’s shorter distance from Europe makes up for price differential
• Well Connected– Excellent inter-modal rail, truck, water & air connections– Excellent highway connections to all inland points in Canada and US– Direct air carrier service to New York, Boston, Washington, London (UK) and all
major Canadian centres

Focused Approach to Airlines/Freight Forwarders
• Using the many advantages that Halifax presents, develop a focused approach to all cargo carriers that fit YHZ’s criteria
• Targetted foreign-based airline targets could include:– Cathay Pacific (for Asia-Pacific routes)– Cargolux (and Air Canada) for European destinations– DHL (an integrated carrier with the ability to handle modal changes
seamlessly)– One of the Indian Conglomerates as this market matures
• Aim to complement current all-cargo services and to recapture the air cargo traffic leaving Nova Scotia by truck to other airports
• Continue to actively engage freight forwarders to identify growth markets and service offering, including required infrastructure

7. Current Air Cargo Services at YHZ

Current YHZ All-Cargo Routes
Halifax
Keflavik
Vittoria
Liège
Frankfurt
Moncton
Montréal-Mirabel
Toronto
Hamilton
Newburgh
Wilmington
Charlotte
YFC/YSJ
YQY/YYG
YDF/YQX
YYT
Svc in both directions
Svc in 1 direction only
Indirect Svc to YHZ
Svc bypasses YHZ
No Halifax bound cargo originating in Charlotte permitted on Icelandair’s Charlotte to Halifax flight
Feeder locations shown in grey

YHZ Effective All-Cargo Aircraft Capacities
* Estimated based on routing of flight and expected proportion of cargo used by other flight segments
Flight Sector Carrier Routing Aircraft Effective % YHZ*
% Max Weight at Bulkout
Weekly Annual
Departure Dom Purolator YHZ-YQM-YHM '72F 32 50% 90% 5 72 3,768Departure Dom Cargojet Airways YHM-YQM-YHZ-YHM '72F 32 60% 90% 5 87 4,522Departure Dom Mornigstar/Fedex YHZ-YQM-YMX-YYZ '72F 32 50% 90% 4 58 3,014Departure Int'l Icelandair CLT-YHZ-KEF-LGG '75F 35 50% 90% 1 16 827Departure Int'l Air Canada Cargo YYZ-YHZ-VTT-FRA MD11F 93 40% 90% 1 34 1,745Departure TB ABX Air / Airborne Exp. YHZ-SWF-ILN DC9 14 100% 90% 1 13 669
Arrival Dom Purolator YHM-YQM-YHZ '72F 32 50% 90% 4 58 3,014Arrival Dom Purolator YHM-YMX-YQM-YHZ '72F 32 50% 90% 1 14 754Arrival Dom Cargojet Airways YHM-YQM-YHZ-YHM '72F 32 60% 90% 5 87 4,522Arrival Dom Mornigstar/Fedex YYZ-YMX-YQM-YHZ '72F 32 50% 90% 4 58 3,014Arrival Int'l Icelandair CLT-YHZ-KEF-LGG '75F 35 50% 90% 1 16 827Arrival Int'l Air Canada Cargo YYZ-YHZ-VTT-FRA MD11F 93 40% 90% 1 34 1,745Arrival TB ABX Air / Airborne Exp. SWF-ILN-YHZ DC9 14 100% 90% 1 13 669
Estimated Effective Cargo Capacity Allowing for Partial Load Capacity Availability of Some Flights
Payload (Tonnes)
Estimated FactorsWeekly Freq'y
Effective Capacity

Max Freighter Payload Capacities
• Payload capacities of freighter aircraft types used on scheduled cargo services at YHZ are:
N/A = Data not availableNote: All current scheduled jet freighter services to/from Halifax share the max payload with at least 1 other city, most often with Moncton
Aircraft Type Max Payload (kgs)
Max Payload (Metric Tonnes)
Main Deck (m3)
Bulk/Belly (m3)
B727-200F Adv 21,180 21.2 137.0 43.2
DC-9-32F 14,260 14.3 120.0 28.4
B757-200F 39,690 39.7 187.0 51.8
MD-11F 93,170 93.2 443.0 51.5
Beech 99F 1,364 1.4 N/A N/A
Beech King Air 200F 1,064 1.1 N/A N/A
PA-31F 909 0.9 N/A N/A
Cubic Metres

Current Passenger Carriers Carrying Cargo
• Increasing passenger numbers will reduce belly cargo capacity if passenger load factors increase faster than new flight capacity is added (which is the current trend)
Airline Flts/Day* Aircraft Types Dom.~ TB (US) Int'l Remarks
Air Canada 23E-175, E-190,
A-319/320/321, B-767-300
11 0 1 Plus weekly winter-seasonals to 9 International sun spots
Air Canada Jazz 32CRJ-100/200, DH8-100/300,
CRJ-705, B-1900D9 1 0
Continental Express 3 ERJ 0 1 0 Limited inbound cargo only
WestJet 6.5 B-737-700 3 2* 0 *Transborder winter-seasonal service to 2 Florida sun spots
Icelandair 3x/week B-757-200 0 0 1 Starting May 2007Air Saint Pierre 3x/week ATR-42 0 0 1 St. Pierre, FranceAir Transat, Condor & Zoom+ 9x/week A-310, B-767-300 0 0 5 Cargo Handled = Unknown* Reduced schedules on weekends. Based on the March 2006 OAG flight schedule.+ Air Transat, Condor and Zoom - Estimated summer 2007 flights/week. ~ Some cities are served by both AC Mainline and Jazz equipment.
Cities Served Nonstop
Year E/D Passengers % Change2006 3,378,601 4.6%2005 3,229,111 -0.4%2004 3,242,389 9.1%2003 2,973,187 4.2%2002 2,853,778 0.1%

Max Passenger Aircraft Cargo Capacities
• Maximum payload capacities of passenger aircraft types used on scheduled services at YHZ where cargo can be carried are:
Aircraft Type Max Cargo Payload (kgs)
Max Payload (Metric Tonnes)
Bulk/Belly Cargo Hold (m3)
A319-100 2,000 2.0 27.6 A320-200 3,000 3.0 37.4 A321-200 3,600 3.6 42.0 B767-300ER 14,800 14.8 106.8 ERJ-175 400 0.4 14.5 ERJ-190 1,502 1.5 23.8 CRJ-100/200 1,363 1.4 13.4* CRJ-705 2,134 2.1 24.8* ERJ-145 1,203 1.2 9.2 B737-700 1,800 1.8 27.3 B757-200 7,758 7.8 50.7 ATR-42-300 768 0.8 6-10.8 Dash 8-100 907 0.9 8.0 Dash 8-300 1,134 1.1 9.0 Beech 1900D 659 0.7 6.4
* Includes cabin baggage storage spaceRed = Estimated

8. Halifax Air Cargo Demand

Sources of Information for Demand Analysis
• Airport reported cargo tonnages• Nova Scotia International Merchandise Trade – $ values by
mode, origin/destination, product type and entry/exit province
• Canadian Online Trade Database - $ values for 2002-2006 by product type (detailed) and origin/destination and province
• US Bureau of the Census: Foreign Trade Division - $ value and tonnages by mode, port, origin/destination, product type (detailed)
• Canadian Seafood Industry Report - $ value and tonnages• Jacobs Consultancy Proprietary Databases
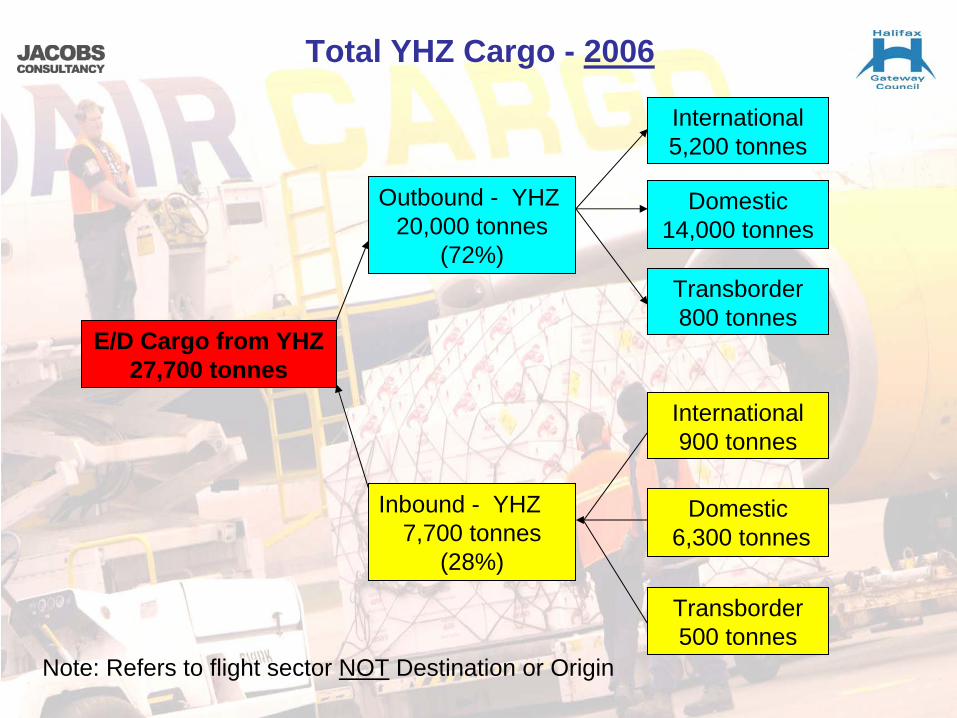
Total YHZ Cargo - 2006
E/D Cargo from YHZ27,700 tonnes
Outbound - YHZ20,000 tonnes
(72%)
Inbound - YHZ7,700 tonnes
(28%)
International5,200 tonnes
International900 tonnes
Domestic14,000 tonnes
Domestic6,300 tonnes
Transborder800 tonnes
Transborder500 tonnes
Note: Refers to flight sector NOT Destination or Origin

Air Cargo Tonnage at Halifax
• Annual growth rates– In 2006: 4.6%– Average 5-year: 3.6%
• Traffic Peaked in 2004– Declined in 2005 due to
withdrawal of transatlantic MK Airlines B747 flights
– Recovery in 2006
• Tonnages by Airlines– The mainline cargo and
passenger airline groups each handled approx. 13,000 t in 2006
– Most had growth in 2006, especially Icelandair
– CanJet withdrew from the marketplace Sept. 2006
2327
2826
3229
0
5
10
15
20
25
30
35
2001 2002 2003 2004 2005 2006
Total Annual Tonnage (000)
Source: Halif ax Airport
12.9
1.7
12.612.2
1.7
13.1
02
468
1012
1416
Mainline Cargo Airlines Mainline Passenger Airlines Other
2005
2006
Annual Tonnage (000)
Source: Halifax Airport
(FedEx, Purolator, Morning Star, Icelandic Air, ABX Air)
(Air Canada, WesJet, CanJet) (PE Air, Air St. Pierre)

Air Cargo by Flight Sector - 2006
• Most cargo at YHZ is carried on domestic flights. Based
on tonnages by air carrier, JC estimates:
– 73% on domestic flights– 5% on US transborder– 22% on international
• ABX Air flights to the US commenced in Oct 2006
– Over full year expect 460 t to US on ABX Air– Percent to US expected to increase to 12%
• Total seafood exports by air from YHZ in 2006 was approx. 14,000 t– Only 6,100 t total inbound & outbound is on international flights at YHZ– Thus, much of the air cargo on domestic flights is transferred to international
flights at other Canadian airports• For outbound cargo, final destination is:
– 80% international (including US) – 20% domestic
20,300
1,300
6,100
0
5,000
10,000
15,000
20,000
25,000
Domestic Transborder International
Estimated Total Annual Tonnage by Sector of Flight
Source: Jacobs Consult ancy

Exports from Nova Scotia Companies - 2005
• Nova Scotia all exports by air mode in 2005:
– Total 12,300 tonnes exported by air from various Canadian airports
– 10,000 tonnes, 85% of total, are fish and fish preparations
– Other items exported by air include:• Plastic & Rubber Prod. (excl.
Tires) and Metals & Metal Fabricated Products next greatest
• Industrial & Agricultural Machinery
• Transportation Equipment • Electrical Machinery &
Equipment • Precision Equipment
• Nova Scotia Seafood Exports (2005)– Only 12% of total seafood exports by
value are shipped by air mode from YHZ, % by weight much less
– Live or fresh seafood account for almost all exports of seafood products by air
Nova Scotia Exports by Air Mode - Tonne ('000)
0.10.41.4
10.0
0.30
2
4
6
8
10
12
Fish & FishPreparations
Other foods Fabricatedmaterials
Machinery &Equipment
Other
Source: Jacobs Consultancy est imates
Mode Used for Exports of Fish and Fish PreparationsMode Value Weight tonnesRoad* $617,321,595Water $288,491,791Air (Canadian airports) $123,305,588 9,988Total $1,029,118,974Source: $ values from Nova Scotia International Merchandise Trade , 2005
* Includes seafood trucked to US and re-exported by air from US airports

Exports by Air from Maritimes - 2005
• Exports from Nova Scotia by air mode in 2005
– 12,300 tonnes from Canadian airports
– Most flies from YHZ, 9,100 t– Significant amounts from
Montreal (2,000 t) & Toronto (1,000 t)
• Loss to Montreal & Toronto recovered by exports from other provinces using YHZ:
– P.E.I. 3,100 t– New Brunswick 1,800 t
• Total from YHZ 14,400 t• Excludes exports trucked to
US airports and flown to final destination
Origin of Exports from YHZ - Tonne ('000)
1.80.4
3.1
9.1
0
2
4
6
8
10
Nova Scotia Prince Edw ard Is. New Brunsw ick OtherEst imated from $values
Exports by Air from Nova Scotia - Canadian Airports Used - Tonne ('000)
0.21.0
9.1
2.0
0
2
4
6
8
10
Halifax (YHZ) Quebec (YUL) Ontario (YYZ) Other (YYT, YQM,..)
Source: Jacobs Consultancy (est imated from $values)

Types of Live/Fresh Seafood Exported from Nova Scotia - 2005
• Lobster accounts for most of the Asia/Pacific market, but under half the other markets• Hake and/or Haddock also prominent in European and US markets
Asia-Pacific (Tonnes)
1,955
230
24
22
24
0 500 1,000 1,500 2,000 2,500
Lobster
Bluefin Tuna
Live eels
Sea urchins
OtherEurope (Tonnes)
3,469
3,787
272
45
40
37
82
0 1,000 2,000 3,000 4,000
Lobster
Hake
Shrimps & praw ns
Scallops
Crab
Live eels
Other
Other US (Tonnes)
1,768
416
94
90
240
3,942
4,603
0 1,000 2,000 3,000 4,000 5,000
Lobster
Hake
Mussels
Shrimps & praw ns
Scallops
Atlantic halibut
Other
Maine/Massachusetts (Tonnes)
1,323
1,144
717
683
423
423
194
167
158
100
506
9,566
9,329
0 2,000 4,000 6,000 8,000 10,000 12,000
Lobster
Haddock
Scallops
Hake
Atlantic halibut
Clams
Founder
Sea urchins
Crab
Tuna
Sole
M ussels
Other
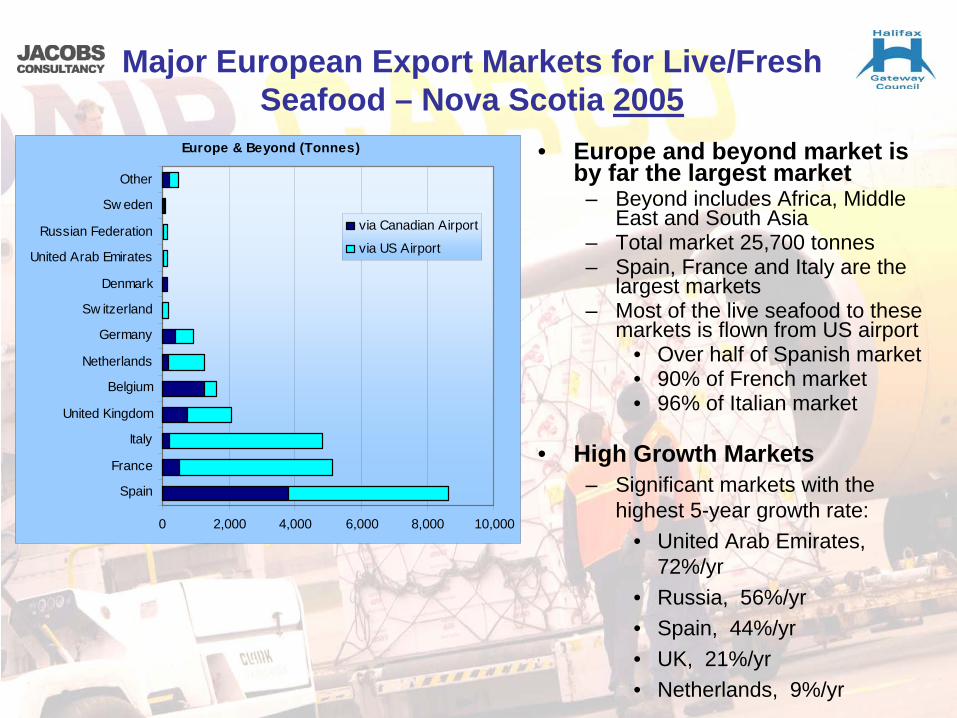
Major European Export Markets for Live/Fresh Seafood – Nova Scotia 2005
• Europe and beyond market is by far the largest market
– Beyond includes Africa, Middle East and South Asia
– Total market 25,700 tonnes– Spain, France and Italy are the
largest markets– Most of the live seafood to these
markets is flown from US airport• Over half of Spanish market• 90% of French market• 96% of Italian market
• High Growth Markets– Significant markets with the
highest 5-year growth rate:• United Arab Emirates,
72%/yr• Russia, 56%/yr• Spain, 44%/yr• UK, 21%/yr• Netherlands, 9%/yr
Europe & Beyond (Tonnes)
0 2,000 4,000 6,000 8,000 10,000
Spain
France
Italy
United Kingdom
Belgium
Netherlands
Germany
Sw itzerland
Denmark
United Arab Emirates
Russian Federation
Sw eden
Other
via Canadian Airport
via US Airport

Other Major Export Markets for Live/Fresh Seafood – Nova Scotia 2005
• Asia/Pacific Market– Total market 4,800 tonnes– Japan and South Korea are
the largest markets– Over half of the live/fresh
seafood to these markets is flown from US airports
– China, Hong Kong and Taiwan markets served from Canadian airports
– Significant markets with the highest 5-year growth rate:
• Taiwan (Taipei), 57%/yr• Thailand, 28%/yr• Malaysia, 9%/yr• China, 6%/yr
• Caribbean / Latin America– Small market, 210 tonnes– Two largest markets served
exclusively from US airport
Asia/Pacific (Tonnes)
0 500 1,000 1,500 2,000 2,500 3,000
Japan
Korea, South
Hong Kong
Singapore
China
Taiw an
Malaysia
Othervia Canadian Airport
via US Airport
Caribbean / Latin America (Tonnes)
0 20 40 60 80 100 120
Bermuda
Dominican Republic
Jamaica
Mexico
Othervia Canadian Airport
via US Airport

Monthly Variation in Live/Fresh Seafood Exports
• December and August peak months, 39% and 15% above average month
• November lowest, 39% below average, less than of half peak months
• Similar monthly distribution for most markets, except other US where demand is lower in summer and higher in spring
Nova Scotia Live/Fresh Seafood Exports (tonnes) by Month
0
1,000
2,000
3,000
4,000
5,000
6,000
Jan Feb Mar Apr May June July Aug Sep Oct Nov Dec
0
500
1,000
1,500
2,000
2,500
3,000
3,500
4,000
Jan Feb Mar Apr May June July Aug Sep Oct Nov Dec
Asia-Pacif ic
Europe &beyond
Other USA
Maine/Mass.
Nova Scotia Live/Fresh Seafood Exports (tonnes) by Month & Destination

Nova Scotia Live/Fresh Seafood Exports: Reported Destination
• Destination of exported live/ fresh seafood from Nova Scotia– Almost 80% reported as
exported to the US, half of total reported as Maine or Massachusetts, but much of this is re-exported (discussed later)
– Almost 10,000 t of live seafood exported by air mode via Canadian airports:
• 7,730 t to Europe and beyond• 2,260 t to Asia / Pacific
– 10,000 t corresponds to seafood exports noted previously
• At least 40% flown to YUL & YYZ for transfer to international flights
• Most (77%) on eastbound flights across Atlantic, 22% to Asia/Pacific
Most (85%) is re-exported to Europe & Beyond
Other US, 11,150,
24%Europe/ M.East/ Africa,
7,730, 17%
Asia-Pacific, 2,260, 5%
Maine/ Mass., 24,730,
54%
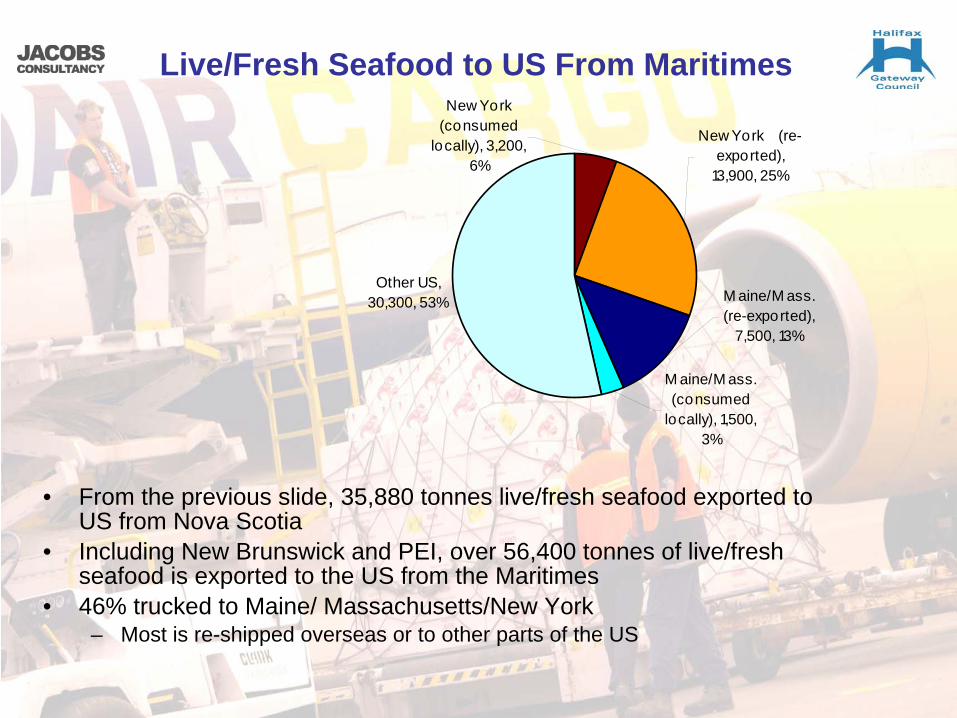
Live/Fresh Seafood to US From Maritimes
• From the previous slide, 35,880 tonnes live/fresh seafood exported to US from Nova Scotia
• Including New Brunswick and PEI, over 56,400 tonnes of live/fresh seafood is exported to the US from the Maritimes
• 46% trucked to Maine/ Massachusetts/New York– Most is re-shipped overseas or to other parts of the US
Other US, 30,300, 53% M aine/M ass.
(re-exported), 7,500, 13%
New York (consumed
locally), 3,200, 6%
New York (re-exported),
13,900, 25%
M aine/M ass. (consumed
locally), 1,500, 3%

Live/Fresh Seafood Exported from Maritimes to Maine/Massachusetts
• Most of the live/fresh seafood trucked to Maine/ Massachusetts is re- shipped overseas or to other parts of the US
• Live/fresh seafood flown overseas from the N-E US airports:– 7,500 t exported from Boston airport– 13,900 t exported from New York airports– Total of 21,400 t represents 40% of total live/fresh seafood exports from
Maritimes to the US– Most of these exports are imported from the Maritimes– Some is local US seafood, but this could be used to satisfy local demand, rather
than being satisfied by imports from Canada, and the offsetting Canadian seafood could be exported instead
• Of the remaining live/fresh seafood exported to Maine/ Massachusetts which is not re-exported from Boston or New York:
– 1,500 tonnes is consumed locally– Some likely shipped west to be flown to Asia– 5-10% of the lobster exports are from airports other than Boston and New York– Tonnage could not be determined

NovaScotia
47
NB & PEI35
YQM
YULYYZ
YHZ
BOSJFK
6
Domestic Flights
International Flights (excluding transfers from YHZ, YQM domestic flights)
5
Domestic Flights
6 International Flights(incl. Transborder)
International Flights
21
5
3
9
3
5 + 68
+ 9
All except grey numbers are ’000 tonnes of live/fresh seafood
Grey numbers are ‘000 tones of other domestic cargo from airport
Truck (US consumption) – 36 US – 36
RoW – 0.4
East Asia – 8
Europe & Beyond– 37
Seafood Origin -------- Airport ---------------------- Flight -------------- Destination
6
1520
16

KEY:
Road transport (‘000 t)
Live/fresh seafood origin (‘000 t)
Airports
Consumption Regions (‘000 t)
Air cargo outbound, (Blue - seafood (‘000 t))(Total Cargo shown for airports in the Maritimes only)

Live/Fresh Seafood Exports from Maritimes: Potential for YHZ
• Anticipate at least additional 21,400 t could potentially be shipped from YHZ• Live/fresh seafood exports which could potentially be exported by air from
YHZ is approximately 47,000 tonnes– This includes live/fresh seafood exported from New Brunswick and PEI– 31% currently is flown from YHZ– 24% currently is flown from other Canadian airports– 46% currently is flown from Boston and New York airports
Potential Air Exports (Tonnes '000)
9.13.2
5.3
8.0 15
6
0
5
10
15
20
25
YHZ Other CanadianAirport
Truck to USAirports*
New Brunsw ick & PEI
Nova Scotia
Source of Live/ fresh Seafood14.4
11.2
21
* Split bet ween NS and Ot her Provences is
approximat e

Imports by Air to Halifax
• Imports by air are primarily high end products such as transportation equipment and other equipment or machinery
• The US is the primary source of air imports, 62% of total imports by value. The UK (15%) and other members of the European Community (15%) are also significant
$0.9
$1.0
$28.5
$64.9
$162.4
$37.0
$32.5
$5.7
$0 $50 $100 $150 $200
Food FeedVegetables
Crude M aterialsIneditable
FabricatedM aterialsIneditable
Industrial &AgriculturalM achinery
Transportat ionEquipment
ElectricalM achinery &Equipment
PrecisionEquipment
M iscellaneous EndProducts
Imp o rt V alue ( M il l ion)
Product Type
$49.6
$52.2
$7.3
$0.3
$0.7
$0.4
$2.4
$9.6
$0.4
$0.3
$5.2
$1.2
$0 $20 $40 $60 $80 $100
United States
United Kingdom
Other European Comm.
Other Western Europe
Eastern Europe
M iddle East
Other Africa
Japan
Other Asia
Oceania
South America
Caribbean+Central Am.
Other Countries
Import Value (M illion)
$ 211
Origin

Air Imports to Northeast US States – Boston
• Most international cargo at Boston carried in belly of passenger aircraft
• Total air imports of 49,000 t, equal to over 3 times total YHZ inbound cargo
• Imports greatest from Europe – consistent with passenger service
• 3-year growth rates:– Overall slight decline in
tonnage (-.05%)– Switzerland fastest growing
market (39%/yr)– Ireland next fastest 5%/yr
Origin Country
0 1,000 2,000 3,000 4,000 5,000 6,000 7,000
Germany
Netherlands
United Kingdom
Ireland
Switzerland
Italy
France
Austria
Iceland
India
China
Spain
Norway
Belgium
Sweden
Israel
T o nnage

Air Imports to Northeast US States – Boston
• Optic, Photographic, etc, Medical or Surgical Instruments, etc., highest tonnage. Growth rates also high averaging 15%/yr 2003-2006
Types of Products
0 1,000 2,000 3,000 4,000 5,000 6,000 7,000 8,000 9,000 10,000
Optic, Photo etc, Medic or Surgical Instrments etc
Nuclear Reactors, Boilers, Machinery etc.; Parts
Edible Vegetables & Certain Roots & Tubers
Electric Machinery etc; Sound Equip; TV Equip; Pts
Fish, Crustaceans & Aquatic Invertebrates
Plastics & Articles Thereof
Footwear, Gaiters etc. & Parts Thereof
Pharmaceutical Products
Glass & Glassware
Apparel Articles & Accessories, Not Knit etc.
Live Trees, Plants, Bulbs etc.; Cut Flowers etc.
Special Classification Provisions, Nesoi
Printed Books, Newspapers etc; Manuscripts etc
Apparel Articles & Accessories, Knit or Crochet
Tools, Cutlery etc. of Base Metal & Parts Thereof
Essential Oils etc; Perfumery, Cosmetic etc Preps
Tonnages

Air Imports to Northeast US States – New York
• International air cargo imports at New York 820,000 tonnes, over 16 times greater than at Boston
• China by far the greatest origin of imports by air
• Major European countries and Japan & India also high
• 3-year growth rates:– Overall slight increase
in tonnage (.07%)– China tonnages
growing quickly (17%/yr)
– Little/no growth at most other major originating countries
– UK decline by 6%/yr
Origin Country
0 20,000 40,000 60,000 80,000 100,000 120,000 140,000 160,000 180,000
China
Germany
Italy
United Kingdom
Japan
India
France
Israel
Netherlands
Pakistan
Taiwan
Switzerland
Hong Kong
Spain
Korea, South
Indonesia
Singapore
Bangladesh
Brazil
Sweden
Thailand
Vietnam
Sri Lanka
T o nnage

Air Imports to Northeast US States – New York
• Clothing, equipment & machinery parts and electrical/sound/TV equipment have the highest tonnages
Types of Products
0 20,000 40,000 60,000 80,000 100,000 120,000
Apparel Articles & Accessories, Not Knit etc.
Nuclear Reactors, Boilers, Machinery etc.; Parts
Apparel Articles & Accessories, Knit or Crochet
Electric Machinery etc; Sound Equip; Tv Equip; Pts
Optic, Photo etc, Medic or Surgical Instrments etc
Footwear, Gaiters etc. & Parts ThereofFish, Crustaceans & Aquatic Invertebrates
Plastics & Articles Thereof
Edible Vegetables & Certain Roots & Tubers
Leather Art; Saddlery etc; H&bags etc; Gut Art
Special Classification Provisions, Nesoi
Nat etc Pearls, Prec etc Stones, Pr Met etc; CoinPharmaceutical Products
Printed Books, Newspapers etc; Manuscripts etc
Essential Oils etc; Perfumery, Cosmetic etc Preps
Vehicles, Except Railway or Tramway, & Parts etc
Textile Art Nesoi; Needlecraft Sets; Worn Text Art
Live Trees, Plants, Bulbs etc.; Cut Flowers etc.
Tonnage

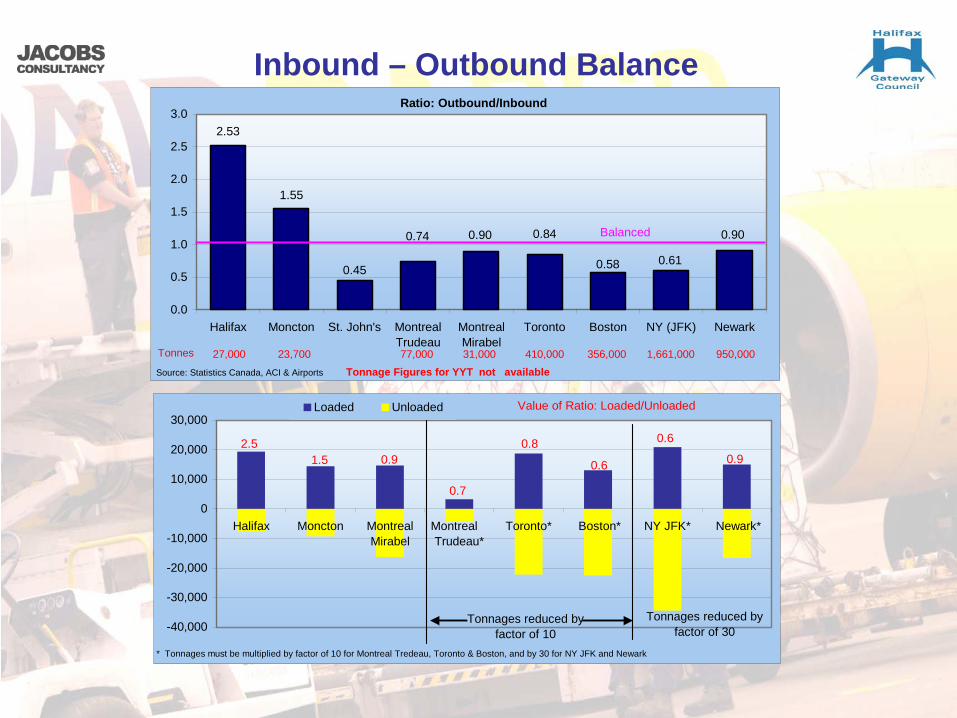
Inbound – Outbound Balance
• Most cargo from Halifax is outbound– 72% outbound in 2005 based on data reported by
Statistics Canada – Only 28% inbound– Ratio Outbound/Inbound = 2.5. Thus need to
increase inbound cargo by factor of 2.5 times to create balance flow
– Most International traffic is outbound only – little inbound cargo
• Halifax uncharacteristic of airports in Eastern Canada and US– Majority is inbound cargo at other airports, except
Moncton– Outbound imbalance presents opportunity for
Halifax
Outbound72%
Inbound28%
Inbound – Outbound Balance
1.55
0.45
0.74 0.90
0.58
0.90
0.61
2.53
0.84
0.0
0.5
1.0
1.5
2.0
2.5
3.0
Halifax Moncton St. John's MontrealTrudeau
MontrealMirabel
Toronto Boston NY (JFK) Newark
Tonnes 27,000 23,700 77,000 31,000 410,000 356,000 1,661,000 950,000Source: Statistics Canada, ACI & Airports
Balanced
Ratio: Outbound/Inbound
Tonnage Figures for YYT not available
-40,000
-30,000
-20,000
-10,000
0
10,000
20,000
30,000
Halifax Moncton MontrealMirabel
Montreal Trudeau*
Toronto* Boston* NY JFK* Newark*
Loaded Unloaded
* Tonnages must be multiplied by factor of 10 for Montreal Tredeau, Toronto & Boston, and by 30 for NY JFK and Newark
2.51.5
0.7
0.90.8
0.6
0.6
0.9
Value of Ratio: Loaded/Unloaded
Tonnages reduced by factor of 10
Tonnages reduced by factor of 30

9. YHZ Common Use Cargo Facility

The Air Cargo Business Plan
• The Halifax Gateway Air Cargo Business Plan goes beyond simply air cargo operations
• Aim is to develop routes plus distribution and logistics entities to establish YHZ as a value- added hub and an entrance point to the NAFTA Area

The Economic Benefits of Air Cargo
• Wide ranging benefits for airport and wider community
• Successful development will lead to: – Significant economic benefits including:
• Centre of Logistics Excellence within NAFTA• Economic multiplier effects: better cargo access leads to logistic
intensive opportunities which require more frequency and routes• Job creation at airport and in community
– Long-term partnerships– Revenue enhancement for HIAA through landing fees
and land/lease depending on model

Cargo Facility – Infrastructure Requirements
• Common Use Facility– New air cargo facility required to supplant inadequate facilities and provide space for
expansion/ new tenants
– Designed to accommodate seafood exports and future growth
– Flexible design to facilitate expansion as necessary
– Located on landside-airside perimeter to provide landside visitors and trucks with direct dock access and secure aircraft access compliant with likely TC cargo security regulations
– Includes:• Office space
• Common use chillers and coolers
• Landside truck docks
• Separate tenant bays
– Estimated 48,400 sq ft facility required. PHASE I estimated at 35,000 sq ft• IATA benchmark of 1.1 sq ft per tonne of inbound cargo, and 1.0 sq ft per tonne of outbound
cargo
• Current demand of 27,000 tonnes/yr + potential for additional 21,400 tonnes/yr = 48,400 tonnes per year, mainly outbound


Rendering of YHZ Common Use Cargo Facility
Source: HIA Cargo Development Study, July 2000, Sypher

Conceptual Cargo Facility Floor Plan
Source: HIA Cargo Development Study, July 2000, Sypher
Cargo Facility Operational Assumptions
• Title to revert back to HIAA at end of concession period if BOT approach chosen
• HIAA will maintain airside infrastructure associated with the development to ensure tenant safety and operational integrity
• Facility will require airside access and infrastructure regardless of location of warehouse
• Cargo operations will be consolidated at new facility to greatest extent possible
• Existing operators will continue to operate out of existing facilities until leases expire
• Companies operating from off-airport facilities (i.e., FedEx) but require airside access will pay a “through-the-fence” fee to HIAA

Cargo Facility – Infrastructure
• Airside Infrastructure– New facility requires an adjacent apron
– The 8,800 ft main runway imposes minor payload penalties which will not impact the viability of Trans-Atlantic all cargo flights
• Ramp Equipment– Typical loader for placing cargo and luggage containers in belly of a B767
can be cross-utilized for pallets to main deck of a narrow body freighter• Equipment is available at YHZ:
– Air Canada has the most equipment available, and airline should be initial point to negotiate a usage agreement
– Servisair has a Commander which can do main deck work on any aircraft type.
– Worldwide also has 2 units, however, their equipment has suffered reliability issues

Cargo Facility Development Options
OPTIONIMPACT
Private Sector Develops and Operates Facility (BOT*)
HIAA Develops Facility; Third- Party Operates
HIAA Develops and Operates Facility
Funds design and construction of facility and parking
Developer HIAA HIAA
Preps and funds airside infrastructure HIAA HIAA HIAA
Operates and markets facility & pays O&M Developer Third party HIAA
Retains tenant rental revenues Developer Third party HIAA
Retains land lease revenues HIAA HIAA HIAA
Title of facility Reverts to HIAA at end of concession period HIAA throughout HIAA throughout
Risk / Reward to HIAALow
Developer takes all risks
Hi-Medium
HIAA risk if third-party operator defaults
High
HIAA risk if cannot fully lease out facility
* Build, Operate, Transfer

10. YHZ Air Cargo Facility:
Financial Analysis

Cargo Facility - Baseline Cost Assumptions
DEVELOPMENT & CONSTRUCTION CAPITALFacility - 35,000 sq. ft. facility
- $125/sq. ft- Includes security & chillers
$4.4 M
Airside Infrastructure (apron) $1.6 M
Landside Infrastructure (parking) $0.7 M
TOTAL $6.7 M
MAINTENANCE CAPITALBuilding and Parking – 5% of original construction value
$255 K(in years 16 and 21)
ANNUAL OPERATIONS & MAINTENANCEOperations (incl. marketing) - $11.86 /sq. ft. $415 K
TOTAL $415 K

Cargo Facility - Baseline Revenue Assumptions
OPTION
REVENUE
1. Private Sector Develops and Operates Facility
(BOT)*
2. HIAA Develops Facility; Third Party
Operates
3. HIAA Develops and Operates Facility
Incremental Landing Fees$448 K
(fully captured by Year 5)
$448 K (fully captured by Year 5)
$448 K (fully captured by Year 5)
Annual Land Lease224,000 sq ft fully leased
($0.24/sq ft)
$52 K
224,000 sq ft fully leased ($0.24/sq ft)
$52 K
• Anticipated leased space ‘take-up’
– + 65% Year 1 = $34 K– + 10% Year 2 = + $5 K– + 10% Year 3 = + $5 K– + 15% Year 4 = + $8 K
• 15 Year CapEx Amortized Rent of $30.33 /sq ft
– $13.05 /sq ft for O&M (Cost + 10%)
– $17.29 /sq ft for CapEx (P&I + 25% risk)
•25 Year CapEx Amortized Rent of $26.46 / sq ft
– $13.68/sq ft for O&M (Cost & Maint. Capital+ 10%)
– $12.78 /sq ft for CapEx (P&I + 25% risk)
Annual Facility Rental – Recovery of O&M
N/A N/A
Annual Facility Rental – Recovery of Capital Cost• $5.1 million ($4.4 + $0.7)• 5% interest• Monthly payments
N/A
•15 Year CapEx Amortized Rent of $15.21 / sq ft(P&I + 10% risk)
•25 Year CapEx Amortized Rent of $11.24 / sq ft (P&I + 10% risk)
* BOT – Build, Operate, Transfer
** All costs and revenues escalate at CPI (est. 2%)

Summary of Costs & Revenues to HIAA 15 Year Amortization
OPTION 1. Private Sector Develops and Operates Facility
(BOT)
2. HIAA Develops Facility; Third-Party
Operates
3. HIAA Develops and Operates Facility
DEVELOPMENT AND CONSTRUCTION COSTS
Cargo Facility N/A $4.4 M $4.4 M
Airside (apron) $1.6 M $1.6 M $1.6 M
Landside (parking) N/A $0.7 M $0.7 M
TOTAL CAPEX HIAA $1.6 M $6.7 M $6.7 M
ONGOING OPERATING AND MAINTENANCE COSTS @ Year 1 (not inflated)
Operations incl. marketing ($11.86/ ft2)
N/A N/A $415 K
TOTAL O&M HIAA N/A N/A $415 K
REVENUES (not inflated)
Landing Fees $448 K (from Year 5) $448 K (from Year 5) $448 K (from Year 5)
Land Lease $52 K (from Year 1) $52 K (from Year 1) $52 K (by Year 4)
Facility Rental – O&M recovery N/A N/A $456 K (by Year 4)
Facility Rental – Capital recovery N/A $532 K (from Year 1) $605 K (by Year 4)
CUMULATIVE OPERATING SURPLUS @ Year 15 (inflated)
HIAA OPERATING SURPLUS $6,454 K $8,585 K $8,786 K

Summary of Costs & Revenues to HIAA 25 Year Amortization
OPTION 1. Private Sector Develops and Operates Facility
(BOT)
2. HIAA Develops Facility; Third-Party
Operates
3. HIAA Develops and Operates Facility
DEVELOPMENT AND CONSTRUCTION COSTS
Cargo Facility N/A $4.4 M $4.4 M
Airside (apron) $1.6 M $1.6 M $1.6 M
Landside (parking) N/A $0.7 M $0.7 M
TOTAL CAPEX HIAA $1.6 M $6.7 M $6.7 M
ONGOING OPERATING AND MAINTENANCE COSTS @ Year 1 (not inflated)
Operations incl. marketing personnel ($11.86/ ft2)
N/A N/A $415 K
TOTAL O&M HIAA N/A N/A $415 K
REVENUES (not inflated)
Landing Fees $448 K (from Year 5) $448 K (from Year 5) $448 K (from Year 5)
Land Lease $52 K (from Year 1) $52 K (from Year 1) $52 K (by Year 4)
Facility Rental – O&M recovery N/A N/A $479 K (by Year 4)
Facility Rental – Capital recovery N/A $393 K (from Year 1) $447 K (by Year 4)
CUMULATIVE OPERATING SURPLUS @ Year 25 (inflated)
HIAA OPERATING SURPLUS $16,646 K $20,559 K $22,900 K

Summary of NPV Analysis
OPTION
15 YEAR AMORTIZATION ON CAPITAL25 YEAR AMORTIZATION ON CAPITAL +
MAINTENANCE CAPITAL IN YEARS 16 AND 21
NPV NO EXTERNAL
FUNDING
NPV 25% EXTERNAL
FUNDING ON HIAA’S SHARE OF CAPEX
NPV NO EXTERNAL
FUNDING
NPV 25% EXTERNAL
FUNDING ON HIAA’S SHARE OF CAPEX
1. Developer BOT $4,419K $4,841K $9,116K $9,554K
2. HIAA Develops; Third- Party Operates
$5,899K $7,666K $11,245K $13,081K
3. HIAA Develops & Operates
$5,896K $7,664K $12,481K $14,317K
• Positive NPV under all scenarios• Options 2 and 3 equal NPV on 15 year amortization period• Option 3 is highest NPV on 25 year amortization period• External funding does not change options ranking

11. Findings

Findings - I
• Increasing number of companies are out-sourcing to remote locations. Decreasing product cycles for high value, high tech goods have made fast delivery to market essential
• Passenger traffic is currently growing at historically high rates and load factors are increasing which is putting pressure on belly capacity available for air cargo
• Air cargo growth rates have exceeded those of passenger growth over the past decade: the passenger/cargo “growth gap” indicates continuing use (and growth) of all-cargo aircraft
• Freight forwarders are the key to all-cargo activity • Intermodal facilities and transshipment infrastructure are important for the
future: cargo pre-clearance is still someway off in current secure border climate but should be seen as a strategic objective for Halifax Gateway Council– YHZ could provide a test bed for Cargo Gateway Concept– Other modal activity should be seen as complementary to the air cargo
offering

Findings - II
• Significant changes recently in the international air policy arena which will increase air cargo opportunities
• US-Canada Air Service Agreement now allows Canadian and US air carriers to: pick up all-cargo traffic in the other country’s territory and carry it to a third country as part of a service to or from their home territory
• TC’s Blue Skies objectives include securing as much flexibility for all-cargo services as possible. Overall, new international air policy significantly elevates importance of serving the wider – non-airline – community
• Canada’s transshipment program allows Canadian and foreign carriers to carry international cargo transshipments coming from, and destined to, points outside Canada via approved Canadian airports even if the rights are not provided in Canada's bilateral air transport agreements: in-transit cargo may be stored in bond until it is transported to its final destination by air or another mode
• Halifax has many competitive advantages, including: developable land; on a flight sector basis, less expensive to operate European routes than competing airports; excellent inter-modal rail, truck, water & air connections; and current direct air carrier service to many major centres
• Need a focused and not scattergun approach to pre-qualified airlines and freight forwarders to highlight Halifax’s air cargo advantages

Findings - III
• E/D Cargo from YHZ in 2006 amounted to approximately 28,000 tonnes• Most cargo from YHZ is carried on domestic flights, even though 80% of
enplaned air cargo is destined for international destinations. JC estimates 73% of all air cargo from Halifax is carried on domestic flights, 5% on transborder flights and 22% on international flights
• 25% of Nova Scotia’s air cargo is trucked to another airport outside the Province
• Capturing the potential market would increase air cargo loads from YHZ by at least an additional 21,000 tonnes
• Largest air cargo export commodity is live/fresh seafood which shows significant seasonal variation: much of the seafood trucked to Boston and New York is re-exported to international markets by air
• Most cargo from Halifax is outbound: 72% outbound in 2005 based on data reported by Statistics Canada. This is atypical of airports in Eastern Canada and US where majority of cargo is inbound. This Outbound imbalance presents an opportunity for Halifax, particularly in light of the new Open Skies Agreement with US

Findings - IV
• Aim of Halifax Gateway Air Cargo Business Plan is to develop routes as well as distribution and logistics businesses to establish Halifax as a value- added hub and an entrance point to the NAFTA Area
• Successful implementation will lead to significant economic benefits including: development of Halifax as a Centre of Logistics Excellence within NAFTA; providing beneficial economic multiplier effects; leading to job creation at YHZ and in Halifax Regional community; as well as revenue enhancements for HIAA
• A phased approach to developing a common-use air cargo facility, required to supplant inadequate facilities and provide space for expansion/ new tenants, should be designed to accommodate seafood exports and future growth with a flexible design to facilitate expansion as necessary
• A 35,000 sq ft PHASE I building for construction in the short term based on the immediate opportunities highlighted: PHASE II will add another 15,000 sq ft and should be planned from the start
• In each of the three development options addressed, HIAA should maintain airside infrastructure associated with the development to ensure tenant safety and operational integrity

Findings - V
OPTION
15 YEAR AMORTIZATION ON CAPITAL25 YEAR AMORTIZATION ON CAPITAL +
MAINTENANCE CAPITAL IN YEARS 16 AND 21
NPV NO EXTERNAL
FUNDING
NPV 25% EXTERNAL
FUNDING ON HIAA’S SHARE OF CAPEX
NPV NO EXTERNAL
FUNDING
NPV 25% EXTERNAL
FUNDING ON HIAA’S SHARE OF CAPEX
1. Developer BOT $4,419K $4,841K $9,116K $9,554K
2. HIAA Develops; Third- Party Operates
$5,899K $7,666K $11,245K $13,081K
3. HIAA Develops & Operates
$5,896K $7,664K $12,481K $14,317K
• Three scenarios considered with different risk profiles:– Low Risk: External party develops and operates the facility– Medium Risk: HIAA develops the property but third party operates– High Risk: HIAA develops the property and operates the facility
• All scenarios present positive NPV on investment

Conclusion
• Halifax has a unique opportunity to use the current OUTBOUND market imbalance. With the relatively high yield on YHZ freight volumes, shippers have more elasticity on the cost of freighter space that would be required from YHZ. Most markets that have lower yielding commodities do not enjoy this flexibility and therefore are attracted to the major gateways (which generally are the passenger gateways with spare, cheaper but less dependable belly capacity)
• Halifax is so close to the market that the additional shelf time can/will translate into increased, at least perceived, value to the end use customer
• Some potential competitors for the international cargo volumes that Halifax might capture include JFK, EWR (FedEx European gateway), and Wilmington (DHL national hub)
• The other regional all-cargo or retired military airports that seek additional cargo activity have a disadvantage of having to endure the cost and time of trucking AND then the higher cost of freighter capacity
• Realizing the opportunities highlighted needs focus and precision with the data, presentations, identification of targets, marketing and community delivery
• Bottom line: there is significant positive data to generate optimism about the outcome of a focus and well resourced Gateway Air Cargo initiative

12. Recommendations

Recommendation: Actively Pursue Air Cargo Opportunity
• Recommendation 1: Introduce a Canadian Transshipment Program at YHZ and market to wider cargo community (including airlines, freight forwarders, manufacturers)
• Recommendation 2: Develop competitive incentive package with community• Recommendation 3: Pursue Options for Common Use Cargo Facility
Development • Recommendation 4: Identify and actively pursue all-cargo service with targeted,
pre-qualified airlines, even if they currently do not have access to the Halifax market– If there is interest from an all-cargo carrier that does not have access to
Halifax, support a request for an extra-bilateral authority (issued by the Minister) in order to have the carrier licensed to operate by the CTA
• Recommendation 5: Continue to request airport representation as observers at future bilateral negotiations, immediately to influence a speedy conclusion to EC Open Skies negotiations which benefits Halifax, and to have YHZ designated in all future air bilaterals
• Recommendation 6: Actively lobby Transport Canada/Foreign Affairs/International Trade to negotiate a cargo pre-clearance agreement with US