Half Yearly Performance Snapshot - tga.gov.au · Half Yearly Performance ... tracking our progress...
25
Therapeutic Goods Administration Half Yearly Performance Snapshot 1 July to 31 December 2017
Transcript of Half Yearly Performance Snapshot - tga.gov.au · Half Yearly Performance ... tracking our progress...
Therapeutic Goods Administration
Half Yearly Performance Snapshot
1 July to 31 December 2017

Therapeutic Goods Administration
Half Yearly Performance Snapshot: July to Dec 2017 Page 2 of 25
Copyright
© Commonwealth of Australia 2018 This work is copyright. You may reproduce the whole or part of this work in unaltered form for your own personal use or, if you are part of an organisation, for internal use within your organisation, but only if you or your organisation do not use the reproduction for any commercial purpose and retain this copyright notice and all disclaimer notices as part of that reproduction. Apart from rights to use as permitted by the Copyright Act 1968 or allowed by this copyright notice, all other rights are reserved and you are not allowed to reproduce the whole or any part of this work in any way (electronic or otherwise) without first being given specific written permission from the Commonwealth to do so. Requests and inquiries concerning reproduction and rights are to be sent to the TGA Copyright Officer, Therapeutic Goods Administration, PO Box 100, Woden ACT 2606 or emailed to <[email protected]>.

Therapeutic Goods Administration
Half Yearly Performance Snapshot: July to Dec 2017 Page 3 of 25
Contents
Introduction _____________________________________________ 4
Performance highlights --------------------------------------------------------------- 4
Processing and approval times _________________________ 7
1. Prescription medicines -------------------------------------------------------------- 7
2. Over-the-Counter medicines ------------------------------------------------------ 10
3. Complementary medicines -------------------------------------------------------- 12
4. Biologicals ------------------------------------------------------------------------- 13
5. Medical devices -------------------------------------------------------------------- 14
6. Exports ----------------------------------------------------------------------------- 16
7. Access to unapproved therapeutic goods ----------------------------------------- 16
8. Licensing and manufacturing ------------------------------------------------------ 18
9. Laboratories ---------------------------------------------------------------------- 20
10. Medicine and Vaccine Adverse Event Reporting --------------------------------- 21
11. Medical device incident reports --------------------------------------------------- 21
12. Regulatory compliance ---------------------------------------------------------- 22
13. Recalls --------------------------------------------------------------------------- 23

Therapeutic Goods Administration
Half Yearly Performance Snapshot: July to Dec 2017 Page 4 of 25
Introduction The Therapeutic Goods Administration (TGA) prepares an annual TGA Business Plan, which identifies the priority activities being undertaken over the 2017-18 reporting period and is available on the TGA website. This Half Yearly Performance Snapshot provides statistical information for 1 July to 31 December 2017 in relation to our regulation of therapeutic goods for safety, effectiveness, performance and quality, tracking our progress against the priorities we have identified for the year.
As part of our annual plan we have been working to implement the Government’s response to the Review of Medicines and Medical Devices Regulation. Following the passage of amendments to the Therapeutic Goods Regulations through the Therapeutic Goods Amendment (2016 Measures No. 1) Bill, this reporting period now includes new data sets1 in relation to:
· Orphan Drugs · Special Access Scheme · Authorised Prescriber Scheme and · Priority pathways for medicines and medical devices.
Further information about how therapeutic goods are regulated in Australia can be found on the TGA website.
Performance highlights The TGA has maintained a high level of activity while also progressing regulatory reforms over the reporting period, 1 July to 31 December 2017. Highlights are as follows:
Regulatory reforms
Orphan drug program reform · A reformed orphan drug program came into effect on 1 July 2017 and created a fairer program
that aligns more closely with international criteria without impeding the availability of drugs for rare diseases. The objective of the orphan drug program is to provide an incentive to sponsors to bring medicines for a small population to market and make medicines available to patients who would not otherwise be able to access them. The incentive is in the form of a waiver of application and evaluation fees.
Special Access Scheme · The Special Access Scheme (SAS) Category C notification pathway was made available on
3 July 2017 to increase timeliness and ease access to therapeutic goods for Australian patients. This pathway allows certain unapproved goods when used for a particular indication to be supplied immediately to patients by an authorised health practitioner without first requiring approval by the TGA. A total of 4,975 notifications for access to therapeutic goods were received under the new SAS Category C notification pathway.
1 Tables 2, 3 and 5

Therapeutic Goods Administration
Half Yearly Performance Snapshot: July to Dec 2017 Page 5 of 25
Authorised Prescriber Scheme · From 3 July 2017, changes were made to the Authorised Prescriber Scheme to streamline the
application process by removing the requirement for doctors to submit clinical justification withtheir application.
Priority review of prescription medicines · A new priority review pathway was implemented on 1 July 2017. Priority review involves faster
assessment of vital and life-saving prescription medicines for which a complete data dossier isavailable. The target timeframe of 150 working days is up to three months shorter than thestandard prescription medicines registration process. The Priority review pathway operates withnew and flexible business processes in order to facilitate faster assessment for registration, whilemaintaining TGA's high standard for efficacy, safety and quality.
Priority review of medical devices · Priority review of certain novel medical devices commenced from January 2018. Priority review
designation is for breakthrough technologies treating life threatening or seriously debilitatingconditions where there is unmet clinical need. Applications which are granted a Priority reviewdesignation will be allocated 'front-of-queue' priority throughout the relevant assessmentprocess (whether that is for conformity assessment and/or inclusion on the Australian Register ofTherapeutic Goods (ARTG)).
Medicines
Prescription medicines · Over the reporting period, 166 Category 1 (including 22 New Chemical Entities (NCE) and 55 new
generic medicines) and 695 Category 3 applications were approved. This represents an increaseagainst the equivalent period in 2016 (156 Category 1 and 665 Category 3 applications). Meanand median approval times were below the statutory timeframes.
· Mean and median approval times for new generic medicines (190 and 185 working daysrespectively) and Product Information changes (130 and 129 working days respectively) werebelow that of NCE (209 and 212 working days respectively) as these application types aretypically processed without referral to independent expert advisory committees.
Over-the-counter medicines · The number of new medicine applications (N1 to N5) and applications to change existing
medicines (C2 to C4) approved in July to December 2017 (300) was higher than for theequivalent period in 2016 (206). Despite the increase in numbers for these application types, thepercentages of applications completed within target timeframes were well above the 80%target (93% for N4 applications and 100% for all other application types).
Complementary medicines In line with the increase in the proportion of medicines which were cancelled by a sponsor after our request for information (73%, compared with 20% for July to December 2016), and the increase in the number of targeted reviews in recent years, the proportion of medicines with verified compliance breaches decreased to 56% (compared with 80% for July to December 2016).
·
Therapeutic Goods Administration
Half Yearly Performance Snapshot: July to Dec 2017 Page 6 of 25
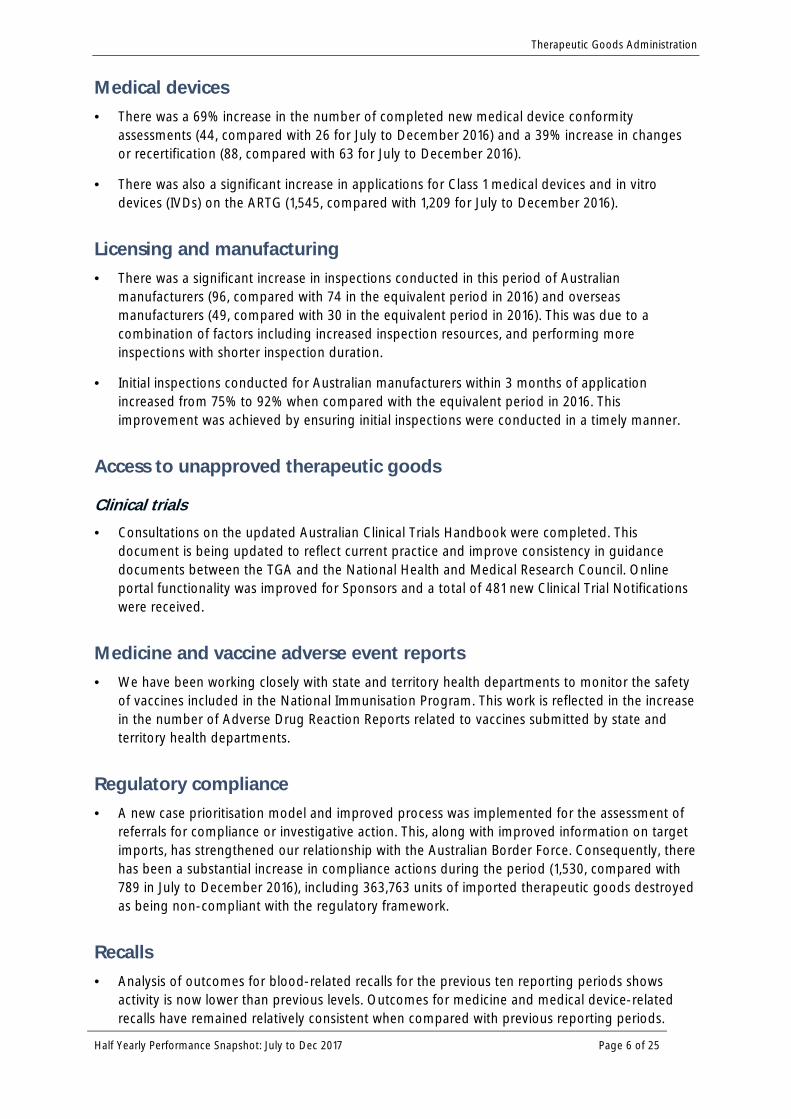
Medical devices · There was a 69% increase in the number of completed new medical device conformity
assessments (44, compared with 26 for July to December 2016) and a 39% increase in changesor recertification (88, compared with 63 for July to December 2016).
· There was also a significant increase in applications for Class 1 medical devices and in vitrodevices (IVDs) on the ARTG (1,545, compared with 1,209 for July to December 2016).
Licensing and manufacturing · There was a significant increase in inspections conducted in this period of Australian
manufacturers (96, compared with 74 in the equivalent period in 2016) and overseasmanufacturers (49, compared with 30 in the equivalent period in 2016). This was due to acombination of factors including increased inspection resources, and performing moreinspections with shorter inspection duration.
· Initial inspections conducted for Australian manufacturers within 3 months of applicationincreased from 75% to 92% when compared with the equivalent period in 2016. Thisimprovement was achieved by ensuring initial inspections were conducted in a timely manner.
Access to unapproved therapeutic goods
Clinical trials · Consultations on the updated Australian Clinical Trials Handbook were completed. This
document is being updated to reflect current practice and improve consistency in guidancedocuments between the TGA and the National Health and Medical Research Council. Onlineportal functionality was improved for Sponsors and a total of 481 new Clinical Trial Notificationswere received.
Medicine and vaccine adverse event reports · We have been working closely with state and territory health departments to monitor the safety
of vaccines included in the National Immunisation Program. This work is reflected in the increasein the number of Adverse Drug Reaction Reports related to vaccines submitted by state andterritory health departments.
Regulatory compliance · A new case prioritisation model and improved process was implemented for the assessment of
referrals for compliance or investigative action. This, along with improved information on targetimports, has strengthened our relationship with the Australian Border Force. Consequently, therehas been a substantial increase in compliance actions during the period (1,530, compared with789 in July to December 2016), including 363,763 units of imported therapeutic goods destroyedas being non-compliant with the regulatory framework.
Recalls · Analysis of outcomes for blood-related recalls for the previous ten reporting periods shows
activity is now lower than previous levels. Outcomes for medicine and medical device-relatedrecalls have remained relatively consistent when compared with previous reporting periods.

Therapeutic Goods Administration
Half Yearly Performance Snapshot: July to Dec 2017 Page 7 of 25
Processing and approval times Processing and approval times are defined as the number of working days from the acceptance of the application until formal notification of decision, unless otherwise specified. These exclude times where we were unable to progress the application until the sponsor provides additional information or payment of fees, unless otherwise specified. Under the Therapeutic Goods Act 1989 (the Act), TGA working days exclude public holidays and weekends.
1. Prescription medicines The framework for prescription medicines includes the following categories which are subject to legislated timeframes:
· Category 1 application: an application to register a new prescription medicine or to make a variation to an existing medicine that involves the evaluation of clinical, pre-clinical or bio-equivalence data. For example, new chemical entities, extensions of indication and new routes of administration.
· Category 2 application: an application accompanied by two independent evaluation reports from comparable overseas regulators in whose jurisdiction the product is approved for the same indication.
· Category 3 application: an application to register or to vary the registration of a prescription medicine where the application does not require the support of clinical, pre-clinical or bio-equivalence data. For example, a change in the site of manufacture, a change to the synthetic route, a change in the product specifications, a change in the steps of manufacture or a change in trade name.
Figure 1: Number of approved Category 1 submissions by type for July to December 2017
Prescription medicine submissions may include a number of applications submitted at the one time. The data presented below relates to the number of submissions as this best reflects the evaluation and decision-making processes.
41
22
1 21
55
21
1
4 Changes to product information(41)New chemical entity (22)
New fixed-dose combination (1)
Extension of indication (21)
New generic medicine (55)
Major variation (21)
Minor variation type G (1)
Minor variation type H (4)

Therapeutic Goods Administration
Half Yearly Performance Snapshot: July to Dec 2017 Page 8 of 25
Table 1 Prescription medicine application approval time for July to December 2017
Approval time (TGA working days)
Application type
Submissions approved
Legislated timeframe
Mean Median Range
A: New chemical entity/New biological entity/biosimilar Category 1 22 255 209 212 152-245 B: New fixed-dose combination Category 1 1 255 178 178 178-178 C: Extension of indication Category 1 21 255 183 189 85-223 D: New generic medicine Category 1 55 255 190 185 123-254 E: Additional trade name (ATN) ATN 41 45 25 27 4-43 F: Major variation Category 1 21 255 195 196 155-254 G: Minor variationa Category 1 1 255 250 250 250-250 Category 3 51 45 37 40 3-45 H: Minor variationb Category 1 4 255 167 168 161-171 Category 3 644 45 32 33 4-59 J: Changes to product information requiring the evaluation of data Category 1 41 255 130 129 7-242
a The type G minor variations differ from type H minor variations in that they result in a new ARTG entry. b The minor variations (type H) included in the table above refer to applications to change the formulation,
composition or design specification or the container for the goods or any other attribute that results in the goods being separate and distinct. These applications are typically ‘Category 3’ changes, unless the supporting scientific package contains non-clinical or clinical data in which case the application is a ‘Category 1’ application.

Therapeutic Goods Administration
Half Yearly Performance Snapshot: July to Dec 2017 Page 9 of 25
Table 2 Priority review determinations granted for July to December 2017
A prescription medicine must have a valid priority review determination before it can be evaluated for registration under the priority review pathway. Since the introduction of the new pathway, eight priority review determinations have been granted.
Table 3 Orphan Drug Designations granted for July to December 2017 under the new eligibility criteria
A prescription medicine must have a valid orphan drug designation to be eligible for the benefit of designation, and a waiver of application and evaluation fees. Since the introduction of the new regulations, five orphan drug designations have been granted. Reporting on orphan drugs reflects only those submitted through the new scheme.
Orphan Drug Applications
Application Type Approved
A: New chemical entity/New biological entity/Fixed dose combination 3 C: Extension of Indications 1 F: Major Variation 1
Priority Review Applications
Application Type Approved
A: New chemical entity/New biological entity 2 C: Extension of Indications 6

Therapeutic Goods Administration
Half Yearly Performance Snapshot: July to Dec 2017 Page 10 of 25
2. Over-the-Counter medicines Over-the-Counter (OTC) medicine applications are categorised as new medicine (N) or change (C) applications and are further categorised by risk (N1 and C1 are lowest risk, N5 and C4 are highest risk).
Application category
Definition
N1 An application submitted as a ‘Clone’. N2 An application which complies with an OTC medicine monograph. N3 New application for a ‘generic’ medicine other than those ‘generic’ applications in
levels N1, N2 or N4. N4 An application for a ‘generic’ medicine where the medicine:
· requires supporting safety and/or efficacy (clinical/toxicological) data or a justification for not providing such data; and/or
· requires a higher level of assessment due to the umbrella branding segment of the product name; and/or
· has not been previously registered as an OTC medicine following down-scheduling.
N5 An application for a new product that is an extension to a ‘generic category’ product or an application for a product containing a new chemical entity as an active ingredient.
CN 'Notification' changes, where their implementation would not impact the quality, safety or efficacy of a medicine. Includes quality and non-quality changes classified as ‘negligible risk’.
C1 Quality and non-quality changes classified as ‘negligible risk’. C2 Quality and non-quality changes classified as ‘low risk’ – no safety and/or efficacy
data required; quality data may be required. C3 Quality and non-quality changes classified as ‘low risk’ – safety and/or efficacy
data required unless justified; quality data may be required. Umbrella branding segment of new name requires a higher level of assessment.
C4 Non-quality changes classified as ‘moderate risk’ – safety and/or efficacy data required unless justified.
Requests for consent under section 14/14A of the Act
Request for consent by the Secretary under sections 14 and 14A of the Act to the import, export or supply of therapeutic goods that do not comply with an applicable standard.

Therapeutic Goods Administration
Half Yearly Performance Snapshot: July to Dec 2017 Page 11 of 25
Table 4 Over-the-Counter medicine application processing time for approved applications for July to December 2017
Total approved
Target approval
time
(days)
Mean Median Range Percentage
within target
New medicine applications
N1 Lower risk
N2
N3
N4
N5 Higher risk
89 45 20 20 0-40 100 3 55 38 39 35-39 100
16 150 74 74 0-129 100 14 170 81 52 0-204 93 4 210 156 154 152-162 100
Change applications
C1 Lower risk
C2
C3
C4 Higher risk
110 20 4 3 0-18 100 167 64 24 23 0-61 100
3 120 35 20 12-72 100 4 170 99 95 46-159 100
Table 5 Other over-the-counter medicine applications
Application type Approved Rejected Total
Change Notifications (CN) 83 N/Aa 83
Requests for consent under section 14/14A of the Act 5 0 5
a Automated validation and approval

Therapeutic Goods Administration
Half Yearly Performance Snapshot: July to Dec 2017 Page 12 of 25
3. Complementary medicines
3.1. Registered complementary medicines
Table 6 Number of approved registered complementary medicine applications
Jul – Dec 2016
Jul – Dec 2017
New registered medicines 4 1 Variation to registered medicines 11 7
3.2. Listed complementary medicines
Table 7 Number of new ingredients permitted for use in listed medicines
Jul – Dec 2016
Jul – Dec 2017
New permitted ingredients 50 42
Table 8 Number of new listed medicines
Jul – Dec 2016
Jul – Dec 2017
New listed medicines 754 916
Table 9 Number of listed medicine reviews by type
Jul – Dec 2016
Jul – Dec 2017
Reviews initiated
Random reviews 0 90 Targeted reviews 235 29 Total 235 119 Reviews completed Random reviews 83 32 Targeted reviews 168 86 Total 251 118
Therapeutic Goods Administration
Half Yearly Performance Snapshot: July to Dec 2017 Page 13 of 25
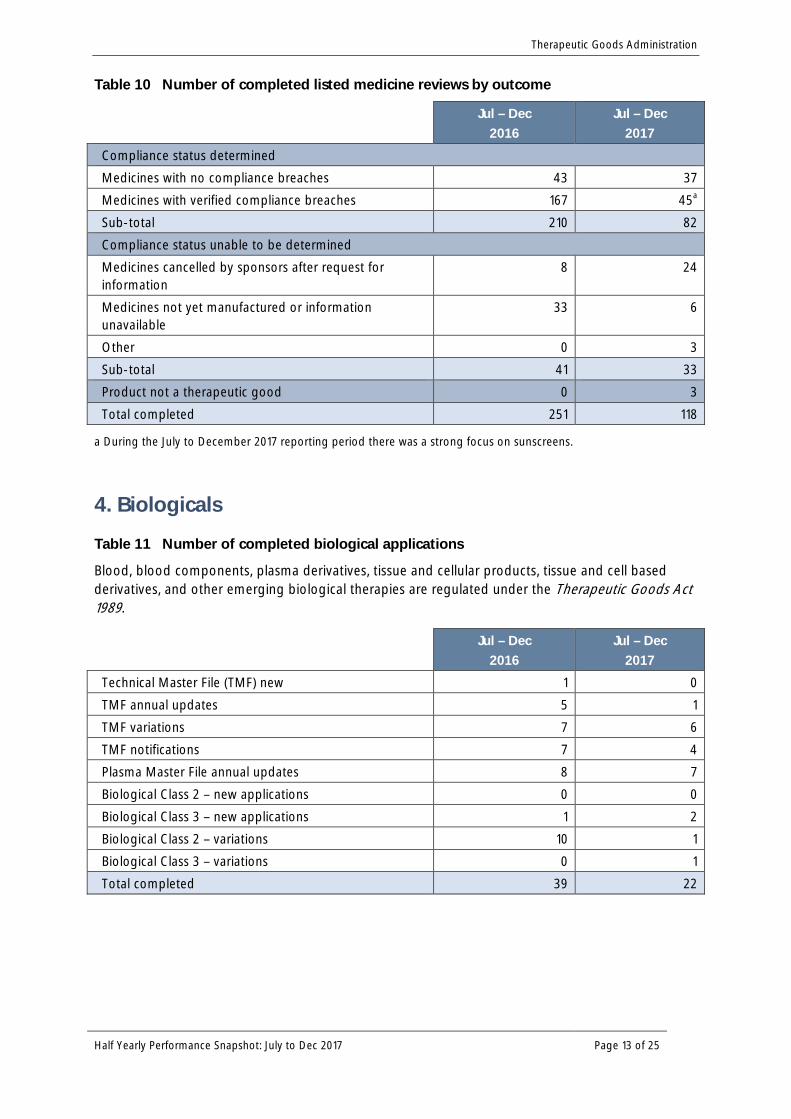
Table 10 Number of completed listed medicine reviews by outcome
Jul – Dec 2016
Jul – Dec 2017
Compliance status determined Medicines with no compliance breaches 43 37 Medicines with verified compliance breaches 167 45a Sub-total 210 82 Compliance status unable to be determined Medicines cancelled by sponsors after request for information
8 24
Medicines not yet manufactured or information unavailable
33 6
Other 0 3 Sub-total 41 33 Product not a therapeutic good 0 3 Total completed 251 118
a During the July to December 2017 reporting period there was a strong focus on sunscreens.
4. Biologicals
Table 11 Number of completed biological applications
Blood, blood components, plasma derivatives, tissue and cellular products, tissue and cell based derivatives, and other emerging biological therapies are regulated under the Therapeutic Goods Act 1989.
Jul – Dec 2016
Jul – Dec 2017
Technical Master File (TMF) new 1 0 TMF annual updates 5 1 TMF variations 7 6 TMF notifications 7 4 Plasma Master File annual updates 8 7 Biological Class 2 – new applications 0 0 Biological Class 3 – new applications 1 2 Biological Class 2 – variations 10 1 Biological Class 3 – variations 0 1 Total completed 39 22

Therapeutic Goods Administration
Half Yearly Performance Snapshot: July to Dec 2017 Page 14 of 25
5. Medical devices The regulatory framework for medical devices spans the life cycle of these products, including conformity assessment, inclusion on the ARTG and post-market monitoring.
Table 12 Number of completed applications and processing time for conformity assessments of medical devices (including in vitro diagnostic medical devices (IVDs))
Jul – Dec 2016
Jul – Dec 2017
New devices Total completed 29 44 Percentage processed within target processing timeframes 100% 100%
Mean TGA processing time (working days) 118 128 Median TGA processing time (working days) 133 183 Changes to recertification
Total completed 63 88 Percentage processed within target processing timeframes 100% 100%
Mean TGA processing time (working days) 100 115 Median TGA processing time (working days) 76 115
Note: The TGA is required to complete conformity assessment applications within 255 working days.
Table 13 Number of completed applications for inclusion of medical devices and IVDs on the ARTG
Jul – Dec 2016
Jul – Dec 2017
Class I medical devices 1,209 1,545 Class I measuring medical devices 25 22 Class I sterile medical devices 136 127 Class IIa medical devices 642 607 Class IIb medical devices 345 328 Class III medical devices 228 189 Class III Joint Reclassification medical devices 114 63 Active Implantable Medical Devices (AIMD) 56 28 Class 1 IVDs 41 45 Class 2 IVDs 38 47 Class 3 IVDs 21 19 Class 4 IVDs 6 10

Therapeutic Goods Administration
Half Yearly Performance Snapshot: July to Dec 2017 Page 15 of 25
Table 14 Number of application audits completed and processing time for medical devices and IVDs for July to December 2017
Total completed Processing times
Mean Median
Medical devices Auto-included applicationsa 1,545 Applications completed without auditb 1,049 4 3 Non-compulsory auditsc 116 59 23 Level 1 compulsory audits 9 37 18 Level 2 compulsory audits 190 94 56 IVDs Auto-included applications a 40 Applications completed without audit b 59 4 2 IVD non-compulsory audit 3 14 17 IVD compulsory audit 19 50 52
a Class I and Class 1 IVDs (with some exception) are automatically included medical devices and are not subject to audits before inclusion. Separate post-market monitoring is undertaken for these goods. b These figures do not include applications for Class I and Class 1 IVD auto-included devices. These applications are completed within 20 working days. c Non-compulsory audit – estimate for the audit processing time does not include applications for reclassification of joint replacement medical devices received during transitional period (Class III Joint Reclassification medical devices), and applications supported by European Community certificates issued by certain notified bodies (for details see Increased application audit requirements for some medical devices applications).
Therapeutic Goods Administration
Half Yearly Performance Snapshot: July to Dec 2017 Page 16 of 25
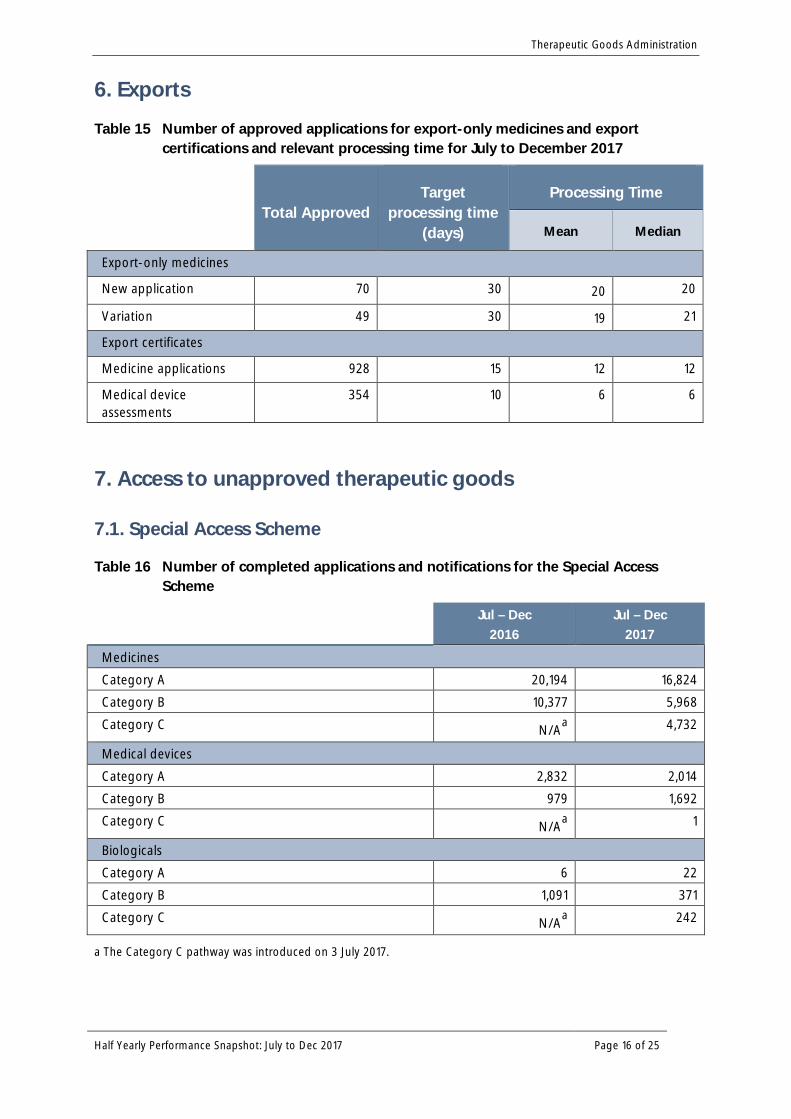
6. Exports
Table 15 Number of approved applications for export-only medicines and export certifications and relevant processing time for July to December 2017
Total Approved Target
processing time (days)
Processing Time
Mean Median
Export-only medicines
New application 70 30 20 20
Variation 49 30 19 21
Export certificates
Medicine applications 928 15 12 12
Medical device assessments
354 10 6 6
7. Access to unapproved therapeutic goods
7.1. Special Access Scheme
Table 16 Number of completed applications and notifications for the Special Access Scheme
Jul – Dec 2016
Jul – Dec 2017
Medicines Category A 20,194 16,824 Category B 10,377 5,968 Category C N/Aa 4,732
Medical devices Category A 2,832 2,014 Category B 979 1,692 Category C N/Aa 1
Biologicals Category A 6 22 Category B 1,091 371 Category C N/Aa 242
a The Category C pathway was introduced on 3 July 2017.

Therapeutic Goods Administration
Half Yearly Performance Snapshot: July to Dec 2017 Page 17 of 25
7.2. Authorised prescribers
Table 17 Number of authorised prescriber approvals for medicines and medical devices
Jul – Dec 2016
Jul – Dec 2017
Medicines 391 355 Medical devices 177 114
7.3. Clinical trials
Table 18 Number of notifications for new clinical trials received by therapeutic good type for July to December 2017
Jul – Dec 2016
Jul – Dec 2017
Medicine only 197 223 Medical device only 71 77 Biological only 3 4 Medicine and medical device 127 171 Medical device and biological 1 1 Medicine and biological 11 2 Medicine, medical device and biological 7 3 Total 417 481
Table 19 Number of notifications for new clinical trials received by phases for July to December 2017
Jul – Dec 2016
Jul – Dec 2017
Phase 1 72 120 Phase 1 and 2 in combination 11 24 Phase 2 82 89 Phase 2 and 3 in combination 4 6 Phase 3 113 126 Phase 4 41 32 Bioavailability / equivalence 13 5 Other phases in combination 25 5 Device only 56 74
Note: A trial may be notified with more than one phase type.

Therapeutic Goods Administration
Half Yearly Performance Snapshot: July to Dec 2017 Page 18 of 25
8. Licensing and manufacturing
Number of manufacturing inspections by outcome
Table 20A Medicines and Blood, Tissue and Cellular Therapies
Jul – Dec 2016
Jul – Dec 2017
Outcomes of inspections of Australian manufacturers Number of inspections conducted 74 96 Satisfactory compliance (of completed inspections) a 82% 89% Marginal compliance (of completed inspections) a 16% 10% Unacceptable (of completed inspections) a 2% 1%
Close-out in progress 16% 11%
Processing time Initial inspections conducted within 3 months of application 75% 92% Re-inspections conducted within 6 months of due date 70% 68% Outcomes of inspections of overseas manufacturers Number of inspections conducted 30 49 Satisfactory compliance (of completed inspections) a 96% 83% Marginal compliance (of completed inspections) a 4% 13% Unacceptable (of completed inspections) a 0% 4%
Close-out in progress 17% 6% Processing time Initial certification inspections conducted within 6 months of application
50% 53%
Certification re-inspections conducted within 6 months of due date
58% 60%
a Compliance data for this period is aligned with data reported for the 2016 Jul-Dec period and excludes ‘Close-out in progress’ in calculation of percentages i.e. the percentages reported are limited to those inspections that are completed.
Applicants often submit applications for GMP licences and certifications before finalising all of their systems and processes. TGA works with the applicant to ensure an inspection is not conducted before the manufacturing facility is ready. It is therefore not uncommon for inspections to be conducted later than the target dates.
Therapeutic Goods Administration
Half Yearly Performance Snapshot: July to Dec 2017 Page 19 of 25
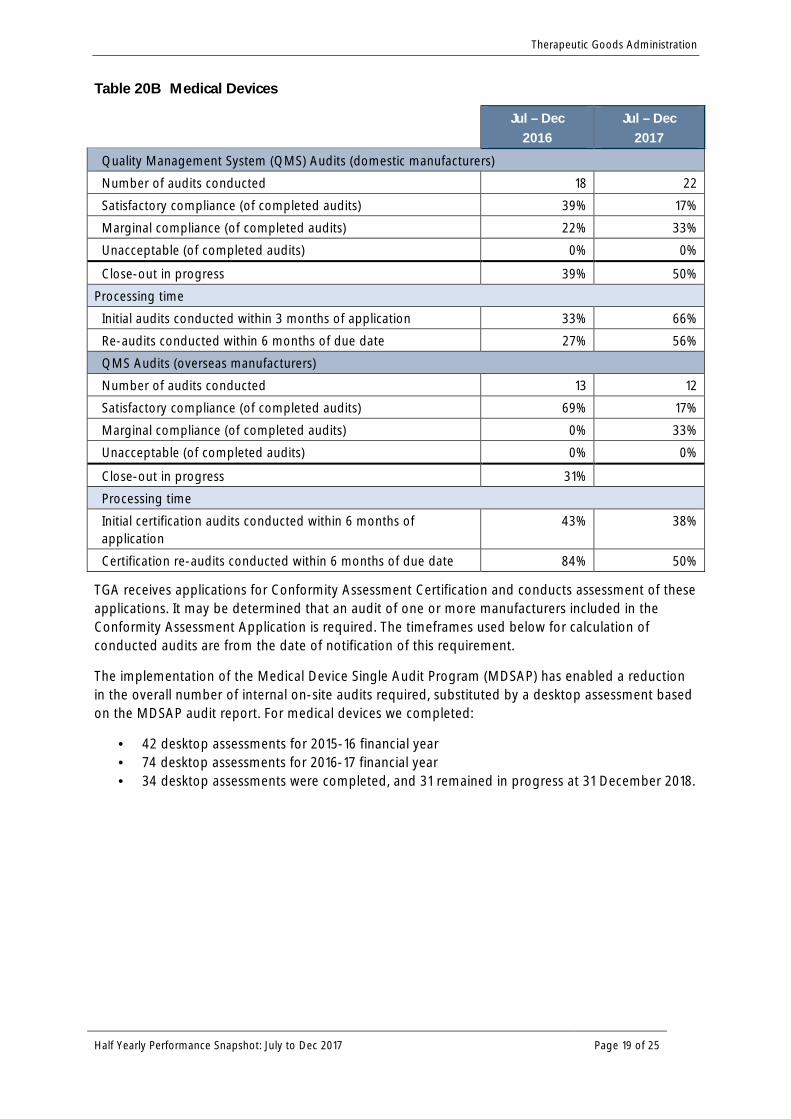
Table 20B Medical Devices
Jul – Dec 2016
Jul – Dec 2017
Quality Management System (QMS) Audits (domestic manufacturers) Number of audits conducted 18 22 Satisfactory compliance (of completed audits) 39% 17% Marginal compliance (of completed audits) 22% 33% Unacceptable (of completed audits) 0% 0%
Close-out in progress 39% 50% Processing time
Initial audits conducted within 3 months of application 33% 66% Re-audits conducted within 6 months of due date 27% 56% QMS Audits (overseas manufacturers) Number of audits conducted 13 12 Satisfactory compliance (of completed audits) 69% 17% Marginal compliance (of completed audits) 0% 33% Unacceptable (of completed audits) 0% 0%
Close-out in progress 31% Processing time Initial certification audits conducted within 6 months of application
43% 38%
Certification re-audits conducted within 6 months of due date 84% 50%
TGA receives applications for Conformity Assessment Certification and conducts assessment of these applications. It may be determined that an audit of one or more manufacturers included in the Conformity Assessment Application is required. The timeframes used below for calculation of conducted audits are from the date of notification of this requirement.
The implementation of the Medical Device Single Audit Program (MDSAP) has enabled a reduction in the overall number of internal on-site audits required, substituted by a desktop assessment based on the MDSAP audit report. For medical devices we completed:
· 42 desktop assessments for 2015-16 financial year · 74 desktop assessments for 2016-17 financial year · 34 desktop assessments were completed, and 31 remained in progress at 31 December 2018.
Therapeutic Goods Administration
Half Yearly Performance Snapshot: July to Dec 2017 Page 20 of 25
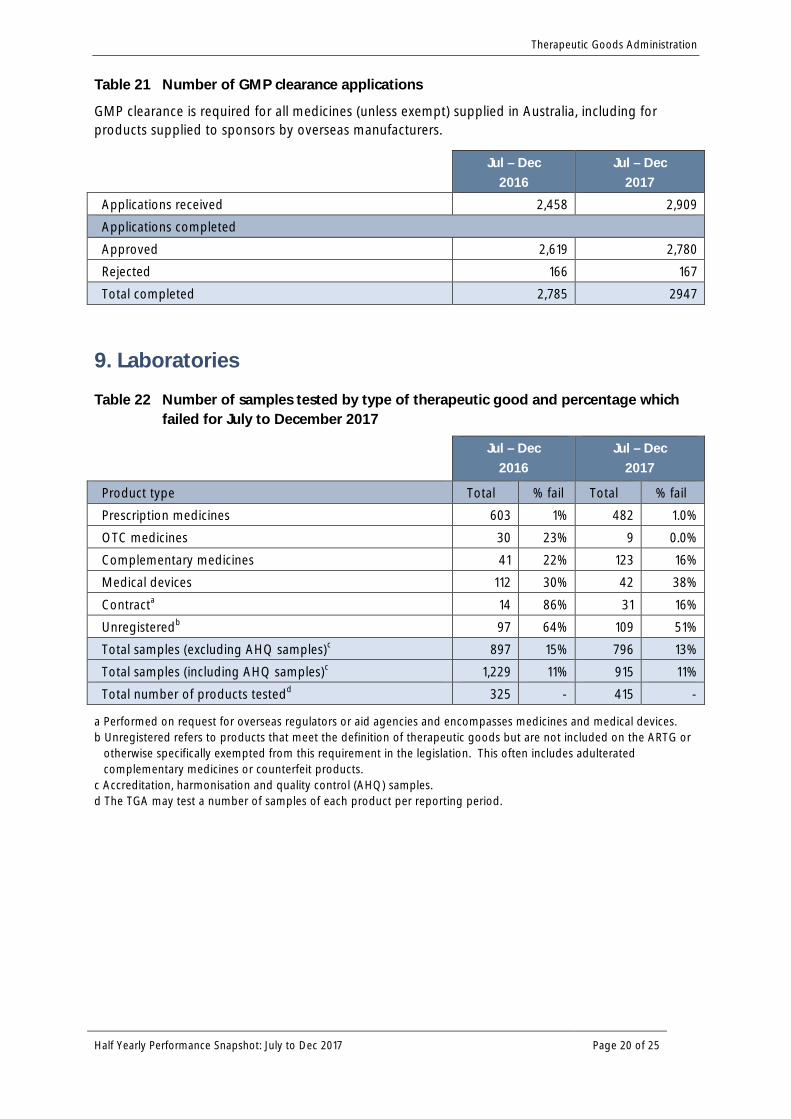
Table 21 Number of GMP clearance applications
GMP clearance is required for all medicines (unless exempt) supplied in Australia, including for products supplied to sponsors by overseas manufacturers.
Jul – Dec 2016
Jul – Dec 2017
Applications received 2,458 2,909 Applications completed Approved 2,619 2,780 Rejected 166 167 Total completed 2,785 2947
9. Laboratories
Table 22 Number of samples tested by type of therapeutic good and percentage which failed for July to December 2017
Jul – Dec
2016 Jul – Dec
2017
Product type Total % fail Total % fail Prescription medicines 603 1% 482 1.0% OTC medicines 30 23% 9 0.0% Complementary medicines 41 22% 123 16% Medical devices 112 30% 42 38% Contracta 14 86% 31 16% Unregisteredb 97 64% 109 51% Total samples (excluding AHQ samples)c 897 15% 796 13% Total samples (including AHQ samples)c 1,229 11% 915 11% Total number of products testedd 325 - 415 -
a Performed on request for overseas regulators or aid agencies and encompasses medicines and medical devices. b Unregistered refers to products that meet the definition of therapeutic goods but are not included on the ARTG or
otherwise specifically exempted from this requirement in the legislation. This often includes adulterated complementary medicines or counterfeit products.
c Accreditation, harmonisation and quality control (AHQ) samples. d The TGA may test a number of samples of each product per reporting period.

Therapeutic Goods Administration
Half Yearly Performance Snapshot: July to Dec 2017 Page 21 of 25
10. Medicine and Vaccine Adverse Event Reporting
Table 23 Source of notifications of medicine and vaccine adverse reaction
Jul – Dec 2016
Jul – Dec 2017
Reports with clear causality, by reporter Hospitals 919 808 Companies 4,952 4,916 General practitioners 270 262 Specialists 178 89 Pharmacists 489 544 Members of the public (consumers) 493 508 Nurses, dentists, complementary healthcare practitioners 74 94 State/Territory Health departments 1,264 1,485 Unregistered online reporters 64 10
Reports rejected or without clear causality 1,165 1,072 Total received 9,868 9,788 Mean number of reports received weekly 379 376 Vaccine reports included in this table 1,637 1,779
11. Medical device incident reports
Table 24 Number of completed medical device incident reports and processing time
Processing time is defined as the number of working days from receipt of the notification until the incident has been investigated and resolved.
The target timeframe for processing of medical device incident reports is 90 working days.
Jul – Dec 2016
Jul – Dec 2017
Reports completed 2,100 2,771 Mean TGA processing time 7 15 Percentage processed within target timeframe 94% 95%

Therapeutic Goods Administration
Half Yearly Performance Snapshot: July to Dec 2017 Page 22 of 25
12. Regulatory compliance Data in relation to an investigation may appear in multiple tables as a compliance matter may be captured under several categories.
Table 25 Number of products investigated for compliance issues by product type
Jul – Dec
2016 Jul – Dec
2017
Complementary and homeopathic medicines 247 335 Prescription medicines 1,748 1,528 Medical devices 46 108 OTC medicines 12 56 Biological products 14 12 Other 26 47 Total 2,093 2,086
Table 26 Number of completed regulatory compliance investigations by final action taken
Jul – Dec 2016
Jul – Dec 2017
Warneda 449 1,101 No offence detected 20 61 Goods released under the Personal Importation Scheme 293 309 Referred to another agency or department outside Health
4 11
Referred to another Branch within the TGA 4 N/Ab Filed for intelligence purposes 12 41 Finalised in a linked file 6 3 Import treated as abandoned goods 0 1 Recall of goods 1 0 Matters referred to the Commonwealth Director of Public Prosecutions
0 3
Total completed 789 1,530
a The category ‘warned’ can include goods destroyed as prohibited imports and goods re-exported. In the period 870 certificates were issued for the destruction of 363,763 units.
b The category ‘referred to another Branch within the TGA’ is no longer being included in this report.
Therapeutic Goods Administration
Half Yearly Performance Snapshot: July to Dec 2017 Page 23 of 25
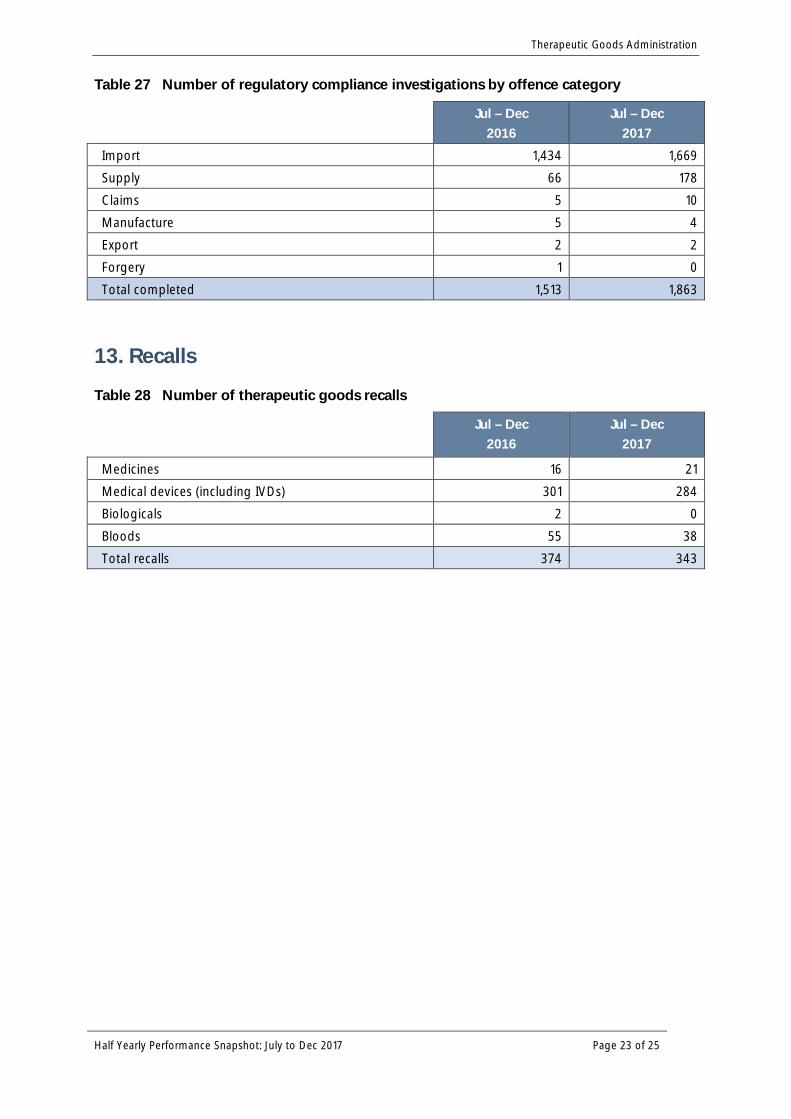
Table 27 Number of regulatory compliance investigations by offence category
Jul – Dec 2016
Jul – Dec 2017
Import 1,434 1,669 Supply 66 178 Claims 5 10 Manufacture 5 4 Export 2 2 Forgery 1 0 Total completed 1,513 1,863
13. Recalls
Table 28 Number of therapeutic goods recalls
Jul – Dec
2016 Jul – Dec
2017
Medicines 16 21 Medical devices (including IVDs) 301 284 Biologicals 2 0 Bloods 55 38 Total recalls 374 343

Therapeutic Goods Administration
Half Yearly Performance Snapshot: July to Dec 2017 Page 24 of 25
Version history
Version Description of change Author Effective date
V1.0 Original publication Reporting and Collaboration Services
03/04/2018

Therapeutic Goods Administration PO Box 100 Woden ACT 2606 Australia
Email: [email protected] Phone: 1800 020 653 Fax: 02 6203 1605 https://www.tga.gov.au
Reference/Publication D18-10341621


![RUNO Half Yearly Reporting TEMPLATE 4.3 [LIBERIA] PROJECT ...moj.gov.lr/data/uploads/downloads/half-year... · RUNO Half Yearly Reporting TEMPLATE 4.3 [LIBERIA] PROJECT HALF YEARLY](https://static.fdocuments.us/doc/165x107/5fb2e6765197404e462e00b5/runo-half-yearly-reporting-template-43-liberia-project-mojgovlrdatauploadsdownloadshalf-year.jpg)