MACQUARIE CONNECTIONS MACQUARIE SECURITIES (AUSTRALIA) LIMITED

Half Year Results.
27th February 2018
2018.
Macquarie Telecom Group
Key Business Highlights.
| Investor Presentation
2
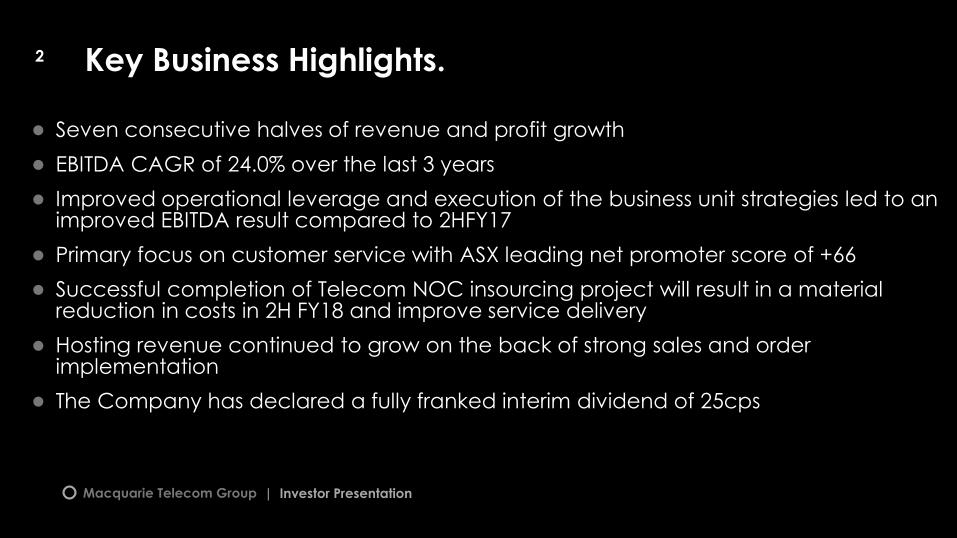
● Seven consecutive halves of revenue and profit growth
● EBITDA CAGR of 24.0% over the last 3 years
● Improved operational leverage and execution of the business unit strategies led to an improved EBITDA result compared to 2HFY17
● Primary focus on customer service with ASX leading net promoter score of +66
● Successful completion of Telecom NOC insourcing project will result in a material reduction in costs in 2H FY18 and improve service delivery
● Hosting revenue continued to grow on the back of strong sales and order implementation
● The Company has declared a fully franked interim dividend of 25cps
2
Macquarie Telecom Group
Business Summary.
| Investor Presentation
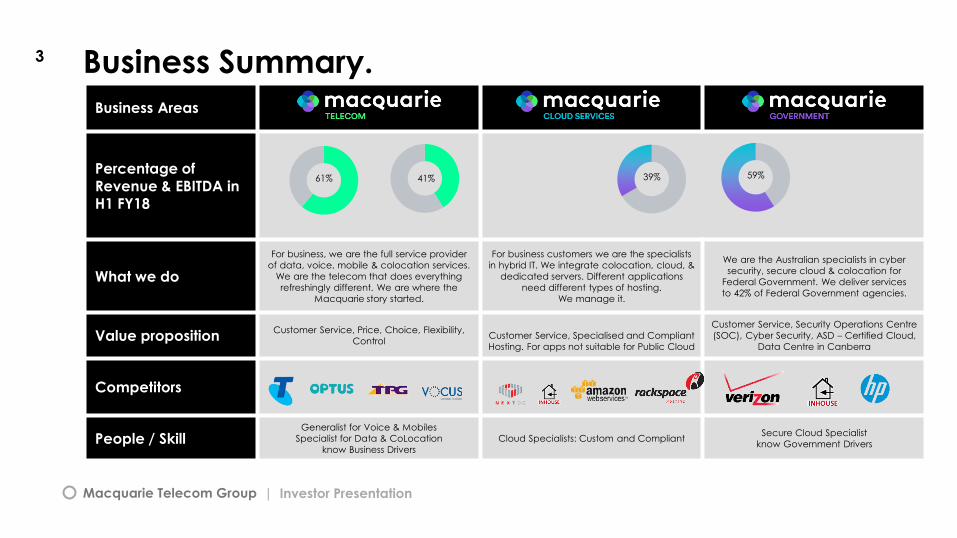
Business Areas
Percentage of Revenue & EBITDA in H1 FY18
What we do
For business, we are the full service provider
of data, voice, mobile & colocation services.
We are the telecom that does everything
refreshingly different. We are where the
Macquarie story started.
For business customers we are the specialists
in hybrid IT. We integrate colocation, cloud, &
dedicated servers. Different applications
need different types of hosting.
We manage it.
We are the Australian specialists in cyber
security, secure cloud & colocation for
Federal Government. We deliver services
to 42% of Federal Government agencies.
Value propositionCustomer Service, Price, Choice, Flexibility,
ControlCustomer Service, Specialised and Compliant
Hosting. For apps not suitable for Public Cloud
Customer Service, Security Operations Centre
(SOC), Cyber Security, ASD – Certified Cloud,
Data Centre in Canberra
Competitors
People / SkillGeneralist for Voice & Mobiles
Specialist for Data & CoLocation
know Business Drivers
Cloud Specialists: Custom and CompliantSecure Cloud Specialist
know Government Drivers
61% 39%41% 59%
3
Macquarie Telecom Group | Investor Presentation
A Differentiated Offering.
Macquarie Telecom Group
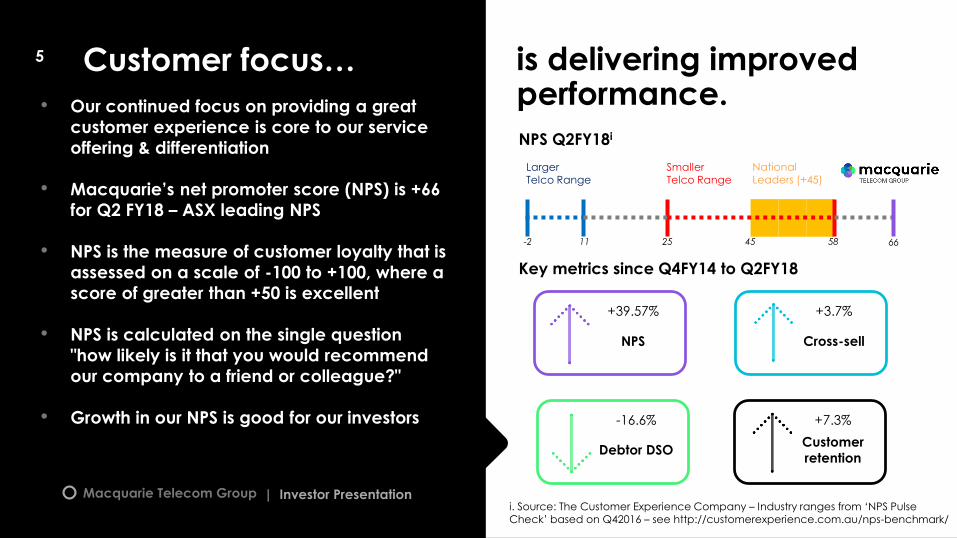
Customer focus… is delivering improved performance.• Our continued focus on providing a great
customer experience is core to our service
offering & differentiation
• Macquarie’s net promoter score (NPS) is +66
for Q2 FY18 – ASX leading NPS
• NPS is the measure of customer loyalty that is
assessed on a scale of -100 to +100, where a
score of greater than +50 is excellent
• NPS is calculated on the single question
"how likely is it that you would recommend
our company to a friend or colleague?"
• Growth in our NPS is good for our investors
| Investor Presentation
NPS Q2FY18i
i. Source: The Customer Experience Company – Industry ranges from ‘NPS PulseCheck’ based on Q42016 – see http://customerexperience.com.au/nps-benchmark/
11-2 25 58 66
Smaller Telco Range
Larger Telco Range
+39.57%
NPS
+3.7%
Cross-sell
-16.6%
Debtor DSO
+7.3%
Customer
retention
Key metrics since Q4FY14 to Q2FY18
45
National Leaders (+45)
5
Macquarie Telecom Group
Quality Infrastructure.
Macquarie Telecom Group
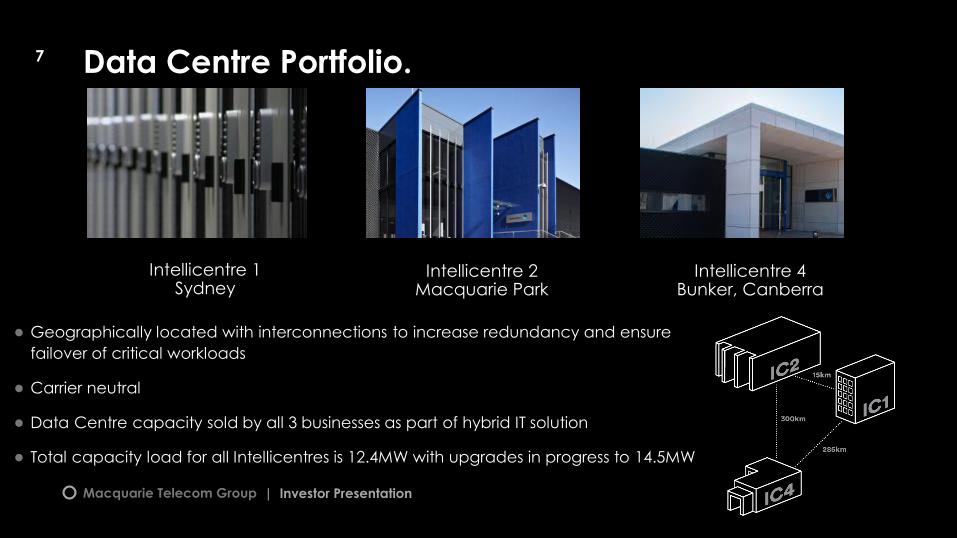
Data Centre Portfolio.
● Geographically located with interconnections to increase redundancy and ensure
failover of critical workloads
● Carrier neutral
● Data Centre capacity sold by all 3 businesses as part of hybrid IT solution
● Total capacity load for all Intellicentres is 12.4MW with upgrades in progress to 14.5MW
Intellicentre 1Sydney
Intellicentre 2Macquarie Park
Intellicentre 4 Bunker, Canberra
| Investor Presentation
7

Macquarie Telecom Group
Intellicentre 2 Utilisation
Data Hall 4 commissioned in September 2017
Data Hall 2 is 3/4 Full
Data Hall 1 is Full
Mechanical Electrical Plant
Data Hall 3
Stage 2 of the Fortune 100
customer has started with the
project to be completed in Q3
FY18
| Investor Presentation
8
Our flagship Intellicentre 2 data centre has achieved strong utilisation
Macquarie Telecom Group
IC2 Analysis
| Investor Presentation
• Intellicentre 2 estimated to achieve an average of $4.8m per MW in annualised revenue by FY19 as new larger customers turn up capacity
• Colocation sold usually as part of hybrid IT solution with managed cloud
- Colocation represents around 14% of total company revenue
9
• Based on demand, over the next 3 months the business will decide on whether to build or buy data centre capacity. The potential for investment in Intellicentre 3 will increase the requirement for capex that will primarily impact FY19. Completion of the project is expected to be 2H CY19.
Macquarie Telecom Group
Financials.
| Investor Presentation

Macquarie Telecom Group
Financial Results.
• Inter-segment revenue relates to services provided by the Hosting segment to the Telecom segment, eliminated on consolidation
11
| Investor Presentation
Macquarie Telecom Group
Group Financial Performance.
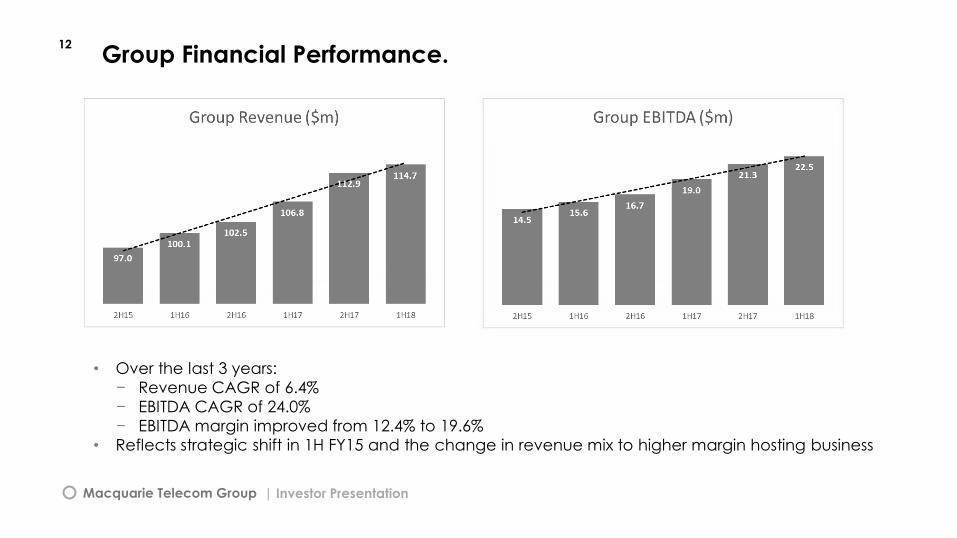
• Over the last 3 years:
− Revenue CAGR of 6.4%
− EBITDA CAGR of 24.0%
− EBITDA margin improved from 12.4% to 19.6%
• Reflects strategic shift in 1H FY15 and the change in revenue mix to higher margin hosting business
12
| Investor Presentation
Macquarie Telecom Group
Financial Performance – Hosting
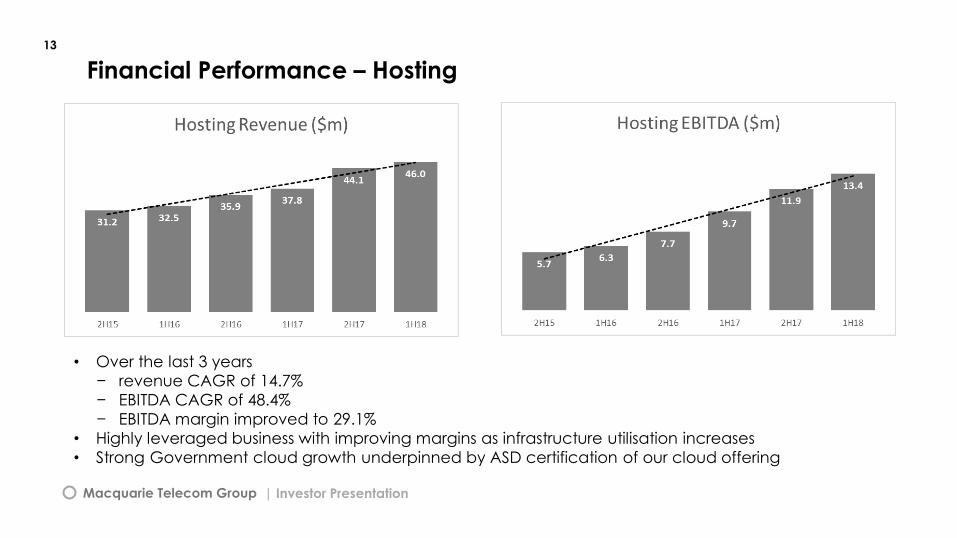
• Over the last 3 years
− revenue CAGR of 14.7%
− EBITDA CAGR of 48.4%
− EBITDA margin improved to 29.1%
• Highly leveraged business with improving margins as infrastructure utilisation increases
• Strong Government cloud growth underpinned by ASD certification of our cloud offering
13
| Investor Presentation
Macquarie Telecom Group
Financial Performance - Telecom
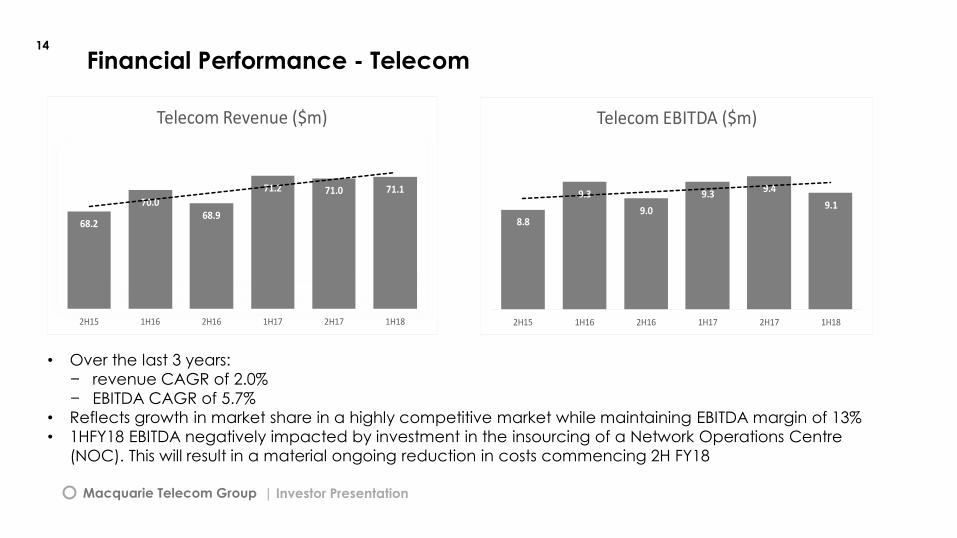
• Over the last 3 years:
− revenue CAGR of 2.0%
− EBITDA CAGR of 5.7%
• Reflects growth in market share in a highly competitive market while maintaining EBITDA margin of 13%
• 1HFY18 EBITDA negatively impacted by investment in the insourcing of a Network Operations Centre
(NOC). This will result in a material ongoing reduction in costs commencing 2H FY18
14
68.2
70.068.9
71.2 71.0 71.1
2H15 1H16 2H16 1H17 2H17 1H18
Telecom Revenue ($m)
8.8
9.3
9.0
9.39.4
9.1
2H15 1H16 2H16 1H17 2H17 1H18
Telecom EBITDA ($m)
| Investor Presentation
Macquarie Telecom Group Investor Presentation
15
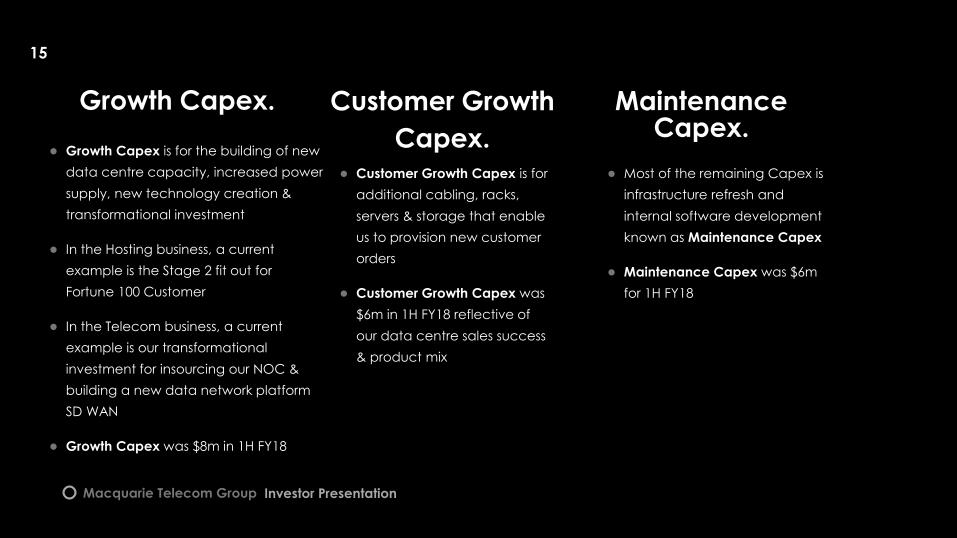
● Growth Capex is for the building of new
data centre capacity, increased power
supply, new technology creation &
transformational investment
● In the Hosting business, a current
example is the Stage 2 fit out for
Fortune 100 Customer
● In the Telecom business, a current
example is our transformational
investment for insourcing our NOC &
building a new data network platform
SD WAN
● Growth Capex was $8m in 1H FY18
● Customer Growth Capex is for
additional cabling, racks,
servers & storage that enable
us to provision new customer
orders
● Customer Growth Capex was
$6m in 1H FY18 reflective of
our data centre sales success
& product mix
Maintenance Capex.
Growth Capex. Customer Growth
Capex.● Most of the remaining Capex is
infrastructure refresh and
internal software development
known as Maintenance Capex
● Maintenance Capex was $6m
for 1H FY18
Macquarie Telecom Group
Balance Sheet &Cash Flows.
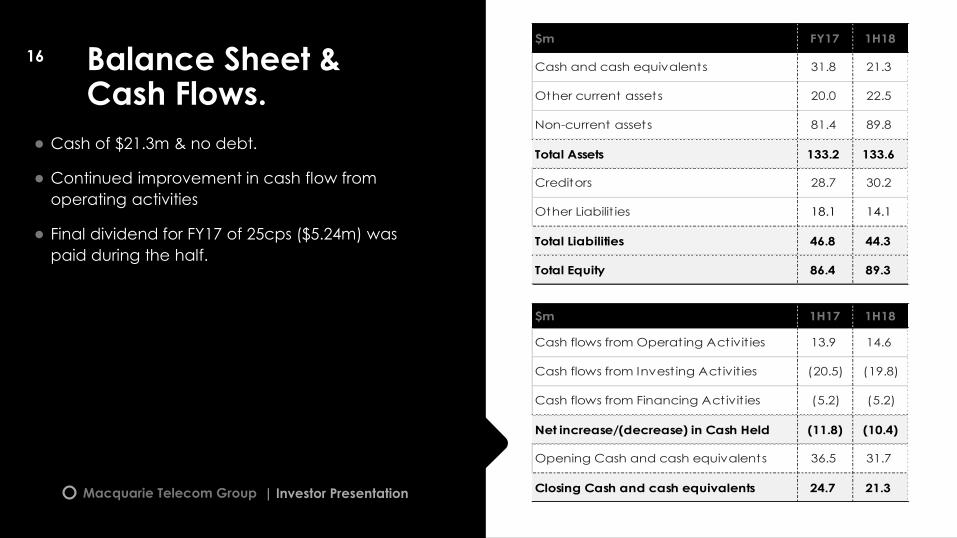
● Cash of $21.3m & no debt.
● Continued improvement in cash flow from
operating activities
● Final dividend for FY17 of 25cps ($5.24m) was
paid during the half.
16
| Investor Presentation
16
$m 1H17 1H18
Cash flows from Operating Activit ies 13.9 14.6
Cash flows from Invest ing Activit ies (20.5) (19.8)
Cash flows from Financing Activit ies (5.2) (5.2)
Net increase/(decrease) in Cash Held (11.8) (10.4)
Opening Cash and cash equivalents 36.5 31.7
Closing Cash and cash equivalents 24.7 21.3
$m FY17 1H18
Cash and cash equivalents 31.8 21.3
Other current assets 20.0 22.5
Non-current assets 81.4 89.8
Total Assets 133.2 133.6
Creditors 28.7 30.2
Other Liabilit ies 18.1 14.1
Total Liabilities 46.8 44.3
Total Equity 86.4 89.3
Macquarie Telecom Group
Outlook
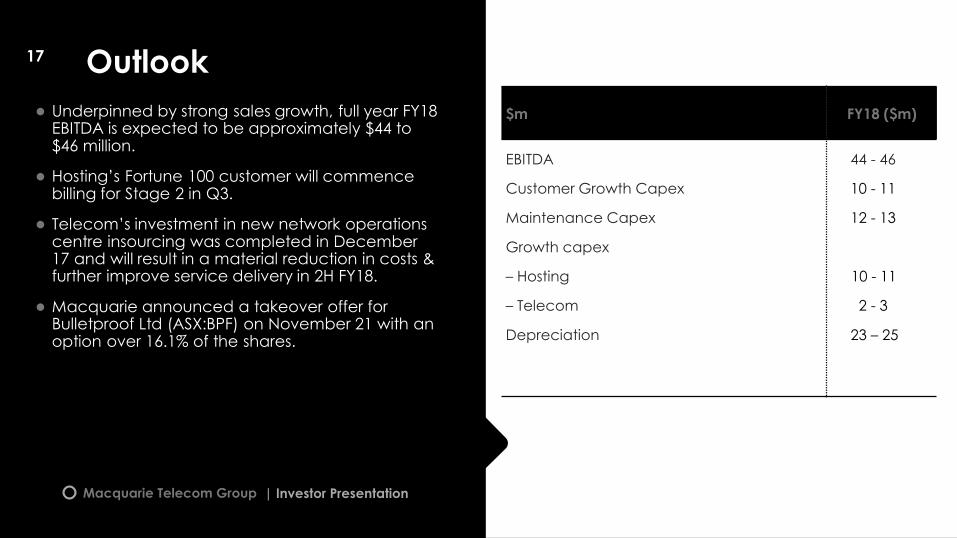
● Underpinned by strong sales growth, full year FY18 EBITDA is expected to be approximately $44 to $46 million.
● Hosting’s Fortune 100 customer will commence billing for Stage 2 in Q3.
● Telecom’s investment in new network operations centre insourcing was completed in December 17 and will result in a material reduction in costs & further improve service delivery in 2H FY18.
● Macquarie announced a takeover offer for Bulletproof Ltd (ASX:BPF) on November 21 with an option over 16.1% of the shares.
17
| Investor Presentation
$m FY18 ($m)
EBITDA
Customer Growth Capex
Maintenance Capex
Growth capex
– Hosting
– Telecom
Depreciation
44 - 46
10 - 11
12 - 13
10 - 11
2 - 3
23 – 25
17
Macquarie Telecom Group
Disclaimer.
| Investor Presentation
No express or implied warranty is given as to the accuracy or completeness of theinformation in this document or any corresponding presentation. This document maycontain forward looking statements that, while used in good faith, reflect MacquarieTelecom Group Limited’s current intention, plans, expectations, assumptions and beliefsabout future events and are subject to risks, uncertainties and other factors, many ofwhich are outside the control of Macquarie Telecom Group Limited.
Factors that could cause actual results to differ materially from the expectationsexpressed or implied in the forward-looking statements include known and unknownrisks. Because actual results could differ materially from Macquarie Telecom GroupLimited’s current intentions, plans, expectations, assumptions and beliefs about thefuture, disclosures herein should not be relied upon as advice to investors or potentialinvestors and should be viewed with caution.