Halcyon Report — A Deeper Dive: Social Enterprise...
48
Social Enterprise Ecosystems in the U.S. DIVE Volume 2 | SocEntCity.org A DEEPER
Transcript of Halcyon Report — A Deeper Dive: Social Enterprise...

Social Enterprise Ecosystems in the U.S.DIVE
Volume 2 | SocEntCity.org
A DEEPER

NOUN:
SOCIAL ENTREPRENEURAn entrepreneur applying business principles to achieve intentional social impact, measuring and transparently reporting outcomes towards this goal.

EX
EC
. S
UM
MA
RY
FR
AM
EW
OR
KIN
TR
OM
ET
HO
DO
LOG
YIN
DE
XN
EX
T S
TE
PS
TABLE OF CONTENTS
EXECUTIVE SUMMARY 2 SOCIAL ENTERPRISE TODAY 2
THE FOUR PILLARS 3
NEW THIS YEAR 4
CITY RANKINGS 5
WHO WE ARE 6
WHO CAN USE THIS STUDY 7
INTRODUCTION 8 MEASURING SOCIAL
ENTERPRISE ECOSYSTEMS 8
BEGINNER’S GUIDE 9
IN THEIR WORDS 10
FRAMEWORK 12 FUNDING 12
HUMAN CAPITAL 18
QUALITY OF LIFE 24
REGULATION & RECEPTIVITY 30
METHODOLOGY 36 OUR APPROACH TO RANKING 36
CITY RANKING WITH FOUR PILLARS 37
INDEX 38 DEMOGRAPHICS OF RESPONDENTS 38
DEMOGRAPHICS OF
RESPONDENT VENTURES 39
TOP 21 RESPONDING CITIES 40
NEXT STEPS 42 JOIN THE CONVERSATION 42
ACKNOWLEDGMENTS 4 3
BIBLIOGRAPHY 4 4

2 SocEntCity.org
EXECUTIVE SUMMARY
SOCIAL ENTERPRISE HAS THE POTENTIAL TO TRANSFORM THE WORLD Look around the world today. What do you see? Many people would say we live in challenging times. Social entrepreneurs would say we live in a time with tremendous opportunities. These innovators, who skillfully blend profit and purpose, are redefining how we look at innovation in the 21st century. Yet, for all the buzz around social enterprise, the field has quite a ways to go to adequately support the founders building the next generation of solutions.
One year ago, we published the first version of this report and built a framework to measure social enterprise ecosystems in the United States. We sent out surveys and heard from almost 400 social entrepreneurs. We then distilled four pillars as the framework for a social enterprise ecosystem: funding, human capital, quality of life and regulation and receptivity.
— CENTER FOR THE ADVANCEMENT OF SOCIAL ENTREPRENEURSHIP, DUKE UNIVERSITY
“If social entrepreneurship is to have lasting, positive social impact, proponents will have to be strategic in building a
strong community of practice and knowledge, and in
strengthening the ecosystem that supports practitioners.”

3
EXECUTIVE SUMMARY
EX
EC
. S
UM
MA
RY
FR
AM
EW
OR
KIN
TR
OM
ET
HO
DO
LOG
YIN
DE
XN
EX
T S
TE
PS
SOCIAL ENTERPRISE ECOSYSTEM FRAMEWORK THE FOUR PILLARS
1. FUNDINGThe fuel of the ecosystem: sources of capital including seed funding, grants and philanthropic and venture capital (representing both public and private sources).
2. HUMAN CAPITALThe engine of the ecosystem: finding great people – as team members, mentors, employees, and advisors.
4. REGULATION & RECEPTIVITYThe operational environment of the ecosystem: regulations, market receptivity and even perception and attitudes towards a social enterprise can create an environment that either nurtures or stifles social enterprise.
3. QUALITY OF LIFEThe fabric of the ecosystem: everything from diversity, cost of living, and transportation that determines an entrepreneur’s experience living in a region.

4 SocEntCity.org
EXECUTIVE SUMMARY
SocEntCityNEW THIS YEAR
We are proud to present the second annual report on social enterprise ecosystems. Building off last year’s work and the feedback we received, we sought to deepen and expand our analysis of social enterprise ecosystems across the United States. New features this year include:
2017: YEAR OF THE SPARKS
In collaboration with Deloitte, we conducted in-depth interviews to develop Sparks—key case studies on leading practices for improving your ecosystem.
We highlight a Spark in each of the four pillar sections, but visit SocEntCity.org to see the full list and to share the report with others!
Updated rankings of the best social enterprise ecosystems in the United States
An expanded focus from nine to 21 cities in the analysis
More robust variables built into the model to track these dynamic ecosystems

5
EXECUTIVE SUMMARY
EX
EC
. S
UM
MA
RY
FR
AM
EW
OR
KIN
TR
OM
ET
HO
DO
LOG
YIN
DE
XN
EX
T S
TE
PS
2017 CITY RANKINGS
Which cities have the strongest social enterprise ecosystem? Based on the four pillars, we are able to rank the top 21 responding cities in our survey. For a deeper dive into the components of this composite score, visit page 37.
1. BOSTON, MA (4)
2. SAN FRANCISCO, CA (2)
3. WASHINGTON, D.C. (1)
4. NEW YORK , NY (6)
5. CHICAGO, IL (7 )
6. AUSTIN, T X (3)
7. DENVER, CO
8. MINNEAPOLIS, MN
9. SEAT TLE, WA (5)
10. LOS ANGELES, CA (8)
11. SAN DIEGO, CA
12. PHILADELPHIA, PA
13. DALLAS, T X
14. ATLANTA, GA
15. BALTIMORE, MD
16. MIAMI, FL
17. RALEIGH, NC
18. PHOENIX , AZ
19. PIT TSBURGH, PA
20. DETROIT, MI
21. NEW ORLEANS, LA
(#) = 2016 CIT Y RANKING

6 SocEntCity.org
EXECUTIVE SUMMARY
WHO WE ARE
Halcyon Incubator, a program of Halcyon, is committed to solving 21st-century challenges throughout the nation and the world. By helping social entrepreneurs transform audacious ideas into scalable and sustainable ventures, Halcyon Incubator acts as a catalyst for measurable social outcomes.
Capital One is an information-based technology company focused on innovation, data-driven solutions and diverse thinking. Using the cloud, RESTful APIs, big data, open source, and machine learning, our teams are empowered to design and engineer intuitive products so our customers can easily manage their money, wherever they are.
Deloitte provides industry-leading audit, consulting, tax, and advisory services to many of the world’s most admired brands, including 80 percent of the Fortune 500 and more than 6,000 private and middle market companies. Our success depends on cultivating and celebrating diverse skill sets, backgrounds, and values, and we enable leadership throughout our communities through pro-bono and volunteer work that leverages our skills and experience to help others achieve their goals.
The Robert H. Smith School of Business is an internationally recognized leader in management education and research. One of 12 colleges and schools at the University of Maryland, College Park, the Smith School offers undergraduate, full-time and part-time MBA, executive MBA, online MBA, specialty masters, PhD and executive education programs.
We believe that a better understanding of the social enterprise ecosystem is necessary to forge, grow, and sustain a world where we can together solve society’s toughest problems, collectively and creatively. Building on this spirit, we are thrilled to present this report together.

7
EXECUTIVE SUMMARY
EX
EC
. S
UM
MA
RY
FR
AM
EW
OR
KIN
TR
OM
ET
HO
DO
LOG
YIN
DE
XN
EX
T S
TE
PS
WHO CAN USE THIS STUDY
INVESTORS
Learn more about the unique challenges and great potential of social entrepreneurship as you play a critical role in growing your local impact investing ecosystem.
IMPACT ENABLERS
Foundations, incubators, universities and other relevant organizations – better understand your role in how you can best help social ventures succeed.
POLICYMAKERS
Understand the conditions under which social entrepreneurs succeed and find recommendations for how to strengthen your local social enterprise ecosystem.
SOCIAL ENTREPRENEURS
Discover insights and learn more about which ecosystem is the best fit for your social enterprise.
BUSINESS LEADERS
As profit and purpose become increasingly intertwined, find out how to engage with the up and coming startups that will define the impact economy.
All stakeholders play crucial roles in sustaining a strong social enterprise ecosystem. For more information about how you can grow a more resourceful and supportive ecosystem, check out the Sparks at SocEntCity.org.
8 SocEntCity.org
MEASURING SOCIAL ENTERPRISE ECOSYSTEMSTHE STARTING LINE:
Survey Responses: Building on last year’s survey and the four pillars in the framework, we surveyed 416 social entrepreneurs from across the country to learn about their social enterprise ecosystem.
Small Groups: We consulted with dozens of experts and thought leaders in the social enterprise space who helped us design the survey questions and directed our city ranking study.
Public Data: The 2017 city rankings are based on an expanded set of public data to more robustly measure how social enterprise ecosystems support their entrepreneurs.
Among the 416 social entrepreneurs, 264 are either founders or on the executive team
of a social enterprise.
INTRODUCTION

INTRODUCTION
9
EX
EC
. S
UM
MA
RY
FR
AM
EW
OR
KIN
TR
OM
ET
HO
DO
LOG
YIN
DE
XN
EX
T S
TE
PS
NOW, LET’S EMBARK ON THE JOURNEY TO UNCOVER THE OPPORTUNITIES AND CHALLENGES IN THE ECOSYSTEM.
BEGINNER’S GUIDE: HOW TO READ EACH OF THE PILLAR SECTIONS
We are excited to present some of our key findings in each of the four pillars: funding, human capital, quality of life, and regulation and receptivity. A few pointers for reading these sections:
We begin each section with key correlations and highlight relationships that show statistical significance from our survey data.
We dive into the city ranking of that pillar based on our model of publicly available data.
Finally, we examine what social entrepreneurs said, “in their words,” and look towards actionable “Sparks,” to generate new ideas to improve your ecosystem.
When you see this symbol, it means the relationship
showed statistical significance (p = 0.05)
KEY:
INTRODUCTION
10 SocEntCity.org10 SocEntCity.org
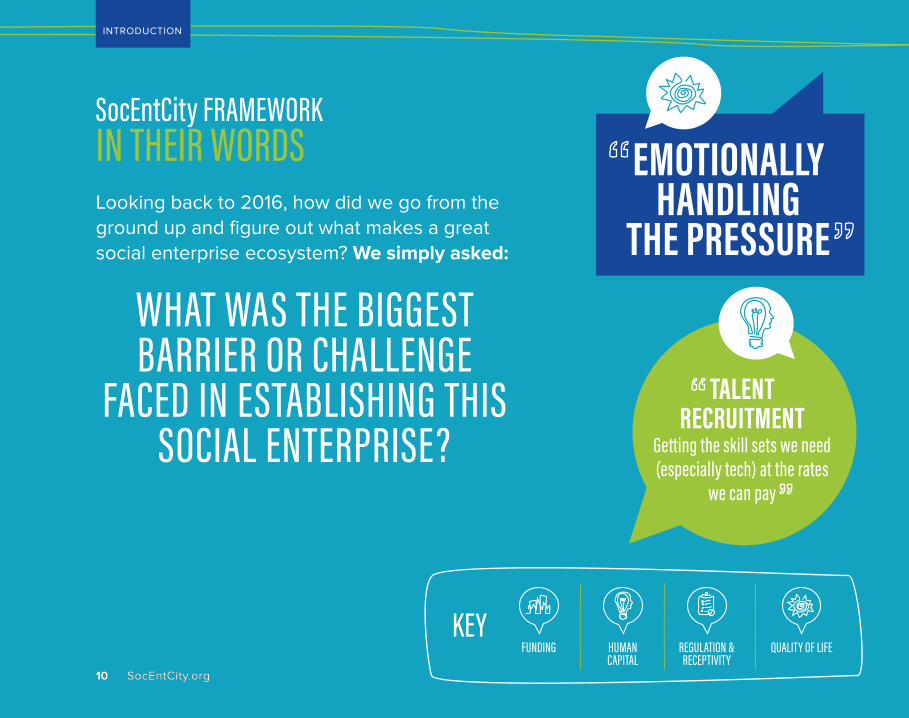
SocEntCity FRAMEWORK IN THEIR WORDSLooking back to 2016, how did we go from the ground up and figure out what makes a great social enterprise ecosystem? We simply asked:
EMOTIONALLY HANDLING
THE PRESSURE
TALENTRECRUITMENT
Getting the skill sets we need (especially tech) at the rates
we can pay
FUNDING REGULATION & RECEPTIVITY
HUMANCAPITAL
QUALITY OF LIFE
WHAT WAS THE BIGGEST BARRIER OR CHALLENGE
FACED IN ESTABLISHING THIS SOCIAL ENTERPRISE?
KEY
INTRODUCTION
11
EX
EC
. S
UM
MA
RY
FR
AM
EW
OR
KIN
TR
OM
ET
HO
DO
LOG
YIN
DE
XN
EX
T S
TE
PS
11
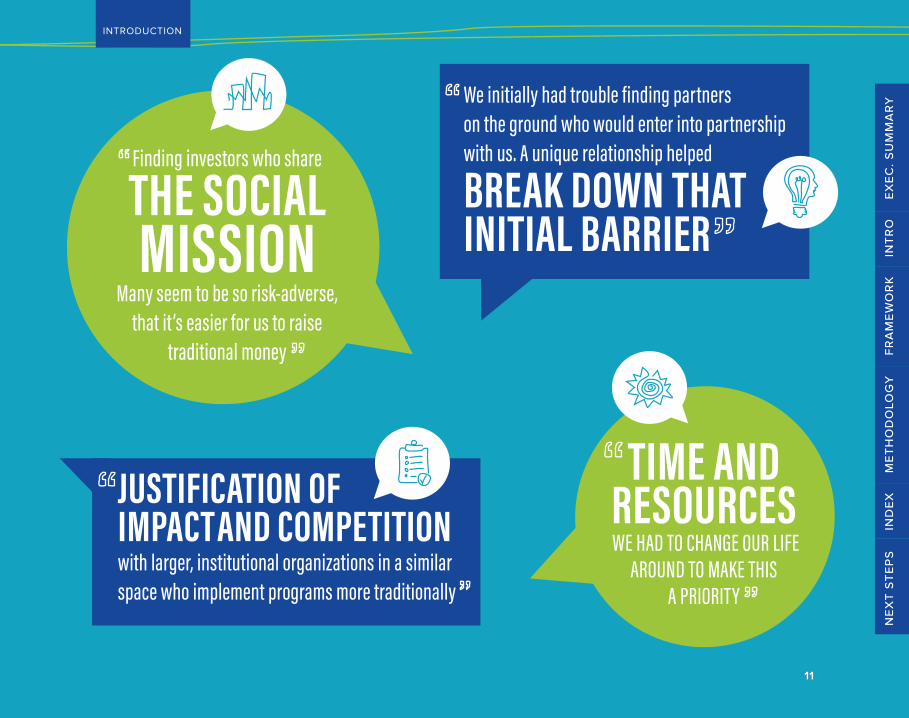
Finding investors who share
THE SOCIAL MISSION
Many seem to be so risk-adverse, that it’s easier for us to raise
traditional money
We initially had trouble finding partners on the ground who would enter into partnership with us. A unique relationship helped
BREAK DOWN THAT INITIAL BARRIER
TIME AND RESOURCES WE HAD TO CHANGE OUR LIFE
AROUND TO MAKE THIS A PRIORITY
JUSTIFICATION OF IMPACT AND COMPETITIONwith larger, institutional organizations in a similar space who implement programs more traditionally

12
FRAMEWORK
SocEntCity.org
The fuel of the ecosystem: sources of capital including seed funding, grants, and philanthropic and venture capital (representing both public and private sources).
In this section, we will explore the survey results and public data to uncover significant relationships that define the funding ecosystem – let’s follow the money!
FUNDING
AGE OF ENTREPRENEURS
GENDER AND FUNDING
UNDER 25 25 – 30 31 – 35 36 – 40 41 – 50
Average Funding Raised $243,333 $966,429 $1,392,442 $2,155,263 $1,729,412
50+$3,321,774
CAPITAL RAISED
Older social entrepreneurs are more successful in raising capital than younger social entrepreneurs.
Similar to many other studies, men reported significantly higher amounts of capital raised than women.
$2,141,372RAISED
$881,319RAISED

13
FRAMEWORK
EX
EC
. S
UM
MA
RY
FR
AM
EW
OR
KIN
TR
OM
ET
HO
DO
LOG
YIN
DE
XN
EX
T S
TE
PS
70%
The funding sources reported by social entrepreneurs in the survey reflect the growth patterns and funding sources of more traditional startups.
*Survey takers could select more than one source ** We used current U.S. Census designations to ask respondents about racial identity.
TOP 5 FUNDING SOURCES*
0% 10% 20% 30% 40% 50% 60%
Self-financed, friends, and/or family
CrowdfundingGrants
Angel InvestorsVenture Capital
CustomersTraditional Loans
Other
65.3%
17.4%
41.3%15.7%
6.6%28.5%
7.4%19.4%
SOURCES OF FUNDING
ASIAN
FUNDING SOURCES BY DEMOGRAPHIC**
WHITE
BLACK/AFRICAN AMERICAN
Customers
Angel Investors
Crowdfunding
18.5%
9.6%
6.8%
7.5%
5%
15%
15.4%
3.8%
11.5%
Relative to others, White respondents are more likely to get their source of funds through customers and angel investors while comparatively, Asian respondents have higher chance of getting their funds through crowdfunding.
Statistical significance (p=0.05)KEY:

14
FRAMEWORK
SocEntCity.org
When institutions sayWE WILL RECONNECT WITH YOU IN 6 MONTHS to us that may be the difference between us succeeding and failing
GETTING FOUNDATIONS AND THE PRIVATE SECTOR
to buy into changing their programs of investment to see entrepreneurship
as a vehicle to build wealth
FUNDING IN THEIR WORDSSocial entrepreneurs speak up about their primary funding challenges
OUR DEMOGRAPHIC
WON’T ALLOW US TO RAISE MONEY FROM FRIENDS
AND FAMILY
THERE’S A GREAT NEED FOR MORE IMPACT ANGELS
ATTRACTINGINVESTORS
INTERESTED IN SOCIAL IMPACT

15
EX
EC
. S
UM
MA
RY
FR
AM
EW
OR
KIN
TR
OM
ET
HO
DO
LOG
YIN
DE
XN
EX
T S
TE
PS
FUNDING — SPARKS
THE PAIN POINT
Traditional funders are inward-looking when assessing how to support a social enterprise (i.e., “Can we do it?” rather than “How can we help?”), and often underutilize non-financial resources.
CASE STUDY
By taking a holistic approach to its relationships with social enterprises, RSF Social Finance can help organizations not only obtain funding but also advisory support, loan guarantees, or grants depending on their needs and stage of development.
RECOMMENDATION FOR YOUR CITY
Cities should lead funding commitments, provide network contacts, and offer technical expertise can all play key roles in creating innovative funding structures that strengthen partnerships, reduce financial risk, and meet the needs and objectives of an organization carrying out socially beneficial activity in the community.
To read more and to see other funding-related recommendations, visit SocEntCity.org.
CITY: San Francisco, California | Aurora, Colorado ORGANIZATION: RSF Social Finance RELEVANT ACTORS: Funder/Investor
FRAMEWORK

16
FRAMEWORK
SocEntCity.org
FUNDING — RANKINGS
CITY
PRIVATE INVESTMENT CHARITABLE GIVING PUBLIC SPENDING
RANK
COMPOSITE
Los Angeles
New York
Boston
San Francisco
Chicago
San Diego
Miami
Washington, D.C.
Austin
Dallas
[MAX]
1
2
3
4
5
6
7
8
9
10
74.4
68.96
67.72
67.56
66.18
63.14
60.45
56.97
55.38
55.3
[100]
4
2
3
1
6
7
10
8
9
13
28.57
31.75
30.16
33.33
24.60
23.81
18.25
22.22
20.63
15.87
[33.33]
7
16
18
12
11
6
2
14
14
1
21.69
13.65
12.85
15.26
16.87
22.09
28.11
14.06
14.06
32.53
[33.33]
4
5
2
10
2
12
18
7
7
21
24.14
23.56
24.71
18.97
24.71
17.24
14.08
20.69
20.69
6.90
[33.33]
SCORE RANK SCORE RANK SCORE RANK SCORE
For the full rankings list, please visit SocEntCity.org.
WHAT DO WE KNOW ABOUT E ACH CIT Y FROM THE SURVE Y, REL ATIVE TO THE OTHER CITIES?Founders in New York focus their fundraising time within, rather than outside of, their ecosystem.
In Chicago, entrepreneurs raised less money than they expected in the last year.
In Minneapolis, entrepreneurs don’t believe that local investors always understand what a social enterprise is.

17
FRAMEWORK
EX
EC
. S
UM
MA
RY
FR
AM
EW
OR
KIN
TR
OM
ET
HO
DO
LOG
YIN
DE
XN
EX
T S
TE
PS
HOW DID WE EXAMINE FUNDING THROUGH PUBLIC DATA?
Below are the variables we examined in assessing a city’s funding ecosystem. See the bibliography for the data sources for each of the variables.
FUNDING PILLAR: VARIABLES MEASURED
PUBLIC SPENDING
CHARITABLE GIVING
PRIVATE INVESTMENT
Federal spending
Social Innovation Fund grants
Presence of a city or state innovation fund
Venture capital investment
Angel investment
Local charity best practices ranking
Individual donations to charity
Statistical significance (p=0.05)KEY:

18
FRAMEWORK
SocEntCity.org
HUMAN CAPITALThe engine of the ecosystem: finding great people – as team members, mentors, employees, and advisors.
In this section, we will examine the talent of a region and look at how different populations of social entrepreneurs experience the benefit, or the dearth, of access to human capital.
ACCESS TO HUMAN CAPITAL
Social entrepreneurs are generally optimistic about their talent markets; only 9.8% of the respondents disagree that there’s a good talent pool in their region.
PILLAR IMPORTANCE RATING*Human Capital
Funding
Quality of Life
Regulation & Receptivity
3.18
2.63
2.20
1.99
Respondents find the most important relationships are with mentors.
MOST CRITICAL RELATIONSHIP
* 1 = Least important | 4 = Most important
1. MENTORS / ADVISORS
2. INVESTORS
3. FELLOW ENTREPRENEURS 4. ACCELERATORS / INCUBATORS
5. LOCAL POLICYMAKERS
19
FRAMEWORK
EX
EC
. S
UM
MA
RY
FR
AM
EW
OR
KIN
TR
OM
ET
HO
DO
LOG
YIN
DE
XN
EX
T S
TE
PS
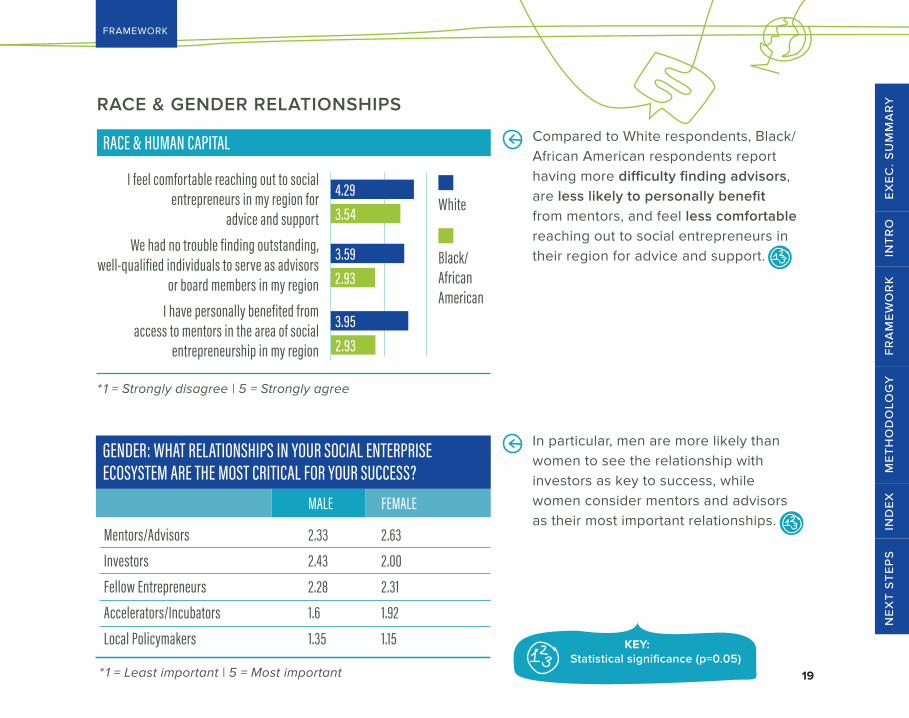
RACE & GENDER RELATIONSHIPS
Compared to White respondents, Black/African American respondents report having more difficulty finding advisors, are less likely to personally benefit from mentors, and feel less comfortable reaching out to social entrepreneurs in their region for advice and support.
RACE & HUMAN CAPITAL
I feel comfortable reaching out to social entrepreneurs in my region for
advice and support
We had no trouble finding outstanding, well-qualified individuals to serve as advisors
or board members in my region
I have personally benefited from access to mentors in the area of social
entrepreneurship in my region
4.29
3.59
3.95
3.54
2.93
2.93
White
Black/ African American
* 1 = Strongly disagree | 5 = Strongly agree
In particular, men are more likely than women to see the relationship with investors as key to success, while women consider mentors and advisors as their most important relationships.
GENDER: WHAT RELATIONSHIPS IN YOUR SOCIAL ENTERPRISE ECOSYSTEM ARE THE MOST CRITICAL FOR YOUR SUCCESS?
MALE FEMALE
Mentors/Advisors
Investors
Fellow Entrepreneurs
Accelerators/Incubators
Local Policymakers
2.33
2.43
2.28
1.6
1.35
2.63
2.00
2.31
1.92
1.15
* 1 = Least important | 5 = Most importantStatistical significance (p=0.05)
KEY:

20
FRAMEWORK
SocEntCity.org
Social entrepreneurs speak up about their primary human capital challenges
TALENT RECRUITMENT—getting the skill sets we need (especially tech) at the rates we can pay
LACK OF MENTORSHIP & GUIDANCE
FINDING INNOVATIVE THINKING PARTNERS
ready to make a paradigm shift from programs and processes
used the past 50 years
BUILDING A
NETWORK OF SUPPORTERS
FINDING SKILLED AND PASSIONATE
PEOPLE TO WORK WITH
HUMAN CAPITALIN THEIR WORDS

21
EX
EC
. S
UM
MA
RY
FR
AM
EW
OR
KIN
TR
OM
ET
HO
DO
LOG
YIN
DE
XN
EX
T S
TE
PS
THE PAIN POINT
Many entrepreneurs find it difficult to obtain business professionals with specialized skills to help address issues their ventures are facing. This challenge is only amplified in the social sector, where resource constraints may make it difficult to attract and hire highly skilled professionals.
CASE STUDY
Catchafire, a for-purpose social mission business and certified B-Corporation, matches professionals with social enterprises based on their skills, cause interest, and time availability.
RECOMMENDATION FOR YOUR CITY
Cities that aim to make it easier for entrepreneurs to connect with skills-based volunteers may consider digital platforms that reduce the burden of matching the needs of ventures with the desires of passionate, skilled professionals.
HUMAN CAPITAL — SPARKS
To read more and to see other human capital-related recommendations, visit SocEntCity.org.
CITY: New York, New York ORGANIZATION: Catchafire RELEVANT ACTORS: Business
FRAMEWORK

22
FRAMEWORK
SocEntCity.org
HUMAN CAPITAL — RANKING
CITY
LEVEL OF EDUCATION CIVIC ENGAGEMENT UNIVERSITY PRESENCE
RANK
COMPOSITE
San Francisco
Washington, D.C.
Boston
Seattle
Chicago
Minneapolis
San Diego
Philadelphia
New York
Denver
[MAX]
1
2
3
4
5
6
7
8
9
10
80.42
79.63
78.04
67.20
64.95
60.71
58.73
57.94
55.29
54.63
[100]
2
1
2
6
12
8
10
14
11
7
30.95
33.33
30.95
25.40
15.87
23.02
17.46
12.70
16.67
23.81
[33.3]
3
5
11
1
7
2
4
9
20
6
26.98
23.81
19.05
31.75
21.03
31.35
25.40
19.84
6.35
23.41
[33.33]
6
6
3
16
3
19
12
5
1
18
22.49
22.49
28.04
10.05
28.04
6.35
15.87
25.40
32.28
7.41
[33.33]
SCORE RANK SCORE RANK SCORE RANK SCORE
For the full rankings list, please visit SocEntCity.org.
WHAT DO WE KNOW ABOUT E ACH CIT Y FROM THE SURVE Y, REL ATIVE TO THE OTHER CITIES?Social entrepreneurs in D.C. do not consider accelerators and incubators critical to their sucess.
Entrepreneurs in Minneapolis feel that local policymakers have been key to their success, whereas founders in San Francisco disagree.

23
FRAMEWORK
EX
EC
. S
UM
MA
RY
FR
AM
EW
OR
KIN
TR
OM
ET
HO
DO
LOG
YIN
DE
XN
EX
T S
TE
PS
HOW DID WE EXAMINE FUNDING THROUGH PUBLIC DATA?
Below are the variables that we utilized to assess a city’s human capital ecosystem. See the bibliography for the data sources for each variable.
HUMAN CAPITAL — PUBLIC DATA
UNIVERSITY HUBS
CIVICENGAGEMENT
LEVEL OF EDUCATION
University quantity
University quality
Research 1 institutions
Bachelor’s degrees / capita
City education level rankings
Local election voter turnout
State election voter turnout
Rates of volunteerism
Statistical significance (p=0.05)KEY:

24
FRAMEWORK
SocEntCity.org
QUALITY OF LIFE The fabric of the ecosystem: everything from diversity, cost of living, and transportation that determines an entrepreneur’s experience living in a region.
Cities need to have a high quality of life to pull in great founders. Last year, we found that 47% of social entrepreneurs located their venture in their region because they already lived there. In many respects, cities need to attract founders before these individuals found a venture. Let’s take a look at what the survey results informed us about quality of life this year.
RACE AND QUALITY OF LIFE
RACIAL IDENTITYSCALE*
WHITETHE SOCIAL ENTERPRISE ECOSYSTEM IN MY REGION IS INCLUSIVE AND PROMOTES DIVERSITY
BLACK/AFRICAN AMERICAN2.38 3.92
* 1 = Strongly disagree | 5 = Strongly agree
Overall, 16.3% of the respondents disagree that the social enterprise ecosystem in their region is inclusive and promotes diversity, while 84.6% of Black/African American respondents disagree.

25
FRAMEWORK
EX
EC
. S
UM
MA
RY
FR
AM
EW
OR
KIN
TR
OM
ET
HO
DO
LOG
YIN
DE
XN
EX
T S
TE
PS
AFFORDABILITY
One of the more actionable findings this year is around affordability. In the survey, 41.3% of respondents agreed that it was difficult to support themselves due to a high cost of living, versus only 35.8% who disagreed.
While larger cities have a plethora of advantages in supporting startups, smaller cities can capitalize on a lower cost of living as an incentive to attract founders.
STRONGLY DISAGREE NEUTRAL STRONGLY AGREEDISAGREE AGREE
It is difficult to support myself financially given the high cost of living in my region
10.6% 25.2% 22.9% 21.6% 19.7%
Statistical significance (p=0.05)
It is the most fulfilling job I have ever had and the impact we are making on both customers and partners is gratifying.
KEY:

26
FRAMEWORK
SocEntCity.org
Social entrepreneurs speak up about primary quality of life challenges
TIME AND RESOURCES. I HAD TO CHANGE MY
LIFE AROUND TO MAKE THIS A PRIORITY
SUFFICIENTMONEY TO LIVE
LIVING WITHOUTA SALARY
QUALITY OF LIFEIN THEIR WORDS
PERSONALTIME
STAFFING, INCREDIBLY
LONG HOURS, just sticking with it and being
willing to be uncomfortable much of the time

27
FROM THE GROUND UP: QUANTIFYING SOCIAL ENTERPRISE ECOSYSTEMS IN THE U.S
EX
EC
. S
UM
MA
RY
FR
AM
EW
OR
KIN
TR
OM
ET
HO
DO
LOG
YIN
DE
XN
EX
T S
TE
PS
THE PAIN POINT
The “face” of entrepreneurship, especially in hubs of innovation like Silicon Valley, often does not include entrepreneurs of color, specifically African American millennials.
CASE STUDY
City Startup Labs (CSL), a Charlotte-based organization, specifically addressed the need to create space for a new class of young, African American male entrepreneurs. The organization has provided four modules through which 18-to-34-year-old African American male entrepreneurs learn how to research, plan, launch, and operate their own ventures.
RECOMMENDATION FOR YOUR CITY
Cities should proactively focus on inclusive entrepreneurship, working with communities to develop resources that support entrepreneurs from historically underrepresented groups. Relevant actors should be mindful in understanding community needs and the barriers in accessing existing resources. With specific tools, under-resourced entrepreneurs can strengthen social enterprise ecosystems, increase community engagement, and promote economic development.
QUALITY OF LIFE — SPARKS
To read more and to see other quality of life-related recommendations, visit SocEntCity.org.
CITY: Charlotte, North Carolina ORGANIZATION: City Startup Labs RELEVANT ACTORS: Enabler | Policymakers
FRAMEWORK

28
FRAMEWORK
SocEntCity.org
QUALITY OF LIFE — RANKING
CITY
AFFORDABILITYCOMMUNITY RESOURCES TRANSPORTATION DIVERSITY
RANK
COMPOSITE
Chicago
Minneapolis
New York
Boston
San Francisco
Washington, D.C.
Denver
Austin
Philadelphia
Dallas
[MAX]
1
2
3
4
5
6
7
8
9
10
62.65
61.61
61.31
60.57
59.82
58.93
56.25
54.32
54.02
53.13
[100]
14
8
20
18
21
19
12
6
9
5
9.82
16.07
2.98
5.36
1.19
3.57
11.91
18.45
15.48
20.24
[25]
8
4
6
4
2
1
2
12
15
18
15.18
18.16
17.86
18.16
19.05
22.92
19.05
12.35
11.16
7.00
[25]
5
1
4
2
3
8
9
17
10
19
3
17
1
6
2
8
14
9
11
7
16.82
19.64
17.26
18.30
18.16
15.78
15.18
9.23
14.88
8.04
[25]
20.83
7.74
23.22
18.75
21.43
16.67
10.12
14.29
12.50
17.86
[25]
SCORE RANK SCORE RANK SCORE RANK RANKSCORE SCORE
For the full rankings list, please visit SocEntCity.org.
WHAT DO WE KNOW ABOUT E ACH CIT Y FROM THE SURVE Y, REL ATIVE TO THE OTHER CITIES?Entrepreneurs in D.C. feel that it’s hard to support themselves given the high cost of living, while In Pittsburgh and Philadelphia, founders feel that the cost of living in their cities makes it easier to support themselves.
In Pittsburgh, there tend to be more males than females in local social enterprises.

29
FRAMEWORK
EX
EC
. S
UM
MA
RY
FR
AM
EW
OR
KIN
TR
OM
ET
HO
DO
LOG
YIN
DE
XN
EX
T S
TE
PS
HOW DID WE EXAMINE FUNDING THROUGH PUBLIC DATA?
Below are the variables we examined in assessing a city’s quality of life ecosystem. See the bibliography for the data sources for each variable.
QUALITY OF LIFE — PUBLIC DATA
DIVERSITY
TRANSPORTATION
AFFORDABILITY COMMUNITY RESOURCES
Arts and culture participation
Arts and culture programming
Librarian/Resident ratio
Healthiest Cities index
Local immigrant population
Cultural diversity ranking
Apartment rental prices
Living wage index
Commute time
Walk score & Bike score
Public transportation score
Statistical significance (p=0.05)KEY:
30
FRAMEWORK
SocEntCity.org
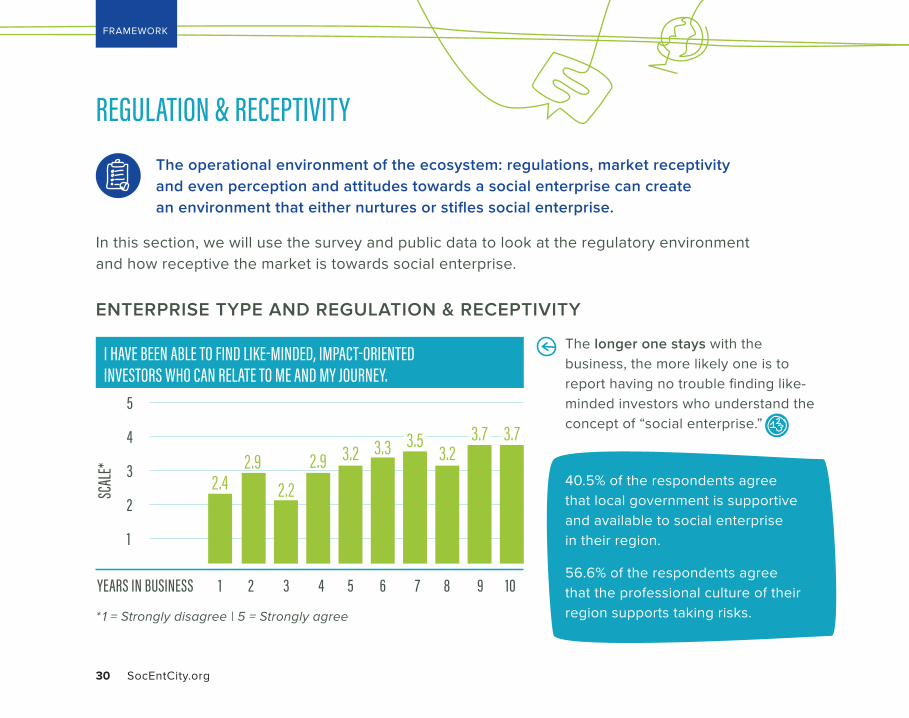
REGULATION & RECEPTIVITYThe operational environment of the ecosystem: regulations, market receptivity and even perception and attitudes towards a social enterprise can create an environment that either nurtures or stifles social enterprise.
In this section, we will use the survey and public data to look at the regulatory environment and how receptive the market is towards social enterprise.
ENTERPRISE TYPE AND REGULATION & RECEPTIVITY
40.5% of the respondents agree that local government is supportive and available to social enterprise in their region.
56.6% of the respondents agree that the professional culture of their region supports taking risks.
The longer one stays with the business, the more likely one is to report having no trouble finding like-minded investors who understand the concept of “social enterprise.”
* 1 = Strongly disagree | 5 = Strongly agree
I HAVE BEEN ABLE TO FIND LIKE-MINDED, IMPACT-ORIENTED INVESTORS WHO CAN RELATE TO ME AND MY JOURNEY.
5
4
3
2
1
YEARS IN BUSINESS
SCAL
E*
71 2 3 4 5 6 8 9 10
2.92.4 2.2
2.9 3.2 3.3 3.53.2
3.7 3.7
31
FRAMEWORK
EX
EC
. S
UM
MA
RY
FR
AM
EW
OR
KIN
TR
OM
ET
HO
DO
LOG
YIN
DE
XN
EX
T S
TE
PS
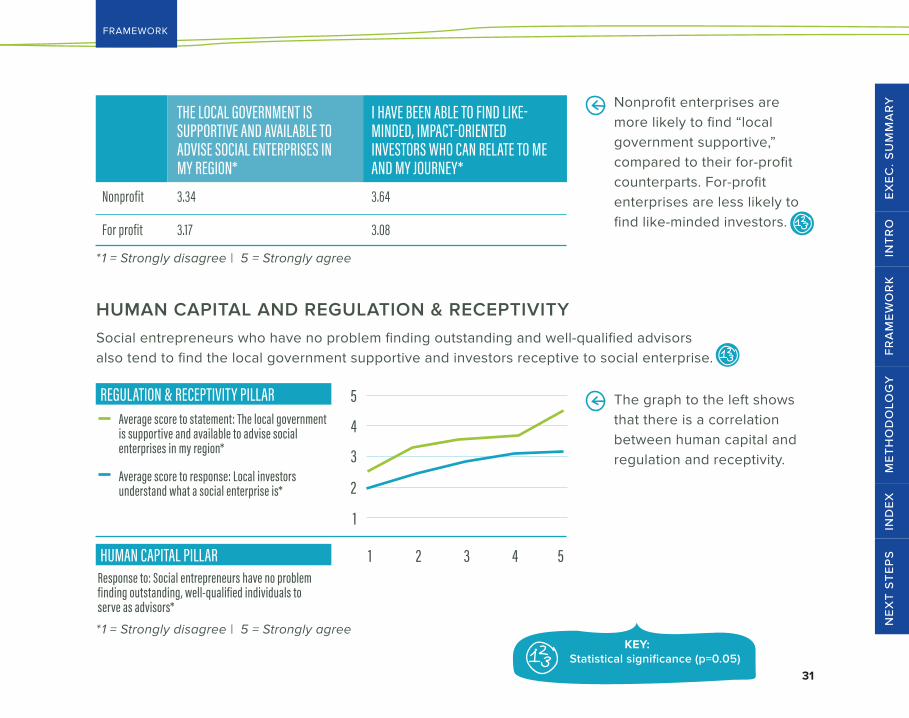
Nonprofit enterprises are more likely to find “local government supportive,” compared to their for-profit counterparts. For-profit enterprises are less likely to find like-minded investors.
THE LOCAL GOVERNMENT IS SUPPORTIVE AND AVAILABLE TO ADVISE SOCIAL ENTERPRISES IN MY REGION*
I HAVE BEEN ABLE TO FIND LIKE-MINDED, IMPACT-ORIENTED INVESTORS WHO CAN RELATE TO ME AND MY JOURNEY*
Nonprofit
For profit
3.34
3.17
3.64
3.08
*1 = Strongly disagree | 5 = Strongly agree
*1 = Strongly disagree | 5 = Strongly agree
Social entrepreneurs who have no problem finding outstanding and well-qualified advisors also tend to find the local government supportive and investors receptive to social enterprise.
HUMAN CAPITAL AND REGULATION & RECEPTIVITY
HUMAN CAPITAL PILLARResponse to: Social entrepreneurs have no problem finding outstanding, well-qualified individuals to serve as advisors*
1 2 3 54
5
4
3
2
1
Average score to statement: The local government is supportive and available to advise social enterprises in my region*
REGULATION & RECEPTIVITY PILLAR
Average score to response: Local investors understand what a social enterprise is*
Statistical significance (p=0.05)KEY:
The graph to the left shows that there is a correlation between human capital and regulation and receptivity.

32
FRAMEWORK
SocEntCity.org
Social entrepreneurs speak up about their primary regulation and receptivity challenges
Largest barriers were FIGURING OUT THE RIGHT ENTITY TYPE(S) FOR THE
RIGHT SOURCE OF FINANCING
OVERCOMING STEREOTYPES and assumptions about what our organization was and what we were capable of doing
NOT EVERYONEUNDERSTANDS SOCIAL ENTERPRISE
FOUNDATIONS AND INDIVIDUALS
are skeptical of the connection between business and impact
LOCAL GOV’T. BEING WARY OF NEW INNOVATIVE MEASURES
REGULATION & RECEPTIVITYIN THEIR WORDS

33
EX
EC
. S
UM
MA
RY
FR
AM
EW
OR
KIN
TR
OM
ET
HO
DO
LOG
YIN
DE
XN
EX
T S
TE
PS
THE PAIN POINT
Entrepreneurship can be unnecessarily difficult. Navigating the complex, fraught, and often frustrating landscape of government regulation around small businesses can be challenging.
CASE STUDY
Launched in 2016, the LA Business Portal provides users with a mobile-optimized, web-based business assistance tool that simplifies the process of registering, planning, managing, and growing a business in Los Angeles.
RECOMMENDATION FOR YOUR CITY
Cities can empower entrepreneurs by providing tools and resources to allow them to more easily understand the policies, regulations and procedures relevant to their ventures. As an open source project, the Portal can be leveraged by cities looking to improve their business friendliness in a lower-cost manner.
REGULATION & RECEPTIVITY — SPARKS
To read more and to see other regulation and receptivity-related recommendations, visit SocEntCity.org.
CITY: Los Angeles, California ORGANIZATION: Mayor Garcetti’s Los Angeles Innovation Team RELEVANT ACTORS: Policymakers | Entrepreneurs
FRAMEWORK

34
FRAMEWORK
SocEntCity.org
REGULATION & RECEPTIVITY — RANKINGWHAT DO WE KNOW ABOUT E ACH CIT Y FROM THE SURVE Y, REL ATIVE TO THE OTHER CITIES?San Francisco entrepreneurs believe the culture in the area supports risk-taking.
In Philadelphia, entrepreneurs don’t believe that local investors always understand what a social enterprise is.
CITY
SOCIAL MEDIA VOLUME
SMALL BUSINESS FRIENDLINESS
ENTREPRENEURIAL ACTIVITY
SOCIAL ENTERPRISE LAW
RANK
COMPOSITE
Austin
Boston
Washington, D.C.
New York
San Francisco
Denver
New Orleans
Philadelphia
Los Angeles
Chicago
[MAX]
1
2
3
4
5
6
7
8
9
10
80.82
74.74
72.95
69.84
69.67
68.32
65.96
62.48
61.44
59.95
[100]
7
4
3
2
1
9
14
10
8
6
17.86
21.43
22.62
23.81
25.00
15.48
9.53
14.29
16.67
19.05
[25]
3
7
7
12
21
3
5
12
15
15
22.56
17.07
17.07
11.59
1.22
22.56
20.12
11.59
5.49
5.49
[25]
1
2
5
4
3
8
12
11
6
16
10
10
10
10
1
10
1
1
1
1
23.22
19.05
16.07
17.26
18.45
13.10
11.31
11.61
14.29
10.42
[25]
17.19
17.19
17.19
17.19
25.00
17.19
25.00
25.00
25.00
25.00
[25]
SCORE RANK SCORE RANK SCORE RANK RANKSCORE SCORE
For the full rankings list, please visit SocEntCity.org.

35
FRAMEWORK
EX
EC
. S
UM
MA
RY
FR
AM
EW
OR
KIN
TR
OM
ET
HO
DO
LOG
YIN
DE
XN
EX
T S
TE
PS
HOW DID WE EXAMINE FUNDING THROUGH PUBLIC DATA?
Below are the variables that we examined in assessing a city’s regulation and receptivity ecosystem. See the bibliography for the data sources for each variable.
REGULATION & RECEPTIVITY — PUBLIC DATA
ENTREPRENEURIAL ACTIVITY
SOCIAL ENTERPRISE
LEGAL ENVIRONMENT
SMALL BUSINESS RECEPTIVITY
SOCIAL MEDIA ACTIVITY
Twitter activity around social enterprise
Firm survival rate
Rate of new entrepreneurs
Small Business Friendliness Index
State benefit corporation legislation
Other social enterprise legal forms
Statistical significance (p=0.05)KEY:

36 SocEntCity.org
This report is based on public data and survey responses from 416 individuals who are personally or professionally active in a social enterprise ecosystem. Using the same four pillars that emerged from the 2016 Social Enterprise Ecosystems Report, we structured this year’s survey questions to provide further insights into how those pillars influence social enterprise activity in regions across the country.
Publicly-available data was used to compute this year’s rankings, which have grown in size from nine cities to twenty-one Metropolitan Statistical Areas. The Metropolitan Statistical Area classification is determined by the federal Office of Management and Budget and reflects a geographic area with high population density. As much as possible, the variables used to measure each pillar are informed by research, and multiple indicators within each pillar were used to reflect the breadth of components of the pillar. Once all the data was assembled, the rankings were calculated by weighting each pillar equally (25%), and each variable category equally within every pillar. Those calculations provided a total weighted score that was then used to rank the twenty-one cities in the survey.
The rankings reflect dynamic data points that will shift year to year, allowing us to monitor annually how well these ecosystems support social entrepreneurs. The 21 ecosystems featured in the report are the highest responding cities in the survey.
METHODOLOGYOUR APPROACH TO RANKING
METHODOLOGY
METHODOLOGY
EX
EC
. S
UM
MA
RY
FR
AM
EW
OR
KIN
TR
OM
ET
HO
DO
LOG
YIN
DE
XN
EX
T S
TE
PS
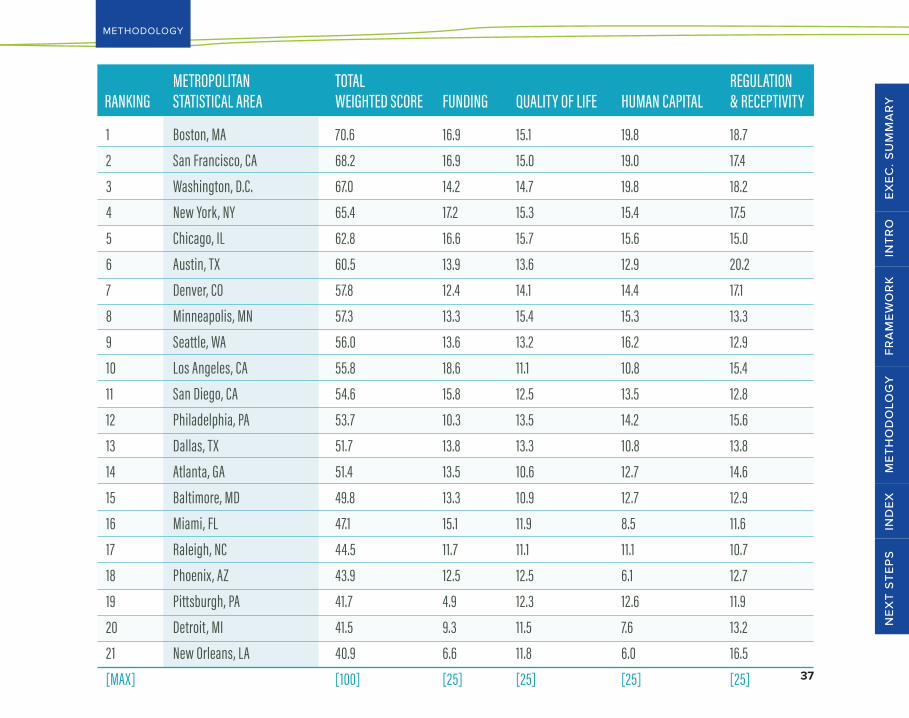
RANKINGMETROPOLITAN STATISTICAL AREA
1
2
3
4
5
6
7
8
9
10
11
12
13
14
15
16
17
18
19
20
21
[MAX]
70.6
68.2
67.0
65.4
62.8
60.5
57.8
57.3
56.0
55.8
54.6
53.7
51.7
51.4
49.8
47.1
44.5
43.9
41.7
41.5
40.9
[100]
16.9
16.9
14.2
17.2
16.6
13.9
12.4
13.3
13.6
18.6
15.8
10.3
13.8
13.5
13.3
15.1
11.7
12.5
4.9
9.3
6.6
[25]
15.1
15.0
14.7
15.3
15.7
13.6
14.1
15.4
13.2
11.1
12.5
13.5
13.3
10.6
10.9
11.9
11.1
12.5
12.3
11.5
11.8
[25]
19.8
19.0
19.8
15.4
15.6
12.9
14.4
15.3
16.2
10.8
13.5
14.2
10.8
12.7
12.7
8.5
11.1
6.1
12.6
7.6
6.0
[25]
18.7
17.4
18.2
17.5
15.0
20.2
17.1
13.3
12.9
15.4
12.8
15.6
13.8
14.6
12.9
11.6
10.7
12.7
11.9
13.2
16.5
[25]
TOTAL WEIGHTED SCORE FUNDING QUALITY OF LIFE HUMAN CAPITAL
REGULATION & RECEPTIVITY
Boston, MA
San Francisco, CA
Washington, D.C.
New York, NY
Chicago, IL
Austin, TX
Denver, CO
Minneapolis, MN
Seattle, WA
Los Angeles, CA
San Diego, CA
Philadelphia, PA
Dallas, TX
Atlanta, GA
Baltimore, MD
Miami, FL
Raleigh, NC
Phoenix, AZ
Pittsburgh, PA
Detroit , MI
New Orleans, LA37

38
INDEX
SocEntCity.org
DEMOGRAPHICS We heard from 416 social entrepreneurs in our survey.
AGE RANGES
<25 25–30
Numb
er of
respo
nden
ts
31–35 36–40 41–50 50+
American Indian/Alaskan Native (1.5%)
Asian (11.4%)
Black/African American (8.6%)
Native Hawaiian/Pacific Islander (0.6%)
White (70.2%)
Latino (3.4%)
I choose not to disclose (4.6%)
Other (5.2%)
RACE*
GENDER
MALE
FEMA
LE
51%49%
MALE/FEMALE EMPLOYEE BREAKDOWN IN THE VENTUREAll male
Mostly maleAbout 50:50
Mostly femaleAll female
N/A
4%
17.2%36%
28.6%
10.8%
3.4%
1.5%3.4%
4.6% 5.2%
70.2%
11.4%8.6%
0.6%43%
70%75%
30%
50% 52%
*We used current U.S. Census designations to ask respondents about racial identity.

39
INDEX
EX
EC
. S
UM
MA
RY
FR
AM
EW
OR
KIN
TR
OM
ET
HO
DO
LOG
YIN
DE
XN
EX
T S
TE
PS
BUSINESS TYPE
For profitB-corporation*
Legally Registered Benefit Corporation
L3C**Nonprofit
Public-Private EnterpriseOther
51.4%
8.4%
5.2%
5.6%
2.4%
37.8%
7.2%
*Certified by B Lab**Low-profit limited liability company
CAPITAL RAISED TO DATELess than $50,000 (41.7%)
$50,000 – $99,999 (13.2%)
$100,000 – $249,999 (9.5%)
$250,000 – $999,999 (14%)
$1,000,000 – $4,999,999 (14%)
$5,000,000 – $24,999,999 (5%)
$25,000,000 or more (2.5%)
2.5%41.7%
13.2%9.5%
14%
14%
5%
Animal Advocacy
Agriculture
Health and Well-being
Education
Civil Rights
Community Development
Energy
Economic Development
Gender Equality
Media
Poverty and/or Hunger Alleviation
Sustainability/ Climate Action
Responsible Consumption and Production
Transportation
Housing
Financial Products & Services
Technology
Retail Apparel/Clothing
Other
12%
13.7%
4.4%
3.2%
10%
2%
2%
2%
4%
2%
5.6%
8.4%
4.4%
17.7%
VENTURE SECTOR
0 10% 20%
1.6%
0%
1.2%2.8%
1.6%
40
INDEX
SocEntCity.org
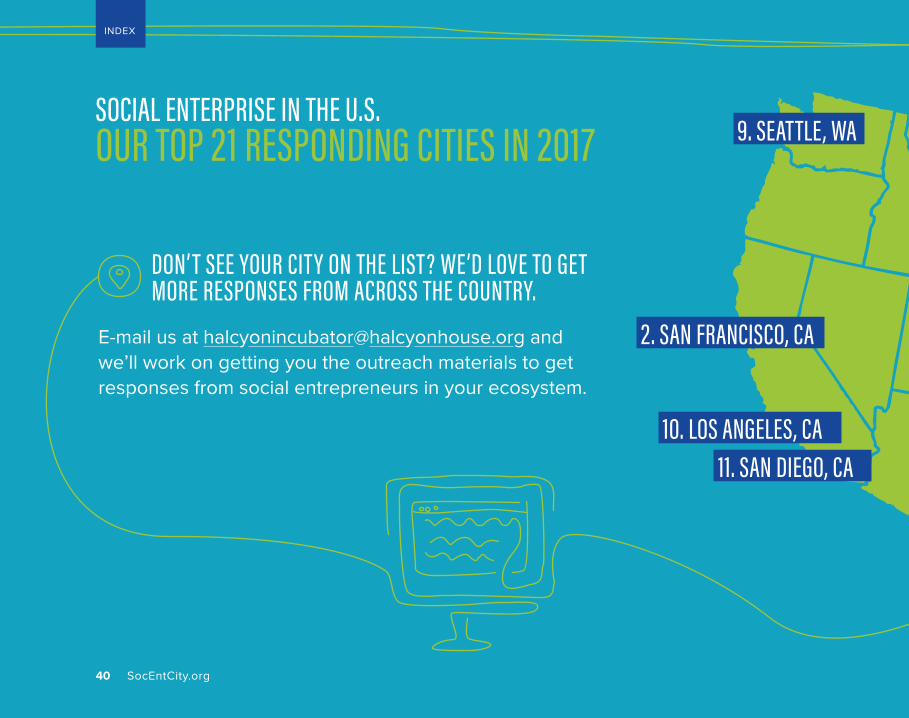
2. SAN FRANCISCO, CA
9. SEATTLE, WA
10. LOS ANGELES, CA11. SAN DIEGO, CA
SOCIAL ENTERPRISE IN THE U.S.OUR TOP 21 RESPONDING CITIES IN 2017
DON’T SEE YOUR CITY ON THE LIST? WE’D LOVE TO GET MORE RESPONSES FROM ACROSS THE COUNTRY.
E-mail us at [email protected] and we’ll work on getting you the outreach materials to get responses from social entrepreneurs in your ecosystem.

41
INDEX
EX
EC
. S
UM
MA
RY
FR
AM
EW
OR
KIN
TR
OM
ET
HO
DO
LOG
YIN
DE
XN
EX
T S
TE
PS
7. DENVER, CO
8. MINNEAPOLIS, MN
6. AUSTIN, TX 21. NEW ORLEANS, LA
13. DALLAS, TX
18. PHOENIX, AZ
5. CHICAGO, IL
16. MIAMI, FL
14. ATLANTA, GA
1. BOSTON, MA4. NEW YORK, NY
3. WASHINGTON, D.C. 15. BALTIMORE, MD
17. RALEIGH, NC
12. PHILADELPHIA, PA19. PITTSBURGH, PA20. DETROIT, MI

42 SocEntCity.org
JOIN THECONVERSATIONGet involved at SocEntCity.org. There you can:
Participate in next year’s survey to make sure your voice and region are represented in the data
Read about our case studies in our Sparks section that equip you with better tools to develop your venture and ecosystem
Get your personalized ranking and see which city is best for your preferences as a social entrepreneur
Contact us with any questions about our work
If you have additional questions, please reach out to us at [email protected]. We’re happy to get into all the fun details about this study!
NEXT STEPS

43
EX
EC
. S
UM
MA
RY
FR
AM
EW
OR
KIN
TR
OM
ET
HO
DO
LOG
YIN
DE
XN
EX
T S
TE
PS
We want to thank the incredible community that helped to put this report together:
The 416 social entrepreneurs whose voices are heard throughout the report
Capital One for its support of innovation ecosystems around the country
Deloitte for producing the “Sparks” you see on the website
Sage Communications who produced the design of the report and the website
WeWork, who generously sponsored a gift card incentive for survey respondents
The Spark interviewees, whose stories you can find on SocEntCity.org
ACKNOWLEDGMENTS REPORT CO-AUTHORS
HalcyonKate Goodall, Ryan Ross and Ziqi Deng
University of Maryland’s Robert H. Smith School of BusinessSara Herald, David Kirsch, Sarina Haryanto, Fasika Delessa, Aishwariya Chandrasekar and Evan Haas
DeloitteNathaniel Wong, Daniel Barker and Rachel Webb
SPONSORS AND PARTNERS

BIBLIOGRAPHY
VARIABLE DESCRIPTION SOURCEAngel investors Number of angel investors and angel investment groups Crunchbase
City innovation fund Does the MSA have a local innovation fund? Crunchbase
Federal spending Total federal funding in each Metropolitan Statistical Area (MSA) USAspending.gov
Individual donations to charity Percent of income given to charity as reported on income tax returns The Chronicle of Philanthropy
Local charity best practices ranking Ranking of financial, accountability and transparency practices of charities in each MSA Charity Navigator
Social Innovation Fund grants Number of organizations receiving these grants in each MSA Corporation for National and Community Service
Venture capital investment Total venture funding invested in each MSA National Venture Capital Association
VARIABLE DESCRIPTION SOURCE
Bachelor’s degrees Percent of local population with bachelor’s degree or higher level of education Census Reporter
City education level rankings Educational attainment and quality score WalletHub
Local election voter turnout Ranking of financial, accountability and transparency practices of charities in each MSA Charity Navigator
Local higher education Number of colleges, universities, and institutes in each Metropolitan Statistical Area (MSA) National Center for Education Statistics
Rates of volunteerism Percent of residents who volunteer Corporation for National and Community Service
Research-focused institutions Number of Research 1 institutions Wikipedia
State election voter turnout Percent of voted in state elections United States Election Project
University quality National university rankings U.S. News and World Report
FUNDING PILLAR
HUMAN CAPITAL PILLAR
How we measured these terms
44 SocEntCity.org

VARIABLE DESCRIPTION SOURCEFirm survival rate Percent of firms that remained in operation through their first five years Kauffman Foundation
New entrepreneurs rate Percent of adult population of an area that became entrepreneurs in a given month Kauffman Foundation
Other social enterprise legal forms Does the state have L3C, SPC, or BLLC legislation? Social Enterprise Law Tracker
Related Twitter mentions Number of times #SocEnt and #ImpInv are mentioned in a week Twitter
Small Business Friendliness Survey results Ranking of ability to start, operate, and grow a business in a region Thumbtack
State benefit corporation legislation Does the state have benefit corporation legislation? Social Enterprise Law Tracker
VARIABLE DESCRIPTION SOURCEApartment rental prices Median rent for one-bedroom apartment Apartment List
Arts and culture participation Percent of adult population participating in arts and culture activities Arts Index USA
Arts and culture programming Total arts expenditures per capita Arts Index USA
Bike score Measurement of bike infrastructure, road connectivity, # of bike commuters, etc. Walk score
Commute time Average commute time in a given MSA Tableau Public
Cultural diversity ranking Composite score of ethnic, racial, linguistic, and birthplace diversity WalletHub
Healthiest Cities index Ranking of metrics in key areas: health care, food, fitness and green space WalletHub
Living wage index Minimum employment income necessary to meet basic needs in a given MSA Living Wage Calculator at MIT
Librarian to Resident ratio Number of librarians per 25,000 residents Institute of Museum and Library Services
Local immigrant population Percent of immigrants in each MSA Migration Policy Institute
Public transportation score Transit score that measures connectivity, access to jobs and frequency of service All Transit
Walk score Measurement of average walking distance to amenities and pedestrian friendliness of roads Walk score
QUALITY OF LIFE PILLAR
REGULATION & RECEPTIVITY PILLAR
45

We support the environment. This report was printed with Forest Stewardship Council®(FSC®)-approved materials and vegetable-based ink.