Hakim Saibi,Stefan Finsterle,Ruggero Bertani, and … Saibi,Stefan Finsterle,Ruggero Bertani, and...
24
54 Geothermal Energy Hakim Saibi, Stefan Finsterle, Ruggero Bertani, and Jun Nishijima Abstract This chapter presents general information about the recent methods applied for geothermal systems. Geothermal engineering can be separated into two groups: research about the underground geothermal reservoir using geophysical and numerical methods and the use of a geothermal power plant as a technology to produce electricity from the underground hot waters. In this chapter, both aspects are presented. Twenty-four countries are currently generating electricity from geothermal resources and 78 countries are using geothermal energy for heating purposes. The total installed geothermal capacity worldwide is 10.7 GWe. This chapter is divided into four parts: The first part, the introduction, discusses the current use of geothermal electricity and the trend of installed geothermal capacity in the world. It also explains the main concepts of geothermal engineering and presents the different types of hydrothermal systems. H. Saibi () Earth Resources Engineering, Laboratory of Exploration Geophysics, Faculty of Engineering, Kyushu University, Nishi-ku, Fukuoka, Japan e-mail: [email protected], [email protected] S. Finsterle Hydrogeology Department, Lawrence Berkeley National Laboratory, Earth Sciences Division, Berkeley, CA, USA e-mail: safi[email protected] R. Bertani Geothermal Center of Excellence, Enel Green Power S.p.A., Pisa, Italy e-mail: [email protected] J. Nishijima Faculty of Engineering, Laboratory of Geothermics, Kyushu University, Nishi-ku, Fukuoka, Japan e-mail: [email protected] J. Kauffman, K.-M. Lee (eds.), Handbook of Sustainable Engineering, DOI 10.1007/978-1-4020-8939-8 120, © Springer Science+Business Media Dordrecht 2013 1019
Transcript of Hakim Saibi,Stefan Finsterle,Ruggero Bertani, and … Saibi,Stefan Finsterle,Ruggero Bertani, and...
54Geothermal Energy
Hakim Saibi, Stefan Finsterle, Ruggero Bertani, and Jun Nishijima
AbstractThis chapter presents general information about the recent methods applied forgeothermal systems. Geothermal engineering can be separated into two groups:research about the underground geothermal reservoir using geophysical andnumerical methods and the use of a geothermal power plant as a technology toproduce electricity from the underground hot waters. In this chapter, both aspectsare presented.
Twenty-four countries are currently generating electricity from geothermalresources and 78 countries are using geothermal energy for heating purposes.The total installed geothermal capacity worldwide is 10.7 GWe.
This chapter is divided into four parts:The first part, the introduction, discusses the current use of geothermal
electricity and the trend of installed geothermal capacity in the world. It alsoexplains the main concepts of geothermal engineering and presents the differenttypes of hydrothermal systems.
H. Saibi (�)Earth Resources Engineering, Laboratory of Exploration Geophysics, Faculty of Engineering,Kyushu University, Nishi-ku, Fukuoka, Japane-mail: [email protected], [email protected]
S. FinsterleHydrogeology Department, Lawrence Berkeley National Laboratory, Earth Sciences Division,Berkeley, CA, USAe-mail: [email protected]
R. BertaniGeothermal Center of Excellence, Enel Green Power S.p.A., Pisa, Italye-mail: [email protected]
J. NishijimaFaculty of Engineering, Laboratory of Geothermics, Kyushu University, Nishi-ku, Fukuoka,Japane-mail: [email protected]
J. Kauffman, K.-M. Lee (eds.), Handbook of Sustainable Engineering,DOI 10.1007/978-1-4020-8939-8 120,© Springer Science+Business Media Dordrecht 2013
1019

1020 H. Saibi et al.
The second part describes geothermal engineering technology and its compo-nents. This part presents direct utilization, geothermal heat pumps, electric powergeneration and combined heat and power generation, the numerical modeling ofgeothermal systems, the current state of practice, recent advances, and emergingtrends in geothermal reservoir simulation and hybrid-microgravity monitoringapplications at geothermal field.
The third part presents a case study of Husavık Energy in Iceland.In the fourth part, the economic analysis is presented.
1 Introduction
Geothermal energy, defined as heat from the Earth, is clean and sustainable. Theenergy demand by the world population is increasing due to the expansion ofeconomies and population growth of the planet Earth and advancements in energy-intense technologies. Between 2008 and 2035, the world’s energy use is expectedto grow by approximately 53 % with half of the increase attributed to India andChina (International Energy Outlook 2011). Much of the energy growth comesfrom developing countries. Fossil fuels are expected to supply approximately 80 %of world energy use in 2035. Renewables are the world’s fastest-growing energysource, at 2.8 % per year, with the renewable’s share of the world energy supplygrowing to approximately 15 % in 2035 (International Energy Outlook 2011).Renewable energy in general and geothermal energy in particular could play asignificant role in supplying a clean and environmentally sustainable source ofenergy to satisfy the world energy demand and its challenges.
The Intergovernmental Panel on Climate Change (IPCC) performed a compre-hensive study on climate. Their models assumed an increase in temperature ofapproximately 2–4ıC for the period 2000–2100 with high CO2 concentration valuesranging from 550 ppm (which is twice the preindustrial level) to 850 ppm. Theincreases in temperature and CO2 concentrations are mainly attributed to CO2
emissions from fossil-fuel energy production systems. Geothermal energy is onerecommended approach to decrease CO2 emissions.
Geothermal energy is the most versatile renewable energy and has been used forthousands of years for washing, bathing, cooking and health: the direct utilizationof hot water is long lasting and still growing with different application ranges.The world’s first geothermal district heating system was started in the fourteenthcentury at Chaudes-Aigues, France, and the first geothermal well was drillednear Reykjavik, Iceland, in 1755. However, only in the twentieth century hasgeothermal energy been harnessed on a large scale for space heating, electricityproduction, and industrial use. The first large municipal district heating servicewas initiated in Iceland in the 1930s and currently provides geothermal heat toapproximately 99 % of the 200,000 residents of Reykjavik. The first commercialplant to produce electricity became available in 1913 in Larderello, Italy. The use ofgeothermal energy has increased rapidly since the 1970s. During the period 2000–2010, the globally installed direct-use capacity tripled from 15 to 50 GWth, whereasthe installed capacity for electricity production increased from 8.0 to 10.7 GWe.

54 Geothermal Energy 1021
Fig. 54.1 Geothermal electricity production in the world
Fig. 54.2 Historical trend of geothermal installed capacity
At present, geothermal energy is used by 78 countries for heating purposes (called“direct use”) and by 24 countries for electricity production. Figure 54.1 shows theuse of geothermal electricity throughout the world (Bertani 2012).
The increase in the installed capacity over the last century is clearly visible inFig. 54.2, with an impressive increase in new plants started in the 1980s, followingthe energy crisis.
Direct utilization is present almost worldwide, with an impressive growing rate,as shown in Fig. 54.3 (Lund et al. 2010).

1022 H. Saibi et al.
Fig. 54.3 Direct use of geothermal energy
1.1 Generalities of Geothermal Energy
“Geothermal” comes from the Greek words geo (Earth) and therme (heat). Thus,geothermal means Earth heat. Geothermics can be defined as the study of the tem-perature distribution in the Earth and the phenomena that influence that distribution.
The Earth’s heat is continuously radiated from within, and each year rainfalland snowmelt supply new water to geothermal reservoirs. Production from in-dividual geothermal fields can be sustained for decades and perhaps centuries,which explains the renewability of this resource (Geothermal Education Office2001) (Fig. 54.4).
1.1.1 Geothermal GradientA geothermal gradient expresses the rate of increasing temperature with depth in theEarth’s crust. The average geothermal gradient is approximately 2.5ıC per 100 m.However, these gradients are much higher at hot and active geothermal regions.
1.1.2 Geothermal SystemsGeothermal systems are located in regions with a normal or slightly above normalgeothermal gradient, creating low-to-medium-enthalpy geothermal reservoirs (lessthan 150ıC). The high-enthalpy geothermal reservoirs (up to or above 400ıC) areespecially located in regions around plate margins with high geothermal gradients.The circulation of water in terrestrial geothermal systems can reach depths ofapproximately 5 km (Pirajno 1992) (Fig. 54.5).

54 Geothermal Energy 1023
Fig. 54.4 Geothermal reservoir fed by rain water
Fig. 54.5 Geothermal regions in the world (in red)
The major characteristics of geothermal energy are its renewability and sustain-ability and its environmental friendliness (with few CO2 emissions). Its variousutilizations include power generation (conventional steam turbine, combined cycle),direct heat use for space heating, greenhouses, aquaculture and tourism (swim-ming pool).
There are mainly two types of geothermal systems: convective and conductive.The convective geothermal systems include vapor-dominated and water-dominatedsystems. The conductive geothermal system is represented by the hot dry rocksystem. To form a geothermal reservoir, three components are necessary:– Heat represented by the thermal energy itself, conductive heat transfer, and
convective heat transfer (fluid transport)
1024 H. Saibi et al.
– Fluid that helps to transfer energy by convection and recharging the water– Open, permeable paths, which allow fluid to flow through porous and fractured
systems
1.2 Hydrothermal Systems
1.2.1 Water-Dominated SystemsThe main characteristics of this type of geothermal system are that the liquid water iscontinuous and the pressure controls the phase changes in the reservoir. Geothermalproduction wells produce a fluid mixture of steam and water. The temperature ofa liquid-dominated reservoir ranges from 210ıC to greater than 300ıC. There aremany water-dominated geothermal systems all over the world, such as in Wairakeiin New Zealand, Olkaria in Kenya, Tongonan in the Philippines, Momotomboin Nicaragua, and Hatchobaru in Japan. The advantages of the water-dominatedsystems from an engineering point of view are its renewability if the separated wateris properly reinjected and the ability to use the separated water for cascade use.
1.2.2 Vapor-Dominated SystemsLiquid water and vapor coexist in the geothermal reservoir, but vapor is continuous,and the pressure controls the phase condition. Geothermal wells in vapor-dominatedreservoirs produce dry steam only, with temperatures ranging from 230 to 260ıC.Vapor-dominated systems are uncommon; some examples are The Geysers in theUSA, Kamojang in Indonesia, Matsukawa in Japan, and Larderello in Italy. Theadvantages from an engineering point of view are that reinjection is not requiredand the surface facilities of the power plant are simple compared with the water-dominated geothermal power plants.
1.2.3 Hot Dry Rock SystemsThe main characteristic of this conductive type of geothermal systems is that no fluidexists to transport the large amount of heat stored in the hot rock to a productionwell for extraction. Moreover, the reservoir rocks are very tight. Fractures withsufficient permeability and connectivity need to be generated artificially (throughreservoir stimulation) to create flow paths through which an injected working fluidcan circulate. The temperatures are higher than 250ıC. There are some experimentalgeothermal plants, such as Los Alamos in the USA, Hiijori and Ogachi in Japan, andSoultz in France.
2 Technology and Components
Geothermal power generation is to produce electricity by rotating a turbine directlywith the steam taken out of the deep underground. While in the thermal powergeneration the steam is generated by the combustion heat of coal, oil, or LNG, it

54 Geothermal Energy 1025
can be said that in the geothermal power generation, the Earth itself plays a roleof a boiler. Generally, the deeper in the Earth, the higher the temperature gets. It isassumed to be about 1,000ıC at the depth of 30–50 km, where it can be regardedas a large thermal storage. To use geothermal energy taken to the ground surfacefrom production wells for power generation, there are some generation systemsdepending on characteristics of geothermal fluid (temperature, pressure, flow rate,etc.) such as single-flash system, double-flash system, dry steam system, and binarycycle system.
2.1 Direct Utilization
Geothermal energy for direct-use projects is in the low-to-intermediate-temperaturerange, and these resources are more widespread and exist in about 80 countries ateconomic drilling depths (from GEA 2012). These projects can use conventionalwater-well drilling and commercial heating and cooling equipment, and there areno conversion efficiency losses. Most projects can be online in less than a year. Theprojects can be on a small scale, such as for an individual home, single greenhouse,or an aquaculture pond, but can also be a large-scale commercial operation, such asfor district heating/cooling, food, lumber drying, and mineral ore extraction.
In addition, carbon dioxide, which often occurs in the geothermal water, can beextracted and used for carbonated beverages or to enhance growth in greenhouses.The typical equipment for a direct-use system is illustrated in the Fig. 54.6 andincludes a downhole and circulation pumps, heat exchangers (normally the platetype), transmission and distribution lines (normally insulated pipes), heat extractionequipment, peaking or backup plants (usually fossil fuel-fired), and fluid disposalsystems (injection wells). The geothermal energy can usually meet 80–90 % of theannual heating or cooling demand despite only being sized for 50 % of the peak load.
2.2 Geothermal Heat Pumps
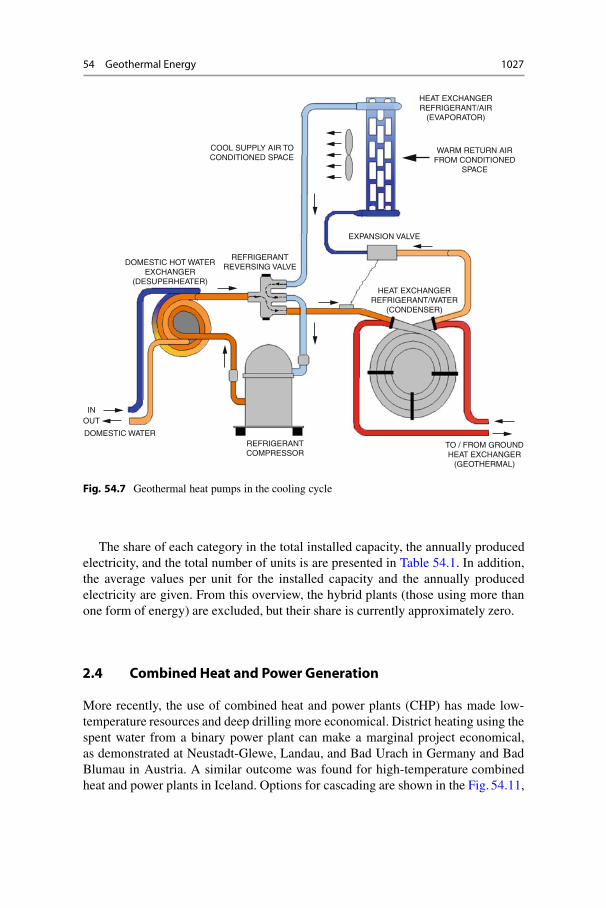
Geothermal heat pumps (GHPs) use the relatively constant temperature of the Earthto provide heating, cooling, and domestic hot water for buildings. A small amountof electricity input is required to run a compressor.
A closed loop of pipe is placed vertically (50–70 m deep) in the ground, anda water-antifreeze solution is circulated through the plastic pipes to either collectheat from the ground in the winter or reject heat to the ground in the summer. Theefficiency of GHP units is described by the coefficient of performance (COP), whichis the ratio of the output energy divided by the input energy (electricity for thecompressor). The ratio varies from 3 to 6 with the present equipment (the higherthe number, the better the efficiency). In comparison, an air-source heat pump hasa COP of approximately 2 and is dependent upon backup electrical energy to meetpeak heating and cooling requirements (see Fig. 54.7).

1026 H. Saibi et al.
Fig. 54.6 Typical direct-use geothermal heating system configuration
2.3 Electric Power Generation
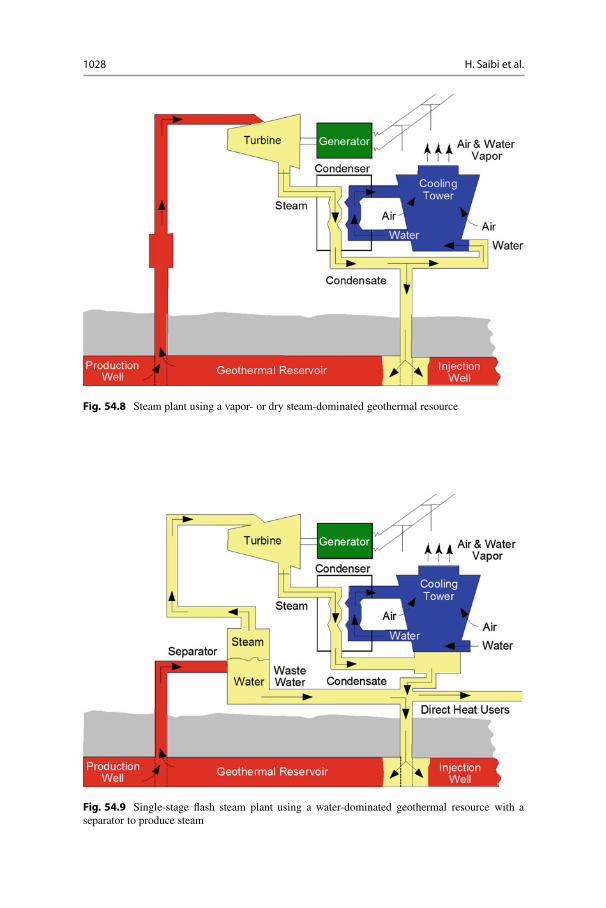
Geothermal power is generated using steam or a hydrocarbon vapor to turn aturbine-generator set to produce electricity. A vapor-dominated (dry steam) resourcecan be used directly, whereas a hot water resource needs to be flashed by reducingthe pressure to produce steam, normally in the 15–20 % range. Some plants usedouble and triple flashes to improve the efficiency. In some cases, using a bottomingcycle (a small binary plant using the wastewater from the main plant) may be moreefficient. In the case of low-temperature resources, those that are generally below180ıC, the use of a secondary low-boiling-point fluid (hydrocarbon) to generate thevapor is needed, resulting in a binary or organic Rankine cycle (ORC) plant. Thedifferent configurations are shown in the Figs. 54.8–54.10.
Usually, a wet or dry cooling tower is used to condense the vapor after it leavesthe turbine to maximize the temperature and pressure drop between the incomingand outgoing vapors and thus increase the efficiency of the operation. Dry coolingis often used in arid areas where water resources are limited. Air cooling normallyhas lower efficiencies during the summer months when the air temperatures are highand humidity is low.
54 Geothermal Energy 1027
HEAT EXCHANGERREFRIGERANT/AIR
(EVAPORATOR)
WARM RETURN AIRFROM CONDITIONED
SPACE
EXPANSION VALVE
HEAT EXCHANGERREFRIGERANT/WATER
(CONDENSER)
TO / FROM GROUNDHEAT EXCHANGER
(GEOTHERMAL)
REFRIGERANTCOMPRESSOR
DOMESTIC WATER
INOUT
COOL SUPPLY AIR TOCONDITIONED SPACE
REFRIGERANTREVERSING VALVEDOMESTIC HOT WATER
EXCHANGER(DESUPERHEATER)
Fig. 54.7 Geothermal heat pumps in the cooling cycle
The share of each category in the total installed capacity, the annually producedelectricity, and the total number of units is are presented in Table 54.1. In addition,the average values per unit for the installed capacity and the annually producedelectricity are given. From this overview, the hybrid plants (those using more thanone form of energy) are excluded, but their share is currently approximately zero.
2.4 Combined Heat and Power Generation
More recently, the use of combined heat and power plants (CHP) has made low-temperature resources and deep drilling more economical. District heating using thespent water from a binary power plant can make a marginal project economical,as demonstrated at Neustadt-Glewe, Landau, and Bad Urach in Germany and BadBlumau in Austria. A similar outcome was found for high-temperature combinedheat and power plants in Iceland. Options for cascading are shown in the Fig. 54.11,
1028 H. Saibi et al.
Fig. 54.8 Steam plant using a vapor- or dry steam-dominated geothermal resource
Fig. 54.9 Single-stage flash steam plant using a water-dominated geothermal resource with aseparator to produce steam

54 Geothermal Energy 1029
Fig. 54.10 Binary power or ORC plant using a low-temperature geothermal resource and asecondary fluid of a low-boiling-point hydrocarbon
Table 54.1 Average capacity and electricity produced per plant category and the share of eachcategory
Type of plant
Averagecapacity perunit (MW)
Averageelectricityproductionper unit(GWh/year)
Share of thenumber ofplants (%)
Share of thetotal capacity(%)
Share of theelectricityproduced (%)
Binary plant 5 27 44 4 4Back pressure plant 6 50 5 5 6Single-flash plant 31 199 27 25 26Double-flash plant 34 236 12 28 30Dry steam plant 46 260 12 38 34
where the geothermal fluid is used for a number of applications at progressivelylower temperatures to maximize energy use.
2.5 Numerical Modeling of Geothermal Systems
2.5.1 The Role of Numerical ModelingNumerical modeling plays a crucial role to support the exploration, characterization,operation, and optimization of geothermal reservoirs. Evaluating the sustainabilityof geothermal energy production requires predictive simulation capabilities that

1030 H. Saibi et al.
Fig. 54.11 Cascade utilization of geothermal energy
capture the key features and processes affecting coupled fluid and heat flow inthe reservoir and in the injection and production wells. Numerical models canbe employed to study generic issues of geothermal reservoir dynamics, includingtwo-phase water-steam flow through fracture networks; heat transfer mechanismsbetween the hot rock matrix and fluids in the fractures; reactive geochemicaltransport including scaling due to mineral dissolution and precipitation; coupledthermal-hydrological-mechanical processes, specifically microseismicity associatedwith reservoir stimulation; and interactions between the reservoir, wells, and surfacefacilities. In addition to the use of numerical models to increase the fundamentalunderstanding of these complex systems, simulators are extensively used to model-specific geothermal fields (O’Sullivan et al. 2001). During exploration, preliminarygeological information and data from geophysical surveys, surface manifestations,and exploration boreholes can be used for resource estimation and the initialwell field design. Once additional data are available from drilling, well testing,and well completion, the reservoir properties can be determined, and a natural-state simulation can be performed to examine the convection patterns, upflowand recharge regions, the presence of flow boundaries, and the initial condi-tions prior to exploitation. Predictive simulations can be performed for researchestimation and planning of the field development. Once production is initiated, the
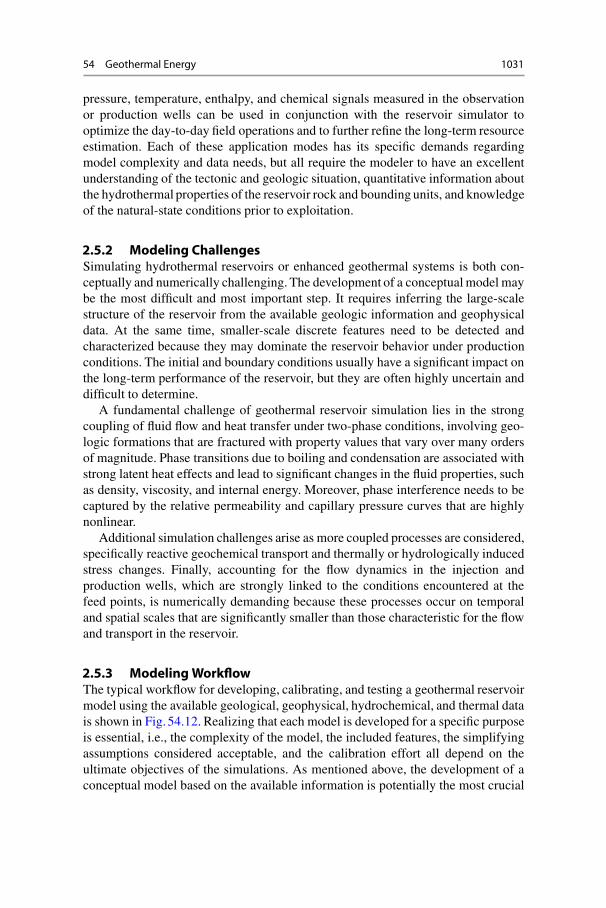
54 Geothermal Energy 1031
pressure, temperature, enthalpy, and chemical signals measured in the observationor production wells can be used in conjunction with the reservoir simulator tooptimize the day-to-day field operations and to further refine the long-term resourceestimation. Each of these application modes has its specific demands regardingmodel complexity and data needs, but all require the modeler to have an excellentunderstanding of the tectonic and geologic situation, quantitative information aboutthe hydrothermal properties of the reservoir rock and bounding units, and knowledgeof the natural-state conditions prior to exploitation.
2.5.2 Modeling ChallengesSimulating hydrothermal reservoirs or enhanced geothermal systems is both con-ceptually and numerically challenging. The development of a conceptual model maybe the most difficult and most important step. It requires inferring the large-scalestructure of the reservoir from the available geologic information and geophysicaldata. At the same time, smaller-scale discrete features need to be detected andcharacterized because they may dominate the reservoir behavior under productionconditions. The initial and boundary conditions usually have a significant impact onthe long-term performance of the reservoir, but they are often highly uncertain anddifficult to determine.
A fundamental challenge of geothermal reservoir simulation lies in the strongcoupling of fluid flow and heat transfer under two-phase conditions, involving geo-logic formations that are fractured with property values that vary over many ordersof magnitude. Phase transitions due to boiling and condensation are associated withstrong latent heat effects and lead to significant changes in the fluid properties, suchas density, viscosity, and internal energy. Moreover, phase interference needs to becaptured by the relative permeability and capillary pressure curves that are highlynonlinear.
Additional simulation challenges arise as more coupled processes are considered,specifically reactive geochemical transport and thermally or hydrologically inducedstress changes. Finally, accounting for the flow dynamics in the injection andproduction wells, which are strongly linked to the conditions encountered at thefeed points, is numerically demanding because these processes occur on temporaland spatial scales that are significantly smaller than those characteristic for the flowand transport in the reservoir.
2.5.3 Modeling WorkflowThe typical workflow for developing, calibrating, and testing a geothermal reservoirmodel using the available geological, geophysical, hydrochemical, and thermal datais shown in Fig.54.12. Realizing that each model is developed for a specific purposeis essential, i.e., the complexity of the model, the included features, the simplifyingassumptions considered acceptable, and the calibration effort all depend on theultimate objectives of the simulations. As mentioned above, the development of aconceptual model based on the available information is potentially the most crucial

1032 H. Saibi et al.
Fig. 54.12 Geothermal reservoir modeling workflow
step in the process because it ultimately determines the mathematical model, theselection of the computer code, and the data needed for the model calibration and theconfidence-building exercise. Simulations usually proceed in multiple steps, startingwith reproducing the pre-exploitation, natural state of the reservoir, which yields theinitial conditions for the subsequent simulation of the exploitation phase, providesthe main calibration data, and is used for reservoir management purposes. The timehorizon of these simulations can be extended to look at additional scenarios, thesitting of additional wells, and long-term predictions of reservoir performance forresource assessment. These predictive simulations may be accompanied by a formaluncertainty analysis, which in turn may be used to improve the monitoring systemsand the collection of additional calibration data to improve parameter estimations.This workflow is approximate as certain stages may be skipped or executed in adifferent order, depending on the modeling purpose. Moreover, the process of modeldevelopment, calibration, and prediction is iterative, accompanying the exploration,development, exploitation, and assessment of the actual geothermal reservoir.
54 Geothermal Energy 1033
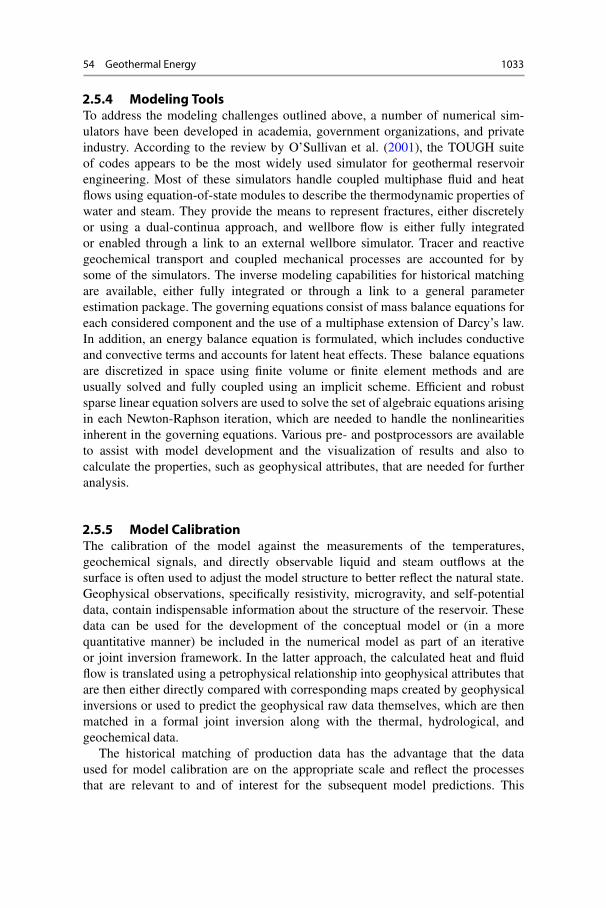
2.5.4 Modeling ToolsTo address the modeling challenges outlined above, a number of numerical sim-ulators have been developed in academia, government organizations, and privateindustry. According to the review by O’Sullivan et al. (2001), the TOUGH suiteof codes appears to be the most widely used simulator for geothermal reservoirengineering. Most of these simulators handle coupled multiphase fluid and heatflows using equation-of-state modules to describe the thermodynamic properties ofwater and steam. They provide the means to represent fractures, either discretelyor using a dual-continua approach, and wellbore flow is either fully integratedor enabled through a link to an external wellbore simulator. Tracer and reactivegeochemical transport and coupled mechanical processes are accounted for bysome of the simulators. The inverse modeling capabilities for historical matchingare available, either fully integrated or through a link to a general parameterestimation package. The governing equations consist of mass balance equations foreach considered component and the use of a multiphase extension of Darcy’s law.In addition, an energy balance equation is formulated, which includes conductiveand convective terms and accounts for latent heat effects. These balance equationsare discretized in space using finite volume or finite element methods and areusually solved and fully coupled using an implicit scheme. Efficient and robustsparse linear equation solvers are used to solve the set of algebraic equations arisingin each Newton-Raphson iteration, which are needed to handle the nonlinearitiesinherent in the governing equations. Various pre- and postprocessors are availableto assist with model development and the visualization of results and also tocalculate the properties, such as geophysical attributes, that are needed for furtheranalysis.
2.5.5 Model CalibrationThe calibration of the model against the measurements of the temperatures,geochemical signals, and directly observable liquid and steam outflows at thesurface is often used to adjust the model structure to better reflect the natural state.Geophysical observations, specifically resistivity, microgravity, and self-potentialdata, contain indispensable information about the structure of the reservoir. Thesedata can be used for the development of the conceptual model or (in a morequantitative manner) be included in the numerical model as part of an iterativeor joint inversion framework. In the latter approach, the calculated heat and fluidflow is translated using a petrophysical relationship into geophysical attributes thatare then either directly compared with corresponding maps created by geophysicalinversions or used to predict the geophysical raw data themselves, which are thenmatched in a formal joint inversion along with the thermal, hydrological, andgeochemical data.
The historical matching of production data has the advantage that the dataused for model calibration are on the appropriate scale and reflect the processesthat are relevant to and of interest for the subsequent model predictions. This

1034 H. Saibi et al.
consistency of scale and process is important as the parameters estimated by theinverse modeling always refer to the specific structure of the calibration model.Any conceptual error in the model structure inevitably leads to errors in theestimated parameters, and these errors are propagated through the prediction model(i.e., the model used to evaluate the long-term performance and sustainabilityof the geothermal reservoir). Minimizing the conceptual differences between thecalibration and prediction models is thus essential. Moreover, using complementarydata (e.g., thermal, hydrological, geochemical, and geophysical data) that containinformation about both the processes and the geologic structure of the reservoiris advantageous. If all these data are included in an iterative model developmentframework or a formal joint inversion approach, the resulting model is likely to bemore accurate and more robust against residual uncertainties and will thus be ableto make more reliable predictions of reservoir behavior.
2.5.6 ExampleAn example of a numerical model of a synthetically enhanced geothermal systemis shown in Fig. 54.13. It consists of a central injection well and two peripheralproduction wells. The reservoir is hydraulically and thermally stimulated, leadingto an ellipsoidal region of fractured rock that is modeled using a dual-permeabilityapproach. In addition, a discrete wide-aperture zone with increased permeabilityis formed, providing potential pathways for fast fluid flow that lead to an earlythermal breakthrough. The heat exchange between the wells and the formationabove the model domain is accounted for using an efficient semi-analytical solutionfor radial heat transfer. The figure shows the computational mesh on the faces of themodel domain, along with the temperature isosurfaces that reveal reservoir volumeundergoing heat mining. The simulations were performed using the TOUGH code(Pruess et al. 1999).
2.5.7 OutlookAlthough numerical modeling in support of geothermal reservoir engineering canbe considered a mature technology, the need to manage reservoirs in a sustainablemanner or to engineer them poses significant challenges that can be partly addressedby advanced simulation capabilities. In particular, the ability to numerically examinecoupled thermal-hydrological-geochemical-mechanical effects allows scientists andengineers to better understand the reservoir behavior to analyze the monitoring datafor an improved characterization of the formation and the fluid and heat flowsunder natural state and production conditions and to manage and optimize thereservoir operations with a reduced risk to the resource and the nearby communities.Integrating the geophysical information in a quantitative manner into the reservoirmodels is another recent advance that has the potential to further improve thereliability of the predictions made in support of the exploration, characterization,and prediction of the geothermal reservoir behavior.

54 Geothermal Energy 1035
1000 1000
Y [m] 5005000
Dep
th [
m]
0−500
−500
−1000
−1000
110
X [m]
120130140150160170180190
T [°C]
−1500−2000
−5000
−4500
−4000
Fig. 54.13 Numerical model of a synthetically enhanced geothermal system with the temperatureisosurfaces after 30 years of heat mining by the injection of cold water from the central well andproduction from two peripheral wells that intersect the stimulated fracture zone
2.6 Hybrid-Microgravity Monitoring at Geothermal Reservoirs
The gravity method is a potential-field geophysical method. Over the last fourdecades, many applications in geothermal, volcanological, and engineering prob-lems have been applied. Time-lapse microgravity surveys in the geothermal fieldshowed good results by monitoring the gravity changes with time and estimatingthe underground mass changes (Saibi et al. 2005). The gravity method is a nonde-structive geophysical technique that measures differences in the Earth’s gravitationalfield at specific locations.
Microgravity measurement is one of the procedures for geothermal reservoirmonitoring. The production and reinjection of geothermal fluid causes mass move-ment and redistributions, which can cause measurable gravity changes on thesurface. The mass balance can be monitored, especially the relationship betweenproduction and recharge, in the geothermal reservoir (Fig. 54.14). Microgravitymonitoring has been performed in some geothermal fields. Gravity decreasedapproximately 1,000 �gal after 30 years in the Wairakei geothermal field in NewZealand (Allis and Hunt 1986).

1036 H. Saibi et al.
Fig. 54.14 Concept of microgravity monitoring
3 Case Study: Design, Efficiency, Emissions
3.1 Combined Heat and Power Plants: The Icelandic Showcase
Combined utilization of heat and power for geothermal production (CHP) is not anew application, but recently it has been widely extended in the low-to-medium-temperature range of the resource, covering different project sizes.
The main reason for a CHP plant is the more efficient use of the entire geothermalenergy extracted from the reservoir fluid, from its initial temperature down to thatof the water discarded to the reinjection stream. In this way, it is possible to stronglyimprove the economics of the entire system, making even small temperatureresources exploitable, even if the electricity revenues alone are not enough for areasonable payback of the investment.
In the selected case study, a quite complex system is highlighted, the HusavıkEnergy CHP system in Iceland (Hjartason et al. 2005).

54 Geothermal Energy 1037
Husavık is a 2,500-inhabitant town in Northeast Iceland, with an economy basedon fishery and services; as typical for that country, geothermal district heating isthe most economic source of domestic energy for the long Nordic winter. Thegeothermal field is located about 20 km away from the town, and through threewells, a total flow rate of 95 L/s of 124ıC hot water is channeled at the first stageof utilization, a binary power plant (with Kalina technology, i.e., using a mixture ofwater and ammonia instead of an organic working fluid), with 1.7 MW of capacity.The insulation of the 16 km pipe is very good, resulting in only 3ıC of cooling atthe plant inlet. The cooling leg of the power plant is realized using a water supplyat 4ıC, which is heated up to 80ıC and stored in a tank. The power plant is used for7,000 h/year.
At the second stage, the hot water is discarded from the plant, and the storagetank is exploited at different temperature levels, obtained by appropriate mixing, forthe following utilizations:– High-temperature glucosamine factory (121ıC), cooled down to 80ıC.– Low-temperature dry fish industry (80ıC) (fed also with hot water from the
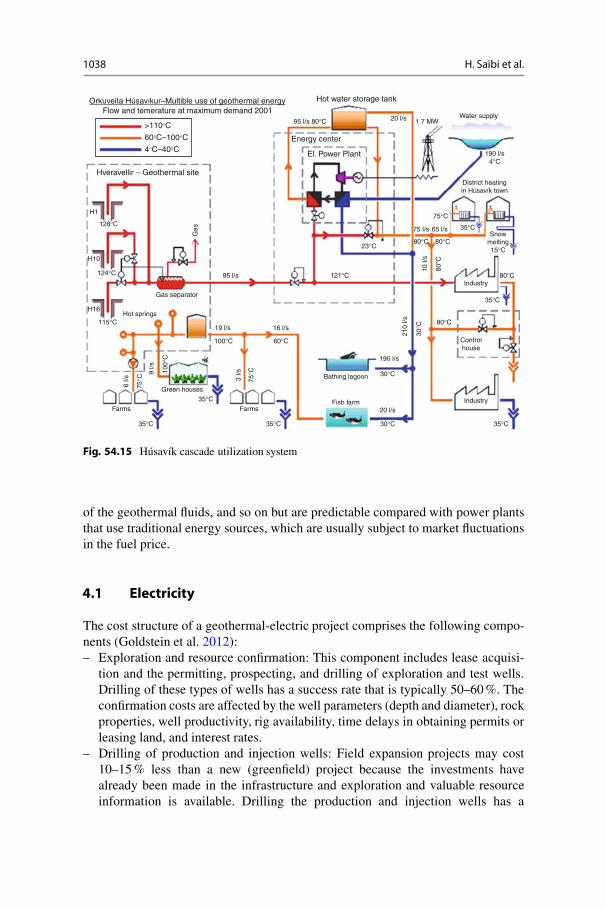
power plant and the tank).– District heating of the town (65 L/s at 80ıC) for 4,400 h/year.– Snow melting system.– 190 L/s to the bathing lagoon at 30ıC.– Fish farm with 20 L/s at 30ıC.Moreover, high-temperature springs of 34 L/s at 100ıC, related to the geothermalfield, are directly used for the following applications:– Farms (9 L/s at 65–75ıC)– Greenhouses (9 L/s at 100ıC cooled down to 35ıC)– Additional 16 L/s at 60ıC to a fish farmThe sketch of the system is given in Fig. 54.15.
The overall energy balance of the system is as follows: the wells produce339 GWh yearly, and 120 GWh is available from the hot springs; 48 GWy is usedfor space heating, 9 GWy for tap water, 12 GWh for electricity production, 10 GWhfor the two levels of industry (for 6,000 h/year), 45 GWh for fish farming, 1 GWhfor snow melting, and finally 177 GWh for the bathing lagoon. Thirty percent of theenergy is reinjected or lost during transportation.
The total capital investment for the entire project was 12 Meuro, with about 66 %of the cost for the district heating network, and only 4 Meuro for the CHP plant. TheHusavık municipality covered 92 % of the investment.
4 Economic Analysis
As with other renewable energy technologies, geothermal projects have high up-front costs (mainly due to the cost of drilling the wells) and low operational costs.These operational costs vary from one project to another due to the size, the quality
1038 H. Saibi et al.
Orkuveita Húsavíkur–Multible use of geothermal energyFlow and temerature at maximum demand 2001
>110°C
60°C–100°C
4°C–40°C
Hveravellir – Geothermal site
H1
128°C
124°C
Gas separator
Green houses
35°C
35°C
100°C
190 l/s
75 l/s
20 l/s
Hot water storage tank
65 l/s
60°C
Bathing lagoon
Fish farm
19 l/s
95 l/s
16 l/s
20 l/sIndustry
Industry
Snowmelting15°C
District heatingin Húsavík town
Controlhouse
Farms Farms
35°C 30°C 35°C
30°C
80°C
80°C80°C
80°C
35°C
80°C121°C
75°C
190 l/s4°C
95 l/s 80°C
Energy center
El. Power Plant
Water supply1.7 MW
35°C
23°C
Hot springs
6 l/s
75°C
100°
C
9 l/s
75°C
30°C
3 l/s
210
l/s
10 l/
s
H16
115°C
H10
Gas
Fig. 54.15 Husavık cascade utilization system
of the geothermal fluids, and so on but are predictable compared with power plantsthat use traditional energy sources, which are usually subject to market fluctuationsin the fuel price.
4.1 Electricity
The cost structure of a geothermal-electric project comprises the following compo-nents (Goldstein et al. 2012):– Exploration and resource confirmation: This component includes lease acquisi-
tion and the permitting, prospecting, and drilling of exploration and test wells.Drilling of these types of wells has a success rate that is typically 50–60 %. Theconfirmation costs are affected by the well parameters (depth and diameter), rockproperties, well productivity, rig availability, time delays in obtaining permits orleasing land, and interest rates.
– Drilling of production and injection wells: Field expansion projects may cost10–15 % less than a new (greenfield) project because the investments havealready been made in the infrastructure and exploration and valuable resourceinformation is available. Drilling the production and injection wells has a

54 Geothermal Energy 1039
success rate of 70–90 %. Factors influencing the cost include well productivity(permeability and temperature), well depth, rig availability, vertical or directionaldesign, the use of air or special circulation fluids, the use of special drilling bits,the number of wells, and the financial conditions in a drilling contract.
– Surface facilities and infrastructure: This component includes gathering steamand processing brine, separators, pumps, pipelines, and roads. Vapor-dominatedfields have lower facility costs because brine handling is not required. Factorsaffecting this component are reservoir fluid chemistry, commodity prices (steel,cement), topography, accessibility, slope stability, average well productivityand distribution (pipeline diameter and length), and fluid parameters (pressure,temperature, chemistry).
– Power plant: This component includes the turbines, generator, condenser, electricsubstation, grid hookup, steam scrubbers, and pollution abatement systems.The power plant design and construction costs depend upon the type (flash,back-pressure, binary, dry steam, or hybrid) and the cooling cycle used (water
Table 54.2 Breakdown of current capital costs for typical turnkey geothermal-electric projects(2005 US$)
Typea Concept
Component
Explorationandconfirmation
Drilling(1.5–3 kmdepth)
Surfacefacilities andinfrastructure Power plant Total
1 US$/kWe 475 1,275 350 1,225 3,325
% capex 14 % 38 % 11 % 37 % 100 %2 US$/kWe 30 1,275 350 1,225 2,880
% capex 1 % 44 % 12 % 43 % 100 %3 US$/kWe 25 1,008 300 1,175 2,508
% capex 1 % 40 % 12 % 47 % 100 %4 US$/kWe 24 800 274 1,782 2,880
% capex 1 % 28 % 10 % 61 % 100 %5 US$/kWe 205–560 750–1,500 205–750 1,215–2,240 2,025–3,750
% capex 10–15 % 20–40 % 10–20 % 40–60 % 100 %6 US$/kWe 275–425 750–1,700 425–850 1,500–2,600 3,400–4,300
% capex 8–12 % 20–40 % 10–20 % 40–60 % 100 %7 US$/kWe 530 3,350 1,350 4,720 9,950
% capex 5 % 34 % 14 % 47 % 100 %aType:(1) Greenfield project, 40-MWe single-flash power plant, 200ıC, wells to 2 km depth(2) Expansion project, 40-MWe single-flash power plant, 200ıC, wells to 2 km depth(3) Expansion project, 4 � 25 MWe single-flash power plant (100 MWe), wells to 2.2 km depth(4) Expansion project, 25-MWe single-flash power plant, wells at 1.8 km depth on average(5) Greenfield project, 10–50 MWe condensing power plants(6) Greenfield project, 10–20 MWe binary cycle power plants(7) Greenfield project, �4 MWe binary cycle power plant, low temperature, wells to 2,750 m depth
1040 H. Saibi et al.
or air cooling). Other factors affecting power plant costs are fluid enthalpy(resource temperature) and chemistry, location, cooling water availability, andthe economies of scale (a larger size is cheaper).
Table 54.2 presents the breakdown of current capital costs (capex) for typicalgeothermal-electric projects in 2005 US$.
Labor and material costs are estimated to account for 40 % each of the totalproject construction costs. Labor costs can increase by 10 % when a resource isremotely located. In addition to raw materials and labor, the choice of power plantsize is a key factor in determining the ultimate cost of a plant. For example, usinga single 50-MWe plant instead of multiple 10-MWe plants can decrease the powerplant costs per kilowatt by approximately 30–35 % for binary systems. The installedcost per kilowatt for a 100-MWe flash steam plant can be 15–20 % less than that ofa 50-MWe plant.
4.2 Direct Uses
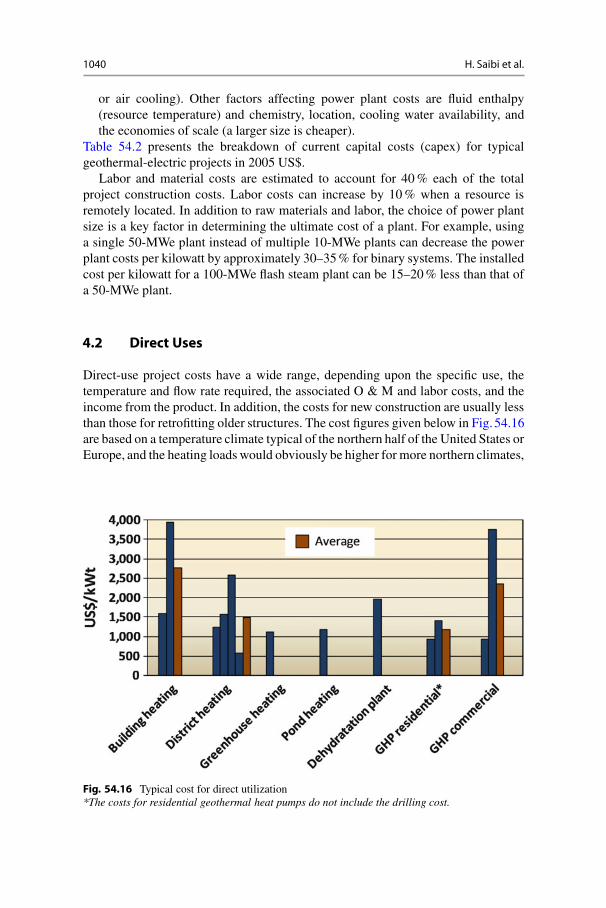
Direct-use project costs have a wide range, depending upon the specific use, thetemperature and flow rate required, the associated O & M and labor costs, and theincome from the product. In addition, the costs for new construction are usually lessthan those for retrofitting older structures. The cost figures given below in Fig.54.16are based on a temperature climate typical of the northern half of the United States orEurope, and the heating loads would obviously be higher for more northern climates,
Fig. 54.16 Typical cost for direct utilization*The costs for residential geothermal heat pumps do not include the drilling cost.
54 Geothermal Energy 1041
such as Iceland, Scandinavia, and Russia. Most figures are based on the cost in theUnited States (expressed in 2005 US$) but would be similar in developed countriesand lower in developing countries.
5 Summary
Geothermal heat is an energy source that – if properly managed – has the potential tobe abundant, versatile, environmentally acceptable, cost-effective, and sustainableIts sustainability is mainly a result of the vast amount of heat stored in thesubsurface. Extracting this heat, however, is challenging and requires advances inexploration and drilling technology, novel approaches to stimulate reservoirs, andpotentially new working fluids. Moreover, exploitation of thermal energy must beoptimized and carefully managed, which in turn requires good characterizationmethods of the geologic formation and fluid movements within the reservoir.In addition to high-temperature hydrothermal or engineered geothermal systems(EGS) for electricity production, residual heat from deep geothermal fluids or low-temperature resources at shallow depths can be used for a vast variety of applicationsand joint uses on different temperature levels for a high overall degree of efficiency.Finally, reinjection of geothermal fluids closes the loop, providing pressure supportand the working fluid for a sustainable energy production system.
The use of computer modeling in the planning and management of the develop-ment of geothermal fields has become standard practice during the last 20–35 years.Geothermal reservoir simulation was recently used in reservoir engineering practicewith more complex three-dimensional models with a graphical interface. Reservoirevaluation is an important phase prior to installing a geothermal power plant.
Geophysics is an important study phase of the perspective geothermal field. Mainmethods include the following:– Microgravity method: It is an effective geophysical technique that helps monitor
the geothermal reservoirs by measuring the underground mass changes using theGauss theorem in the geothermal reservoirs due to the production and injectionphases and natural recharge or discharge. Repeated microgravity measurementsat geothermal fields are recommended to maintain and advance the sustainableutilization of geothermal resources.
– Electromagnetic method: Monitoring surveys can give information about fluid re-distributions, flow rates, and flow directions caused by production and reinjectionin the geothermal reservoir from the changes of underground electrical resistivityand spontaneous potential at the surface. The shallow survey is preferablyperformed using transient electro magnetic soundings. Deep survey is made byMagneto-Tellurics and can also be applied to delineate faults.
– Microseismic method for the evaluation of the heat source, fluid-flow channels’permeability, and reservoir properties. Combining geothermal reservoir simula-tors with geophysical postprocessors will enhance the numerical modeling of thegeothermal reservoirs and help managers to make good decisions about the futureplan of the geothermal power plant.

1042 H. Saibi et al.
Geothermal projects have high up-front costs (mainly due to the cost of drillingthe wells) and low operational costs. The geothermal plants have low recurring fuelcosts. The costs of heat from direct uses of geothermal heat are competitive withmarket energy prices.
More international courses on geothermal energy need to be developed and alsoneed to increase the number of engineers all over the world by developing universityundergraduate programs in the geothermal field to teach younger generations to takeresponsibility when using this natural and sustainable energy for the safety of thehuman race.
6 Cross-References
�Geothermal Energy
References
R.G. Allis, T.M. Hunt, Analysis of exploitation-induced gravity changes at Wairakei geothermalfield. Geophysics 51, 1647–1660 (1986)
R. Bertani, Geothermal power generation in the world 2005–2010 update report. Geothermics 41,1–29 (2012)
GEO-Geothermal Education Office, Geothermal energy introduction (2001), http://geothermal.marin.org/index.html
GEA, Global Energy Assessment – Toward a Sustainable Future. (International Institute forApplied Systems Analysis, Vienna, Austria and Cambridge University Press, Cambridge andNew York, 2012), p. 1888
B. Goldstein, G. Hiriart, R. Bertani, C. Bromley, L. Gutierrez-Negrin, E. Huenges, H. Muraoka,A. Ragnarsson, J. Tester, V. Zui, Contribution to special report renewable energy sources(SRREN), International panel on climate change (IPPC) (2012)
H. Hjartason, R. Maack, S. Johannesson, GHC Bull. 26, 7–13 (2005)International Energy Outlook, U.S. Energy Information Administration, 292 (2011)J.W. Lund, D.H. Freeston, T.L. Boyd, Direct utilization of geothermal energy 2010 worldwide
review. Geothermics 40(3), 159–240 (2010)M.J. O’Sullivan, K. Pruess, M.J. Lippmann, State of the art of geothermal reservoir simulation.
Geothermics 30, 395–429 (2001)F. Pirajno, Hydrothermal Mineral Deposits (Springer, Berlin, 1992), p. 709K. Pruess, C. Oldenburg, G. Moridis, TOUGH2 user’s guide, version 2.0, report LBNL-43134,
Lawrence Berkeley National Laboratory, Berkeley, CA (1999)H. Saibi, J. Nishijima, S. Ehara, Reservoir monitoring by repeat microgravity measurement at
Obama geothermal field, southwestern Japan. Geothermal and volcanological research reportof Kyushu University, 1, No. 14, 27–31 (2005)