HadoopWorkshopJuly2014
98
Hadoop Session Contribute Summer of Technologies Dieter De Witte (Archimiddle) 15/04/2015 Contribute: Summer Of Technologies 1
-
Upload
dieter-de-witte -
Category
Data & Analytics
-
view
56 -
download
0
Transcript of HadoopWorkshopJuly2014

Hadoop SessionContribute Summer of Technologies
Dieter De Witte (Archimiddle)
15
/04
/20
15
Co
ntr
ibu
te: S
um
me
r O
f T
ech
no
log
ies
1

Session OverviewI. Introduction:
I.A Big Data Introduction
I.B Hadoop Distributions
II. Hadoop Architecture
III. Hadoop Ecosystem & Design Patterns
IV. Soccer dataset: Introduction & Metadata Parsing
V. Introduction to Data Science: Decision Trees
VI. Soccer Data Analysis:
VI.A Soccer Game Classification & Prediction
VI.B Individual Player Analysis
VII. Wrap Up
15
/04
/20
15
Co
ntr
ibu
te: S
um
me
r O
f T
ech
no
log
ies
2

I.ABig Data IntroductionHistory. What’s Big Data? What problems does it solve? Use cases.
Comparison with RDBMs.
15
/04
/20
15
Co
ntr
ibu
te: S
um
me
r O
f T
ech
no
log
ies
3

How did it all start?
• Google: Indexing the web? Google File System (2003)
MapReduce (2004)
• 2006: Doug Cutting joins Yahoo and gets a dedicated team to work on his Hadoop project
• 2008: Hadoop becomes a top level Apache Project
• 2008: Hadoop breaks Terasort record: 1TB, 910 nodes, 5 minutes
2009: 59s (1400 nodes)
2009: 3h (3400 nodes) 100TB sort
15
/04
/20
15
Co
ntr
ibu
te: S
um
me
r O
f T
ech
no
log
ies
4

How does it all evolve? http://blog.mikiobraun.de/2013/02/big-data-beyond-map-reduce-googles-papers.html
Did Google sit back and relax?
• 2006: BigTable
• 2010: Percolator: BigTable +individual updates & transactions
• 2010: Pregel: scalable graph computing
• 2010: Dremel: interactive db (real-time)
• 2011: MegaStore (BigTable + schema) focus on distributed consistency
• 2012: Spanner (MegaStore + SQL)
Did the Open Source community?
• HBase (facebook messaging service)
• HBase
dfdfdfdfdfddfddfdfdfdfdfdfdfdfdfdfdfdfdfdfdb
• Apache Giraph, Neo4Jb
• Cloudera’s Impala
15
/04
/20
15
Co
ntr
ibu
te: S
um
me
r O
f T
ech
no
log
ies
5
Doug Cutting: “Google is living a
few years in the future and sending
the rest of us messages”

Today’s data challenges• Data momentum
= Volume * Velocity
• CAP Theorem
Parallel/Cloud computing
=> not only BIG data
=> also complex data analysis!
• DWH solutions are:
Expensive!
Not horizontally scalable
Inflexible schemas
15
/04
/20
15
Co
ntr
ibu
te: S
um
me
r O
f T
ech
no
log
ies
6
• Data Variety Data creation: humans <> machines

Use cases?• Internet of Things:
Everything has an IP
• Customer behaviour analysis:Clickstreams,...
• Social media analysis:Twitter, Facebook, ...
• Fraud Detection:Sample -> full datasets, realtime
• Cognitive computing: IBM Watson:Large scale text mining
• Stack traces complex systems:Discovering system failure patterns
• Energy:Centralized production -> distributed Smart Grids
• Keyword: Personalized ...
Medicine
Janssen + Intel + Univ. = Exascience project
Drug prescription
Insurance
Advertising
Travelling
• A different approach:
Pattern Discovery
<> Pattern Matching
15
/04
/20
15
Co
ntr
ibu
te: S
um
me
r O
f T
ech
no
log
ies
7

Pattern matching versus Discovery• Hadoop is a Data Scientist’s playground:Explore your (big) data, discover new patterns
• RDBMS works with Data Committee Which patterns do we want to store (schema)
• Example from my research background: Where do certain DNA patterns occur?
How to model DNA patterns?
• Cooking analogy:Follow a recipe OR be the cook
15
/04
/20
15
Co
ntr
ibu
te: S
um
me
r O
f T
ech
no
log
ies
8
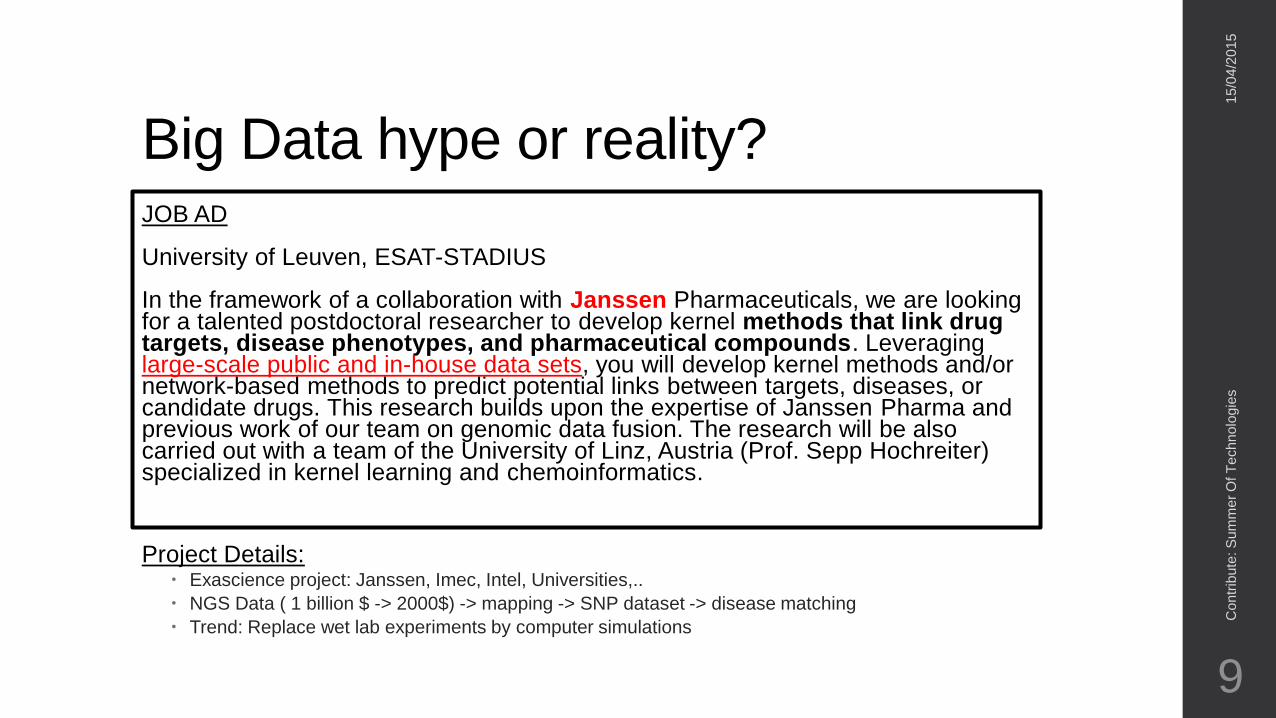
Big Data hype or reality?JOB AD
University of Leuven, ESAT-STADIUS
In the framework of a collaboration with Janssen Pharmaceuticals, we are looking for a talented postdoctoral researcher to develop kernel methods that link drug targets, disease phenotypes, and pharmaceutical compounds. Leveraging large-scale public and in-house data sets, you will develop kernel methods and/or network-based methods to predict potential links between targets, diseases, or candidate drugs. This research builds upon the expertise of Janssen Pharma and previous work of our team on genomic data fusion. The research will be also carried out with a team of the University of Linz, Austria (Prof. Sepp Hochreiter) specialized in kernel learning and chemoinformatics.
Project Details: Exascience project: Janssen, Imec, Intel, Universities,..
NGS Data ( 1 billion $ -> 2000$) -> mapping -> SNP dataset -> disease matching
Trend: Replace wet lab experiments by computer simulations
15
/04
/20
15
Co
ntr
ibu
te: S
um
me
r O
f T
ech
no
log
ies
9

Limitations of classical RDBMshttp://youtu.be/d2xeNpfzsYI?t=3m24s tot 5m00sLecturer: Amr Awadallah (CTO + founder cloudera)
15
/04
/20
15
Co
ntr
ibu
te: S
um
me
r O
f T
ech
no
log
ies
10
• Data streams:
• DataSource -> Storage only (raw)
• Storage layer => ETL => RDBMS => BI
• 3 problems:
• STORAGE TO ETL is problematic: Moving data to compute doesn’t scale
• ETL typically overnight => not enough time too process all data!
• Too much network overhead moving data from storage to compute grid
• Solution? Move the code to where the data is!
• STORAGE TO archiving: Archiving data too early = premature data death
• Archiving too early since storage cost is too high (balance storage cost vs economic value)
• archiving is cheap but retrieval is extremely expensive!
• Solution? Storage has to become cheaper! (Return on byte)
• STORAGE TO BI: No ability to explore the original raw data
• You cannot ask NEW questions! Very inflexible!

15
/04
/20
15
Co
ntr
ibu
te: S
um
me
r O
f T
ech
no
log
ies
11
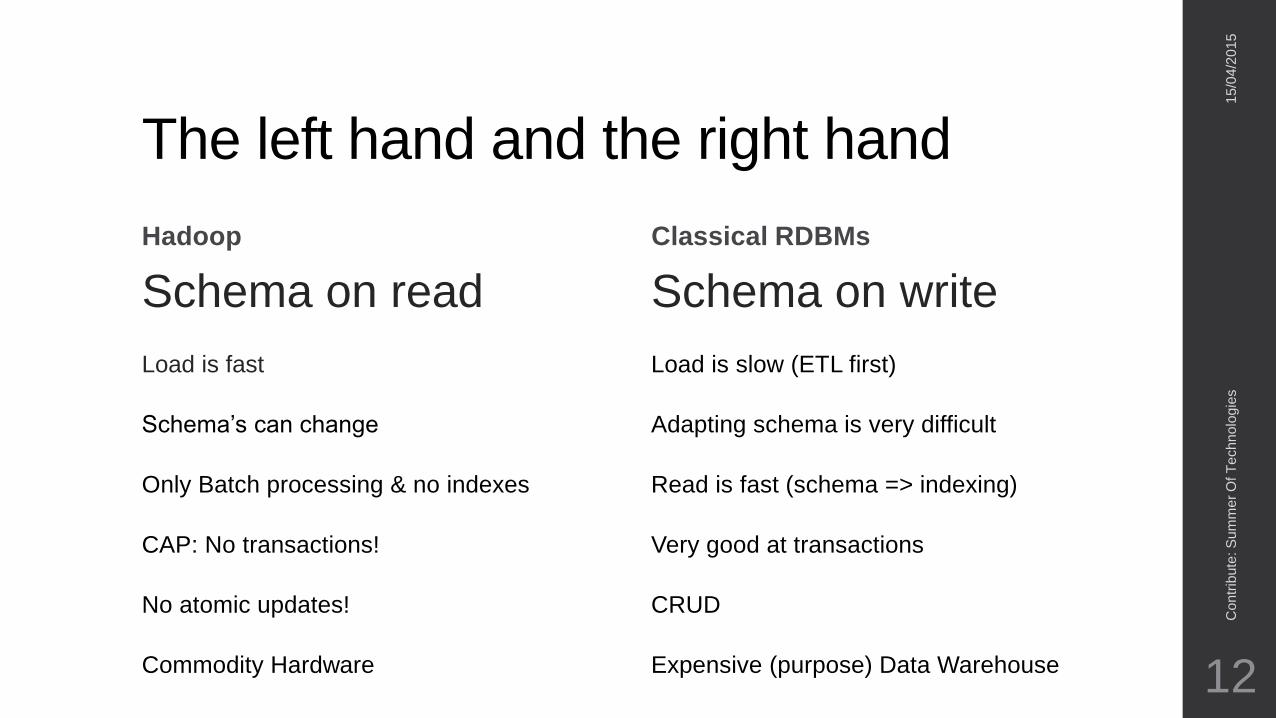
The left hand and the right hand
Hadoop
Schema on read
Load is fast
Schema’s can change
Only Batch processing & no indexes
CAP: No transactions!
No atomic updates!
Commodity Hardware
Classical RDBMs
15
/04
/20
15
Co
ntr
ibu
te: S
um
me
r O
f T
ech
no
log
ies
12
Schema on write
Load is slow (ETL first)
Adapting schema is very difficult
Read is fast (schema => indexing)
Very good at transactions
CRUD
Expensive (purpose) Data Warehouse

The end of my presentation? http://www.businessweek.com/articles/2014-06-
27/google-just-made-big-data-expertise-much-tougher-to-fake 15
/04
/20
15
Co
ntr
ibu
te: S
um
me
r O
f T
ech
no
log
ies
13
For the last five years or so, it’s been pretty easy to pretend you knew something about Big Data. You went to the cocktail party—the one with all the dudes—grabbed a drink and
then said “Hadoop” over and over and over again. People nodded. Absurdly lucrative job offers rolled in the next day. Simple.
Well, Google (GOOG) officially put an end to the good times this week. During some talks at the company’s annual developer conference, Google executives declared that
they’re over Hadoop. It’s yesterday’s buzzword. Anyone who wants to be a true Big Data jockey will now need to be conversant in Flume, MillWheel, Google Cloud Dataflow, and
Spurch. (Okay, I made the last one up.)
Here’s the deal. About a decade ago, Google’s engineers wrote some papers detailing a new way to analyze huge stores of data. They described the method as MapReduce: Data
was spread in smallish chunks across thousands of servers; people asked questions of the information; and they received answers a few minutes or hours later. Yahoo! (YHOO) led
the charge to turn this underlying technology into an open-source product called Hadoop. Hundreds of companies have since helped establish Hadoop as more or less the standard
of modern data analysis work. (startups as Cloudera, Hortonworks, and MapR have their own versions of Hadoop that companies can use, and just about every company that needs
to analyze lots of informatioMuch has been written on this topic.) Such n has its own Hadoop team.
Google probably processes more information than any company on the planet and tends to have to invent tools to cope with the data. As a result, its technology runs a good five to
10 years ahead of the competition. This week, it is revealing that it abandoned the MapReduce/Hadoop approach some time ago in favor of some more flexible data analysis
systems.
One of the big limitations around Hadoop was that you tended to have to do “batch” operations, which means ordering a computer to perform an operation in bulk and then waiting
for the result. You might ask a mainframe to process a company’s payroll as a batch job, or in a more contemporary example, analyze all the search terms that people in Texas
typed into Google last Tuesday.
According to Google, its Cloud Dataflow service can do all this while also running data analysis jobs on information right as it pours into a database. One example Google
demonstrated at its conference was an instantaneous analysis of tweets about World Cup matches. You know, life-and-death stuff.
Google has taken internal tools—those funky-named ones such as Flume and MillWheel—and bundled them into the Cloud Dataflow service, which it plans to start offering to
developers and customers as a cloud service. The promise is that other companies will be able to deal with more information easier and faster than ever before.
While Google has historically been a very secretive company, it is opening up its internal technology as a competitive maneuver. Google is proving more willing than,
say, Amazon.com (AMZN) to hand over the clever things built by its engineers to others. It’s an understandable move, given Amazon’s significant lead in the cloud computing arena.
As for the Hadoop clan? You would think that Google flat-out calling it passé would make it hard to keep hawking Hadoop as the hot, hot thing your company can’t live without. And
there’s some truth to this being an issue.
That said, even the biggest Hadoop fans such as Cloudera have been moving past the technology for some time. Cloudera leans on a handful of super-fast data analysis engines
like Spark and Impala, which can grab data from Hadoop-based storage systems and torture it in ways similar to Google’s.
The painful upshot, however, is that faking your way through the Big Data realm will be much harder from now on. Try keeping your Flume and Impala straight after a couple of gin
and tonics.

Sidenotes:
15
/04
/20
15
Co
ntr
ibu
te: S
um
me
r O
f T
ech
no
log
ies
14
• Hadoop = Distributed storage (HDFS)
+ Compute layer (MapReduce)
• HDFS is NOT QUESTIONED!
• Cloudera is already providing
Spark training

Session OverviewI. Introduction:
I.A Big Data Introduction
I.B Hadoop Distributions
II. Hadoop Architecture
III. Hadoop Ecosystem & Design Patterns
IV. Soccer dataset: Introduction & Metadata Parsing
V. Introduction to Data Science: Decision Trees
VI. Soccer Data Analysis:
VI.A Soccer Game Classification & Prediction
VI.B Individual Player Analysis
VII. Wrap Up
15
/04
/20
15
Co
ntr
ibu
te: S
um
me
r O
f T
ech
no
log
ies
15

Cloudera, Hortonworks, MapR (and Intel’s Hadoop Distribution)
15
/04
/20
15
Co
ntr
ibu
te: S
um
me
r O
f T
ech
no
log
ies
16
I.B Hadoop Distributions

Forrester Wave: Enterprise hadoop solutions (2012)
15
/04
/20
15
Co
ntr
ibu
te: S
um
me
r O
f T
ech
no
log
ies
17

Performance of vendors on common queries
15
/04
/20
15
Co
ntr
ibu
te: S
um
me
r O
f T
ech
no
log
ies
18
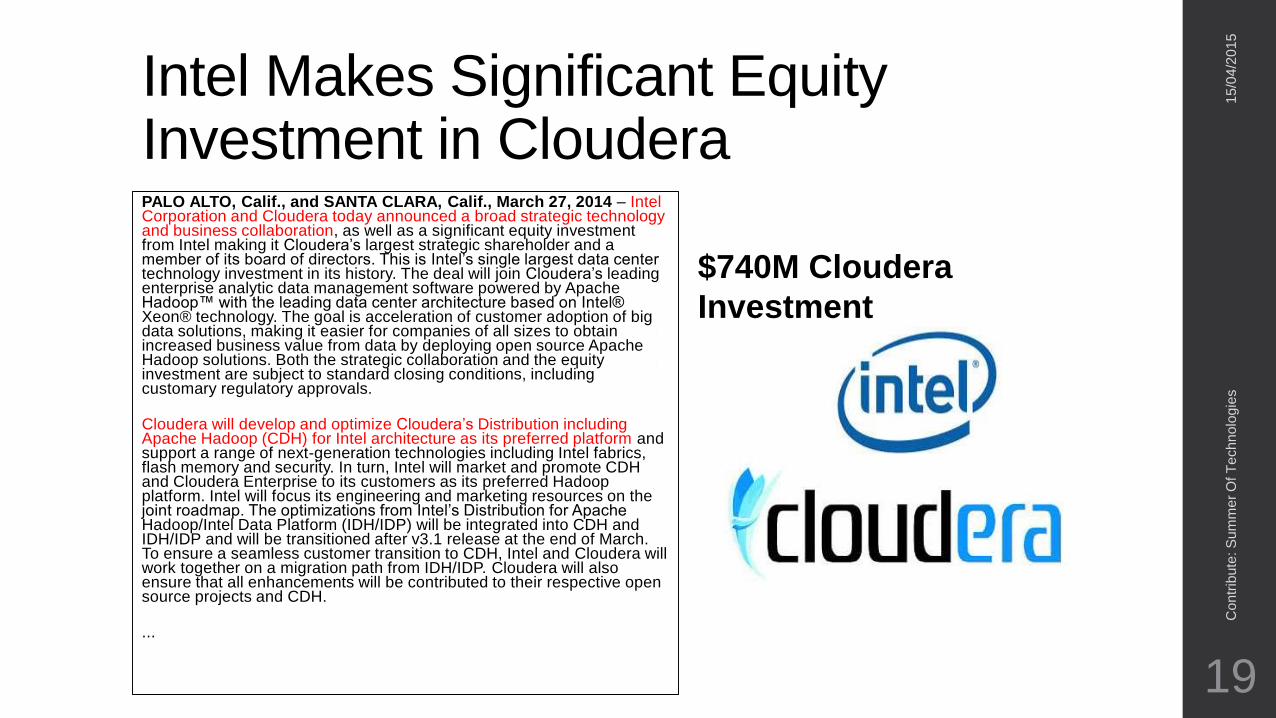
Intel Makes Significant Equity Investment in Cloudera
15
/04
/20
15
Co
ntr
ibu
te: S
um
me
r O
f T
ech
no
log
ies
19
$740M Cloudera
Investment
PALO ALTO, Calif., and SANTA CLARA, Calif., March 27, 2014 – Intel Corporation and Cloudera today announced a broad strategic technology and business collaboration, as well as a significant equity investment from Intel making it Cloudera’s largest strategic shareholder and a member of its board of directors. This is Intel’s single largest data center technology investment in its history. The deal will join Cloudera’s leading enterprise analytic data management software powered by Apache Hadoop™ with the leading data center architecture based on Intel® Xeon® technology. The goal is acceleration of customer adoption of big data solutions, making it easier for companies of all sizes to obtain increased business value from data by deploying open source Apache Hadoop solutions. Both the strategic collaboration and the equity investment are subject to standard closing conditions, including customary regulatory approvals.
Cloudera will develop and optimize Cloudera’s Distribution including Apache Hadoop (CDH) for Intel architecture as its preferred platform and support a range of next-generation technologies including Intel fabrics, flash memory and security. In turn, Intel will market and promote CDH and Cloudera Enterprise to its customers as its preferred Hadoop platform. Intel will focus its engineering and marketing resources on the joint roadmap. The optimizations from Intel’s Distribution for Apache Hadoop/Intel Data Platform (IDH/IDP) will be integrated into CDH and IDH/IDP and will be transitioned after v3.1 release at the end of March. To ensure a seamless customer transition to CDH, Intel and Cloudera will work together on a migration path from IDH/IDP. Cloudera will also ensure that all enhancements will be contributed to their respective open source projects and CDH.
...

Session OverviewI. Introduction:
I.A Big Data Introduction
I.B Hadoop Distributions
II. Hadoop Architecture
III. Hadoop Ecosystem & Design Patterns
IV. Soccer dataset: Introduction & Metadata Parsing
V. Introduction to Data Science: Decision Trees
VI. Soccer Data Analysis:
VI.A Soccer Game Classification & Prediction
VI.B Individual Player Analysis
VII. Wrap Up
15
/04
/20
15
Co
ntr
ibu
te: S
um
me
r O
f T
ech
no
log
ies
20
II. Hadoop Architecture HDFS & MR architecture
Figures: Hadoop in practice, Data-intensive Text Processing, Hadoop: the definitive guide
15
/04
/20
15
Co
ntr
ibu
te: S
um
me
r O
f T
ech
no
log
ies
21
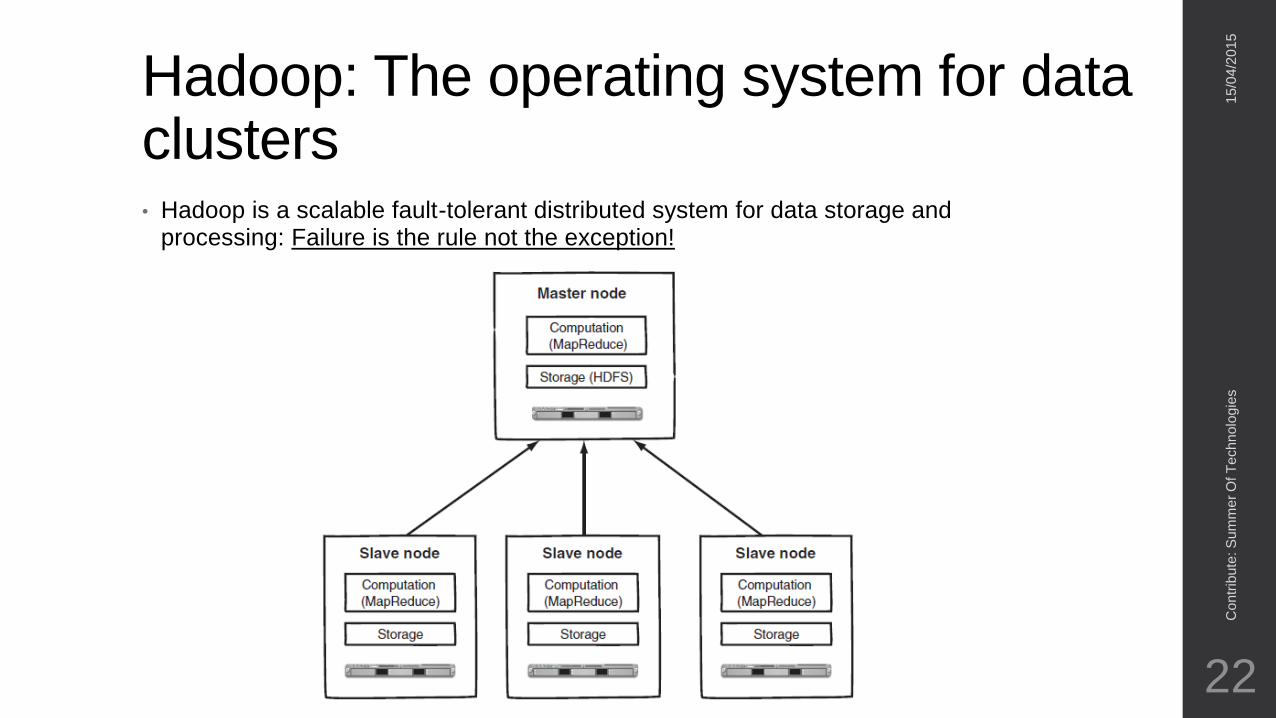
Hadoop: The operating system for data clusters• Hadoop is a scalable fault-tolerant distributed system for data storage and
processing: Failure is the rule not the exception!
15
/04
/20
15
Co
ntr
ibu
te: S
um
me
r O
f T
ech
no
log
ies
22
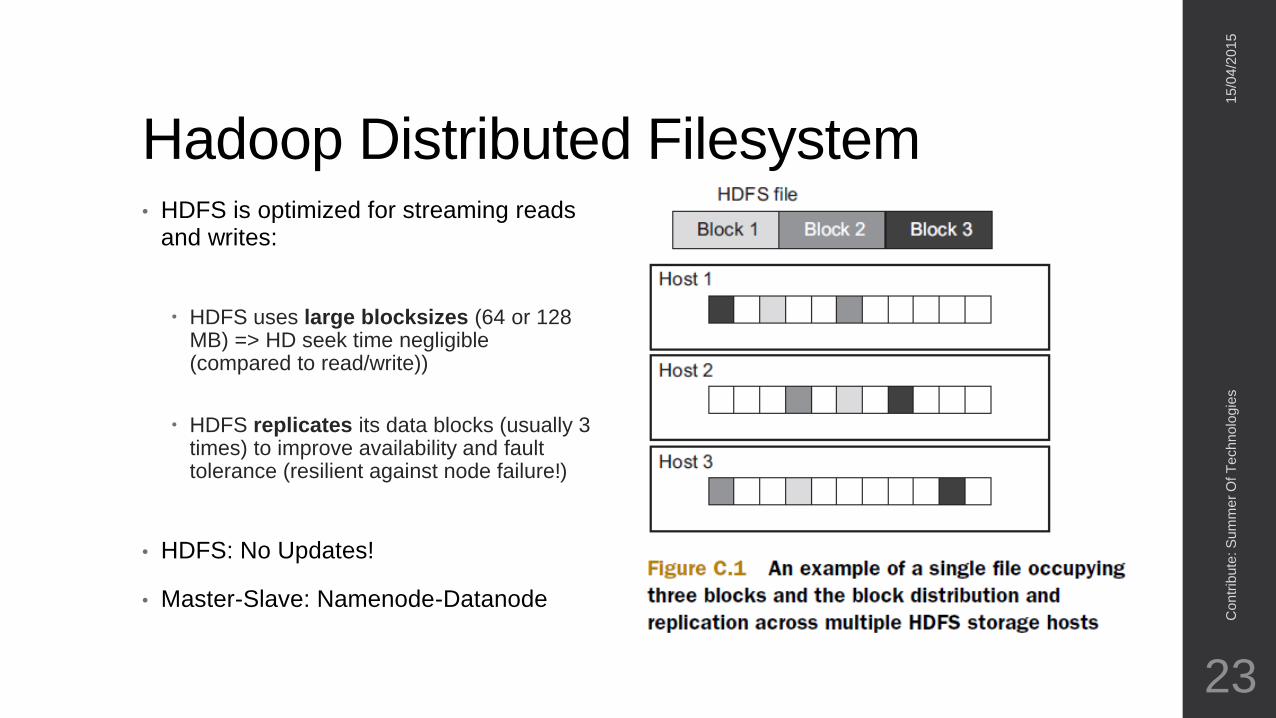
Hadoop Distributed Filesystem• HDFS is optimized for streaming reads
and writes:
HDFS uses large blocksizes (64 or 128 MB) => HD seek time negligible (compared to read/write))
HDFS replicates its data blocks (usually 3 times) to improve availability and fault tolerance (resilient against node failure!)
• HDFS: No Updates!
• Master-Slave: Namenode-Datanode
15
/04
/20
15
Co
ntr
ibu
te: S
um
me
r O
f T
ech
no
log
ies
23

Hadoop reads
15
/04
/20
15
Co
ntr
ibu
te: S
um
me
r O
f T
ech
no
log
ies
24
• NameNode is single point
of failure
• DataNodes store the
blocks & report block health
to NameNode
• NameNode stores:
• File – Block mapping
• Block – Node mapping
Hadoop writes
15
/04
/20
15
Co
ntr
ibu
te: S
um
me
r O
f T
ech
no
log
ies
25
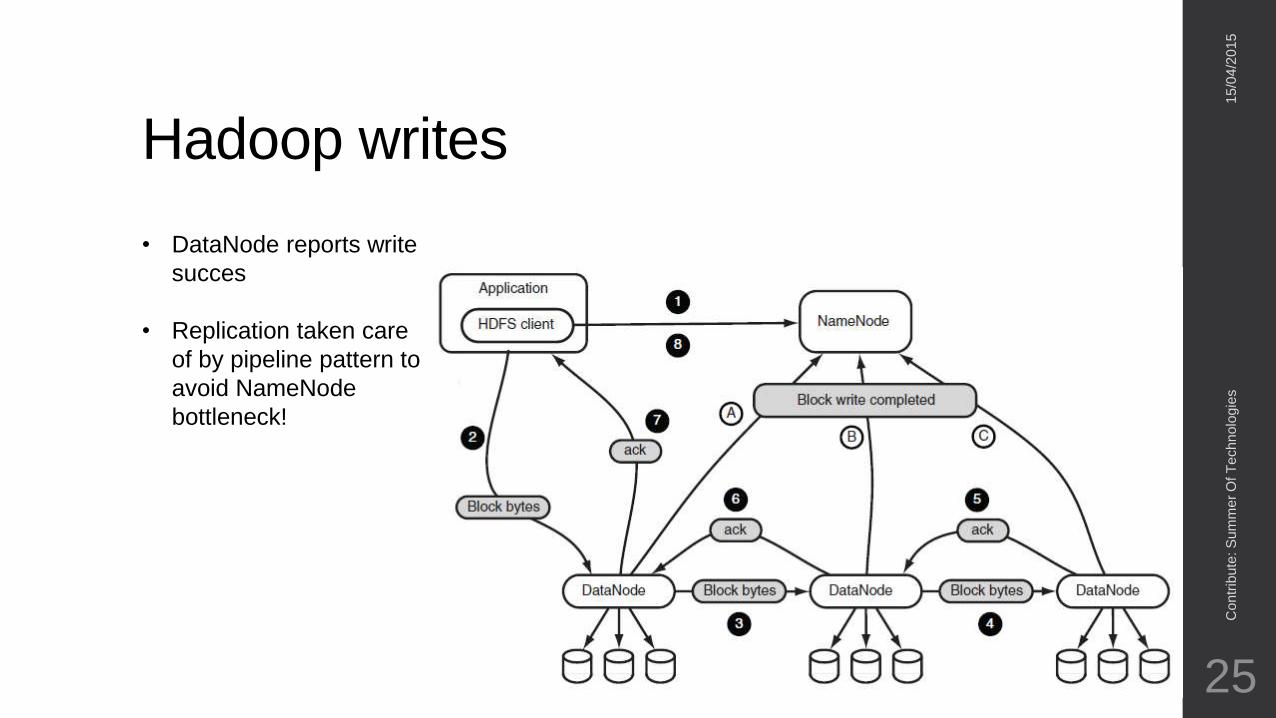
• DataNode reports write
succes
• Replication taken care
of by pipeline pattern to
avoid NameNode
bottleneck!

MapReduce execution engine
15
/04
/20
15
Co
ntr
ibu
te: S
um
me
r O
f T
ech
no
log
ies
26
• Master-Slave: JobTracker-TaskTracker
• JT schedules map and reduce tasks on TaskTrackers
• JT tries to schedule the work near the data => Move algorithm NOT data
• JT sends heartbeats to TTs to check health
• If a task fails 4 times => JOB failure
• If a TT fails 4 times => Removed from pool
• A TT has Map & Reduce slots to run M & R tasks
• Anything can be configured!
Data flow
15
/04
/20
15
Co
ntr
ibu
te: S
um
me
r O
f T
ech
no
log
ies
27
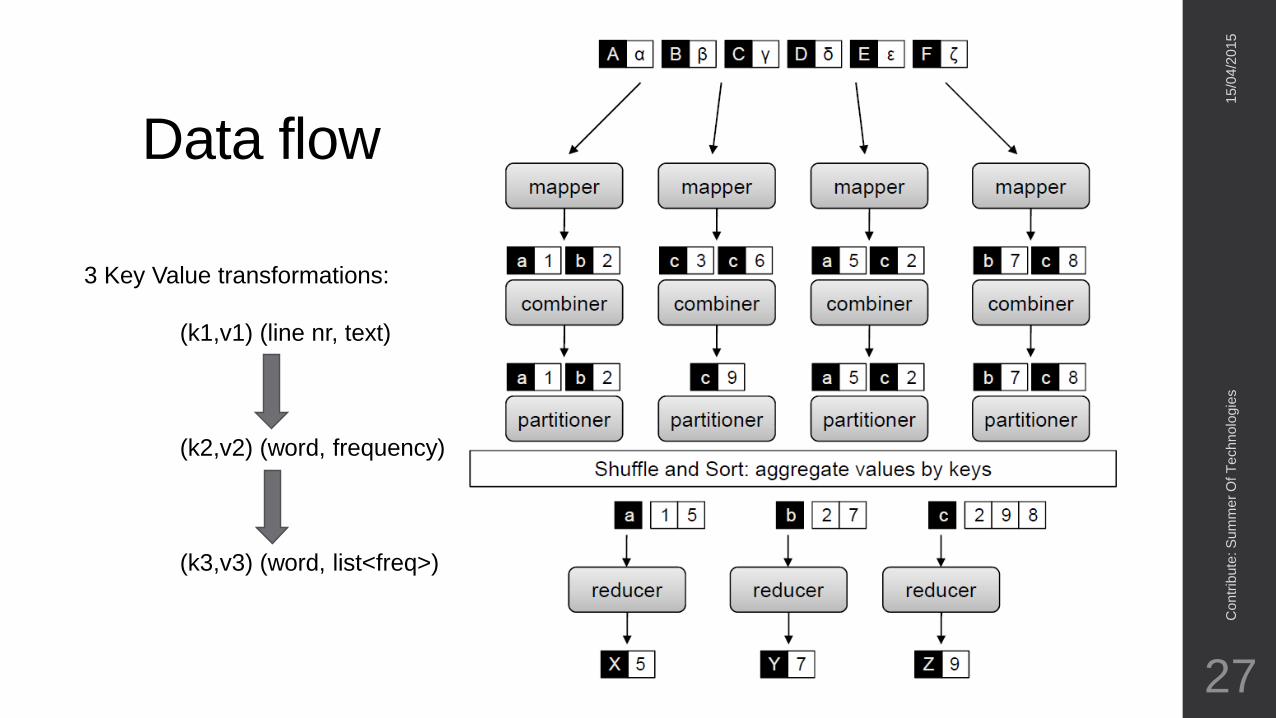
3 Key Value transformations:
(k1,v1) (line nr, text)
(k2,v2) (word, frequency)
(k3,v3) (word, list<freq>)

Ser/De in Hadoop• A Mapper processes an InputSplit = { (k1,v1), (k2,v2), (k3,v3), ... }
• How is an InputSplit defined?
• InputFormat class splits input and RecordReader generates KV pairs from split (TextInputFormat: split = slice of file, record = line of text)
• InputFormat tries to make splits = file blocks in HDFS
=> DATA LOCALITY
• Custom InputFormats possible : JSON, XML, SequenceFiles, ...
• Hadoop has its own serialization types: WritableComparables (Text, IntWritable, FloatWritable, BytesWritable,...)
15
/04
/20
15
Co
ntr
ibu
te: S
um
me
r O
f T
ech
no
log
ies
28

15
/04
/20
15
Co
ntr
ibu
te: S
um
me
r O
f T
ech
no
log
ies
29
InputFormats
Session OverviewI. Introduction:
I.A Big Data Introduction
I.B Hadoop Distributions
II. Hadoop Architecture
III. Hadoop Ecosystem & Design Patterns
IV. Soccer dataset: Introduction & Metadata Parsing
V. Introduction to Data Science: Decision Trees
VI. Soccer Data Analysis:
VI.A Soccer Game Classification & Prediction
VI.B Individual Player Analysis
VII. Wrap Up
15
/04
/20
15
Co
ntr
ibu
te: S
um
me
r O
f T
ech
no
log
ies
30

III. Hadoop Ecosystem & Design patternsIntro to MapReduce programming; Using the ecosystem to stimulate code reuse;
15
/04
/20
15
Co
ntr
ibu
te: S
um
me
r O
f T
ech
no
log
ies
31

HadoopWord Count
Problem Description
• Given a set of documents, calculate the number of times each word occurs.
• A MapReduce program consists of:
A Driver
A Mapper (optional)
A Reducer (optional)
DRIVER CODE
15
/04
/20
15
Co
ntr
ibu
te: S
um
me
r O
f T
ech
no
log
ies
32

Hello World Hadoop: Word Count• WordCountMapper:
The InputFormat partitions the data in a set of splits.
Each split is fed to a Mapper
A RecordReader generates records = Text Value
The Mapper takes a record an splits the text into words
The Mapper emits every word with frequency one.
• WordCountReducer: Hadoop is responsible for getting all
key-value pairs with the same key to one reducer (parallel sort)
A reducer gets a collection of values which go with a single key (frequencies)
This reducer adds up the frequencies and emits the sum to a file specified in setOutputPath(...)
15
/04
/20
15
Co
ntr
ibu
te: S
um
me
r O
f T
ech
no
log
ies
33

Optimization patterns in MRData-Intensive Text Processing (Lin,Dyer)
Use of Combiners
• A combiner is a mini-reducer which can be run an arbitrary number of times on the output of a mapper before it is streamed to disk
In-Mapper Combiner design pattern
• Create a HashMap in your Mapper class in which you store all (word,frequency) pairs, emit when mapper has finished with a split
• Drawback: Hashmap must fit in memory!
15
/04
/20
15
Co
ntr
ibu
te: S
um
me
r O
f T
ech
no
log
ies
34
• Each Context.write() streams data to the local filesystem! (BOTTLENECK!)
• HINT: Is it necessary to emit every single (word, 1) pair from the mapper?

NLP: Word co-occurrence matricesData-Intensive Text Processing (Lin,Dyer)
Problem Description
• For each word we want to calculate the relative frequencies of words co-occurring with this word (in the same sentence).
• Example: (dog,cat) occurs 2 times, (dog,walking)
occurs 3 times then the results should be:
=> (dog,cat) = 40%, (dog,walking) = 60%
• Requirements? We must count all word co-occurrences &
sum all the (dog,*) combinations to calculate the relative frequencies
MAPPERv1
15
/04
/20
15
Co
ntr
ibu
te: S
um
me
r O
f T
ech
no
log
ies
35

Relative frequencies!
Problem
• We need to know how much time dog occurs together with any other word in orde to calculate the relative frequencies!
• Solution emit (dog,*) pairs as well!
MAPPERv2
15
/04
/20
15
Co
ntr
ibu
te: S
um
me
r O
f T
ech
no
log
ies
36

How to get the data to the reducer?
Problem
• (dog,*), (dog,cat), (dog,walking) are different keys, they might end up in a different reducer!!!
• MapReduce possibilities MapReduce has a Partitioner which decides
where each K,V must go
MapReducer has a GroupingComparator to decide which K,V pairs end up in one reducer group
MapReduce has a SortComparator to decide on how to sort the K,V pairs in the reducer group
15
/04
/20
15
Co
ntr
ibu
te: S
um
me
r O
f T
ech
no
log
ies
37

Partitioner and Reducer
15
/04
/20
15
Co
ntr
ibu
te: S
um
me
r O
f T
ech
no
log
ies
38

Limitations of MapReduce
Problem Description
• MapReduce does NOT stimulate code reuse!
Suppose we have a table and we want to calculate the average, the minimum and the maximum
This can be done with 1 job but to make your code reusable you need 3!
A max job, a min job and an avg job
• MapReduce requires a lot of coding!
• Relational operators such as Joins, Orders,... should only be written once!
Solution?
• On top of MapReduce 2 scripting languages are build which allow one to use relational logic which is then translated in a sequence of MapReduce jobs:
PIG and HIVE
Pig is a Dataflow language: single data transformation
Hive is an sql-like language
Bottom line: you can use hadoop without knowledge of mapreduce!!!!!!
15
/04
/20
15
Co
ntr
ibu
te: S
um
me
r O
f T
ech
no
log
ies
39

Hadoop Ecosystem
15
/04
/20
15
Co
ntr
ibu
te: S
um
me
r O
f T
ech
no
log
ies
40

Pig’s philosophyhttp://pig.apache.org/philosophy.html
• Pigs eat anything relational, nested, unstructured,... data
• Pigs live anywhere Hadoop is not strictly required
• Pigs are domestic animals integration with other languages (Python)
extendible with UDFs
• Pigs fly optimizes its translation to MR jobs
15
/04
/20
15
Co
ntr
ibu
te: S
um
me
r O
f T
ech
no
log
ies
41

Pig Latinhttp://pig.apache.org/docs/r0.8.1/piglatin_ref2.html
• Data types: same as SQL + {tuples, bags, maps}
• LOAD ‘path’ USING PigStorage(delim) AS ... (schema)
• STORE users INTO ‘path’ USING PigStorage(delim)
• DISTINCT operator: only keep unique records
• FILTER operator: FILTER users BY age == 30;
• SPLIT SPLIT users INTO adults IF age >= 18,
children OTHERWISE;
• ORDER ORDER users BY age DESC/ASC;
15
/04
/20
15
Co
ntr
ibu
te: S
um
me
r O
f T
ech
no
log
ies
42

Pig Latin (cont’d)• FOREACH users GENERATE (projection + operations between columns)
name,
age;
• Nesting data with GROUP BY operator: gr = GROUP users BY age;
age_counts = FOREACH gr GENERATE
group as age,
COUNT(users) as people_same_age;
• Unnesting data with FLATTEN operator: FLATTEN(tuple) => each tuple field to separate column
FLATTEN(bag/map) => each bag/map item to separate row
• INNER JOIN: (LEFT/RIGHT/FULL OUTER also possible) JOIN age_counts by age, users by age;
• UNION users1, users2;
15
/04
/20
15
Co
ntr
ibu
te: S
um
me
r O
f T
ech
no
log
ies
43

Pig Latin (cont’d)• String Operators:
SUBSTRING
INDEXOF
SIZE
CONCAT
• Mathematical operators: MIN
MAX
AVG
COUNT
SUM
• Conditional logic with ternary operator: (age > 18 ? ‘adult’ : ‘child’);
15
/04
/20
15
Co
ntr
ibu
te: S
um
me
r O
f T
ech
no
log
ies
44

Example script: min/max/avg rain/month• NOTE: this script will be translated into a single MR job => CODE REUSE!
15
/04
/20
15
Co
ntr
ibu
te: S
um
me
r O
f T
ech
no
log
ies
45

Hadoop 4 you: environment?• Possibilities to run your own Hadoop POC:
1. Develop locally using open source Jars:
Eclipse IDE, IntelliJ
Preferably linux environment or windows + cygwin
2. Testing/Demo:
Setting up your own one-node cluster:
http://www.michael-noll.com/tutorials/running-hadoop-on-ubuntu-linux-single-node-cluster/
Use a preconfigured virtual machine by one of the vendors:
Cloudera VM, HortonWorks VM, MapR VM + VMware or VirtualBox
3. Real cluster
Setting up your own cluster
Elastic MapReduce service of Amazon
15
/04
/20
15
Co
ntr
ibu
te: S
um
me
r O
f T
ech
no
log
ies
46
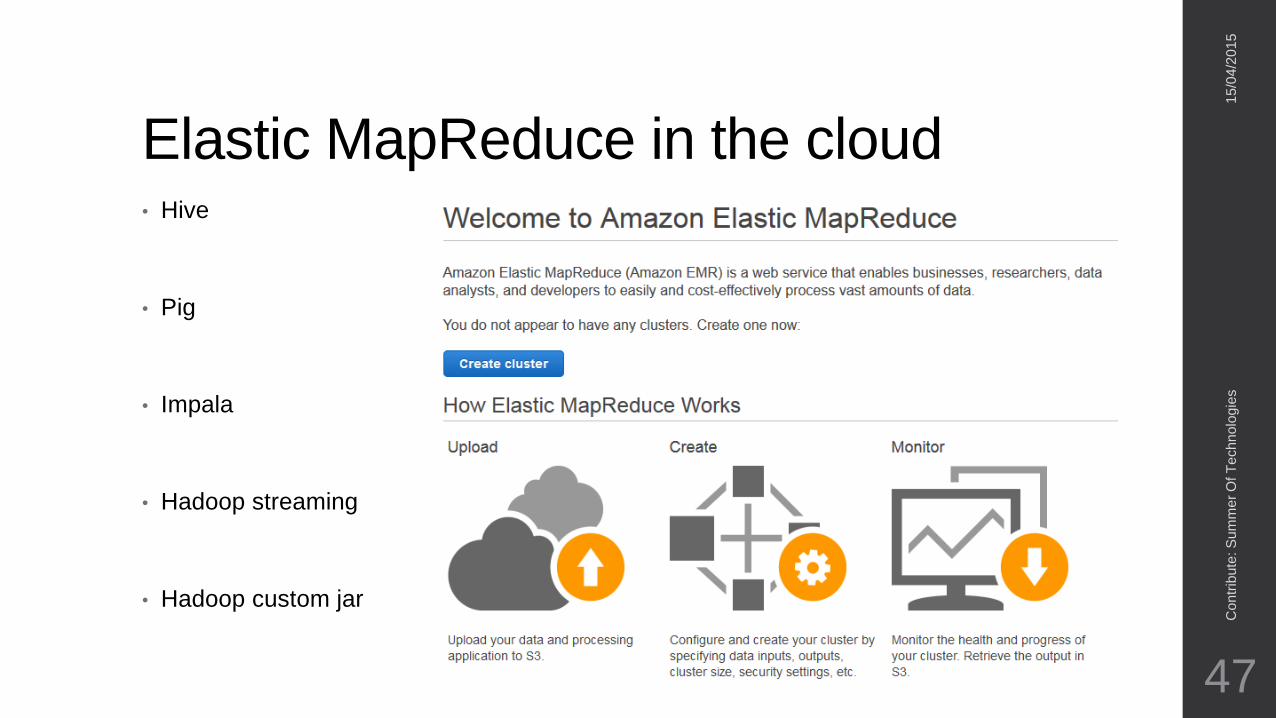
Elastic MapReduce in the cloud• Hive
• Pig
• Impala
• Hadoop streaming
• Hadoop custom jar
15
/04
/20
15
Co
ntr
ibu
te: S
um
me
r O
f T
ech
no
log
ies
47

Conclusion• Pig is a high-level scripting language on top of MapReduce
• Pig stimulates code reuse => It creates a logical plan to run a script in the lowest number of MR jobs
• Pig is very easy to use
• Most people limit themselves to Pig/Hive (ex.: Yahoo!)
• MapReduce gives you full control and allows you to optimize complex jobs: Word Co-Occurrence matrices
• Some relational operators can be hard to implement: How would you implement a JOIN?
15
/04
/20
15
Co
ntr
ibu
te: S
um
me
r O
f T
ech
no
log
ies
48

Session OverviewI. Introduction:
I.A Big Data Introduction
I.B Hadoop Distributions
II. Hadoop Architecture
III. Hadoop Ecosystem & Design Patterns
IV. Soccer dataset: Introduction & Metadata Parsing
V. Introduction to Data Science: Decision Trees
VI. Soccer Data Analysis:
VI.A Soccer Game Classification & Prediction
VI.B Individual Player Analysis
VII. Wrap Up
15
/04
/20
15
Co
ntr
ibu
te: S
um
me
r O
f T
ech
no
log
ies
49

IV. Soccer Dataset: Introduction & Metadata ParsingHow does the data look like? Why use a Big Data approach? Parsing the game metadata. Pig Exercise
15
/04
/20
15
Co
ntr
ibu
te: S
um
me
r O
f T
ech
no
log
ies
50

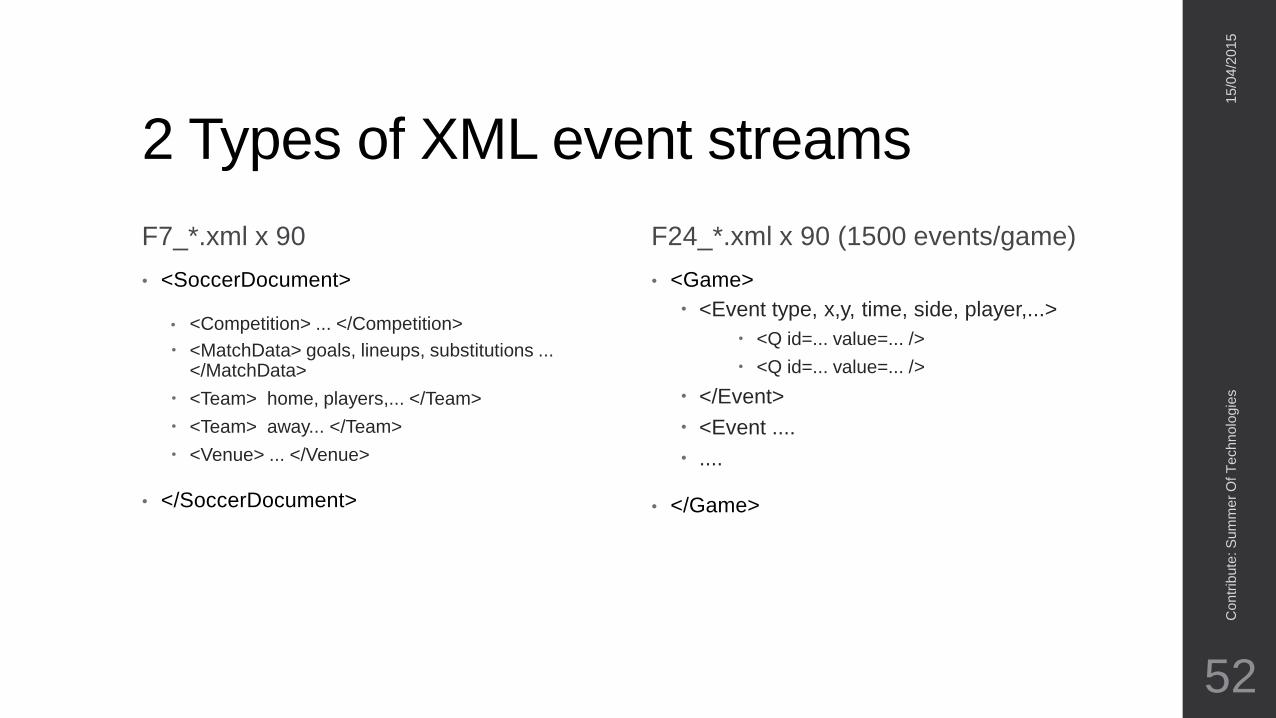
2 Types of XML event streams
F7_*.xml x 90
• <SoccerDocument>
• <Competition> ... </Competition>
<MatchData> goals, lineups, substitutions ... </MatchData>
<Team> home, players,... </Team>
<Team> away... </Team>
<Venue> ... </Venue>
• </SoccerDocument>
F24_*.xml x 90 (1500 events/game)
• <Game>
<Event type, x,y, time, side, player,...>
<Q id=... value=... />
<Q id=... value=... />
</Event>
<Event ....
....
• </Game>
15
/04
/20
15
Co
ntr
ibu
te: S
um
me
r O
f T
ech
no
log
ies
52

Why choose a Big Data approach• The current Opta Sports dataset contains data from 2010-2014 with
(http://fivethirtyeight.com/features/lionel-messi-is-impossible/)
16,574 players
24,904 games (both league and international)
• Our sample dataset contains: 90 games from Bundesliga 2 in 2008-2009
• Arguments? The real dataset IS big!
=>Implement scalable solution to start with!
Processing in parallel is preferable
Schema evolves over time
Data is not relational
Exploratory analysis: not sure what to look for?
Fig.: result of Batch query
15
/04
/20
15
Co
ntr
ibu
te: S
um
me
r O
f T
ech
no
log
ies
53

Our approach?
15
/04
/20
15
Co
ntr
ibu
te: S
um
me
r O
f T
ech
no
log
ies
54

Parsing XML with StAXhttp://www.developerfusion.com/article/84523/stax-the-odds-with-woodstox/
15
/04
/20
15
Co
ntr
ibu
te: S
um
me
r O
f T
ech
no
log
ies
55

Processing F7 files: Code Walktrough
15
/04
/20
15
Co
ntr
ibu
te: S
um
me
r O
f T
ech
no
log
ies
56

Processing F7 files• MR Job generates 4 types of records:
games: “homeTeamID-awayTeamID 3-2”
goals “teamID_playerID 1”
teams “teamID* Freiburg”
players “playerID Dieter De Witte”
• Assignment Reporting with Pig:
Generate topscorer’s list (with playerID, teamID)
Generate the team ranking (with teamID)
15
/04
/20
15
Co
ntr
ibu
te: S
um
me
r O
f T
ech
no
log
ies
57

Pig Script F7 Walktrough
15
/04
/20
15
Co
ntr
ibu
te: S
um
me
r O
f T
ech
no
log
ies
58

Results
15
/04
/20
15
Co
ntr
ibu
te: S
um
me
r O
f T
ech
no
log
ies
59
Top Scoring
players Goals
5052 165 Antonio Di Salvo 7
28323 387 Milivoje Novakovic 7
20856 810 Daniel Gunkel 6
39274 683 Rob Friend 6
4124 683 Oliver Neuville 5
33057 810 Felix Borja 5
38100 2111 Maximilian Nicu 5
12846 680 Marvin Braun 4
11827 810 Markus Feulner 4
10112 683 Sascha Rösler 4
W D L + - Pts
1 683 Borussia Mönchengladbach 6 3 1 23 13 21
2 160 SC Freiburg 6 2 2 15 9 20
3 812 SpVgg Greuther Fürth 5 4 1 15 8 19
4 810 1. FSV Mainz 05 6 1 3 21 12 19
5 165 TSV München 1860 5 3 2 19 13 18
6 2111 SV Wehen Wiesbaden 5 2 3 21 19 17
7 387 1. FC Köln 4 3 3 19 16 15
8 818 Alemannia Aachen 4 2 3 13 10 14
9 1744 OFC Kickers 1901 4 2 4 11 16 14
10 1902 1899 Hoffenheim 4 2 3 13 12 14
11 680 FC St. Pauli 4 0 6 10 16 12
12 2012 TuS Koblenz 3 3 4 14 19 12
13 1755 VfL Osnabrück 3 2 4 10 14 11
14 1741 FC Erzgebirge Aue 3 1 5 14 15 10
15 1772 FC Augsburg 2 3 5 16 21 9
16 163 1. FC Kaiserslautern 1 4 5 7 11 7
17 1757 FC Carl Zeiss Jena 1 3 6 14 22 6
18 1743 SC Paderborn 0 4 6 5 14 4

Session OverviewI. Introduction
I.A Big Data Introduction
I.B Hadoop Distributions
II. Hadoop Architecture
III. Hadoop Ecosystem & Design patterns
IV. Soccer dataset: Introduction & metadata parsing
V. Introduction to Data Science: Decision Trees
VI. Soccer Data analysis:
VI.A Soccer game classification & prediction
VI.B Individual player analysis
VII. Wrap up
15
/04
/20
15
Co
ntr
ibu
te: S
um
me
r O
f T
ech
no
log
ies
60
V. Introduction to Data Science: Decision treesWhat’s data science? Classification with decision trees and random forests
15
/04
/20
15
Co
ntr
ibu
te: S
um
me
r O
f T
ech
no
log
ies
61
The sexiest job of the 21st century! (Harvard
business review)http://hbr.org/2012/10/data-scientist-the-sexiest-job-of-the-21st-century/
• LinkedIn: focus on engineering => keep the social network up and running!
• Jonathan Goldman: What would happen if you presented users with names of people they hadn’t yet connected with but seemed likely to know? (> where you went to school, same company,...)
• Result: Very high click-through rate on ‘People you may know adds’
• DS = high-ranking professional with the training and curiosity to make discoveries in the world of big data
• LinkedIn from ‘empty box’ to 300 Million users

Skillset of a data scientist: (Google afbeeldingen)
Traditional Venn Diagram V2.0 Data science requires a team

Other representationsNSA/Thesis advisor Visualization!!

No clear definition
A Person who is better at statistics than any software engineer and better at software engineering than any statistician
Josh Wills
Sr. Director of Data Science Cloudera

NLP Study reveals:
“More data beats better algorithms”
Algorithms for data science (ML)• Machine learning algorithms are usually categorized as:
supervized versus unsupervized (testset containing the ‘truth’ available?)
input/output are categorical or continuous
• Supervized ex.: Classification (cat.) & Regression (cont.) Classification: Soccerdata->win/draw/loss
Housing prizes versus their size
• Unsupervized ex.: Clustering & Collaborative filtering Can I divide my customers into certain segments based on their behaviour?
Which books does Amazon recommend me based on my previous purchases or based on what similar customers bought?
Classification with
Decision Trees
15
/04
/20
15
Co
ntr
ibu
te: S
um
me
r O
f T
ech
no
log
ies
68

Decision trees• “A decision tree is a flowchart-like structure
in which an internal node represents a test on an attribute, each branch represents the outcome of the test and each leaf node represents a class label”. (Wikipedia)
• Toy example how could we build an optimal tree splitting people into Male/Female based on their: length, hip perimeter and the size of their nose?
• => Put the question (rule) which makes the best split first!
ID Length Hip perimeter Nose length Gender
1 155 70 2 F
2 160 80 2 F
3 165 80 3 F
4 170 75 3 F
5 180 90 2 F
6 190 65 3 M
7 200 60 2 M
8 195 55 3 M
9 185 50 3 M
10 175 50 10 M

Shannon entropy: the best split?• To measure the best split we need an impurity measure: Shannon’s
information entropy (high entropy = high impurity)
• We have two classes: Male (M) & Female (F), 5 each (total T = 10)
• Entropy formula: S = - M/T * log2 M/T - F/T * log2 F/T
• Min(- X log X) = 0 when X=0 or X=1 => perfect split S = 0
• Initial set 5/10 males, 5/10 females: S = 0,34
• Suppose we split one nose length:
• Safter = Sleft + Sright = 0 + 0,31 = 0,31
• Information Gain = Sbefore – Safter = +0,03
• Note: pinnokio branch has S = 0 (completely pure)

Can we do better?
Split on length?
• Safter = Sleft + Sright = 0 + 0,21 = 0,21
• Information Gain = Sbefore – Safter
= +0,13
• Split on hip perimeter would be perfect for this training set
• NOTE: training set is only a sample of the universe!
Scatterplot
15
/04
/20
15
Co
ntr
ibu
te: S
um
me
r O
f T
ech
no
log
ies
71

Democracy versus Totalitarism• Decision trees are rather sensitive to the sample (overfitting!)
• An alternative for a single Decision trees is Random Forest
• A random forest classifier is an ensemble of decision trees BUT:
Each tree recieves only a subset of the training data
Each tree recieves only a subset of the features
• The classification is done by adding the class probabilities together
• How can this work?
Indecisive trees with bad feature sets have probabilities close to 0,5 => have no influence
Example: Tree with only nose length (noselength <0,3): 44% male, 56% female
Example: Tree with length (length > 1m70): 83% male, 17% female
• Side effect of Random Forest training: weights help select the dominant features (feature selection = which features are upmost in the best trees?)
15
/04
/20
15
Co
ntr
ibu
te: S
um
me
r O
f T
ech
no
log
ies
72

Python: SciKit library• SciKit library contains machine learning algorithms
• Accuracy of forest on testset is 100%
15
/04
/20
15
Co
ntr
ibu
te: S
um
me
r O
f T
ech
no
log
ies
73

Session OverviewI. Introduction:
I.A Big Data Introduction
I.B Hadoop Distributions
II. Hadoop Architecture
III. Hadoop Ecosystem & Design Patterns
IV. Soccer dataset: Introduction & Metadata Parsing
V. Introduction to Data Science: Decision Trees
VI. Soccer Data Analysis:
VI.A Soccer Game Classification & Prediction
VI.B Individual Player Analysis
VII. Wrap Up
15
/04
/20
15
Co
ntr
ibu
te: S
um
me
r O
f T
ech
no
log
ies
74

VI.A Soccer Data analyis:Classification & Prediction
15
/04
/20
15
Co
ntr
ibu
te: S
um
me
r O
f T
ech
no
log
ies
75

Classifying soccer games• Outcome = Win/Draw/Loss => Classification
• Use 80 games as a training set, 10 games to evaluate classifier
• Feature vectors:
1 FV = 1 game as (Home vs Away)
Content of FV are soccer statistics: #shots on goal, #passes, #successful passes, #offensive passes, ...
NOTE: eliminate features which have perfect correlation with result: #goals, #assists
Every feature has 2 values: #home passes, #away passes
(#home - #away) / (#home + #away) -> value in [-1,+1]
• NOTE: classification can only be done AFTER the game!

MR Job to extract feature vectors• 55 features per game
• Mapper parses F24_*.xml and creates feature vector, No Reducer required
• Events are regular: contain a set of attributes & qualifiers
Create an Event class with an attributes map and a qualifier map
Create Filter classes to filter events:
AreaFilter, OutcomeFilter, EventIDFilter, QualifierFilter, DirectionFilter
A function that splits a set of events into Home and Away
• Live demo

Accuracy 5/10 + 2 close calls
15
/04
/20
15
Co
ntr
ibu
te: S
um
me
r O
f T
ech
no
log
ies
78

15
/04
/20
15
Co
ntr
ibu
te: S
um
me
r O
f T
ech
no
log
ies
79
Results: feature selection

• Slightly modified MR job: Emit featurevectors for both teams
• Can we predict the outcome of a game based on their history?
• Averaging previous games + calculate feature vector values ( (x-y)/(x+y)
Using an RF classifier for prognosis?
• Use history (9 games) to generate average feature vector
• Use weighted history to generate average feature vector:
• F = (1*F1 + 2*F2 +3*F3 + ...) / (1+2+3+...)
15
/04
/20
15
Co
ntr
ibu
te: S
um
me
r O
f T
ech
no
log
ies
80

Prognosis: results
15
/04
/20
15
Co
ntr
ibu
te: S
um
me
r O
f T
ech
no
log
ies
81

Session OverviewI. Introduction:
I.A Big Data Introduction
I.B Hadoop Distributions
II. Hadoop Architecture
III. Hadoop Ecosystem & Design Patterns
IV. Soccer dataset: Introduction & Metadata Parsing
V. Introduction to Data Science: Decision Trees
VI. Soccer Data Analysis:
VI.A Soccer Game Classification & Prediction
VI.B Individual Player Analysis
VII. Wrap Up
15
/04
/20
15
Co
ntr
ibu
te: S
um
me
r O
f T
ech
no
log
ies
82

VI.B Soccer Data analyis:Individual player analysisExtract and visualize stats, rank players, does our rank reveal talented players?
15
/04
/20
15
Co
ntr
ibu
te: S
um
me
r O
f T
ech
no
log
ies
83

Extracting player stats with MR• Select a number of features of interest: shots on target, passes, ...
• Mapper: extract these stats per game and emit (PlayerID, stats)
• Reducer: aggregate stats per player and emit (PlayerID, (agg_stats, #games))
• Pig: create a player score & player ranking
• Python: visualize player stats in scatter plots
• Live Demo
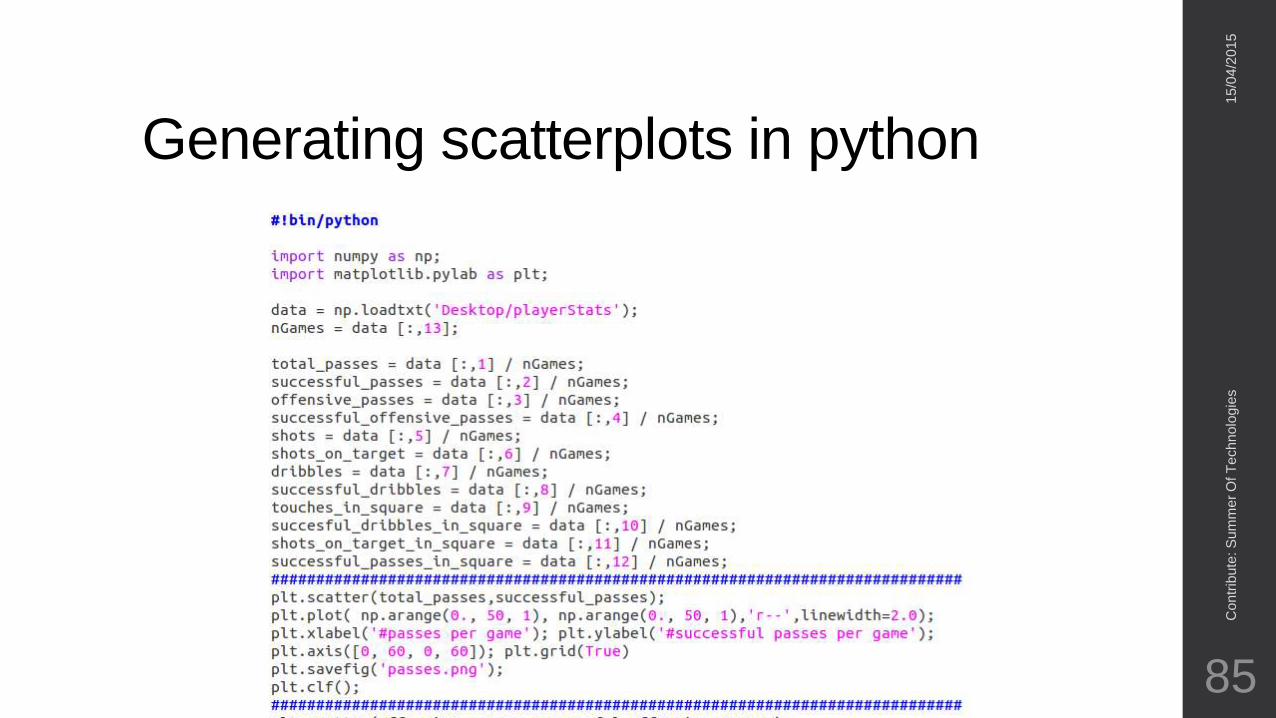
Generating scatterplots in python
15
/04
/20
15
Co
ntr
ibu
te: S
um
me
r O
f T
ech
no
log
ies
85

Player scatterplots in python (1)

Player scatterplots in python (2)

Player scatterplots in python (3)

Player scatterplots in python (4)

Outliers in scatterplots• What about the players excelling in the scatterplots?
• Two categories: Players > 23 and Players <= 23
• Players > 23: No remarkable career: Bundesliga 2 is their level
• Players <= 23: Currently all have a number of caps!
15
/04
/20
15
Co
ntr
ibu
te: S
um
me
r O
f T
ech
no
log
ies
90
Carlos E. Marquez
Brazil
Kazan
Marko Marin
Germany
Chelsea->Sevilla
Chinedu Obasi
Nigeria
Schalke 04
Patrick Helmes
Germany
Wolfsburg
Nando Rafael
Angola
Düsseldorf

Player ranking in Pig• OptaSports has Castroll Index to rank player performance
• Demo Pig: create player ranking based on 2 scores:
Attacker_Score : shots_on_target / avg_sot
+ successful_dribbles / avg_sd
+ touches_in_square / avg_tis
Allround_Score: Attacker_Score
+ successful_offensive_passes / avg_sop
+ successful_passes / avg_sp
Suggestions?

Results: Attackers

Results: Allround
15
/04
/20
15
Co
ntr
ibu
te: S
um
me
r O
f T
ech
no
log
ies
93

Session OverviewI. Introduction:
I.A Big Data Introduction
I.B Hadoop Distributions
II. Hadoop Architecture
III. Hadoop Ecosystem & Design Patterns
IV. Soccer dataset: Introduction & Metadata Parsing
V. Introduction to Data Science: Decision Trees
VI. Soccer Data Analysis:
VI.A Soccer Game Classification & Prediction
VI.B Individual Player Analysis
VII. Wrap Up
15
/04
/20
15
Co
ntr
ibu
te: S
um
me
r O
f T
ech
no
log
ies
94

Wrap up
15
/04
/20
15
Co
ntr
ibu
te: S
um
me
r O
f T
ech
no
log
ies
95
Conclusion Soccer analysis• A random forest classifier can be used both for classification and prediction
• Feature selection tells you which features determine the result
=> improve your classifier by removing features or use in a different classification algorithm
• Classification accuracy is 50%, while 33% is expected by random
• The classification probabilities are very interesting:
Removing the close calls the classification accuracy is 5/8 (62,5%)
Removing the close calls improves the prognosis to 4/8 (50%) and 4/7(57%)
• Scatterplots are an easy tool to select promising players
• Scoring functions based on domain knowledge allow you to rank the players
15
/04
/20
15
Co
ntr
ibu
te: S
um
me
r O
f T
ech
no
log
ies
96

General Conclusion• Big Data is for real!
• The Hadoop ecosystem (PIG) makes Big Data accessible for a broader audience
• Big Data goes hand in hand with Data Science
• A data scientist requires a very broad skillset
• Number crunching is Hadoop’s task, while postprocessing is Python’s
• We introduced Decision trees and Random Forests
• Soccer games are hard to predict but promising players are easy to find
• The speaker likes ents and Pinnokio!?

15
/04
/20
15
Co
ntr
ibu
te: S
um
me
r O
f T
ech
no
log
ies
98
Any Questions?