Hacker Et Al 2012
64
The Insecure American: Economic Experiences, Financial Worries, and Policy Attitudes Jacob S. Hacker Philipp Rehm Mark Schlesinger Abstract Even before the sharp downturn that began in 2007, many Americans were concerned about economic risks. Yet this widespread concern has not been matched by attention from political scientists regarding how citizens experience and understand the economic risks they face or how those experiences and understandings shape their views of public policy. In this article, we develop an argument about the role of personal economic experiences in the development of policy attitudes that we validate using a distinctive opinion survey of our own design, fielded not long after the onset of the Great Recession. The survey tracks citizens’ economic experiences, expectations, and policy attitudes within multiple domains of risk (employment, medical care, family, and wealth arrangements). These investigations show that economic insecurity systematically and substantially affects citizens’ attitudes toward government’s role. Citizens’ economic worries largely track exposure to substantial economic shocks. Citizens’ policy attitudes in turn appear highly responsive to economic worries, as well as to the experience of economic shocks. Attitudes seem most affected by temporally proximate shocks, shocks befalling households that have weak private safety nets, and shocks occurring within the domain most relevant to the policy in question, though policy attitudes are also (more weakly) correlated with shocks in other domains. The magnitude of these associations rivals partisanship and ideology and almost always exceeds that for conventional measures of socio-economic status. Given the long-term increase in insecurity and current sluggish recovery, understanding how insecurity shapes citizens political behavior should be a major concern of political science.
description
Political Science
Transcript of Hacker Et Al 2012

The Insecure American: Economic Experiences, Financial Worries, and Policy Attitudes
Jacob S. Hacker Philipp Rehm
Mark Schlesinger
Abstract
Even before the sharp downturn that began in 2007, many Americans were concerned about economic risks. Yet this widespread concern has not been matched by attention from political scientists regarding how citizens experience and understand the economic risks they face or how those experiences and understandings shape their views of public policy. In this article, we develop an argument about the role of personal economic experiences in the development of policy attitudes that we validate using a distinctive opinion survey of our own design, fielded not long after the onset of the Great Recession. The survey tracks citizens’ economic experiences, expectations, and policy attitudes within multiple domains of risk (employment, medical care, family, and wealth arrangements). These investigations show that economic insecurity systematically and substantially affects citizens’ attitudes toward government’s role. Citizens’ economic worries largely track exposure to substantial economic shocks. Citizens’ policy attitudes in turn appear highly responsive to economic worries, as well as to the experience of economic shocks. Attitudes seem most affected by temporally proximate shocks, shocks befalling households that have weak private safety nets, and shocks occurring within the domain most relevant to the policy in question, though policy attitudes are also (more weakly) correlated with shocks in other domains. The magnitude of these associations rivals partisanship and ideology and almost always exceeds that for conventional measures of socio-economic status. Given the long-term increase in insecurity and current sluggish recovery, understanding how insecurity shapes citizens political behavior should be a major concern of political science.
rehm.16
Typewritten Text
Forthcoming in Perspective on Politics, March 2013. This version: August 30, 2012

The ongoing slow recovery from the worst economic downturn since the Great
Depression has cast in stark relief the economic insecurity of American workers and their
families. The numbing statistics on job loss, depressed home prices, eroding health insurance,
and other economic dislocations speak not just to the health of our economy; but also to the
ability of our government to achieve a key policy goal articulated by political leaders since at
least Franklin Roosevelt—to provide “economic security and independence” in a modern
economy.1
Students of public affairs have long recognized the crucial importance of economic
security, even if they have differed on how to define and study it. From work on such diverse
“isms” as socialism, populism, nativism, and fascism to scholarship on the wellsprings of the
welfare state, popular concerns about economic security have been linked to a wide range of
critical outcomes, 2 particularly concerning redistribution and social insurance.3 In the study of
American politics, the economic basis of political behavior has represented an abiding concern.4
A half century of scholarship has documented robust and persisting patterns of class bias in
participation,5 income stratification in partisan identification and liberal-conservative ideology,6
and strong links between general assessments of the economy and vote choice.7
And yet, even in the wake of the Great Recession, we know strikingly little about how the
experience of major economic dislocations and worries about them affect Americans’ attitudes
toward the economy and politics. This reflects a deeper blind spot in contemporary behavioral
scholarship: Despite much work on the economic roots of political attitudes, the dynamic
economic experiences of citizens have not been a major focus of American politics research. On
the one hand, leading work on citizens’ economic perceptions does not place much emphasis on
personal experience as a shaper of policy views, emphasizing instead “symbolic attitudes”

2
(ideology, partisanship, and so on).8 On the other hand, relatively few sources of evidence allow
us to examine how various sources of economic uncertainty and loss translate into politically
relevant attitudes. More than a quarter century ago, three distinguished scholars of American
politics argued that the “frail measurement of changing personal economic well-being” posed a
major barrier to a fuller understanding of how economic experiences affected citizens’ views of
politics and policy.9 Today, the situation is little improved. Detailed panel studies dominate
research in many subfields of economics, yet these studies contain few if any questions assessing
political or policy attitudes.10 Meanwhile, the main surveys used in political science, including
those that track citizens over time, offer little information about household economic dynamics.
Our ignorance in this regard is all the more disturbing because rising insecurity is one of
the most notable features of the post-1970 American economy.11 Insecurity did not suddenly
appear during the Great Recession, and it is certain to remain a powerful influence on our
politics in the coming years. Over the last generation, the implicit social contract of mid-
twentieth-century—based on longer-term employment, health and retirement security through a
combination of public and private benefits, and broad unionization of the workforce—has come
undone. Many economic risks once borne collectively through public programs or pooled private
benefits (such as traditional, defined-benefit pensions) have shifted back toward workers and
their families. As we will show, worries about major economic risks—high health costs, loss of
health coverage, inadequate retirement income—were already strikingly high before the 2007
recession. And they have remained elevated even with the recession’s official end. Growing
insecurity, moreover, has gone hand in hand with growing inequality and related changes in
American political life, from greater elite polarization to the decreased clout of labor unions and
the increased role of money in elections and lawmaking.12 The result has been rising middle-

3
class economic strains and intensifying political battles over them. Yet political science has had
relatively little to say about the roots or effects of these new realities.
In this article, we begin to fill this gap. We develop an argument about the role of
personal economic experiences in the development of policy attitudes that we validate using a
distinctive opinion survey of our own design, the Survey of Economic Risk Perceptions and
Insecurity (SERPI), fielded not long after the onset of the Great Recession. As part of research
underway when the downturn hit, we had a unique opportunity to examine Americans’
experiences and attitudes during an 18-month interval from March 2008 to September 2009.
Embedded in the 2008-2009 Panel Survey of the American National Election Studies (ANES),
the SERPI affords an unparalleled picture—across two interviews, the first of which contained
extensive retrospective questions—of risk perceptions, economic experiences and worries,
protections against economic loss, and attitudes toward existing and prospective economic
policies. In combination, these features allow us to examine in considerable depth how policy
attitudes were affected by the economic events that disrupted so many lives in 2008 and 2009.
What these investigations show is that economic insecurity shapes policy attitudes in
systematic and significant ways. Citizens’ economic worries largely track exposure to substantial
economic shocks. Citizens’ policy attitudes in turn appear highly responsive to economic
worries, as well as to economic shocks. Attitudes are more closely related to shocks involving
employment and health care (compared with family and wealth), shocks that are more temporally
proximate, and shocks befalling households that have weak private safety nets. These attitudinal
effects are frequently substantial, rivaling and at times exceeding the magnitude of partisanship
and ideology and almost always exceeding the influence of conventional economic measures
used in survey research. For instance, major disruptions to employment—losing a job, having a

4
family member lose a job, or losing substantial time from work due to illness or injury—are
roughly equal predictors of people’s views of the federal government’s responsibility to secure
employment as are partisanship and ideology. Similarly, medical care shocks like losing health
insurance or experiencing high out-of-pocket costs are powerful predictors of attitudes toward
government spending on health insurance, even though these attitudes were reported in the midst
of a highly ideological and partisan debate over national health reform.
In sum, the SERPI provides not only a detailed new picture of citizens’ dynamic
economic experiences. It also allows for a deeper understanding of the relationship among
economic shocks, worries about economic risks, and attitudes toward government and social
policies. Though much existing research has cautioned against assuming that personal economic
experiences shape policy attitudes, we suggest that the proper response is better
conceptualization and measurement of dynamic economic events, not presumptive dismissal.
With regard to conceptualization, we argue that economic worries (how concerned people are
about specific economic risks) provide an important bridge between experience and attitudes.
We also stress what much scholarship has neglected: that economic experiences are dynamic and
multiple. The combination and repetition of shocks shape attitudes in ways that singular events
may not. This can partially be represented in measures of household’s private safety nets, or
“buffers,” such as the amount of savings set aside for hard times—a crucial aspect of
household’s economic circumstances that is in part a running tally of past economic events, in
part a measure of current circumstances, and in part a reflection of future expectations.
Above all, we argue that how insecurity shapes citizens’ political behavior should be a
much greater concern of political science than it is now. Given the long-term increase in
economic insecurity and the ongoing sluggish recovery, the economic ups and downs charted by

5
the SERPI have become an increasingly central aspect of American political life—and need to be
incorporated into our understanding of American political behavior.
We begin to make this case in the next section by discussing the motivation and design of
the survey. We then present our main findings regarding Americans’ experiences in 2008-2009
and how they differed across major lines of cleavage in American society. Finally, we move
from experiences to attitudes, and show that in some domains of risk, personal economic
experiences powerfully shape both citizens’ economic worries and their views of public policy.
The Survey of Economic Risk Perceptions and Insecurity (SERPI)
Our exploration of the impact of economic insecurity on policy attitudes is predicated on
a relatively simple conceptual model, albeit one that incorporates several key attributes absent
from past analyses. Following a substantial body of past research, we define economic insecurity
as the psychologically mediated experience of inadequate protection against hardship-causing
economic risks.13 We presume that households see themselves as insecure when perceived risks
exceed their expected capacity to adjust to or otherwise buffer those risks in ways that do not
cause hardship. Households that see themselves as relatively insecure, we further presume, will
be more supportive of an expansive role for redistributive or risk-buffering public policies.14
Though simple, our conceptual framework departs from past treatments of the political
impact of economic insecurity in three respects. First, in contrast to the conventional wisdom that
personal economic experience has limited relationship to policy attitudes, we posit that economic
shocks can powerfully influence support for policies designed to reduce economic insecurity
within relevant domains. Major economic dislocations not only have the potential to create
economic hardship that translates into immediate support for greater government action; they

6
also teach seminal “lessons” about the prevalence and impact of economic instability that may
shape expectations about the need for government help in the future, as well as more general
orientations toward risk-buffering policies.15 The main manifestation of such lessons in our
framework is individuals’ worries about the future, which are related to but not synonymous
with the experience of economic shocks. Put simply, some households may support risk
buffering policies because they worry about shocks, even though they have not directly
experienced those shocks.
Second, building on an emerging literature in cognitive psychology, we posit that risk
perceptions and preferences are domain specific.16 Consequently, support for policies in any
given domain will be most closely correlated with perceived insecurity within that domain, with
more intense shocks—for example, repeated shocks within a domain—causing greater policy
support. However, we also posit that shocks in other domains of economic risk and households’
past history of shocks can magnify these domain-specific effects. These spillover and cumulative
effects weaken as shocks become less intrinsically relevant to attitudes within the primary
domain and as time passes, since shocks only weakly related to the domain in question or
temporally distant have less bearing on expectations about the future.17
Finally, we posit that a separate pathway through which past and outside-domain shocks
affect attitudes is through their negative effect on household’s capacity to buffer economic
shocks. In other words, the strength of households’ private safety nets is an independent
influence on policy attitudes, with weaker private buffers associated with greater support for
redistributive or risk-buffering policies. Households’ buffers are, in turn, shaped by their past
history of economic shocks. Thus even if shocks may no longer loom large in individuals’

7
thinking, they can be a primary reason why individuals are privately ill-prepared for future
shocks and, hence, more supportive of public protections.
To explore these more nuanced ways in which economic insecurity might shape policy
attitudes, we therefore need to measure the broad spectrum of economic risks, identify how those
risks coincide across different domains of economic life, examine households’ ability to buffer
those risks on their own, and explore how the interaction and cumulative effect of these risks and
buffers alter the public’s worries about their economic security as well as their political and
policy attitudes. The SERPI was designed to provide this broader scope of evidence.
The SERPI in Brief
The SERPI was constructed to measure a wide range of events and perceptions that might
leave families feeling insecure. Fielded twice in 2009 to the same representative sample—over
2,000 respondents repeatedly interviewed as part of the 2008–2009 Panel Survey of the ANES—
the survey tracked the experience in specific economic disruptions, spanning four broad
domains: employment, medical care, familial arrangements, and wealth. In addition to specific
questions about economic dislocations, the SERPI gauged the extent and distribution of
respondents’ worries about economic risks, as well as the capacity of households to safeguard
themselves against economic risks or to buffer the financial shocks that they experienced,
including individuals’ assessment of how long it would take for a typical household to recover
from various adverse events. Finally, the survey asked an extensive set of questions assessing
spending preferences on existing programs and support for additional policies and programs.
Because the SERPI was incorporated as a part of the ANES Panel Survey, data collected on
economic experiences, perceptions and expectations during these two waves can be merged with

8
socio-demographic and other personal characteristics and attitudinal measures (such as reported
partisanship and ideology) collected from respondents in other waves of the survey.
The sections to come explain the SERPI in greater detail. Here, we briefly introduce our
key measures: (1) questions designed to assess the scope of economic insecurity in four broad
domains, (2) questions regarding the capacity of various existing arrangements to buffer against
economic risk, (3) assessments of other aspects of the economy that allow us to distinguish the
impact of insecurity from other economic concerns, and (4) our measures of support for public
policies that might protect Americans against these risks.
The Scope of Insecurity. The heart of the survey was an extensive set of questions about
people’s encounters with unstable economic circumstances—or what we call “economic
shocks”—in both the recent and more distant past (see Table 1). In the March 2009 wave,
respondents were asked about whether they had experienced such shocks in the prior twelve
months; in September 2009, the same respondents were asked if they had experienced the shocks
in the prior six months. For those completing both waves of the survey, therefore, we have
information about shocks that occur in two bounded periods—March 2008-March 2009 and
March-September of 2009—providing a unique 18-month history (March 2008-September 2009)
of Americans’ experiences during the recession.
[Insert Table 1 About Here]
In addition to asking about the experience of economic shocks, we also asked
respondents about their level of worry about those same risks, as well as about their economic
security in general. Because “economic security” is not a term in common usage, it was defined
in the opening question as “your security in being able to keep your job, maintain your income,
have health insurance coverage, and retire comfortably.” Respondents were then asked about

9
their extent of worry regarding more specific outcomes in the four domains. To allow
comparison of pre- and post-recession responses, the SERPI questions regarding worry
(including the definition of economic security) were modeled after a poll sponsored by the
Rockefeller Foundation in February 2007.18 We return to this comparison in the next section.
Risk Buffers. As already discussed, the extent to which economic uncertainty feels
threatening depends in large part on a household’s capacity to buffer economic shocks should
they occur.19 To assess the capacity and distribution of these risk buffers, the SERPI included a
series of questions about households’ debt levels and financial reserves, use of retirement
accounts to finance current bills, and ability to borrow from “family members and close friends”
in a time of need.
At the core of these measures is respondents’ own estimates of how long their household
could get by, without hardship, if their current earnings stopped. As Figure 1 shows, self-
reported buffering capacity is both variable and relatively low. Just over 29 percent of the
American public reported that their household could go six months or longer without
experiencing hardship if their earnings were to stop. Nearly half of households could go no
longer than two months, however, and one in five could last no more than two weeks. A common
threshold in the literature on earnings risk is the capacity to go at least three months without
hardship if earnings stop.20 Using this as a standard for adequate reserves, more than half the
American population appears to lack adequate buffers to deal with economic shocks.
[Insert Figure 1 About Here]
Economic Assessments. Past analyses of the economic roots of public support for social
policies have focused on citizens’ general perceptions of the state of the economy. Our
comprehensive measures of self-assessed household insecurity make it possible to differentiate
10
expectations for the macro-economy from anticipations of how the national economy will affect
the household’s economic stability—a crucial distinction, as we will show. To incorporate
general economic assessments, we draw upon two measures from October 2008 (wave 10): a
short term retrospective question (is the economy better or worse than a year ago) and a question
about expected prospects for the economy over the next year. Most (92.4 percent) of Americans
felt national economic conditions had worsened between October 2007 and October 2008. Yet
the majority (72 percent) was relatively optimistic about the economy’s immediate future,
anticipating it would remain stable or improve in the next year.
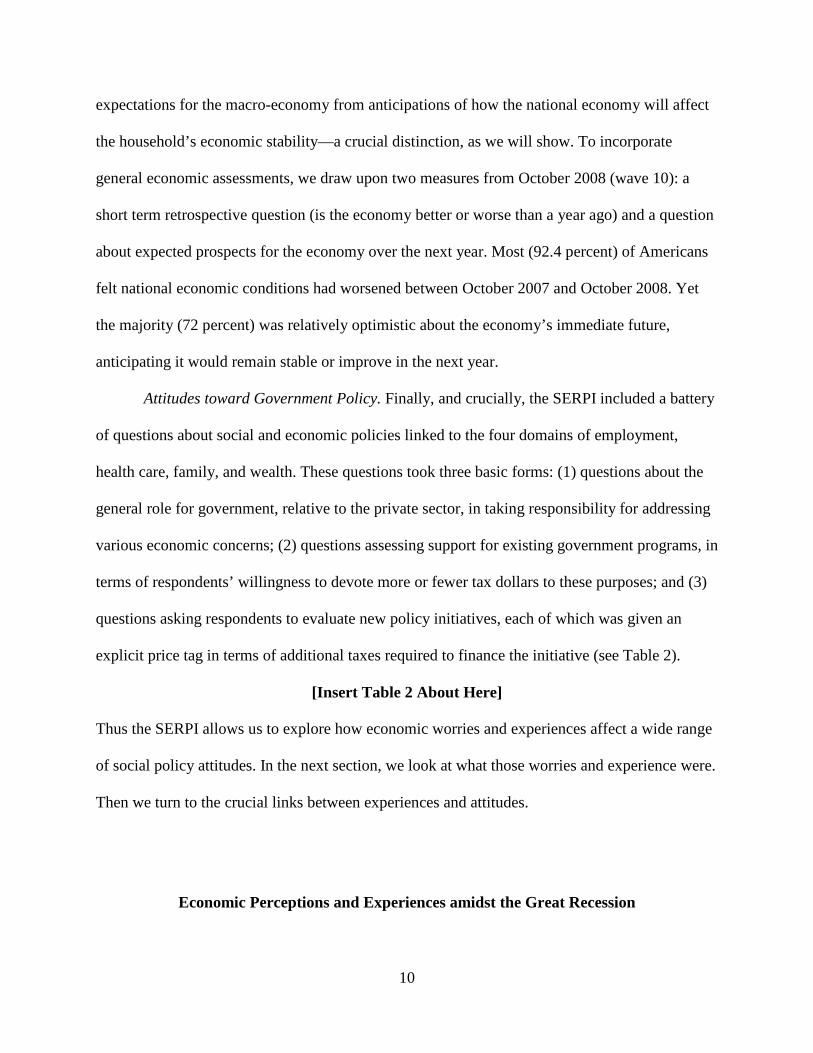
Attitudes toward Government Policy. Finally, and crucially, the SERPI included a battery
of questions about social and economic policies linked to the four domains of employment,
health care, family, and wealth. These questions took three basic forms: (1) questions about the
general role for government, relative to the private sector, in taking responsibility for addressing
various economic concerns; (2) questions assessing support for existing government programs, in
terms of respondents’ willingness to devote more or fewer tax dollars to these purposes; and (3)
questions asking respondents to evaluate new policy initiatives, each of which was given an
explicit price tag in terms of additional taxes required to finance the initiative (see Table 2).
[Insert Table 2 About Here]
Thus the SERPI allows us to explore how economic worries and experiences affect a wide range
of social policy attitudes. In the next section, we look at what those worries and experience were.
Then we turn to the crucial links between experiences and attitudes.
Economic Perceptions and Experiences amidst the Great Recession

11
The SERPI provides a comprehensive portrait of expressed economic concerns in 2009,
with questions regarding a wide range of different sources of potential worry. These questions
show, not surprisingly, that economic worries were widespread. Coupled with our evidence on
economic experiences, they also suggest that the relative prevalence and intensity of worries
match fairly closely with the chance of actually experiencing the relevant dislocations, though
with some important exceptions. For a subset of these questions, moreover, we can compare
responses between the SERPI and previous surveys regarding economic worries going back to
the economic expansion of the mid-2000s, including the identically worded questions on the
aforementioned 2007 Rockefeller survey. This comparison suggests that several major economic
worries—concerning medical expenses, adequacy of resources for retirement, and, surprisingly,
housing stability—were already widespread before the downturn. Thus, while the downturn
caused unusually intense economic shocks, there is good reason to believe our main findings
would hold in the period leading up to the Great Recession and—in light of the long-term shifts
toward increased insecurity discussed up front—possibly earlier as well.
The Prevalence of Worries and Shocks
Economic worries were widespread in 2009. Looking across more than a dozen different
sources of potential worry asked about in the SERPI, Figure 2 shows the share of Americans
who were “very” or “fairly” worried about each specific economic risk, grouped by domain, as
well as the share who expressed worry about their economic security in general. In Figure 3, we
show the prevalence of worry within each domain—measured as the share very or fairly worried
about at least one domain-specific risk—alongside the share of Americans experiencing at least
one major economic shock within that domain during the 18 months preceding the fall of 2009.

12
[Insert Figures 2 and 3 About Here]
A glance at Figure 3 suggests that the ranking of worries roughly reflects the ranking of
risks—the risks people worry most about are, in general, also most common. Comparing worries
and experiences within each domain (share very or fairly worried about at least one risk and
share experiencing at least one shock), it is clear that more people are worried about an event
occurring than actually experience the relevant shock. This makes sense, since more people are
at risk of an economic disruption than actually experience it. What is more notable is that, at the
aggregate level, the proportion of the public worried about adverse economic events is both high
and generally does seem to reflect the actual incidence of those events.
Still, this alignment does not hold for all shocks. About as many Americans worry about
losing their partner or spouse as about substantial out-of-pocket medical expenses, and many
more do so than worry about needing to assist family members in financial need. But divorce or
death of a spouse or partner is, in fact, much less common than either of these sources of
nondiscretionary spending. Similarly, worries about losing health coverage are almost as
common as worries about high out-of-pocket medical costs, even though such losses actually
occur only about half as often as high costs.
These divergences may reflect public misperception. People tend to inflate the chance of
unpredictable events that induce great fear or anxiety, such as terrorism and crime.21 Heightened
worry associated with certain risks may also reflect the expected severity of the resulting losses.
An intuitive measure of expected severity is the estimated length of time it takes for a
household’s financial circumstances to return to the level enjoyed before the event occurred. We
therefore asked respondents to estimate how long recovery would typically take in the event of
key economic shocks.22 They predicted that disruptions in family (death of spouse or divorce)

13
would have the longest-lasting consequences, with nearly 8 in 10 (77 percent) saying it would
take more than six months to recover economically. Unemployment and investment losses, by
contrast, were seen as having more transitory effects, although even in these cases not more than
29 percent of respondents expected to recover within six months. Thus, heightened concerns
about family dissolution may reflect perceptions that it induces particularly severe or lasting
consequences as well as exaggeration of the prevalence of the disruptions.
Comparing Worries with Pre-Recession Levels
The Great Recession represented an unusually turbulent economic period—the worst
economic downturn in more than half a century. During the 18 months preceding the fall of
2009, according to the SERPI, nearly 9 in 10 American households reported experiencing at least
one shock in the four domains covered by our survey, and more than two-thirds (70 percent) of
all Americans experienced a shock related to domains other than wealth. These shocks were
often quite substantial. During these 18 months, for example, almost a quarter of all households
reported a decline in earnings totaling 25 percent or more of their previous annual income.
It is therefore natural to ask how historically distinctive the level of economic worries
seen during the Great Recession was. Figures 4 and 5 presents the results of public opinion
surveys that were fielded prior to 2007 that assess the same sorts of worries that we examined in
the SERPI: the Kaiser Health Tracking Poll (Figure 4), and the 2007 Rockefeller survey
mentioned already (Figure 5). The Kaiser series makes clear that Americans were quite worried
about a wide range of economic risks before the downturn. Indeed, only with regard to job loss
do we see a dramatic climb in economic concerns in 2008 and 2009. Comparing the SERPI with
the identically worded questions in the 2007 Rockefeller survey, we see a more substantial jump
14
in worries. Most of the rise occurs, however, in the share “fairly worried” –the share “very
worried” is more stable—and for some risks, worries change only modestly. While the Great
Recession clearly intensified economic concerns, these results suggest that insecurity was
commonplace even before the Great Recession.
[Insert Figures 4 and 5 About Here]
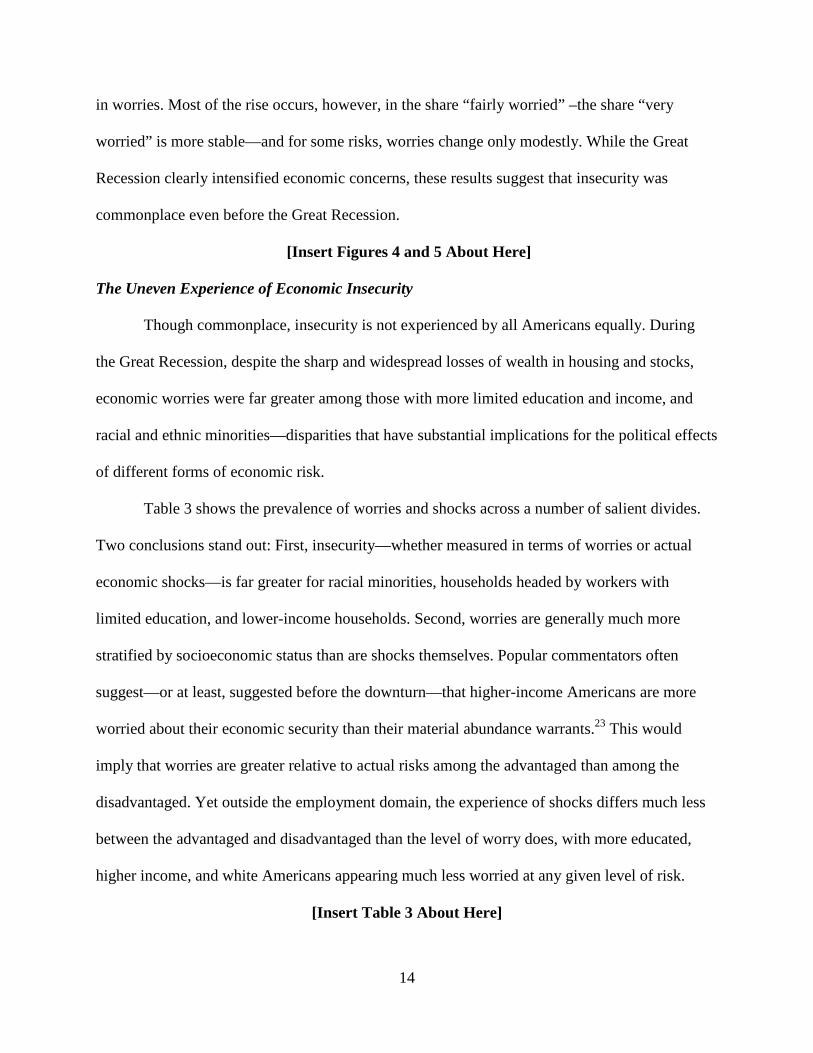
The Uneven Experience of Economic Insecurity
Though commonplace, insecurity is not experienced by all Americans equally. During
the Great Recession, despite the sharp and widespread losses of wealth in housing and stocks,
economic worries were far greater among those with more limited education and income, and
racial and ethnic minorities—disparities that have substantial implications for the political effects
of different forms of economic risk.
Table 3 shows the prevalence of worries and shocks across a number of salient divides.
Two conclusions stand out: First, insecurity—whether measured in terms of worries or actual
economic shocks—is far greater for racial minorities, households headed by workers with
limited education, and lower-income households. Second, worries are generally much more
stratified by socioeconomic status than are shocks themselves. Popular commentators often
suggest—or at least, suggested before the downturn—that higher-income Americans are more
worried about their economic security than their material abundance warrants.23 This would
imply that worries are greater relative to actual risks among the advantaged than among the
disadvantaged. Yet outside the employment domain, the experience of shocks differs much less
between the advantaged and disadvantaged than the level of worry does, with more educated,
higher income, and white Americans appearing much less worried at any given level of risk.
[Insert Table 3 About Here]

15
Disparities in Private Protections
This seemingly counterintuitive finding is likely related to another crucial disparity: the
much greater private protections that high-income and highly educated individuals have against
economic shocks, making those shocks a much less salient worry. Figure 6 shows the average
amount of time that individuals in different socio-demographic groups said they could go
without hardship if their earnings disappeared. The magnitude of the disparities is striking: Risk
buffers are far more resilient for financially and educationally advantaged households. Similarly,
African-Americans and Latinos have distinctly weaker buffers than do whites.
[Insert Figure 6 About Here]
Thus, the significance of the uneven exposure to economic risks depends in large part on
the distribution of private buffers. It might be expected that those most subject to economic
instability would have the greatest incentive to prepare, and indeed, these Americans are clearly
worried about their economic security. What the SERPI shows, however, is that households
facing the greatest risk also have the weakest private buffers. This suggests that less affluent
households face considerable constraints in building up adequate private reserves.24 It also
indicates that private buffering capacity may have a crucial influence on people’s policy
positions, since the main alternative to private buffering are protective public programs.
To be sure, the impact of some economic shocks can be lessened by purchasing private
protections—for example, health insurance to protect against high medical costs or life insurance
to reduce the financial impact of a spouse’s death. For many risks, however, private insurance is
either unavailable or beyond the means of most citizens. Loss of a spouse due to divorce or
separation, declining investment values, urgent financial assistance to one’s extended family, lost
earnings due to illness—all these are risks for which insurance markets do not exist or work

16
poorly. This is why public programs like unemployment insurance are of such crucial concern to
citizens. The next section will examine how economic worries, the experience of shocks, and the
strength of household’s private buffers affect individual attitudes toward these sorts of public
protections.
Economic Insecurity and Attitudes toward Social Policy
Do economic shocks and worries correspond with individuals’ attitudes toward
government’s role? In this section, we show they do— and powerfully so. Direct economic
experiences are strongly correlated with support for risk-buffering social policies—at times
rivaling partisanship and ideology as correlates. This is particularly true of recent shocks, but
also true of more temporally distant shocks. Support for domain-specific policies are most
closely associated with past shocks in that domain, but policy attitudes also appear to be
associated with shocks experienced in other domains. Shocks to family arrangements and wealth
are weaker and less consistent in their association with attitudes than are shocks in the domains
of employment and medical care—which reflects, we believe, the weaker relationship between
insecurity and wealth volatility in the first case, and the lack of understood and recognized policy
mechanisms for addressing family shocks in the second. Nonetheless, wealth and family shocks
still generally correlate with acceptance of a broader role for government in these domains.
At least as important, these economic experiences—and the worries associated with
them—do not appear to be simple proxies for political predispositions or attitudes. Experiences
and perceptions of economic insecurity are notably distinct from either partisanship and ideology
or the general evaluations of the economy often used in attitudinal analyses. All this may seem
intuitive, but as discussed earlier, it actually runs counter to dominant strains in behavioral
17
research on American politics. The ups and downs of individuals’ economic lives clearly shape
their policy views alongside ideological and partisan influences—we just need to look more
closely and with more realistic theoretical expectations than previous analyses have.
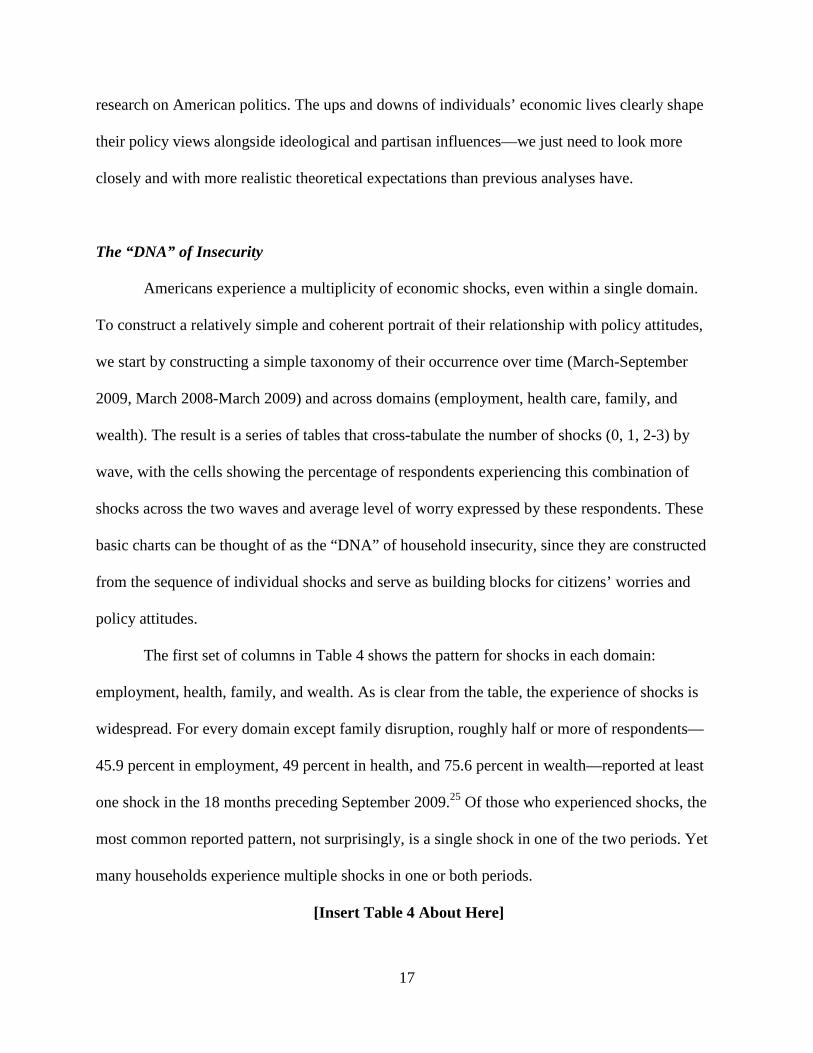
The “DNA” of Insecurity
Americans experience a multiplicity of economic shocks, even within a single domain.
To construct a relatively simple and coherent portrait of their relationship with policy attitudes,
we start by constructing a simple taxonomy of their occurrence over time (March-September
2009, March 2008-March 2009) and across domains (employment, health care, family, and
wealth). The result is a series of tables that cross-tabulate the number of shocks (0, 1, 2-3) by
wave, with the cells showing the percentage of respondents experiencing this combination of
shocks across the two waves and average level of worry expressed by these respondents. These
basic charts can be thought of as the “DNA” of household insecurity, since they are constructed
from the sequence of individual shocks and serve as building blocks for citizens’ worries and
policy attitudes.
The first set of columns in Table 4 shows the pattern for shocks in each domain:
employment, health, family, and wealth. As is clear from the table, the experience of shocks is
widespread. For every domain except family disruption, roughly half or more of respondents—
45.9 percent in employment, 49 percent in health, and 75.6 percent in wealth—reported at least
one shock in the 18 months preceding September 2009.25 Of those who experienced shocks, the
most common reported pattern, not surprisingly, is a single shock in one of the two periods. Yet
many households experience multiple shocks in one or both periods.
[Insert Table 4 About Here]

18
This highlights a crucial pattern overlooked by past analyses: economic shocks are rarely
isolated. Rather, they often reoccur, continue over time or coincide with other shocks. The
SERPI allows us to calculate the prevalence of persisting shocks (continuing or repeated across
waves) and clustered shocks (different shocks occurring at the same time across two or more
domains).
As it turns out, persisting shocks are close to the norm among those experiencing an
economic disruption. About half of all respondents who experienced a shock between spring
2008 and spring 2009 also reported that the same shock had occurred over the next six months.26
Not only do shocks often persist, but many households also experience multiple shocks across
the four domains (employment, health, family, and wealth). For instance, the vast majority of
Americans who experienced a shock to employment in this 18-month period also reported a
shock in one of the other domains (health, family, wealth), and often in several at once (see
Figure 7).
[Insert Figure 7 About Here]
The commonality of persisting and clustered shocks has important implications—besides
the obvious hardship that multiple, cross-domain losses can cause. It means that realistic models
of the effect of economic shocks on policy attitudes should treat shocks not as a binary category
but as a continuum, varying in intensity across at least two dimensions: how many or long
shocks are (what we have termed persistence), and how spread they are across different aspects
of economic life (what we have termed clustering).27 Lumping together those who have
experienced a single shock with those who have experienced persisting shocks may lead analysts
to miss the real effects of highly intense economic shocks. Contrariwise, failing to take into
account clustering across domains may sometimes lead analysts to ascribe the effect of one

19
shock (say, loss of health insurance) to an attitudinal shift that is more closely linked to another,
clustered shock (say, job loss). The second set of columns in Table 4 drives the point home:
worries are much greater for those who experience a larger number of shocks. Thus, for example,
respondents who have lost their job and report being out of work six months later are markedly
more worried about losing (or finding a new) job than are those who have avoided job loss in the
recent past and than those who report job loss only in the first survey. The patterns are especially
marked in the family domain, about which 34.4 percent of all respondents are fairly or very
worried. Of those respondents that did not experience any family-related shock, only 25.7
percent were fairly or very worried. But of those that reported two or more family-related
shocks, more than 92 percent were fairly or very worried. Although this simple demonstration
includes no statistical controls, Table 4 suggests that the most recent shocks (within six months
of the survey) loom largest in people’s thinking about economic risks, though more temporally
distant shocks (six to eighteen months before the survey) seem to induce worries as well. Most
important, it suggests that the occurrence of shocks is associated with very large deviations from
average levels of worry; dynamic economic experiences appear highly related to people’s
worries about economic risk.
The Association of Shocks with Worries
Because the frequency of shocks could reflect other features of citizens’ lives that
correlate with expressed worry, the DNA evidence is only suggestive. When we include
statistical controls, however, the conclusions remain the same: those who have experienced
direct economic shocks are significantly more worried than those who have not, in rough
proportion to the intensity of those shocks—with the effects highly mediated by the resilience of

20
one’s personal financial buffers. Reported worries are powerfully shaped by experiences even
after taking into account socio-demographic characteristics, partisanship and political ideology,
and other influences on personal financial assessments identified by prior scholarship.
Table 5 presents the results of a multivariate model predicting worries based on the DNA
patterns just introduced. We look at three shocks within each domain (employment, health,
family, and wealth) and, as before, distinguish between one and two to three shocks in each
wave.28 In keeping with our discussion of intensity in the last section, we also include a variable
capturing the number of shocks outside the domain under examination (for example, in the
analysis of the employment domain, large out-of-pocket medical costs).
Most of these controls are straightforward, but two require explication. We include two
controls developed by economists and psychologists to capture how willing individuals are to
take risks: a measure of risk aversion related to earnings and employment (“Risk averse (job)”)29
and a general attitudinal measure of risk-seeking (“Risk averse (general)”).30 These controls
capture people’s broad outlook toward risk—which might otherwise confound our findings—and
they perform as expected, though the general attitudinal measure seems more clearly related to
worries than the narrower measure related to jobs and income.
In every domain, Table 5 shows, the number of shocks is strongly correlated with the
degree of worry, both about general economic security and about a wide range of specific
economic risks, from unemployment to the loss of health insurance. And the substantive effects
of shocks are large. Since Table 5 displays coefficients from ordered logit estimations, we report
predicted probabilities of being very worried for a hypothetical respondent without any shock in
that domain to one with at least two shocks in both waves. For these simulations, the predicted
probability of being very worried almost doubles in the wealth domain (0.204 to 0.371), more

21
than doubles in the employment domain (from 0.166 to 0.384), almost triples in the health
domain (from 0.153 to 0.448), and almost quadruples in the family domain (0.096 to 0.379). But
even experience with single shocks (one in each wave) is associated with fairly large simulated
changes in the predicted probability of being very worried: the predicted probabilities fall
somewhere in between the ranges reported above (employment: 0.255, health: 0.243, family:
0.206, wealth: 0.304).
[Insert Table 5 About Here]
One striking finding is the strength of our measure of the resilience of personal buffers
(“how long you and your family [could] get by before being in real financial trouble” if family
earnings were interrupted).31 People without financial buffers are significantly and substantially
more worried about their economic security, even controlling for income and education. Of
course, buffers are highly correlated with socioeconomic status, but the correlation is far from
perfect. For studies of economic insecurity, measures of household buffering capacity are in
many ways a much more appropriate—and again, easy to measure—assessment of the degree to
which economic shocks will pose immediate risks to a household’s standard of living.
In contrast, the performance of education and income is modest and inconsistent once
buffers are taken into account. Neither higher income nor higher education is consistently
associated with lower levels of worries; and, indeed, with regard to retirement wealth, the richer
and more educated are actually more worried (although the coefficients are not always
significant).
To be clear, this does not mean that higher-income Americans are as worried about their
economic security as are lower-income Americans. Generally speaking, those with greater
incomes or education are markedly less worried. What it does mean, however, is that much of

22
the conventionally measured relationship between income and policy attitudes appears to be
mediated through the greater vulnerability of the less affluent to major economic risks and the
greater weakness of those families’ personal financial buffers. This helps explain the results for
other controls as well. African-Americans, for example, appear to be less worried about their
economic security than other Americans all else equal. But because they are so much more
subject to economic instability than other Americans and have such weak buffers—weaker than
Hispanics, on average—their worries about economic security are generally quite intense.
Meanwhile, partisanship and ideology appear to have a limited role in explaining
individuals’ worries about economic security. Once direct economic shocks and risk buffers are
taken into account, Republicans and conservatives appear only modestly less worried than
Democrats and liberals, respectively; the coefficients, moreover, are rarely significant. Whatever
else citizens’ worries about their economic security express, they are not simply a proxy for
preexisting ideological or partisan preferences. Instead, they appear to closely reflect the
intensity and character of unstable economic circumstances.
The Association of Worries with Policy Attitudes
If worries are strongly related to economic experiences, the obvious next question is how
closely these assessments are associated with support for risk-buffering social policies. To gauge
attitudes toward social policy, the SERPI incorporated multiple batteries of questions about
social policy within each domain, as well as two policy questions related to economic security in
general (refer back to Table 2). For ease of exposition, we aggregate these measures within
domains to construct a simple index of support for more active government measures in the four

23
domains and with regard to general economic security.32 Similar findings hold, however, when
we use the individual responses to the survey questions, rather than these aggregate measures.
Let us start by exploring the role of worries as a transmission belt connecting experiences
and attitudes: How closely are economic worries associated with attitudes toward social policy?
Although some past research explores how economic circumstances affect support for certain
risk-related social policies (unemployment benefits, health insurance subsidies, and so on), none
has explored how perceptions of economic insecurity in multiple domains relate to support for
the wide range of ways in which government might help buffer economic risk. Do reported
levels of worry capture a crucial set of considerations that factor into citizens’ policy
preferences?
The answer is yes—and clearly so. In Table 6 we present the results of a simple model
predicting support for social policies designed to protect citizens against risk in our core areas:
employment (column 1), health care (column 2), family (column 3), and wealth (column 4), as
well as for an active general role for government as a guarantor of economic security (column 5).
We also aggregate all the policy attitudes into a single measure of support for government risk
buffering (column 6). Our crucial independent variable is a respondents’ level of worry about
economic security, which is simply the average of the non-missing values of all economic
worries just discussed. The controls are the same as before.
[Insert Table 6 About Here]
The results in Table 6 are striking. Respondents’ level of worry is associated with their
level of support for government action across all the domains. Although worries appear only
weakly, albeit significantly, related to support in the family domain—a recurrent pattern that we
will discuss later—the level of worry is strongly correlated with support in the three others, with

24
regard to general attitudes toward an active government role providing security, and with average
support for risk-buffering across all the policy questions. Indeed, in most of the domains, worries
rival or exceed partisanship and ideology in the magnitude of their effects. Given that worries are
not consistently and strongly related to partisanship or ideology, this is a suggestive
demonstration of their substantial independent effect on policy attitudes, above and beyond the
ideological and partisan measures on which political scientists have so focused.
Table 6 displays coefficients from OLS estimations, and therefore allows for direct
assessment of substantive effects. The strongest findings are for employment policy attitudes,
where the difference between someone who is very worried (average worries=4) and someone
who is not worried at all (average worries=1) is 0.741 (=(4-1)* 0.247). This effect is about three
times as big as the difference between highest and lowest income (which is -0.224); it is also
larger than the difference between Republicans and Democrats (-0.507) as well as Conservatives
and Liberals (-0.291). But with the exception of attitudes toward family policies, worries are
strong substantive predictors in the other policy domains as well, oftentimes surpassing or
rivaling the explanatory power of partisanship or ideology.
The Association of Shocks with Policy Attitudes
Worries are a subjective component of citizens’ economic experiences. We know from
the results so far that they are not merely a reworked expression of ideology or partisanship—
that respondents do not “pick” their worries simply to validate their party- or ideology-based
positions. But it is still the case that our last model essentially compares one set of attitudes with
another, and that both could, in theory, be a reflection of some other characteristic of
respondents’ worldview or circumstances for which we do not control.

25
The most obvious is citizens’ general view of government, which could influence both
perceptions of risks and attitudes toward policy. It should be noted, however, that if worries and
policy attitudes both reflect general views of government, that would likely weaken, rather than
strengthen, the link between greater worry and greater support for government action. After all,
citizens who don’t trust government to deal with threatening economic risks should be less
inclined to see government as a source of protection and thus more worried about the risk
itself—which cuts against the grain of our strong finding of the opposite relationship.
Still, for some analytic purposes it makes sense to eliminate the attitudinal middleman, so
to speak, and look at the direct relationship between experienced economic shocks and attitudes
toward social policies, controlling for partisanship and ideology as well as key demographic
factors. If nothing else, this allows us to hone in on the most obvious omitted variable in our
prior model—jarring financial events in respondents’ lives that could influence both levels of
worry about economic risk and levels of support for policies to buffer those risks.
Before we take this step, however, we want to emphasize that for many analyses, worries
may be at least as good a measure as experienced risks. As documented above, Americans’ are
often worried about economic risks that their households have not personally experienced – and
these secondhand worries may be no less powerful in activating support for risk buffering public
policies. Moreover, individuals’ expressed levels of worry incorporate a whole series of basic
judgments about how the world works—an understanding drawn from personal experience, their
larger social networks, their media exposure, and so on. Greater study of how worries are formed
and, in turn, shape policy attitudes could ultimately provide a richer understanding of citizens’
economic psychology than could examinations of the correlation between experienced economic

26
losses and attitudes. In favor of this strategy, worry measures are simple and already common in
surveys, though regrettably almost never alongside political and policy questions.
Nonetheless, the direct correlation between experienced shocks and policy support is a
valuable linkage in its own right, especially given the general demotion of experience-oriented
explanations of policy attitudes in American politics research.33 Do people who experience a
major economic shock have different views of relevant economic policies than those who do
not? How strong are these effects when compared with the effects of partisanship, ideology, and
basic demographic and socioeconomic characteristics? How do they compare with the effects of
the general economic evaluations so ubiquitous in contemporary opinion research on the
economy?
To answer these questions, we turn once again to shocks and attitudes within our four
domains (employment, health, family, and wealth). In each, we are interested in the relationship
between support for social policies that cover/compensate/address risks in that domain and the
number of direct shocks experienced by the respondents. As before, we aggregate all the
questions asked about support for existing or prospective government policies in each domain
into a single domain-specific index of support. Because the various questions in each domain
might tap into different dimensions of economic security, however, we also report results using a
single question for each domain. These questions concern general government responsibility
(except in the family domain, where no such question was asked and we use instead a question
about support for a new policy to help those caring for a family member not living with them,
such as an elder parent). For our purpose, government responsibility questions are preferable to
other items because they are concretely linked to existing policies (unlike questions about

27
hypothetical future policies) but not dependent on existing spending levels (unlike questions
about support for additional spending for existing policies).
Table 7 shows the results by domain for the general index of support and the one specific
question in each domain. In all domains but wealth, the number of shocks is significantly
correlated with support for risk-buffering policies in that domain. In these domains, the
substantive effect of shocks (comparing zero with six shocks) surpasses that of education and
income in all cases, and that of party-ID and ideology in the employment and family domains.
For example, the predicted probability of answering that “some people feel the government in
Washington should see to it that every person has a job and a good standard of living” is more
than twice as high for someone that experienced six shocks (compared to someone without no
shocks), and it is roughly twice as high for Democrats compared to Republicans.
[Insert Table 7 About Here]
With respect to health policy attitudes, however, partisanship and ideology clearly
outperform our shock variable. Since our survey was in the field during the highly partisan health
care debate, this may not be too surprising. What may be surprising is that shocks still have a
large effect on health policy attitudes, even in the midst of a highly partisan policy debate.
Moreover, our measure of the strength of individuals’ risk buffers proves to be a consistent,
statistically and substantively significant (negative) correlate of support for government action.
The estimated relationship between general economic evaluations and support for social
policies generally confirms conventional expectations, though the relationships are not
particularly strong. Past scholarship suggests that individuals who believe the economy is worse
than it used to be or is going to be worse in the future will be more supportive of risk-buffering.34
However, retrospective economic perceptions are never significantly related to policy attitudes in

28
our models, and the relationship is negative when significant (if the economy is perceived to be
poorer, support for social policies is lower). Forward-looking perceptions—will the economy be
better in six months?—are almost always significant and, as past scholarship suggests, positively
related to support for more active social policies. All these evaluative questions, it should be
noted, were asked before the 2008 election, so as not to confuse reactions to President Obama’s
election with economic assessments. Still, a serious shortcoming of general evaluations of the
economy is that they are biased by partisan affiliation, a problem that appears much less severe
with the measures of security we have proposed.35
Implications and Future Directions
The recent sharp downturn has cast in stark relief the problem of economic insecurity.
Yet students of American politics have had surprisingly little to say about how people experience
and understand economic risks. This is unfortunate not just because insecurity is such a salient
public concern—and was so even before the Great Recession. It is also unfortunate because
insecurity is so central to longstanding historical and theoretical debates within the discipline.
From voting to revolting, from support for the welfare state to antagonism toward ethnic and
racial minorities, economic instabilities have long been thought to shape the most fundamental
aspects of political life. For the most part, however, insecurity has been a shadow factor in
political analysis—presumed but not probed, theorized but not measured. And it has been largely
absent in the behavioral tradition so strong in the American politics subfield.
In this article, we have sought to lay some basic foundations for a stronger behavioral
research program examining insecurity and its role in American politics, building on work in
political psychology, behavioral economics, and survey research. Too often the discussion of the

29
economic roots of policy attitudes has declared, based on at best limited measures of dynamic
economic experiences, that economic factors are largely irrelevant and that, when relevant,
general sociotropic evaluations, rather than egocentric concerns, always dominate.36 While work
carrying this message provides an important corrective to crude “self-interest” accounts, it has
had the unfortunate effect of deterring better conceptualization and measurement of changes in
economic standing. As we have tried to show, there are substantial opportunities for political
science and allied disciplines to understand the mass effects of the ongoing transformation of the
American political economy by developing stronger conceptions of how economic security
affects policy attitudes and political reasoning.
Citizens value their economic security, especially at times of upheaval.37 And they
construct expectations based on their own experiences and the experiences of those around them.
These views mix the sociotropic and personal, the self-interested and other-regarding, in ways
that defy simple categorization. But they clearly shape how people think about their economic
lives, and about government’s role in making those lives more secure. Citizens’ dynamic
economic experiences matter for their public policy positions in ways that are both substantively
significant and theoretically explicable.
To be sure, scholars seeking to capture the dynamic economic situation of citizens and
how it affects political behavior will have many thorny problems to tackle. In this article, for
example, we have relied primarily on correlations among responses, which given the richness of
the SERPI is highly revealing. Research on economic security should consider experimental
investigations as well, along with the use of longer-term panel data that make it possible to
carefully parse the time-sequencing of economic shocks and attitudinal changes. With regard to
the former, a particularly promising approach would be to study the downstream effects on

30
worries and policy attitudes of experiments designed to test alternative social policy approaches
that differently expose citizens to economic risk (for example, the expansion of Medicaid in
Oregon, where—because of limited resources—applicants within a given income range were
randomly chosen to receive coverage). With regard to the latter, there is a felt need for the
incorporation of standard political and policy questions into panel income surveys and the
inclusion of more fine-grained economic measures in panel surveys of public opinion. Such
analyses will require greater collaboration between those doing different kinds of research—
between program monitoring and behavioral political science, for example, or between public
opinion research and panel economic studies.
Nor is it clear how long the attitudinal effects of shocks we find will persist. In our
analyses, economic shocks in the first wave (March 2008 to March 2009) were still clearly
associated with attitudes in September 2009. In additional analyses not reported in this article,
however, we found weak to non-existent effects for shocks prior to March 2008. Our measure of
pre-2008 shocks, however, is a question asking respondents if they had ever experienced the
relevant shock in the years prior to March 2008, thus mixing both relatively recent shocks (say,
in 2007) and ones quite temporally distant. Ultimately, political researchers require ongoing
panel surveys—ideally, ones like the Panel Study of Income Dynamics that continue for many
years—that trace both economic experiences and political attitudes over long spans of time.
The SERPI assessed Americans’ experiences and perceptions of economic insecurity in
the depths of the recession, raising the concern that the magnitude of the relationships identified
in our models are unique to these particularly difficult economic circumstance. Yet, as Figures 4
and 5 based on previous polling showed, 2009 was not as unusual as one might expect. Many
economic worries were already quite common before the downturn began. The Great Recession

31
exposed a broader cross-section of Americans to economic risks, but those risks were very much
a part of American economic life even before it hit—and they are certainly still a part of it today.
Still, the Great Recession was an unusually intense period of economic distress, and individuals
may not respond to economic shocks in exactly the same way in more stable economic times.
Here again, continued panel surveys that persist across the business cycle are essential.
If our central contribution is to show that economic instability matters for individuals’
policy attitudes, we also have tried to untangle how it matters, and what this means for future
investigations. As a starting point, we can confidently say that people’s worries about their
economic security are not simply reworked partisanship or ideology. This is theoretically
interesting, since we know other evaluations of the economy are heavily partisan-tinged. It is
also methodologically useful, since worries are already common in surveys (though not in those
with measures of political attitudes and behavior) and have an established place in the
psychological literature.38 Since it seems worries are heavily shaped by personal economic
experiences, adding worry questions to opinion surveys would be an important step toward
introducing economic insecurity into survey-based research.
Another important step is to broaden the range of economic risks examined. Though job
loss looms large in people’s economic thinking—and even larger in what research there is on the
political consequences of economic instability—insecurity is a reflection of multiple, intersecting
risks. These extend beyond employment risks to include major economic losses driven by
family, wealth, and health changes. We have shown a relatively smooth stepwise relationship
between risk intensity and policy attitudes: greater intensity, more support for government risk
protections. We have also shown substantial spillover effects across domains, especially between
employment and health—the two domains where shocks and worries seem to have the strongest

32
relationship to policy attitudes. Most theories ignore and most surveys miss how the persistence
and clustering of economic risks shapes attitudes toward risk-buffering policies.
They tend to miss as well the characteristic of households most relevant to how they
respond to unstable economic circumstances—namely, their capacity to deal with economic risks
on their own. This buffering capacity is associated with attitudes even when income, education,
and other demographic characteristics are controlled for. In economics and sociology, the role of
wealth has been a prominent concern. But political science has generally looked at “flow”
measures of household resources, such as income, rather than “stock” measures, such as wealth.
It is wealth and other private buffers, however, that allow families to deal with threatening
economic risks without public protections, and so it is not surprising that our measure of buffers
is more strongly associated with policy attitudes than standard measures of household income.
Until now, we have refrained from discussing the implications of our findings for public
opinion as a whole, and for good reason. At the individual level, the experience of intense
economic shocks is associated with greater support for risk-buffering policies. At the collective
level, however, these experiential drivers blend with other influences on public opinion.
Aggregate support for government action may be enhanced, for example, if economic instability
weakens trust in markets or other private institutions. On the other hand, support may be
counter-balanced by greater sensitivity to taxation during straitened economic times, or doubts
about the efficacy of policies intended to soften downturns.
Nor have we considered how intensely citizens hold their preferences, or how active they
are in pursuing them. Each is likely to depend on the concentration of risks—that is, how
conjoined they are across multiple domains of risk, and how closely correlated they are with
other fundamental socioeconomic divides, such as race, education, and income. If risks are

33
highly concentrated, the result is opinion polarization, as we show in other work, looking both
across nations and areas of U.S. social policy.39 In particular, when less affluent citizens face
much greater insecurity than more affluent citizens, opposition to the welfare state among the
relatively secure is stronger. The continuing concentration of insecurity even during the worst
downturn since the Great Depression is surely one factor in the political crucible that forged the
Tea Party. Disproportionately middle-aged or older and male with greater income and education
than average (and, often, secure retirement and health benefits), Tea Party members frequently
express the view that assistance for economic distress or new health coverage goes to “someone
else."40
Although the ramifications of rising insecurity for American politics are uncertain, no
one can doubt it deserves to be a salient concern of public officials. In this light, it is notable how
little we know not just about the opinion effects of economic shocks, but their basic incidence
and character. No official public statistic measures the individual-level dynamics of household
economic well-being. Even the unemployment rate—the closest measure—speaks only indirectly
to these dynamics. With a broader team of researchers, we have developed an index that captures
the share of Americans experiencing large economic losses, the Economic Security Index.41 But
a huge amount of room remains for new and better measures, both of household economic
dynamics and of how Americans think about and respond to them.
A huge amount of room remains as well for new and better policies that reflect the reality
that risks are generally clustered across domains. In the United States, health and pension
benefits are tied closely to work, and family supports that allow two-earner and single-earner
couples to balance work and care-giving are generally private and incomplete. Both left and
right—for different reasons and with different emphases—are likely to be drawn into addressing

34
the growth of new and newly intense economic risks created by the post-1970s transformation of
work and family.
Practitioners of American politics know that the search for security is a powerful motive,
whether harnessed for good or ill. Scholars of American politics have been much slower to
recognize this reality. This neglect, once regrettable, is now untenable. If the Great Recession
signaled anything, it is the stark reality of economic insecurity in many Americans’ lives. The
last generation has seen sweeping changes in our economy, our society, and our global context—
from the breakdown of the framework of private workplace benefits that has defined America’s
distinctive social policy model to the increased globalization of trade and finance to the rise of
two-earner and single-parent families caught between the pull of the labor market and the
demands of care-giving. We live in an age of increased individual exposure to economic risk. As
candidates square off over how to respond this new world, political scientists need to step in to
understand it. In this article, we have explored is implications for policy attitudes, but a wide
horizon of research agendas opens up once we cast clear eyes on the insecure American.

35
Notes 1 Franklin Roosevelt, State of the Union Message to Congress, 1944.
2Svallfors 2004, 1997; Mughan 2007; Cusack, Iversen and Rehm 2006; Rehm 2009.
3 A sampling of historical assessments include Brooks and Manza 2007; Mares 2003; Swenson
2003; Hacker 2004; Scheve and Slaughter 2004; Taylor-Gooby et al., 1999; Baldwin 1990.
4 Campbell et al., 1960.
5 Bartels 2008; McCarty, Poole, and Rosenthal 2006;Verba, Schlozman, and Brady 1995;
Anderson and Beramendi 2008; Solt 2008.
6 McCarty, Poole, and Rosenthal 2006; Gelman 2008; Gilens 2012.
7 Gerber and Huber 2010; De Boef and Kellstedt 2004; Duch, Palmer, and Anderson 2000;
Rudolph and Grant 2002; Gomez and Wilson 2001; Holbrook and Garand 1996; Conover and
Feldman 1986; Duch and Stevenson 2008.
8 Lau and Heldman 2009.
9 Rosenstone, Hansense, and Kinder 1986; emphasis in original.
10 The November CPS actually has an item on voter turnout. But it cannot be linked to the more
extensive economic data in the March CPS, and there are no other political questions. The PSID
has attitudinal items on risk aversion (one of the items in the SERPI is modeled from the PSID),
but nothing on economic worries or policy attitudes.
11 E.g., Warren and Tyagi 2003; Hacker 2008; Porter 2012.
12 Bartels 2008; Winters and Page 2009; Hacker and Pierson 2010; Stepan and Linz 2011. See
also the symposia on Bartels and on Hacker and Pierson in Perspectives on Politics, 7(1) and
9(3), respectively.

36
13 Dickerson and Green 2012; Bentolila and Ichino 2008; Osberg and Sharpe 2005; DiTella and
MacCullock 2002; Iversen and Soskice 2001; Hacker et al. 2010.
14 Rehm et al. 2012; Rehm 2009; Anderson and Pontusson 2007; Mughan 2007; Cusack et al.
2006.
15 Lau and Heldman 2009; Gomez and Wilson 2001.
16 Vlaev et al 2010; Weber et al 2002.
17 On the temporal dimensions of individual experience of events affecting economic well-being,
see Dolan and White 2006. A large body of economic research has considered the impact of
different domains of economic security on each other, looking, for example, at how job losses
affect wealth holdings, family stability, or health insurance coverage (e.g., Fairbrother et al
2010). In explaining individuals’ worries and policy attitudes, however, relevance is in the eye of
the beholder. The key question is whether individuals’ see themselves as more at risk in one
domain when they experience losses in another. As we will show, people appear to perceive
employment shocks as having impact across all four domains—which makes sense given the
close link between employment, on the one hand, and access to health benefits and the ability to
finance health care and maintain family finances, on the other. Health care also has substantial
cross-domain effects. By contrast, wealth and family shocks appear more cabined in their effects.
The limited cross-domain impact of wealth shocks presumably reflects in part individuals’
perceptions that absent other shocks, wealth losses are less threatening to immediate economic
well-being. With regard to family shocks, the evidence suggests instead a sort of psychological
bounding, in which family instability is seen as distinct from more self-evidently economic risks.
As we discuss, individuals believe family shocks are very difficult to recover from
economically—something they do not believe of wealth shocks. Yet such shocks appear to have

37
a more limited relationship to individuals’ policy attitudes than either employment or health
shocks, suggesting they are viewed as separate from other economic risks, at least with regard to
government’s role in buffering them.
18 Questions used for comparative purposes were matched in wording and appeared at the
beginning of their respective surveys to eliminate priming effects from previous questions. For
details on the prior poll, see Rockefeller Foundation, Foundation 2007.
19 Bentolila and Ichino2008; DiTella and MacCullock 2002.
20 See, for example, EARN 2010, Shapiro et al. 2008.
21 For a review, see Sunstein 2002.
22 “People’s economic situation is affected by lots of different events. The impact of an event
depends in part on how long it is before things returns to being as they were before the event
occurred. For each of the following events, we’d like you best guess about how long it might be,
for the typical person like yourself, before the household’s financial situation returns to how it
was before the event occurred.”
- [w21d7a] The primary earner is laid off from work due to a slow economy
- [w21d7b] The primary earner loses his or her job because of a serious illness
- [w21d7c] The household has large medical bills because one of its members has a serious
illness
- [w21d7d] The household is disrupted by death, divorce, or other personal circumstances
- [w21d7e] The household suffers a decline in financial assets due to a drop in the stock
market or housing market
Answer categories: Within 3 months; 3-6 months; 6-12 months; 1-2 years; 2-5 years; Things will
never return to how they were

38
23 See, e.g., Easterbrook 2003.
24 Three additional measures of buffers in the SERPI are related to the capacity to borrow: in
financial markets (that is, taking out a loan), drawing against equity (that is, reverse mortgages),
and through informal mechanisms (that is, from family and friends). Combined with our measure
of financial reserves, these offer a broader assessment of the ability of households to deal with
unexpected shocks. In the aggregate, however, they do not make Americans appear much more
secure. While about a third anticipate that they could borrow $5,000 or more from family or
friends if facing some urgent financial need, 44 percent expect not to be able to borrow at all, and
one in five consider themselves to be so deep in debt that they doubt they can ever pay it off.
25 These numbers from Table 4 do not match up exactly with Figure 3 because of slightly
different samples: Table 4 restricts the samples in the two columns to be the same.
26 To be clear, we use “persistent” here to refer to both single events that have lasting financial
consequences (job loss with delayed return to employment, chronic health problems that create
substantial out-of-pocket medical expenses for an extended period) and events that re-occur
repeatedly (stock portfolios that decline in value several times over 18 months; sequential
demands for financial assistance from extended family members). These cannot be readily
distinguished in survey responses. This is partly a consequence of how the SERPI questions are
worded, partly because it is often difficult for respondents to make these distinctions. For people
with complicated co-morbidities, for example, it is often quite difficult to discern which medical
expenses are associated with older or newer conditions.
27 Surveys could also, of course, assess a third dimension: the severity of the individual shocks
themselves. Though we have some continuous shock measures in our survey—for example, we
ask people to assess how much they lost in the stock market—our approach was to focus our

39
event questions on severe shocks, such as job loss or catastrophic health care costs, that would be
quite intense for most households. More specific questions not only take more survey time; they
also require recall of the precise magnitude of loss, which is difficult for many respondents.
28 Unlike in the DNA results, we do not interact the shocks across waves due to small cell sizes.
29 This measure is constructed from a series of questions on hypothetical gambles, as fielded in
the 1996 PSID (Barsky et al. 1997). We derive a rank-ordered measure of risk tolerance (ranging
from 1 to 6).
30 Following Meertens and Lion (2008), we asked respondents a series of questions on how they
view life’s uncertainties. We average six items to derive a measure of risk aversion (ranging
from 1 to 7).
31 As mentioned in note 24, the SERPI contains several additional measures of buffers. Including
other buffers or a combination of them, rather than relying on self-assessed buffering capacity,
does not change the basic findings.
32 We report Cronbach’s alphas in the note of Table 2. They are quite low, but we also present
analysis based on single items with similar substantive results.
33 Mutz 1992, 1998; Mutz and Mondak 1997.
34 DeBoef and Kellstedt 2004; Weatherford and Sergeyev 2000.
35 Evans and Anderson 2006.
36 Chong, et al. 2001; Citrin and Green 1990; Lau and Heldman 2009; Mutz 1998; Sears and
Funk 1991; Schlozman and Verba 1979.
37 When Americans are asked whether they prefer the security of knowing their income is
protected to the opportunity to make more money, they choose security by a two-to-one margin.
Hacker 2008.

40
38 Miron Shatz 2009
39 Rehm, Hacker, and Schlesinger 2012.
40 Skocpol, Williamson, and Coggin 2011, 27.
41 Hacker et al. 2010.

References
Anderson, Christopher J., and Jonas Pontusson, 2007. “Workers, Worries and Welfare States: Social Protection and Job Insecurity In 15 OECD Countries.” European Journal of Political Research 46(2): 211-235
Anderson, Christopher, and Pablo Beramendi. 2008. “Income, Inequality, and Representation.” In Democracy, Inequality, and Representation, eds. P. Beramendi and C. Anderson, 278-312. New York: Russell Sage Foundation. Baldwin, Peter. 1990. The Politics of Social Solidarity: Class Bases of the European Welfare State, 1875-1975. Cambridge, MA: Cambridge University Press. Bartels, Larry. 2008. Unequal Democracy: The Political Economy of the New Gilded Age. Princeton NJ: Princeton University Press. Barsky, Robert B., F. Thomas Juster, Miles S. Kimball, and Matthew D. Shapiro. 1997. “Preference Parameters and Behavioral Heterogeneity: An Experimental Approach in the Health and Retirement Study.” Quarterly Journal of Economics 112(2): 537–579. Bentolila, Samuel, and Andrea Ichino. 2008. “Unemployment and Consumption Near and Far Away from the Mediterranean.” Journal of Population Economics 21(2): 255-280. Brooks, Clem, and Jeff Manza. 2007. Why Welfare States Persist: Public Opinion and the Future of Social Provision. Chicago: University of Chicago Press. Campbell, Angus, Philip Converse, Warren Miller, and Donald Stokes.1960. The American Voter. Chicago: University of Chicago Press. Chong, Dennis, Jack Citrin, and Patricia Conley. 2001. “When Self‐Interest Matters.” Political Psychology 22(3): 541–570. Citrin, Jack, and Donald P. Green. 1990. “The Self-Interest Motive in American Public Opinion.” Research in Micropolitics 3: 1-28. Conover, Pamela, and Stanley Feldman. 1986. “Emotional Reactions to the Economy: I’m Mad as Hell and I’m Not Going to Take it Anymore.” American Journal of Political Science 30: 50-78. Cusack, Thomas, Torben Iversen, and Philipp Rehm. 2006. “Risks at Work: The Demand and Supply Sides of Government Redistribution.” Oxford Review Economic Policy 22 (3): 365-389. DeBoef, Suzanna, and Paul M. Kellstedt. 2004. “The Political (and Economic) Origins of Consumer Confidence.” American Journal of Political Science 48(4): 633–649.

42
Dickerson, Andy and Francis Green. 2012. “Fears and Realizations of Employment Insecurity.” Labour Economics 19: 198–210
DiTella, Rafael, and Robert MacCullock. 2002. “Informal Family Insurance and the Design of the Welfare State.” The Economic Journal 112: 481-503. Dolan, Paul and Mathew White, 2006. “Dynamic Well-Being: Connecting Indicators of What People Anticipate With Indicators of What They Experience” Social Indicators Research 75: 303–333
Duch, Raymond M., Harvey D. Palmer, and Christopher J. Anderson. 2000. “Heterogeneity in Perceptions of National Economic Conditions.” American Journal of Political Science 44 (4): 635–652. Duch, Raymond M., and Randolph T. Stevenson. 2008. The Economic Vote: How Political and Economic Institutions Condition Election Results. New York: Cambridge University Press. EARN, “More of American Families Do Not Have a Financial Safety Net,” 7 December 2010, online at http://www.earn.org/news/press_releases/more_than_half_of_american_families_do_not_have_a_financial_safety_net/. Easterbrook, Gregg. 2003. The Progress Paradox: How Life Gets Better While People Feel Worse. New York: Random House. Evans, Geoffrey, and Robert Andersen. 2006. “The Political Conditioning of Economic Perceptions.” Journal of Politics 68(1): 194–207. Fairbrother, Gerry L., Adam C. Carle, Amy Cassedy, and Paul W. Newacheck, 2010. “The Impact Of Parental Job Loss On Children’s Health Insurance Coverage.” Health Affairs 29(7): 1343-1349. Families USA. 2007. Too Great a Burden: America’s Families at Risk. Publication No. 07-113. Washington, DC: Families USA Foundation. Fronstin, Paul. 2006. “Savings Needed to Fund Health Insurance and Health Care Expenses in Retirement.” EBRI Issue Brief no. 295.Washington, DC: Employee Benefit Research Institute. Gelman, Andrew. 2008. Red State, Blue State, Rich State, Poor State: Why Americans Vote the Way They Do. Princeton, NJ: Princeton University Press. Gerber, Alan S., and Gregory A. Huber. 2010. “Partisanship, Political Control, and Economic Assessments.” American Journal of Political Science 54(1): 153–173. Gilens, Martin M. 2012. Affluence and Influence: Economic Inequality and Political Power in America. Princeton, NJ: Princeton University Press.

43
Gomez, Brad T., and J. Matthew Wilson. 2001. “Political Sophistication and Economic Voting in the American Electorate: A Theory of Heterogeneous Attribution.” American Journal of Political Science 45: 899-914. Hacker, Jacob S. 2004. “Privatizing Risk without Privatizing the Welfare State: The Hidden Politics of Social Policy Retrenchment in the United States.” American Political Science Review 98(2): 243-260. Hacker, Jacob S. 2008. The Great Risk Shift: The New Economic Insecurity and the Decline of the American Dream. New York: Oxford University Press. Hacker, Jacob S., Gregory Huber, Philipp Rehm, Rob Valletta, and Mark Schlesinger. 2010. Economic Security at Risk: Findings from the Economic Security Index. New Haven, CT: Institution for Social and Policy Studies, July, http://economicsecurityindex.org/upload/media/Economic_Security_Index_Full_Report.pdf Hacker, Jacob S., and Paul Pierson. 2010. Winner-Take-All Politics: How Washington Made the Rich Richer—And Turned Its Back on the Middle Class. New York: Simon & Schuster. Holbrook, Thomas, and James C. Garand. 1996. “Homo Economus? Economic Information and Economic Voting.” Political Research Quarterly 49(2): 351-375. Iversen, Torben and David Soskice, 2001. “An Asset Theory of Social Policy Preferences.” American Political Science Review 95(4): 875-895. Kaiser Family Foundation. 2007. Health Security Watch. Menlo Park, CA: Kaiser Family Foundation, June. Kaiser Family Foundation. 2010. Health Tracking Poll. Menlo Park, CA: Kaiser Family Foundation, June. Kenworthy, Lane, and Jonas Pontusson. 2005. “Rising Inequality and the Politics of Redistribution in Affluent Countries.” Perspectives on Politics 3(3): 449-471. Kusnet, David, Lawrence Mishel, and Ruy Teixeira. 2006. Talking Past Each Other: What Everyday Americans Really Think (and Elites Don’t Get) about the Economy. Washington, DC: Economic Policy Institute. Lau, Richard R, and Caroline Heldman. 2009. “Self-Interest, Symbolic Attitudes, and Support for Public Policy: A Multilevel Analysis.” Political Psychology 30(4): 513–537. Mares, Isabela. 2003. The Politics of Social Risk: Business and Welfare State Development. Cambridge, MA: Cambridge University Press. McCarty, Nolan, Keith Poole, and Howard Rosenthal. 2006. Polarized America: The Dance of Ideology and Unequal Riches. Cambridge, MA: MIT Press.

44
Meertens, Ree M, and René Lion. 2008. “Measuring an Individual’s Tendency to Take Risks: The Risk Propensity Scale.” Journal of Applied Social Psychology 38(6): 1506–1520. Miron-Shatz. Talya. 2009. “Am I Going To Be Happy And Financially Stable? How American Women Feel When They Think About Financial Security” Judgment and Decision Making, 4(1): 102–112 Mughan, Anthony. 2007. “Economic Insecurity and Welfare Preferences: A Micro-Level Analysis.” Comparative Politics 39(3): 293-310. Mughan, Anthony, and Dean Lacy. 2002. “Economic Performance, Job Insecurity and Electoral Choice.” British Journal of Political Science 32(3): 513-553. Mutz, Diane C. 1992. “Mass Media and the Depoliticization of Personal Experience.” American Journal of Political Science 36(2): 483-508. Mutz, Diane C. 1998. Impersonal Influence: How Perceptions of Mass Collectives Affect Political Attitudes. New York: Cambridge University Press. Mutz, Diane C., and Jeffery J. Mondak. 1997. “Dimensions of Sociotropic Behavior: Group-Based Judgements of Fairness and Well-Being.” American Journal of Political Science 41(1): 284-308. Osberg, Lars and Andrew Sharpe, 2005. “How Should We Measure the ‘Economic’ Aspects Of Well-Being.” Review of Income and Wealth 51(2): 311-336
Page, Benjamin I., and Jeffrey A. Winters. 2009. “Oligarchy in the United States?” Perspectives on Politics 7(4): 731-751. Porter, Katherine, ed. 2012. Broke: How Debt Bankrupts the Middle Class. Stanford, CA: Stanford University Press. Rehm, Philipp. 2009. “Risks and Redistribution: An Individual-Level Analysis.” Comparative Political Studies 42(7): 855-881. Rehm, Philipp, Jacob S. Hacker, and Mark Schlesinger. 2012. “Insecure Alliances: Risk, Inequality, and Support for the Welfare State.” American Political Science Review 106( 2): 386–406. Rockefeller Foundation.2007. American Worker Survey. (Fielded by Yankelovich, Inc. February 6-19, 2007). New York: Rockefeller Foundation. Rosenstone, Steven J., John Mark Hansen, and Donald R. Kinder. 1986. “Measuring Change in Personal Economic Well-Being,” Public Opinion Quarterly 50: 176-192.

45
Rudolph, Thomas, and T. Grant. 2002. “An Attributional Model of Economic Voting: Evidence from the 2000 Presidential election.” Political Research Quarterly 55: 805-823. Scheve, Kenneth, and Matthew J. Slaughter. 2004. “Economic Insecurity and the Globalization of Production.” American Journal of Political Science 48(4): 662-674. Sears, David O., and Carolyn L. Funk. 1991. “The Role of Self-Interest in Social and Political Attitudes.” Advances in Experimental Social Psychology 24(1): 1–91. Sears, David O., Richard R. Lau, Tom R. Tyler and Harris M. Allen, Jr. 1980. “Self-Interest vs. Symbolic Politics in Policy Attitudes and Presidential Voting.” American Political Science Review 74(3): 670-684 Shapiro, Thomas M., Jennifer Wheary, and Tamara Draut. 2007. By a Thread: The New Experience of America’s Middle Class. New York: Demos. Skocpol, Theda, Vanessa Williamson, and John Coggin. “The Tea Party and the Remaking of Republican Conservatism.” Perspectives on Politics 9(1): 25-43. Solt, Frederick. 2008. “Economic Inequality and Democratic Political Engagement.” American Journal of Political Science 52(1): 48-60. Stepan, Alfred, and Juan Linz. 2011. “Comparative Perspectives on Inequality and the Quality of Democracy in the United States.” Perspectives on Politics 9(4): 841-856. Sunstein, Cass R. 2002. “Probability Neglect: Emotions, Worst Cases, and Law.” Yale Law Journal 112: 61-107. Svallfors, Stephan. 1997. “Worlds of Welfare and Attitudes to Redistribution: A Comparison of Eight Western Nations.” European Sociological Review 13(3): 283-304. Svallfors, Stephan. 2004. “Class, Attitudes and the Welfare State: Sweden in Comparative Perspective.” Social Policy and Administration 38(2): 119-138. Swenson, Peter. 2002. Capitalists against Markets: The Making of Labor Markets and Welfare States in the United States and Sweden. New York: Oxford University Press. Taylor-Gooby, Peter, Hartley Dean, Moira Munro, and Gillian Parker.1999. “Risk and the Welfare State.” British Journal of Sociology 50 (2): 177-194. Vlaev, Ivo, Petko Kusev, Neil Stewart, Silvio Aldrovandi, and Nick Chater. 2010. “Domain Effects and Financial Risk Attitudes” Risk Analysis 30(9): 1374-1386
Verba, Sidney, Kay Lehman Schlozman, and Henry E. Brady. 1995. Voice and Equality: Civic Voluntarism in American Politics. Cambridge, MA: Harvard University Press.
46
Warren, Elizabeth, and Amelia Warren Tyagi. 2003. The Two-Income Trap: Why Middle-Class Mothers and Fathers are Going Broke. New York: Basic. Weber, Elke U., Ann-Renee Blais, and Nancy E. Betz. 2002. “A Domain-Specific Risk Attitude Scale: Measuring Risk Perceptions and Risk Behaviors.” Journal of Behavioral Decision Making 15: 263–290 Weatherford, Stephen M., and Boris Sergeyev. 2000. “Thinking about Economic Interests: Class and Recession in the New Deal.” Political Behavior 22(4): 311-339.

Tables 1
Tables and Figures
Table 1: List of shocks, grouped by domain
Domains and shocks
Employment
• Been unemployed not by personal choice • Had other working adults in your household unemployed, not by personal choice • You or someone in your immediate family lost more than a month from work due to serious illness or
injury Health
• Had to pay a lot more for your health insurance than expected • Had major out-of-pocket medical expenses as the result of serious illness or injury to you or your
immediate family • Lost your health insurance
Family • Spent a substantial sum helping out your extended family • Been divorced or separated from your spouse • Had your spouse/partner pass away
Wealth • Had the value of your investments or retirement funds decline substantially • Had the value of your house decline substantially • Had your retirement benefits at work cut substantially (including having employer ask you to cover
more of these costs) Note: Wave 15: “At any time in the past 12 months, have you: …” Wave 21: “At any time since March 2009, have you: …”
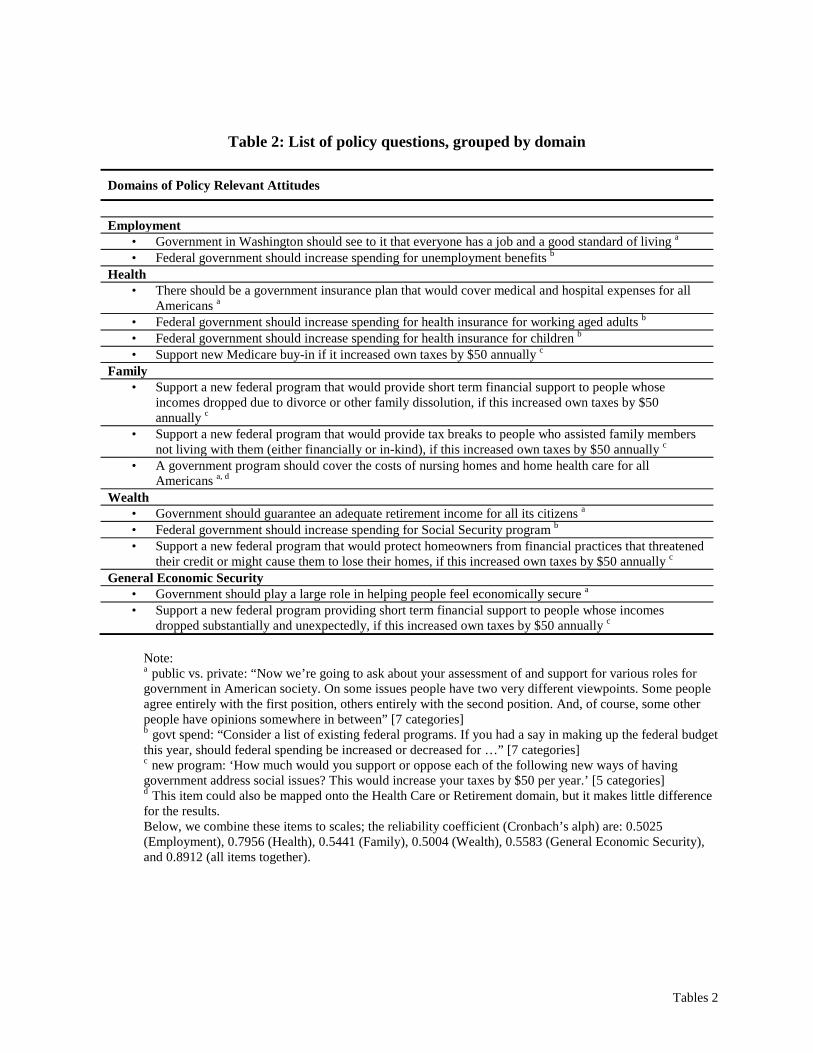
Tables 2
Table 2: List of policy questions, grouped by domain
Domains of Policy Relevant Attitudes
Employment
• Government in Washington should see to it that everyone has a job and a good standard of living a • Federal government should increase spending for unemployment benefits b
Health • There should be a government insurance plan that would cover medical and hospital expenses for all
Americans a • Federal government should increase spending for health insurance for working aged adults b • Federal government should increase spending for health insurance for children b • Support new Medicare buy-in if it increased own taxes by $50 annually c
Family • Support a new federal program that would provide short term financial support to people whose
incomes dropped due to divorce or other family dissolution, if this increased own taxes by $50 annually c
• Support a new federal program that would provide tax breaks to people who assisted family members not living with them (either financially or in-kind), if this increased own taxes by $50 annually c
• A government program should cover the costs of nursing homes and home health care for all Americans a, d
Wealth • Government should guarantee an adequate retirement income for all its citizens a • Federal government should increase spending for Social Security program b • Support a new federal program that would protect homeowners from financial practices that threatened
their credit or might cause them to lose their homes, if this increased own taxes by $50 annually c General Economic Security
• Government should play a large role in helping people feel economically secure a • Support a new federal program providing short term financial support to people whose incomes
dropped substantially and unexpectedly, if this increased own taxes by $50 annually c
Note: a public vs. private: “Now we’re going to ask about your assessment of and support for various roles for government in American society. On some issues people have two very different viewpoints. Some people agree entirely with the first position, others entirely with the second position. And, of course, some other people have opinions somewhere in between” [7 categories] b govt spend: “Consider a list of existing federal programs. If you had a say in making up the federal budget this year, should federal spending be increased or decreased for …” [7 categories] c new program: ‘How much would you support or oppose each of the following new ways of having government address social issues? This would increase your taxes by $50 per year.’ [5 categories] d This item could also be mapped onto the Health Care or Retirement domain, but it makes little difference for the results. Below, we combine these items to scales; the reliability coefficient (Cronbach’s alph) are: 0.5025 (Employment), 0.7956 (Health), 0.5441 (Family), 0.5004 (Wealth), 0.5583 (General Economic Security), and 0.8912 (all items together).

Tables 3
Table 3: The unequal incidence of shocks and worries
Group Employment Health Family Wealth
% very/fairly worried % very/fairly
worried % very/fairly worried % very/fairly
worried
Been unemployed
not by personal choice
Losing / finding job
Had major out-of-pocket
medical expenses
Major out-of-pocket medical expenses
Spent a substantial
sum helping out your extended
family
Needing to help out a family if
they get in financial trouble
Had retirement benefits at work cut
substantially
Having your retirement
benefits cut substantially at your main
job Education:
<=HS diploma 29.7 45.8 27.6 51.2 32.1 42.9 18.3 36.1 <=BA degree 21.1 33.9 23.8 43.6 28.5 30.1 20.5 32.4
Grad degree 13.7 26.4 23.5 33.9 29.9 27.6 20.0 26.9
Income: Lowest 40.9 49.2 28.7 55.2 31.7 41.4 16.0 37.3 Middle 20.9 36.0 24.5 45.2 29.2 34.2 20.2 31.4 Highest 9.7 28.7 21.3 34.5 29.9 27.8 23.6 30.7
Race/Ethnicity:
Black 43.4 35.4 29.7 48.6 39.5 41.6 16.8 40.0 Hispanic 24.4 55.2 31.1 50.2 33.8 47.8 23.0 39.7
White 20.2 36.0 23.8 44.7 28.3 33.0 19.7 31.3 Other 25.0 48.9 28.6 48.3 27.8 25.7 20.3 41.2
Note: Shocks refer to time-period March 2008 to September 2009.

Tables 4
Table 4: The DNA of insecurity
% affected % very or fairly worried
W21: 0 W21: 1 W21: 2-3 W21: 0 W21: 1 W21: 2-3 Employment domain
Losing / finding job (avg: 37.7%)
W15: 0 54.1 10.2 2.8 24.9 55.0 49.9 W15: 1 9.0 8.1 4.3 32.0 48.1 63.2 W15: 2-3 3.4 2.5 5.5 51.9 62.2 71.8
Health domain
Having a serious illness in your immediate family that creates major
out-of-pocket medical expenses (avg.: 45.4%)
W15: 0 50.3 8.3 3.1 31.7 51.8 51.6 W15: 1 11.6 10.1 3.7 43.2 57.6 81.8 W15: 2-3 3.3 4.6 5.2 61.4 73.1 84.7
Family domain
Needing to help out a member of your extended family if they get in financial
trouble (avg.: 34.4%)
W15: 0 65.7 9.0 0.7 25.7 44.4 66.7 W15: 1 10.8 11.1 0.7 44.6 56.7 58.9 W15: 2-3 0.7 0.6 0.7 61.4 78.0 92.5
Wealth domain
Having enough money to retire on (avg.: 52.8%)
W15: 0 24.4 4.3 0.9 48.1 42.9 60.2 W15: 1 11.9 16.3 6.3 42.8 50.7 65.9 W15: 2-3 4.8 10.6 20.5 47.5 51.6 65.7
Note: W15: number of shocks in domain, between March 2008 and March 2009 W21: number of shocks in domain, between March 2009 and September 2009 In these samples, the average percentage of very or fairly worried respondents is 37.3% (employment), 45.4% (health), 34.4% (family), and 52.8% (wealth).

Tables 5
Table 5: The DNA of insecurity (multivariate)
(1) (2) (3) (4)
Employment domain: Worry
losing/finding job
Health domain: Worry having a serious illness in your immediate
family that creates major out-of-pocket
medical expenses
Family domain: Worry needing to
help out a member of your extended family
if they get in financial trouble
Wealth domain: Worry having
enough money to retire on
Domain specific shocks: 0 shocks in w21 Ref cat Ref cat Ref cat Ref cat 1 shock in w21 0.652** 0.453** 0.630** 0.303* (0.135) (0.114) (0.118) (0.120) 2-3 shocks in w21 0.713** 0.860** 1.133** 0.638** (0.189) (0.161) (0.331) (0.142) 0 shocks in w15 Ref cat Ref cat Ref cat Ref cat 1 shock in w15 -0.034 0.178 0.379** 0.413** (0.136) (0.111) (0.115) (0.132) 2-3 shocks in w15 0.594** 0.867** 0.784* 0.487** (0.193) (0.157) (0.335) (0.152)
Shocks in other domains: (0.189) (0.161) (0.331) (0.142) # of other shocks (0-3+), w21 0.381** 0.300** 0.207** 0.400**
(0.054) (0.050) (0.045) (0.050) # of other shocks (0-3+), w15 0.156** 0.162** 0.224** 0.215** (0.058) (0.052) (0.048) (0.049)
Income quintile 1 (lowest) Ref cat Ref cat Ref cat Ref cat Income quintile 2 -0.043 -0.338* -0.185 0.039 (0.172) (0.146) (0.143) (0.151) Income quintile 3 -0.001 -0.469** -0.155 -0.070 (0.166) (0.141) (0.139) (0.147) Income quintile 4 -0.424* -0.549** 0.130 0.147 (0.184) (0.161) (0.155) (0.163) Income quintile 5 (highest) -0.164 -0.534** -0.120 0.332* (0.185) (0.160) (0.158) (0.165) Education: <=HS diploma Ref cat Ref cat Ref cat Ref cat Education: <=BA degree -0.263* -0.052 -0.367** 0.013 (0.114) (0.099) (0.100) (0.103) Education: Grad degree -0.313 0.062 -0.362* 0.059 (0.196) (0.163) (0.163) (0.168) Party-ID: Democrat Ref cat Ref cat Ref cat Ref cat Party-ID: Independent -0.132 0.165 -0.035 0.226 (0.171) (0.154) (0.156) (0.156) Party-ID: Republican -0.240# -0.038 -0.240* -0.129 (0.138) (0.121) (0.120) (0.125) Ideology: Liberal Ref cat Ref cat Ref cat Ref cat Ideology: Moderate 0.238 0.262# 0.161 0.092 (0.159) (0.141) (0.141) (0.146) Ideology: Conservative -0.295* -0.184 0.081 -0.253# (0.146) (0.128) (0.128) (0.133) cont.

Tables 6
(1) (2) (3) (4)
Employment domain: Worry
losing/finding job
Health domain: Worry having a serious illness in your immediate
family that creates major out-of-pocket
medical expenses
Family domain: Worry needing to
help out a member of your extended family
if they get in financial trouble
Wealth domain: Worry having
enough money to retire on
Age -0.024** -0.002 0.015** -0.012** (0.004) (0.004) (0.004) (0.004) Female 0.047 0.299** 0.048 0.337** (0.105) (0.091) (0.090) (0.094) Black -0.878** -0.564** -0.299# -0.751** (0.167) (0.154) (0.154) (0.157) Hispanic 0.329# -0.316# 0.242 -0.000 (0.187) (0.178) (0.176) (0.176) # of kids 0.027 -0.088* 0.067# 0.052 (0.041) (0.038) (0.038) (0.039) Married -0.071 0.212# -0.109 0.056 (0.126) (0.110) (0.111) (0.113) In labor force 0.567** 0.148 -0.063 0.918** (0.149) (0.110) (0.109) (0.112) How long till in financial -0.204** -0.213** -0.249** -0.512** trouble? (0.036) (0.032) (0.032) (0.035) Risk averse (job) -0.036 -0.048# -0.023 -0.018 (0.032) (0.029) (0.029) (0.029) Risk averse (general) 0.218** 0.308** 0.247** 0.214** (0.071) (0.060) (0.060) (0.062) Economy is better (10/08) Ref cat Ref cat Ref cat Ref cat Economy is same (10/08) 0.058 -0.976* 0.126 -0.529 (0.526) (0.473) (0.507) (0.525) Economy is worse (10/08) -0.053 -1.215** -0.005 -0.454 (0.478) (0.434) (0.477) (0.492) Economy will be better (10/08) Ref cat Ref cat Ref cat Ref cat Economy will be same (10/08) 0.114 0.347** 0.181# 0.289** (0.122) (0.106) (0.105) (0.108) Economy will be worse (10/08) 0.208 0.656** 0.390** 0.428** (0.133) (0.118) (0.117) (0.121) N. of cases 1466 1909 1913 1905 Pseudo R2 0.121 0.084 0.064 0.152 Wald Chi2 485.9 416.7 313.6 778.1 Log likelihood -1771.0 -2286.1 -2292.1 -2173.4 DF 30 30 30 30
Note: # p<0.1, * p<0.05, ** p<0.01. Coefficients above standard errors in parenthese. Ordered logit estimations. Evaluations of the economy are from wave 10 (October 2008) Number of shocks in other domains are top-coded at 3 (theoretical range is from 0 to 9). Categories for dependent variable are: 1=not at all; 2=slightly; 3=fairly; 4=very worried.

Tables 7
Table 6: Explaining social policy attitudes with worries (multivariate)
(1) (2) (3) (4) (5) (6) Employment Health Family Wealth General All
Worries (1=not at all; 2= 0.247** 0.178** 0.098** 0.173** 0.130** 0.213** slightly; 3=fairly; 4=very) (0.027) (0.027) (0.029) (0.029) (0.028) (0.026) Income quintile 1 (lowest) Ref cat Ref cat Ref cat Ref cat Ref cat Ref cat Income quintile 2 0.059 -0.017 -0.014 0.037 0.012 0.025 (0.063) (0.062) (0.067) (0.067) (0.064) (0.060) Income quintile 3 -0.059 -0.008 -0.094 -0.030 -0.124* -0.048 (0.062) (0.061) (0.065) (0.066) (0.063) (0.059) Income quintile 4 -0.118# -0.046 -0.193** -0.108 -0.112 -0.115# (0.071) (0.069) (0.074) (0.075) (0.072) (0.067) Income quintile 5 (highest) -0.224** -0.139* -0.260** -0.288** -0.242** -0.250** (0.071) (0.070) (0.075) (0.076) (0.072) (0.068) Education: <=HS diploma Ref cat Ref cat Ref cat Ref cat Ref cat Ref cat Education: <=BA degree -0.023 0.010 -0.062 -0.029 -0.050 -0.026 (0.045) (0.044) (0.047) (0.047) (0.045) (0.042) Education: Grad degree 0.036 0.132# -0.041 -0.046 0.105 0.056 (0.074) (0.073) (0.078) (0.079) (0.076) (0.071) Party-ID: Democrat Ref cat Ref cat Ref cat Ref cat Ref cat Ref cat Party-ID: Independent -0.410** -0.374** -0.401** -0.226** -0.387** -0.428** (0.069) (0.067) (0.072) (0.073) (0.070) (0.065) Party-ID: Republican -0.507** -0.667** -0.497** -0.380** -0.589** -0.668** (0.055) (0.053) (0.057) (0.058) (0.055) (0.052) Ideology: Liberal Ref cat Ref cat Ref cat Ref cat Ref cat Ref cat Ideology: Moderate 0.009 -0.262** -0.205** -0.050 -0.128* -0.191** (0.063) (0.062) (0.067) (0.067) (0.064) (0.060) Ideology: Conservative -0.291** -0.573** -0.401** -0.297** -0.368** -0.487** (0.058) (0.056) (0.061) (0.061) (0.058) (0.055) Age 0.001 0.001 0.003# 0.005** -0.004* 0.002 (0.002) (0.001) (0.002) (0.002) (0.002) (0.001) Female 0.101* 0.122** 0.181** 0.134** 0.060 0.154** (0.041) (0.040) (0.043) (0.044) (0.042) (0.039) Black 0.382** 0.152* 0.204** 0.270** 0.066 0.260** (0.066) (0.065) (0.070) (0.070) (0.067) (0.063) Hispanic 0.177* -0.001 -0.038 0.175* 0.108 0.083 (0.079) (0.077) (0.083) (0.084) (0.080) (0.075) # of kids -0.016 -0.019 -0.019 -0.002 -0.023 -0.021 (0.017) (0.016) (0.018) (0.018) (0.017) (0.016) Married 0.070 0.075 -0.022 0.094# 0.027 0.055 (0.048) (0.047) (0.051) (0.051) (0.049) (0.046) In labor force 0.093# 0.059 0.175** 0.050 0.100* 0.104* (0.049) (0.048) (0.051) (0.052) (0.050) (0.046) How long till in financial -0.029# -0.015 -0.027# -0.025 -0.045** -0.027# trouble? (0.015) (0.014) (0.016) (0.016) (0.015) (0.014) Risk averse (job) 0.024# 0.036** 0.043** 0.063** 0.008 0.045** (0.013) (0.012) (0.013) (0.014) (0.013) (0.012) Risk averse (general) 0.022 0.017 -0.030 0.005 0.037 0.023 (0.026) (0.026) (0.027) (0.028) (0.026) (0.025) cont.

Tables 8
(1) (2) (3) (4) (5) (6) Employment Health Family Wealth General All
Economy is better (10/08) Ref cat Ref cat Ref cat Ref cat Ref cat Ref cat Economy is same (10/08) -0.200 -0.054 -0.115 0.056 -0.670** -0.208 (0.219) (0.214) (0.230) (0.233) (0.222) (0.208) Economy is worse (10/08) -0.210 -0.049 0.019 0.149 -0.510* -0.139 (0.205) (0.200) (0.215) (0.218) (0.208) (0.194) Economy will be better (10/08) Ref cat Ref cat Ref cat Ref cat Ref cat Ref cat Economy will be same (10/08) 0.096* 0.098* 0.073 0.173** 0.069 0.124** (0.048) (0.047) (0.050) (0.051) (0.048) (0.045) Economy will be worse (10/08) 0.213** 0.120* 0.122* 0.149** 0.140** 0.161** (0.053) (0.052) (0.056) (0.056) (0.054) (0.050) Constant -0.363 -0.120 0.082 -0.856** 0.782** -0.230 (0.270) (0.264) (0.284) (0.287) (0.273) (0.256) N. of cases 1920 1920 1920 1920 1921 1921 adj R2 0.278 0.328 0.223 0.196 0.255 0.366
Note: # p<0.1, * p<0.05, ** p<0.01. Coefficients above standard errors in parentheses. OLS estimations. The dependent variables are scales of policy attitudes with zero mean and standard deviations of one. Higher values indicate pro government intervention attitudes.

Tables 9
Table 7: Explaining social policy attitudes with shocks (multivariate)
(1) (2) (3) (4) (5) (6) (7) (8) Employment Health Family Wealth
[Dependent variables and estimators differ. See note] # of specific shocks in domain (0-6) 0.108** 0.149** 0.039* 0.077* 0.079** 0.147** -0.008 -0.037 [w15+w21] (0.018) (0.039) (0.017) (0.038) (0.027) (0.056) (0.014) (0.029) # of shocks in other domains (0-17) 0.031** 0.083** 0.029** 0.057** 0.015* 0.043** 0.042** 0.063** [w15+w21] (0.008) (0.017) (0.009) (0.019) (0.007) (0.015) (0.010) (0.020) Income quintile 1 (lowest) Ref cat Ref cat Ref cat Ref cat Ref cat Ref cat Ref cat Ref cat Income quintile 2 0.061 -0.005 -0.027 -0.209 -0.025 -0.007 0.036 -0.088 (0.064) (0.137) (0.062) (0.139) (0.067) (0.138) (0.068) (0.134) Income quintile 3 -0.071 -0.435** -0.031 -0.286* -0.117# -0.503** -0.032 -0.136 (0.063) (0.132) (0.061) (0.133) (0.065) (0.132) (0.067) (0.130) Income quintile 4 -0.129# -0.605** -0.067 -0.350* -0.216** -0.674** -0.100 -0.472** (0.071) (0.151) (0.070) (0.151) (0.074) (0.150) (0.077) (0.153) Income quintile 5 (highest) -0.222** -0.660** -0.160* -0.610** -0.285** -0.804** -0.275** -0.685** (0.072) (0.151) (0.071) (0.152) (0.075) (0.150) (0.077) (0.152) Education: <=HS diploma Ref cat Ref cat Ref cat Ref cat Ref cat Ref cat Ref cat Ref cat Education: <=BA degree -0.036 0.029 -0.004 0.177# -0.066 0.063 -0.029 -0.063 (0.045) (0.096) (0.044) (0.095) (0.047) (0.096) (0.048) (0.094) Education: Grad degree 0.026 0.252 0.120 0.644** -0.037 0.095 -0.048 0.067 (0.075) (0.157) (0.073) (0.159) (0.078) (0.156) (0.079) (0.155) Party-ID: Democrat Ref cat Ref cat Ref cat Ref cat Ref cat Ref cat Ref cat Ref cat Party-ID: Independent -0.370** -0.750** -0.354** -0.650** -0.387** -0.565** -0.215** -0.275# (0.069) (0.147) (0.068) (0.146) (0.072) (0.148) (0.073) (0.144) Party-ID: Republican -0.503** -1.032** -0.671** -1.425** -0.500** -0.733** -0.387** -0.387** (0.055) (0.119) (0.054) (0.118) (0.057) (0.116) (0.058) (0.114) Ideology: Liberal Ref cat Ref cat Ref cat Ref cat Ref cat Ref cat Ref cat Ref cat Ideology: Moderate 0.021 0.222 -0.248** -0.385** -0.206** -0.260# -0.044 -0.112 (0.064) (0.135) (0.062) (0.135) (0.067) (0.137) (0.068) (0.131) Ideology: Conservative -0.309** -0.487** -0.586** -1.199** -0.408** -0.767** -0.308** -0.538** (0.058) (0.123) (0.057) (0.124) (0.061) (0.123) (0.062) (0.120) Age 0.000 -0.014** -0.000 -0.007* 0.001 0.004 0.005** 0.004 (0.002) (0.003) (0.002) (0.003) (0.002) (0.003) (0.002) (0.003) Female 0.121** 0.326** 0.139** 0.145# 0.191** 0.415** 0.143** 0.183* (0.041) (0.088) (0.040) (0.087) (0.043) (0.087) (0.044) (0.086) Black 0.301** 0.281# 0.101 0.216 0.160* 0.001 0.202** 0.075 (0.066) (0.144) (0.065) (0.141) (0.070) (0.144) (0.071) (0.139) Hispanic 0.165* 0.254 -0.010 0.012 -0.050 -0.267 0.173* 0.043 (0.079) (0.167) (0.078) (0.168) (0.083) (0.164) (0.085) (0.162) # of kids -0.026 -0.075* -0.025 -0.091* -0.027 -0.100** -0.005 0.039 (0.017) (0.036) (0.017) (0.036) (0.018) (0.036) (0.018) (0.036) Married 0.074 0.156 0.083# 0.254* 0.005 0.257* 0.109* 0.093 (0.049) (0.103) (0.048) (0.105) (0.052) (0.105) (0.052) (0.103) In labor force 0.103* 0.216* 0.066 0.197# 0.182** 0.293** 0.066 0.088 (0.049) (0.106) (0.048) (0.105) (0.051) (0.106) (0.052) (0.103) How long till in financial trouble? -0.053** -0.114** -0.037** -0.090** -0.037* -0.066* -0.043** -0.019 (0.014) (0.030) (0.014) (0.030) (0.015) (0.030) (0.015) (0.030) Risk averse (job) 0.024# 0.044 0.034** 0.020 0.041** 0.061* 0.062** 0.076** (0.013) (0.028) (0.013) (0.027) (0.013) (0.028) (0.014) (0.027) cont.

Tables 10
(1) (2) (3) (4) (5) (6) (7) (8) Employment Health Family Wealth
Risk averse (general) 0.048# -0.024 0.034 -0.020 -0.017 -0.068 0.025 -0.004 (0.026) (0.057) (0.026) (0.057) (0.027) (0.056) (0.028) (0.055) Economy is better (10/08) Ref cat Ref cat Ref cat Ref cat Ref cat Ref cat Ref cat Ref cat Economy is same (10/08) -0.213 -0.555 -0.066 0.426 -0.119 0.044 0.036 -0.328 (0.219) (0.521) (0.215) (0.495) (0.230) (0.541) (0.234) (0.452) Economy is worse (10/08) -0.264 -0.619 -0.088 0.409 0.007 0.234 0.112 -0.226 (0.205) (0.494) (0.201) (0.466) (0.215) (0.512) (0.219) (0.419) Economy will be better (10/08) Ref cat Ref cat Ref cat Ref cat Ref cat Ref cat Ref cat Ref cat Economy will be same (10/08) 0.108* 0.095 0.108* 0.049 0.074 0.155 0.184** 0.378** (0.048) (0.101) (0.047) (0.101) (0.050) (0.099) (0.051) (0.100) Economy will be worse (10/08) 0.242** 0.466** 0.147** 0.314** 0.132* 0.165 0.175** 0.350** (0.053) (0.112) (0.052) (0.112) (0.055) (0.110) (0.056) (0.111) Constant 0.126 Cut 0.285 Cut 0.297 Cut -0.513# Cut (0.263) Points (0.257) Points (0.275) Points (0.280) Points N. of cases 1920 1907 1920 1901 1920 1900 1920 1900 adj R2 0.274 0.322 0.225 0.189 Pseudo R2 0.056 0.077 0.028 0.001 Wald Chi2 382.0 540.9 195.5 7.4 Log likelihood -2394 -3208 -2356 -3249 -2484 -3362 -2515 -3452 DF 26 26 26 26 26 26 26 26
Note: # p<0.1, * p<0.05, ** p<0.01. Coefficients above standard errors in parentheses. Odd-numbered models are OLS estimations. Even-numbered models are ordered logit estimations. The dependent variables are (higher values indicate pro government intervention attitudes): (1) Scale on (un)employment policy attitudes (mean=0, SD=1; OLS) (2) Gov resp: Guaranteed Good Employment (1 to 7; ordered logit) (3) Scale on health policy attitudes (mean=0, SD=1; OLS) (4) Gov resp: Health Insurance (1 to 7; ordered logit) (5) Scale on family policy attitudes (mean=0, SD=1; OLS) (6) Gov resp: Long Term Care (1 to 7; ordered logit) (7) Scale on wealth/retirement/housing policy attitudes (mean=0, SD=1; OLS) (8) Gov resp: Guaranteed Retirement Income (1 to 7; ordered logit)

Figures 1
Figure 1: Ability to buffer
six months or more (29.8%)
less than six months (70.2%)
less than two months (48.4%)
less than four weeks (29.7%)
less than two weeks (19.5%)
less than one week (9.1%)
0 20 40 60 80 100% of respondents
Note: Shown are frequencies of answers to the following item: “If you suddenly stopped getting your paychecks for some reason, about how long could you and your family get by before being in real financial trouble?” Data are averaged across the March and September 2009 waves.

Figures 2
Figure 2: Scope of worries
0 10 20 30 40 50% of respondents
Economic Security------
RetirementDebt
Housing StabilityPension
------Lose Spouse (Death/Divorce)
Help Family------
Coverage CutsOut of Pocket Cost
Loss CoverageLong-Term Care
------Lose/Find Job
Lost Work Due to Illness
Fairly worried Very worried
Note: Data are averaged across the March and September 2009 waves.

Figures 3
Figure 3: Scope of worries and shocks, by domains
0 10 20 30 40 50 60 70 80 90% of respondents
Any shock
Any worries
------
Any wealth related shocks
Any wealth related worries
------
Any family related shocks
Any family related worries
------
Any health related shocks
Any health related worries
------
Any employment related shocks
Any employment related worries
Fairly or very worried % experiencing shock
Note: Data are averaged across the March and September 2009 waves.

Figures 4
Figure 4: Scope of worries, over time (Kaiser)
0
20
40
60
2004
2005
2006
2007
2008
2009
2010
2004
2005
2006
2007
2008
2009
2010
2004
2005
2006
2007
2008
2009
2010
Losing your job Losing your health insurance coverage Not being able to pay your rent / mortgage
Somewhat worried Very worried
% o
f res
pond
ents
Source: Kaiser Health Tracking Poll (June 2010)

Figures 5
Figure 5: Scope of worries, over time (Rockefeller)
0
20
40
60
Spring
2007
Spring
2009
Fall 20
09
Spring
2007
Spring
2009
Fall 20
09
Spring
2007
Spring
2009
Fall 20
09
Spring
2007
Spring
2009
Fall 20
09
Spring
2007
Spring
2009
Fall 20
09
Spring
2007
Spring
2009
Fall 20
09
Spring
2007
Spring
2009
Fall 20
09
Employment Health Insurance Medical Cost Debt Retirement Housing Stability Economic Security
Fairly worried Very worried
% o
f res
pond
ents
Sources: Rockefeller (2007) and SERPI (2009)

Figures 6
Figure 6: Ability to buffer (by groups)
0 20 40 60 80 100% of respondents
Other
White
Hispanic
Black
------
highest income
middle income
lowest income
------
Grad degree
<=BA degree
<=HS dipolma
<=1 month 1-6 months 6+ months
Note: Shown are frequencies of answers to the following item: “If you suddenly stopped getting your paychecks for some reason, about how long could you and your family get by before being in real financial trouble?” Data are averaged across the March and September 2009 waves.
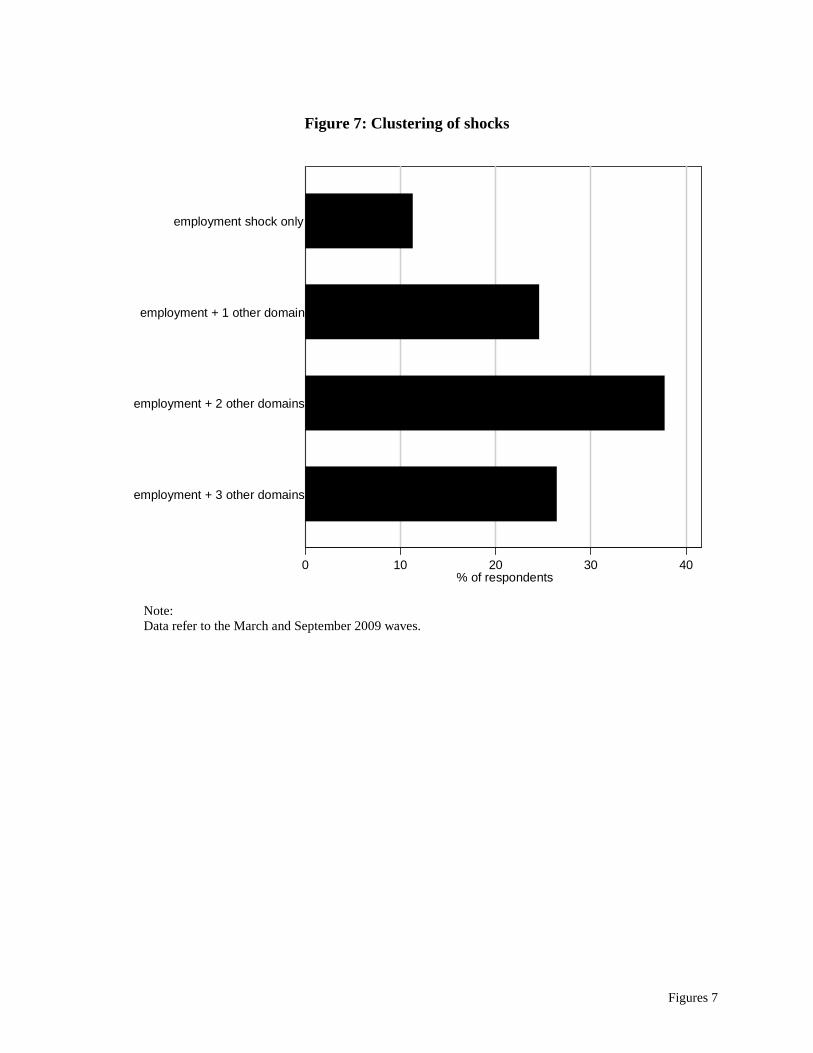
Figures 7
Figure 7: Clustering of shocks
0 10 20 30 40% of respondents
employment + 3 other domains
employment + 2 other domains
employment + 1 other domain
employment shock only
Note: Data refer to the March and September 2009 waves.