Habitat Inventory and Assessment of Juanita Creek in 2000
49
Habitat Inventory and Assessment of Juanita Creek in 2000 April 2002
Transcript of Habitat Inventory and Assessment of Juanita Creek in 2000

Habitat Inventory and Assessmentof Juanita Creek in 2000
April 2002
Habitat Inventory and Assessment ofJuanita Creek in 2000
April 2002
Report to:
City of Kirkland
King County Department of Natural Resources and ParksWater and Land Resources Division
Stacey Rush, City of KirklandKaren Fevold, King County Water and Land Resources DivisionChris May, University of Washington, Seattle
Funded by Lake Washington/Cedar/Sammamish Forumthrough King Conservation District Funds
Alternate formats are available upon request by contacting206-296-7592 (Voice) or 800-833-6388 (TTY).
Habitat Inventory and Assessment of Juanita Creek in 2000 1
SUMMARYDeclining stocks of native salmon, increasing urbanization, and the listing of the Puget Soundchinook evolutionarily significant unit (ESU) as threatened under the Endangered Species Act haveintensified interest in assessing instream habitat conditions in the City of Kirkland and King Countystreams. Little current information about the habitat condition of Juanita Creek was available. TheKing Conservation District provided funding to Kirkland and King County to complete thisassessment.
In August of 2000, habitat on Juanita Creek was assessed using methods derived from standardassessment protocols. The goals of the habitat assessment project for Juanita Creek were threefold:(1) characterize instream and riparian habitat quality–primarily for salmonids; (2) establish a baselinefor future evaluation of trends in habitat quality and watershed function; and (3) provide informationfor process of prioritizing areas for restoration and preservation. Stream segments were defined byusing the Salmon and Steelhead Habitat Inventory and Assessment Program (SSHIAP) streamsegment delineation, which is based on stream gradient and confinement categories.
The results of the habitat assessments indicate that channel and habitat structure of a number of thesegments of Juanita Creek are degraded relative to values from published “properly functioningconditions” for the Puget Sound or the Pacific Northwest region. For example, riparian vegetationquality and large woody debris (LWD) frequencies are below the prescribed properly functioning ornatural conditions in all segments. Pools are of low quality in most segments. This decreased qualityof slow water rearing habitat may limit juvenile carrying capacity as well as hinder upstreammigration by adult salmon.
These data suggest that processes creating natural habitat structure are likely to be altered fromnatural conditions. Previous analysis of basin land cover reveals little forested cover remaining andhigh percentages of impervious surfaces, which are changes that have been shown to alter the basinhydrologic regime. These increases in the rate at which stormwater runoff enters the streamincreases erosion rates and lead to destabilization of channel morphology. Riparian vegetationseldom resembled natural conditions and was nearly completely depleted of sources of high quality,coniferous LWD. Dominant riparian vegetation included ornamental trees and shrubs and lawnsassociated with landscaping, native shrubs, and deciduous forest. As a result, LWD frequencies werelow in most segments of Juanita Creek. The low amounts of instream LWD are likely responsiblefor the low pool frequency.
Data collected during assessment of Juanita Creek provide important baseline information formonitoring changes in habitat quality, and for any restoration projects that might occur in the basins.Data contained herein may be used for an analysis of factors that may be limiting productivity ofsalmonid species in this basin. The collected data may also be analyzed at a finer spatial scale toinform project planning at more localized sites or among basins for regional project planning. Landuse planning, transportation planning, and stormwater management planning in these basins may alsobenefit from these data. Water Resource Inventory Area 8 (WRIA 8, Lake Washington Area)reconnaissance assessments and watershed planning for salmonid species recovery have utilizedthese data and will likely continue to do so.

Habitat Inventory and Assessment of Juanita Creek in 2000 2
INTRODUCTIONOver the past century, the historic range of Pacific salmon in the Pacific Northwest (PNW) has beenreduced by nearly 50% (Nehlsen et al. 1991). The resulting reduction in salmonid abundance anddiversity has led to the listing of several salmon stocks in the PNW under the Federal EndangeredSpecies Act (ESA). There is no single cause for this decline, but significant contributors are humanimpacts on the aquatic ecosystems that support salmon populations (NRC 1996). Activities such astimber harvest, mining, agriculture, grazing, dams, fishing, hatcheries, and urbanization have allcontributed to the “salmon problem.” Urbanization (residential, commercial, and industrial) has beenespecially hard on small streams in the lowland ecoregions of the PNW (May et al. 1997). Thesesmall streams provide critical habitat for all freshwater life stages of salmonids (Williams et al. 1975).
The objective of the stream habitat assessment implemented by the City of Kirkland and KingCounty in 2000 and described in this report was to quantify and assess the quality of the instream andriparian conditions that contribute to salmonid habitat. Stream habitat evaluation is a core element ofseveral recently implemented regional programs. The Water Resource Inventory Area 8 (WRIA 8,Greater Lake Washington Watershed) technical committee is compiling stream habitat information aspart of the salmon recovery planning process, which will result in identification of areas that requirestream habitat restoration and preservation. The stream habitat assessment data discussed in thisreport have been incorporated into the “Salmon and Steelhead Habitat Limiting Factors. WaterResource Inventory Area 8” dated 2001 (Kerwin 2001). This report will provide information aboutJuanita Creek to benefit these and other projects and also supports other land use planning andSensitive Areas regulation efforts.
Stream habitat loss and degradation are often cited as important limiting factors to salmon (Salo andCundy 1987, Groot and Margolis 1991, Nehlsen et al. 1991, NRC 1996). High-quality rearing habitat iscritical for the survival of juvenile salmonids from emergence to smolt migration. Adequate totalpool area and depth along with sufficient hiding and thermal cover are necessary for successfulsalmonid rearing (Konopacky 1984, (Bjornn and Reiser 1991). Juvenile chinook, for example, usedeep pools with good cover for freshwater rearing when they have emerged from stream gravels andbefore smoltification (Bjornn and Reiser 1991). Salmonids often shift their habitat preferencesseasonally, primarily as a result of changes in flow and usable stream area. For example, juvenilecoho prefer off-channel, backwater, or wetland pools during the winter, and show a preference formain-channel pools formed by large woody debris (LWD) in the summer months (Nawa et al. 1990,Nickelson et al. 1992, Peterson et al. 1992). In addition, adult chinook require deep staging or holdingpools for their upstream migration and spawning (Giger 1973).
Human activities in the watershed can have detrimental effects on salmonid spawning habitat (Bissonet al. 1992). Pool frequency and quality decreases with increasing urbanization, in addition rifflestend to be replaced with glide habitat in channelized reaches (May 1997). Some studies indicate thatthe optimum pool to riffle ratio for salmonid production and over-winter survival is approximately1:1 (Nickelson et al. 1992). On the other hand, Montgomery et al. (1999) found that chinook and cohoredd frequency increased with decreasing pool spacing (i.e., increased pool frequency) in tributariesto the Skagit River. Streambed substrate is also critical to spawning success, incubation, and survivalto emergence for salmonids. Each salmonid species has a specific preference for spawning habitatconditions (Kondolf and Wolman 1993), but all salmonids require spawning gravels that are highlypermeable and well-oxygenated (McNeil 1966, Chapman 1988, Crisp and Carling 1989). Humanactivities in the watershed may contribute to sediment deposition in the interstitial spaces of

Habitat Inventory and Assessment of Juanita Creek in 2000 3
spawning gravels by increasing over-land flow (including runoff) and stream bank erosion. Thissediment may suffocate biota reliant on well-oxygenated intragravel flow (Hartman and Brown 1987).
Large woody debris performs numerous instream functions contributing to the formation of highquality aquatic habitat. Large woody debris is a key component for maintaining a high degree ofhabitat complexity and spatial heterogeneity in streams (Maser et al. 1988). In addition, LWDmaintains the hydraulic stability of critical instream habitat features, especially pools (Bilby and Ward1991). High-flow refuge for salmonids is provided by LWD, which dissipates hydraulic energyduring peak flows (Bilby 1984). In addition, LWD stabilizes streambeds by minimizing scour andprovides excellent cover and habitat diversity for salmonids (Harmon et al. 1986). If LWD is absentor scarce in the channel, stream morphology shifts away from the characteristic pool-riffle habitat toa more simplified, glide-dominant channel form, with a subsequent decrease in available pool rearinghabitat.
Riparian forests play a critical role in the control of stream channel morphology because theystabilize the active floodplain and are the primary source of LWD. These “biophysical” interactionsare particularly important to PNW stream ecosystems (Rot 1995). Riparian forest composition candetermine the longevity and function of LWD in the channel. Large woody debris derived fromconifers, especially western red cedar (Thuja plicata), tends to be larger than that from deciduousspecies, thus reducing the chance of being washed downstream. Large woody debris from conifers isalso significantly more resistant to decay. This increased resistance results in increased longevity ofinstream structural components (Harmon et al. 1986). High riparian integrity is characterized by alarge proportion of coniferous tree species, a wide buffer between the stream and any ripariandevelopment, and few spatial breaks (May and Horner 2000).
Modifications to natural land cover and the drainage network that result from urbanization changethe hydrologic regime of the basin land-cover (Horner and May 1999) (Figure 1)). Under naturalland-cover conditions in the PNW most stormwater infiltrates, and stormwater runoff is

Habitat Inventory and Assessment of Juanita Creek in 2000 4
Figure 1. Typical annual water budget in watersheds with (A) forested land cover and (B) urbanizedland-cover.
produced only during very large storm events (Booth 1991). As impervious surface increases withurbanization, the sub-surface dominated hydrologic regime created by stormwater infiltration shiftsto one dominated by surface runoff. Urban development also adds numerous artificial channels tothe natural stream system. The most common of these artificial channels are road-crossings (alongwith roadside drainage-ditches) that act as conduits for surface runoff and stormwater outfalls. Littleor no infiltration or storage is associated with these artificial stormwater routing systems and as aresult the runoff volume is dramatically increased.
In August of 2000, the City of Kirkland and King County conducted habitat assessments of JuanitaCreek using the methods described herein. The goals of the habitat assessment project for JuanitaCreek were threefold: (1) characterize instream and riparian habitat quality–primarily for salmonids;(2) establish a baseline for future evaluation of trends in habitat quality and watershed function; and(3) inform the process of prioritizing areas for restoration and preservation. This report describeshow the City of Kirkland and King County characterized the stream and established baseline data forfuture monitoring projects and identification of priority restoration areas.
A. B.

Habitat Inventory and Assessment of Juanita Creek in 2000 5
JUANITA CREEKJuanita Creek is located within northeastern King County, Washington State. The Juanita Creekbasin watershed covers approximately 6.6 mi2 (17.14 km2), and extends north to Simonds Road,south to NE 116th Street, east to 132nd NE, and west to 84th Avenue NE (Figure 4).
The climate and rainfall patterns in King County are typical of the Puget Sound Lowland (PSL)Ecoregion, with about 75% of the annual precipitation (average 38 inches annually) falling during thewinter rainy season from October through April. Most precipitation is in the form of rain, with littlesnowfall.
The geology and soil structure of Juanita Creek Basin has been determined largely by the Vashonperiod of the Fraser glaciation about 15,000 years ago. The predominant surficial geology in thewatershed is advance and recessional outwash deposits with some glacial till (King County 2001).The principal Soil Conservation Service (SCS) soil group within King County is classified as theAlderwood series (SCS hydrological soil group C), which is the most common soil type throughoutthe western part of the county. Hydrological soil group C is characterized by moderately high runoffpotential (King County 1990).
The mainstem of Juanita Creek originates east of Interstate 405, and flows west and south enteringthe northeast end of Lake Washington on the west side of Juanita Beach Park. There are four maintributaries flowing into Juanita Creek: Simonds Tributary, (upper west), an unnamed lower westtributary, Totem Lake Tributary (lower east), and Tributary #238 (upper east). Areas around JuanitaCreek are modified by residential and commercial development. From Juanita Drive to NE 124th
Street, Juanita Creek flows through a highly developed urban area, containing multi-family housingdevelopments and a professional center. From NE 124th Street to NE 132nd Street, Juanita Creekflows through both single and multi-family housing. Upstream of NE 132nd Street, the creek flowsthrough the grounds of a psychiatric hospital, a rehabilitation clinic, and a school, as well as EdithMoulton Park, and single family housing.
The Simonds Tributary (upper west) to Juanita Creek joins the mainstem at NE 137th Place. Thelower west tributary enters the mainstem of Juanita Creek from a culvert at NE 124th Street. Thistributary is primarily made up of stormwater from single family housing, originating from a highlydeveloped plateau further west (The Watershed Company 1998). Tributary #238 (upper east)originates north of NE 140th Street. It flows southwest to an in-stream pond near NE 132nd Street,then flows northwest and enters the mainstem of Juanita Creek near 108th Avenue NE. The TotemLake Tributary (lower east) originates from Totem Lake, and flows through culverts under manyroadways and Interstate 405. Downstream from Interstate 405, Totem Lake tributary flows throughcommercial businesses, Juanita High School, and a mix of single and multi-family residentialhousing, before entering the mainstem of Juanita Creek at a culvert outfall at 102nd Avenue NE andNE 129th Place.
The area was once almost completely forested with Douglas-fir (Pseudotsuga menziesii), western redcedar (Thuja plicata), western hemlock (Tsuga heterophylla), and red alder (Alnus rubra) (Franklinand Dyrness 1988). Repeated logging cycles beginning in the late-1800s, followed by residential andcommercial development, especially since the mid-1960s, has reduced the forested land to a fractionof the original area (approximately 12%) (May, et al. 1997).
A 1956 review of conditions in Juanita Creek mentions that a few silver salmon (also called cohosalmon, Onchorhynchus kitsch), silver trout (also called kokanee, O. nerka), and occasional cutthroat

Habitat Inventory and Assessment of Juanita Creek in 2000 6
trout (O. clarki) are found in Juanita Creek (Ajwani 1956). In addition, in an overview of salmoniddistribution in Washington streams, Williams (1975) noted that coho and sockeye salmon were foundin Juanita Creek. In 2000, volunteer salmonwatchers observed small numbers of sockeye salmon andkokanee in the Juanita Creek basin (Vanderhoof 2001b).
Habitat Inventory and Assessment of Juanita Creek in 2000 7
METHODSStream habitat assessment methods for PNW streams abound (e.g. Overton et al. 1997, Pleus andSchuett-Hames 1998, Barbour et al. 1999). Many agencies in the region have developed their ownprotocols that use unique suites of channel features and channel feature definitions for theassessments. The habitat assessment protocol used here differs from others in that it incorporates avariety of methods used by local agencies. We have attempted to take into account the utility of eachof these protocols as evaluated by Scholz and Booth (1998)In particular, methods were borrowedfrom the Timber, Fish, and Wildlife (TFW) Ambient Monitoring Manual, as well as a suite of otherstate, federal, and local protocols. The stream assessment protocol is described in detail inAppendix B.
Field MethodsThe mainstem of Juanita Creek was assessed from its mouth at Lake Washington to the upperreaches just upstream of I-405. Survey segments were identified using breaks already defined by theSalmon and Steelhead Habitat Inventory and Assessment Project (SSHIAP) (Figure 1, Appendix A).These segment breaks were determined using TFW methodology and gradient and confinementcategories described in Pleus and Shuett-Hames (1998). The segments ranged from 0.55 to 1.34kilometers long. At least 25% of each segment was assessed and assumed to be a representativesample, as determined by May, et al. (1997).
Reach CharacterizationRiparian condition, land use, bank condition, and bankfull width and depth were measured and notedapproximately every 25 meters in straight riffle habitats The intervening lengths betweenmeasurements at riffle habitat units are referred to as reaches. The following sub-sections providedescriptions of the measurements conducted at each riffle habitat.
Riparian Condition– Riparian vegetation composition was visually estimated for each 25 meters ofstream length. Dominant riparian vegetation categories were described for the right and left banksusing the following categories:
• Forest (greater than 6 m in height): coniferous, deciduous, or mixed • Shrubs and/or vines • Tall herbaceous (e.g., unmowed field)• Short herbaceous (e.g., mowed grass, pasture)• Impervious (e.g., buildings, roads, asphalt, etc.)• Residential landscaped (mowed lawn with ornamental shrubs/trees)
Presence of invasive plant species was also noted.
Bank Condition– Bank stability was determined at every riffle on each bank using a method modifiedfrom Booth (1994). The following categories were used:
• Stable: vegetated or low bars to level of low flow, or stabilizing features (rootwads, vegetation, etc.).• Unstable: signs of imminent erosion, or less than 50% vegetative cover.• Armored: artificial bank protection of any kind (rip rap, wire mesh, etc.)
Riparian vegetation, bank condition, and canopy cover were summarized over the length of eachstream segment. Weighted means of these reach scale data were calculated by summing togetherreach lengths represented by a parameter category then dividing this total length by the total numberof meters surveyed in the segment. Right and left bank data were combined to determine thepercentage of the segments falling into each data category.

Habitat Inventory and Assessment of Juanita Creek in 20
Bank full width and depth– Bank full width and depth were measured at each riffle habitat. Bank fulldischarge occurs when the water just fills the channel. The field indicators of bank full dimensionsincluded: the top of point bars, the lower limit of perennial vegetation, change in slope, bankundercuts, and stain lines. Bank full width is the width between these field indicators on each bank.Bank full depth is the average depth of water at bank full stage.
Instream Habitat InventoryThe habitat assessment included in-channel measurements of aquatic habitat units and an inventoryof large woody debris. Aquatic habitat units were identified as pools, riffles, or other (see definitionsbelow). In pool habitats, maximum depth and pool tail-crest depths were recorded, as well as fourthalweg depths. Residual pool depth was calculated from the maximum and pool tail-crest depths(Figure 2). A Pool Quality Index (PQI) score was determined for each pool using a rating systemmodified from Platts et al. (1983). Pools received a higher rating if they were deep and large inrelation to the size of the channel, and had additional features that provided cover for fish such aswoody debris, overhanging vegetation, or undercut banks.
Instream measurements-- Habitat units were defined as: Pool: Areas where scouring water has carved out a non-uniform depression in the channel
bed or where water has been dammed. Slow water, with a width at least 1/2 of thewetted channel width and 20 cm minimum residual pool depth (Figure 3).
Riffle: Swiftly flowing, turbulent water with hydraulic jumps (white-water); some partiallyexposed substrate; substrate cobble and/or boulder dominated.
Other: Includes non-turbulent water habitat types such as Glides–wide, uniform channelvolume, no thalweg, low to moderate water velocity, and little surface agitation, andRuns–deep and fast with defined thalweg and little surface agitation (definitions fromOverton et al. 1997).
Figure 2. Measuring residual pool depth. The dehydraulic control of the pool (B) is the residual powhere the last trickle of water would run out if th
The frequency of each parameter was calculated fstandardized by length of stream inventoried) andnatural conditions for this area. The methodology
Riffle habitat in each stream segment was quantifichannel classified as riffles. This number was useclassified as riffle habitat. Because an equal propoptimum, the riffle fraction should be from 40% t
Pool habitat in each stream was quantified by calclassified as pools. The percentage of total streamTarget conditions for pool frequency have been p(1992) suggest that pools should comprise 50%, bGreater than 40% cover, by surface area has also
B
A00
epest point of the pool (A) minus thol depth. The hydraulic control hae water were “turned off.”
or each segment (the number of t compared to published frequenc for evaluating these parameters
ed by calculating the surface ared to calculated the percentage toortion of pool and riffle habitat iso 60% (Peterson et al. 1992).
culating the surface area of wette habitat classified as pools was a
roposed by a number of authors. y area, in streams with less than been recommended for streams w
Water surface
e s
iyis
a ta
dl Pai
Stream-bed
Flow direction
8
depth at thebeen described as
mes occurred values from outlined below.
of wetted streaml stream habitat
often considered
stream channelso calculated.eterson et al.
3% gradient.th a 2% to 5%

Habitat Inventory and Assessment of Juanita Creek in 2000 9
gradient (Washington Fish and Game Commission 1997, Washington Forest Practices Board 1997). TheNational Marine Fisheries Service (NMFS) Matrix of Pathways and Indicators (NOAA 1996)suggests that 30 pools/km for a stream, such as Juanita Creek that is 6 m wide indicate “properlyfunctioning conditions” for purposes of implementing the Federal Endangered Species Act (ESA).
Large Woody Debris (LWD)– Large woody debris was defined as logs at least 2 meters (6 feet) inlength and at least 15 cm (6 in) in diameter (Peterson et al. 1992), or rootwads of any size. All piecesof wood within the bankfull width and spanning the channel were counted. The length and diameterof each piece of LWD was measured and recorded in the habitat unit it occupied. The number ofLWD pieces in a debris jam (DJ) was determined and the volume of the DJ (including the smallpieces) was estimated from three dimensions: L x W x D.
The frequency of LWD occurrence was calculated for each segment and compared to publishedvalues from PNW natural conditions. Large woody debris frequency was compared to publishedfrequency ranges in natural forested systems of the PNW. The low end of the natural range inseveral studies was 150 pieces/km (a range of 150-460 in Murphy and Koski 1989, a range of 150-400 in Ralph et al. 1994, and a range of 140-670 for streams of similar size and gradient in Beechieand Sibley 1997). Especially large pieces of LWD initiate the formation of stable woody debris jams(Naiman et al. 2000). The NMFS Matrix of Pathways and Indicators suggests 50 pieces/km that are atleast 60 cm wide by 15 m long indicate “properly functioning conditions” (NOAA 1996). AlthoughNMFS did not categorize this size class as “key pieces,” the large size range is comparable to theWashington State Forest Practices Board’s Watershed Analysis Manual (1997) and WashingtonDepartment of Fish and Wildlife’s (WDFW) Wild Salmonid Policy (1997) key piece size standard of0.55 m diameter and 10 m in length for streams with a 6-10 m bankfull width. The Timber Fish andWildlife (TFW) key piece criteria is based on a volume calculation that allows variable diameters andlengths (Schuett-Hames et al. 1999). The number of “large” diameter pieces was determined bycounting all pieces of wood that met a minimum 50 cm diameter.
Tributaries, Wetlands, Side Channels, and Pipes Notes were made on tributaries, wetlands, and side channels entering or adjacent to the stream, andlocation, size, and function of pipes (e.g., culverts, intakes). Notes were also taken to furtherdescribe the habitat quality, species identification, and presence of fish and wildlife. In addition, anyobvious problems or concerns such as point of discharge or withdrawal for each reach were alsodescribed. Opportunity and/or need for protection or restoration projects were also noted.
BiologyNotes were made on the presence of juvenile and/or adult fish, freshwater mussels, amphibians andother biota. Juvenile salmonids, however, were not usually identified to species, although numbersor abundance was approximated. The reader should take into account that these are observationsbased on field notes and only represent conditions at the time of the assessment, and not a formalquantitative assessment of fish abundance. Moreover, it should be noted that the lack of anobservation does not imply absence of a species from these sites.
Sediment QualityField notes regarding sediment quality were recorded for each segment. These remarks were eitherincluded in summary remarks about the segment or observations of specific locations.
PhotographsPhotographs depicting the general nature of each assessed stream segment, as well as notable featureswere taken as the surveyors proceeded upstream. Representative photos will be included in thisreport to illustrate typical reaches or points of interest in each segment.

Habitat Inventory and Assessment of Juanita Creek in 2000 10
Water QualityWater quality monitoring can reveal problems that may affect instream habitat quality. During thishabitat assessment, limited water quality monitoring was performed on samples from Juanita Creek.These results will be compared with previous and future monitoring data.
Water quality was monitored at five total locations in segments 1, 2 and 3 (Figure 3). A HACHSension156 Portable Multiparameter Meter was used to measure electrical conductivity, pH,temperature, and dissolved oxygen. Conductivity, pH, and temperature were measured from samplesobtained on the afternoon of 10/06/2000. After recalibration of the dissolved oxygen meter, DO andtemperature was measured from samples obtained on 11/14/2000. Two samples at each locationwere measured and the results were averaged.
AnalysisAs previously mentioned, summarized instream and riparian values for each stream segment werecompared to published values representing natural conditions or values that were determined toindicate naturally functioning conditions.
Matrix of Pathways and Indicators In an effort to identify parameters indicative of ecosystem processes functioning in a manner that willmaintain stable and healthy streams (for anadromous salmonid populations), [NMFS \,1996 #16]developed the “Matrix of Pathways and Indicators” as an evaluation tool (Appendix C). This matrixpresents a number of environmental parameters important to production and survival of anadromousfishes and sets three condition levels for each parameter: (1) properly functioning, (2) at risk, and(3) not properly functioning. This matrix was also used by the WRIA 8 technical committee as a toolto aid in evaluating stream conditions within the PSL Ecoregion. If the data collected in theseassessments could be compared with the NMFS matrix parameters, the results were presented withthe matrix target conditions.
Quality ControlTwo training sessions were held to prepare staff for the field survey season and assure accurate andprecise data. A classroom session was held to discuss assessment protocols and the specificobjectives of the habitat assessment. A second session was held in the field to provide surveyorswith hands-on training in the use of the protocols and to provide surveyors with the opportunity toidentify any questions or concerns with the methodology prior to the actual survey of Juanita Creek.

Habitat Inventory and Assessment of Juanita Creek in 2000 11
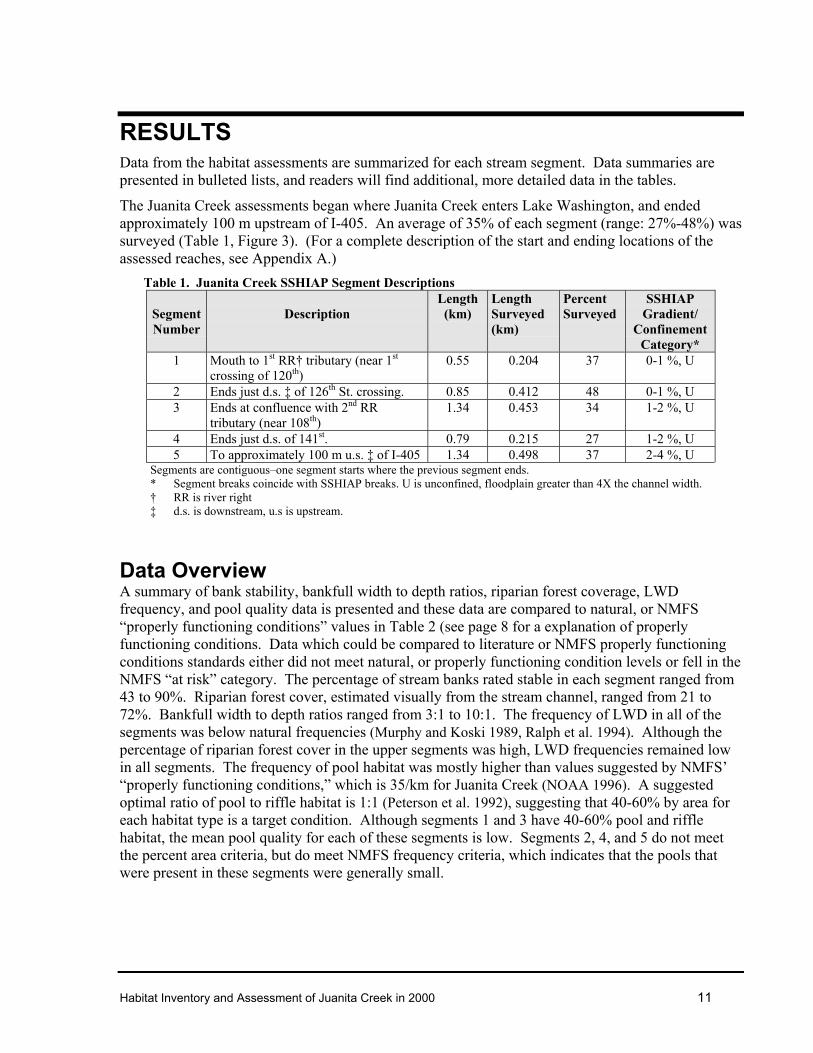
RESULTSData from the habitat assessments are summarized for each stream segment. Data summaries arepresented in bulleted lists, and readers will find additional, more detailed data in the tables.
The Juanita Creek assessments began where Juanita Creek enters Lake Washington, and endedapproximately 100 m upstream of I-405. An average of 35% of each segment (range: 27%-48%) wassurveyed (Table 1, Figure 3). (For a complete description of the start and ending locations of theassessed reaches, see Appendix A.)
Table 1. Juanita Creek SSHIAP Segment Descriptions
SegmentNumber
DescriptionLength(km)
LengthSurveyed(km)
PercentSurveyed
SSHIAPGradient/
ConfinementCategory*
1 Mouth to 1st RR† tributary (near 1st
crossing of 120th)0.55 0.204 37 0-1 %, U
2 Ends just d.s. ‡ of 126th St. crossing. 0.85 0.412 48 0-1 %, U3 Ends at confluence with 2nd RR
tributary (near 108th)1.34 0.453 34 1-2 %, U
4 Ends just d.s. of 141st. 0.79 0.215 27 1-2 %, U5 To approximately 100 m u.s. ‡ of I-405 1.34 0.498 37 2-4 %, U
Segments are contiguous–one segment starts where the previous segment ends.* Segment breaks coincide with SSHIAP breaks. U is unconfined, floodplain greater than 4X the channel width.† RR is river right‡ d.s. is downstream, u.s is upstream.
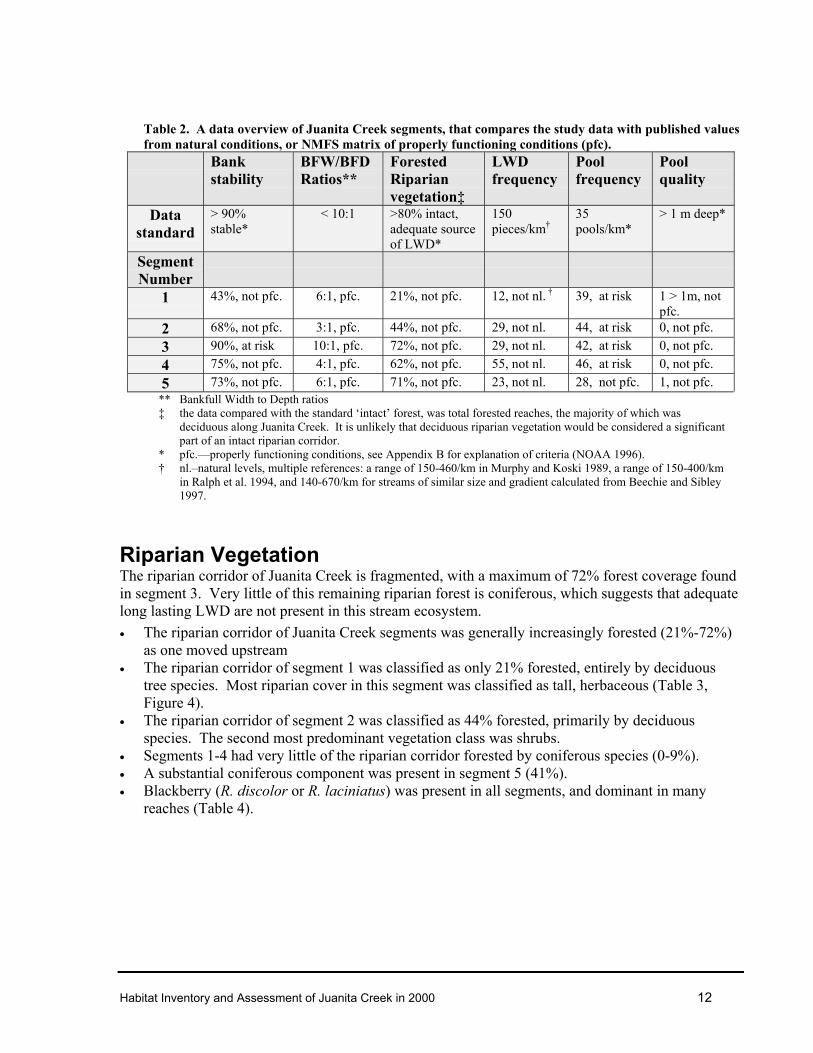
Data OverviewA summary of bank stability, bankfull width to depth ratios, riparian forest coverage, LWDfrequency, and pool quality data is presented and these data are compared to natural, or NMFS“properly functioning conditions” values in Table 2 (see page 8 for a explanation of properlyfunctioning conditions. Data which could be compared to literature or NMFS properly functioningconditions standards either did not meet natural, or properly functioning condition levels or fell in theNMFS “at risk” category. The percentage of stream banks rated stable in each segment ranged from43 to 90%. Riparian forest cover, estimated visually from the stream channel, ranged from 21 to72%. Bankfull width to depth ratios ranged from 3:1 to 10:1. The frequency of LWD in all of thesegments was below natural frequencies (Murphy and Koski 1989, Ralph et al. 1994). Although thepercentage of riparian forest cover in the upper segments was high, LWD frequencies remained lowin all segments. The frequency of pool habitat was mostly higher than values suggested by NMFS’“properly functioning conditions,” which is 35/km for Juanita Creek (NOAA 1996). A suggestedoptimal ratio of pool to riffle habitat is 1:1 (Peterson et al. 1992), suggesting that 40-60% by area foreach habitat type is a target condition. Although segments 1 and 3 have 40-60% pool and rifflehabitat, the mean pool quality for each of these segments is low. Segments 2, 4, and 5 do not meetthe percent area criteria, but do meet NMFS frequency criteria, which indicates that the pools thatwere present in these segments were generally small.
Habitat Inventory and Assessment of Juanita Creek in 2000 12
Table 2. A data overview of Juanita Creek segments, that compares the study data with published valuesfrom natural conditions, or NMFS matrix of properly functioning conditions (pfc).
Bankstability
BFW/BFDRatios**
ForestedRiparianvegetation‡
LWDfrequency
Poolfrequency
Poolquality
Datastandard
> 90%stable*
< 10:1 >80% intact,adequate sourceof LWD*
150pieces/km†
35pools/km*
> 1 m deep*
SegmentNumber
1 43%, not pfc. 6:1, pfc. 21%, not pfc. 12, not nl. † 39, at risk 1 > 1m, notpfc.
2 68%, not pfc. 3:1, pfc. 44%, not pfc. 29, not nl. 44, at risk 0, not pfc.3 90%, at risk 10:1, pfc. 72%, not pfc. 29, not nl. 42, at risk 0, not pfc.4 75%, not pfc. 4:1, pfc. 62%, not pfc. 55, not nl. 46, at risk 0, not pfc.5 73%, not pfc. 6:1, pfc. 71%, not pfc. 23, not nl. 28, not pfc. 1, not pfc.
** Bankfull Width to Depth ratios‡ the data compared with the standard ‘intact’ forest, was total forested reaches, the majority of which was
deciduous along Juanita Creek. It is unlikely that deciduous riparian vegetation would be considered a significantpart of an intact riparian corridor.
* pfc.—properly functioning conditions, see Appendix B for explanation of criteria (NOAA 1996).† nl.–natural levels, multiple references: a range of 150-460/km in Murphy and Koski 1989, a range of 150-400/km
in Ralph et al. 1994, and 140-670/km for streams of similar size and gradient calculated from Beechie and Sibley1997.
Riparian Vegetation The riparian corridor of Juanita Creek is fragmented, with a maximum of 72% forest coverage foundin segment 3. Very little of this remaining riparian forest is coniferous, which suggests that adequatelong lasting LWD are not present in this stream ecosystem.• The riparian corridor of Juanita Creek segments was generally increasingly forested (21%-72%)
as one moved upstream• The riparian corridor of segment 1 was classified as only 21% forested, entirely by deciduous
tree species. Most riparian cover in this segment was classified as tall, herbaceous (Table 3,Figure 4).
• The riparian corridor of segment 2 was classified as 44% forested, primarily by deciduousspecies. The second most predominant vegetation class was shrubs.
• Segments 1-4 had very little of the riparian corridor forested by coniferous species (0-9%).• A substantial coniferous component was present in segment 5 (41%).• Blackberry (R. discolor or R. laciniatus) was present in all segments, and dominant in many
reaches (Table 4).

Habitat Invent
Table 3. Riparian landcover on Juanita Creek, numbers are percentages of the total assessed segmentlength.
Segment Tot.Forested
Forest.Decid.
Forest.Mixed
Forest.Conif. Landsca
ped
Imperv. Herb.Short
Herb.Tall
Shrub
1 21 21 -- -- -- -- 7 57 142 44 39 4 4 -- -- 9 11 333 72 58 5 9 4 -- -- 9 154 62 58 4 -- 13 25 -- -- --5 71 30 -- 41 4 2 11 4 8
Figure 3.
Herb.tall
Decid.Herb.
Shrub
Segment 1
Mixed Forest Herb. short
Shrub
Conif. ForestSegment 2
Decid. Forest
Herb.tall
Segment 3Conif. Forest
Shrub
Landscaped
Mixed Forest Herb.tall
Decid. Forest
Decid. F
Mix
ory and Assessment of Juanita Creek in 2000 13
Riparian vegetation composition in Juanita Creek assessment segments.
Segment 4Landscaped
Imperv.
orest
ed Forest LandscapedImperv.Herb. shortHerb.tallShrubDecid. ForestMixed ForestConif. Forest
Herb.tall
Herb. short
Conif. Forest
Landscaped
Shrub
Imperv.
Decid. Forest
Segment 5

Habitat Inventory and Assessment of Juanita Creek in 2000 15
Table 4. Invasive species present on Juanita Creek. More ++ indicate increasing general abundance. 1
Segm
ent
Him
alay
anB
lack
berr
y
Ever
gree
nB
lack
berr
y
Japa
nese
Kno
twee
d
Fiel
dB
indw
eed
Bitt
erN
ight
shad
eEn
glis
h Iv
y
Ree
d C
anar
ygr
ass
Polic
eman
’sH
elm
et
Purp
leLo
oses
trife
1 ++++ ++ ++ + +2 +++++ + +++ ++ + + +3 +++++ ++++ + + + +4 ++ + + +5 +++++ + ++ + +
Large Woody DebrisNo segments of Juanita Creek contained enough LWD to fall within the published natural frequencyranges of 150 to 670 pieces/km (Murphy and Koski 1989, Ralph et al. 1994, calculated from Beechieand Sibley 1997). All segments were one fifth to one tenth of the low end of the range (Table 5).• Segment 4 had the greatest LWD and large diameter LWD frequency (55 and 9 pieces/km,
respectively).• Segment 1 had the lowest LWD frequency (12 pieces/km).• The frequency of large LWD pieces was well below “properly functioning conditions” (50
pieces/km) (NOAA 1996) in all segments (< 10 pieces/ km in all segments) (Table 5).
Table 5. LWD frequency in Juanita Creek. 150 pieces per kilometer is the low end of natural occurringfrequency ranges (Murphy and Koski 1989, and Ralph et al. 1994, calculated from Beechie and Sibley1997): all segments in Juanita Creek were below this range.
Segment # LWD/km
# >/= 0.5mdiameter /km
1 12 22 29 53 29 04 55 95 23 5
Channel MorphologyChannel complexity and connectivity with the floodplain are reduced in Juanita Creek by streambankarmoring (Figure 5). Mean segment bankfull width to depth ratios are generally not greater than 12(Table 6), which suggests “properly functioning conditions,” though without comparing current
1 Scientific names of the invasive species are (in order listed, starting from the left): Rubus discolor, Rubuslacinatus, Polygonum cuspidatum, Convolvulus arvensis, Solanum dulcamara, Hedera helix, Impatiensglandulifera, Lythrum salicaria.

Habitat Inventory and Assessment of Juanita Creek in 2000 16
values to data from previous decades, it is difficult to determine whether the stream channel isunstable and enlarging or incising.
Bankfull Width to Depth RatiosThe bankfull width to depth ratios for Juanita Creek did not exceed 10, although the ratio forsegment 3 was equal to 10. The ratios of the other segments ranged from 3 to 6 (Table 6).
Table 6. Bankfull width to depth (BFW:BFD) ratios for Juanita Creek segments. Values below 10 aresuggested by the NMFS Matrix of Pathways and Indicators as indicative of “properly functioningconditions”, between 10 and 12 the stream is “at risk”, and above 12 conditions are not properlyfunctioning.
Segment BFW BFW:BFD 1 5.6 6:12 5.3 3:13 6.3 10:14 5.0 4:15 6.9 6:1
Streambank StabilityStable streambanks were the dominant condition in four of five segments of Juanita Creek. Thepercentage of streambank armoring was less than 20% in all segments, except segment 1 where 57%of the banks were armored. (Figure 5).
0%
20%
40%
60%
80%
100%
1 2 3 4 5
Segment Name and Number
Perc
enta
ge in
eac
hst
abilit
y ca
tego
ry
Armored Unstable Stable
Figure 4. Streambank stability of Juanita Creek segments.
Sediment QualitySediment deposition from the creek is evident at the park at the mouth of the creek. Gravels suitablefor salmon spawning were noted at two single assessed locations in segments 1 and 4. Three othersite-specific notations relate the presence of fines and sand in segments 3 and 4. All summarycomments described the presence of fines in the channel substrate (Table 7).

Habitat Inventory and Assessment of Juanita Creek in 2000 17
Table 7. Substrate quality field notes.Segment Distance from
segment start (m)Field Notes
1 203.6 Gravels, possibly suitable spawninghabitat
1 Summary Large unstable sediment load in segment2 Summary Many fines on stream bottom3.C* 75 Nice pool, but loaded with fines3 Summary Lots of fines4 4.8 Gravels, possibly suitable spawning
habitat4 101 Lots of sand and fines4 111.8 Deep pool, fines dominant4 Summary Large amount of unstable fines and sands5 Summary Lots of fines
*The letter indicates the survey day; i.e., 3.C is the third day of surveying segment 3.
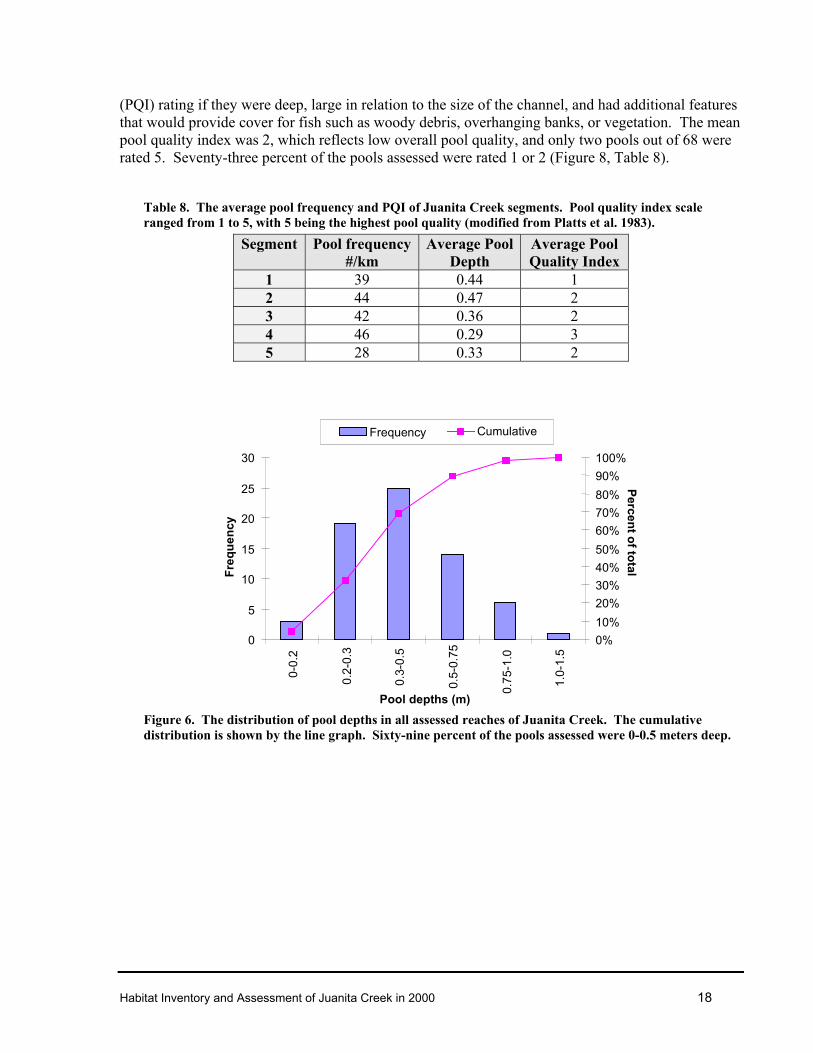
Pool Habitat Pool to riffle ratios in Juanita Creek ranged from 2:1 to 1:2 (segment 2 and segments 4 and 5,respectively). Segments 1 and 3 had ratios of 1:1. Pool frequencies met suggested “properlyfunctioning conditions” of 35/km (NOAA 1996) in every segment but segment 5 which had 28 pools/km. The percentage of riffle habitat in Juanita Creek was greater than or equal to 40% in four out offive segments (Figure 6). Mean pool depths were less than 0.5 m in all segments (Table 8). Thedistribution of the pool depths indicate that 69% of the pools were less than 0.5 m in depth and only1% of the pools were greater than 1 m in depth (Figure 7).
010203040506070
1 2 3 4 5
Segment Number
Perc
enta
ge
% Pool Habitat % Riffle Habitat % Other Habitat
Figure 5. The percent habitat composition by area of Juanita Creek segments. Optimal habitatdistribution is 1:1 pool to riffle ratio; the percentage of each should be between 40% and 60%. Glidesare the predominant habitat classified as “other,” however, runs are also categorized as other (Petersonet al. 1992).
Pool Quality IndexAlthough pool frequencies in four of the five segments met the NMFS’ properly functioningconditions, the quality of the pools was generally poor. Pools received a higher Pool Quality Index
Habitat Inventory and Assessment of Juanita Creek in 2000 18
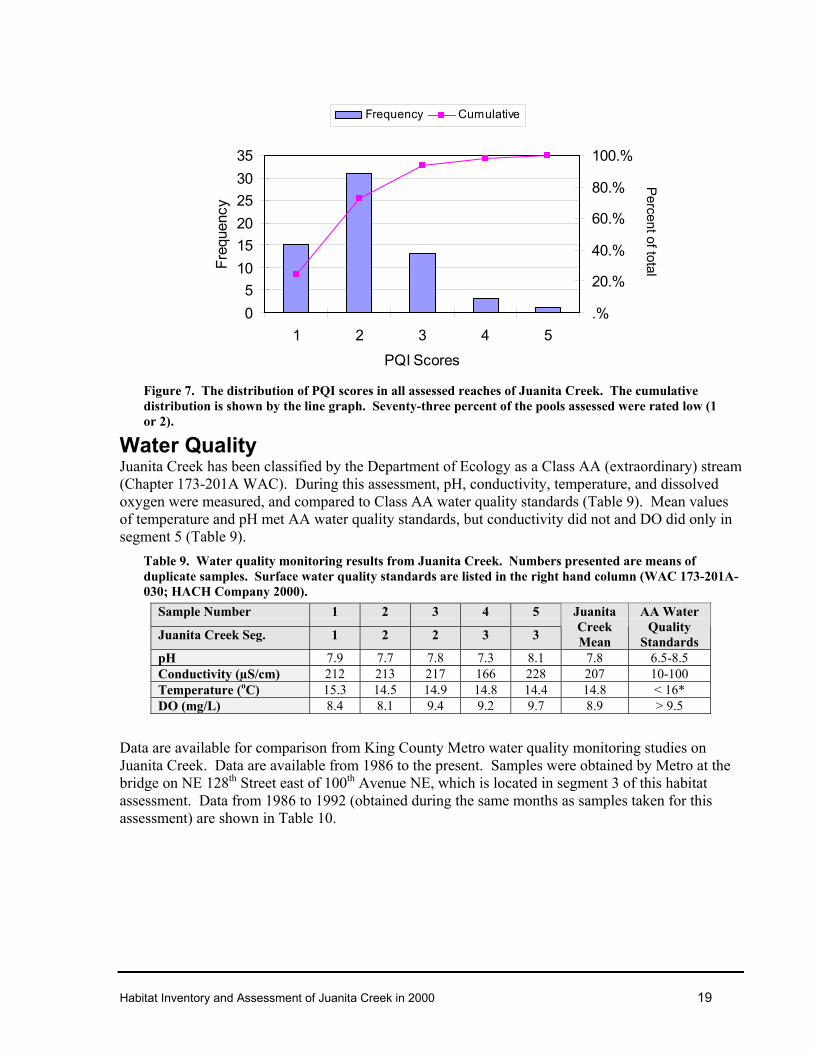
(PQI) rating if they were deep, large in relation to the size of the channel, and had additional featuresthat would provide cover for fish such as woody debris, overhanging banks, or vegetation. The meanpool quality index was 2, which reflects low overall pool quality, and only two pools out of 68 wererated 5. Seventy-three percent of the pools assessed were rated 1 or 2 (Figure 8, Table 8).
Table 8. The average pool frequency and PQI of Juanita Creek segments. Pool quality index scaleranged from 1 to 5, with 5 being the highest pool quality (modified from Platts et al. 1983).
Segment Pool frequency#/km
Average PoolDepth
Average PoolQuality Index
1 39 0.44 12 44 0.47 23 42 0.36 24 46 0.29 35 28 0.33 2
0
5
10
15
20
25
30
0-0.
2
0.2-
0.3
0.3-
0.5
0.5-
0.75
0.75
-1.0
1.0-
1.5
Pool depths (m)
Freq
uenc
y
0%10%20%30%40%50%60%70%80%90%100%
Frequency Cumulative
Figure 6. The distribution of pool depths in all assessed reaches of Juanita Creek. The cumulativedistribution is shown by the line graph. Sixty-nine percent of the pools assessed were 0-0.5 meters deep.
Percent of total
Habitat Inventory and Assessment of Juanita Creek in 2000 19
05
101520253035
1 2 3 4 5PQI Scores
Freq
uenc
y
.%
20.%
40.%
60.%
80.%
100.%
Frequency Cumulative
Figure 7. The distribution of PQI scores in all assessed reaches of Juanita Creek. The cumulativedistribution is shown by the line graph. Seventy-three percent of the pools assessed were rated low (1or 2).
Water QualityJuanita Creek has been classified by the Department of Ecology as a Class AA (extraordinary) stream(Chapter 173-201A WAC). During this assessment, pH, conductivity, temperature, and dissolvedoxygen were measured, and compared to Class AA water quality standards (Table 9). Mean valuesof temperature and pH met AA water quality standards, but conductivity did not and DO did only insegment 5 (Table 9).
Table 9. Water quality monitoring results from Juanita Creek. Numbers presented are means ofduplicate samples. Surface water quality standards are listed in the right hand column (WAC 173-201A-030; HACH Company 2000).
Sample Number 1 2 3 4 5
Juanita Creek Seg. 1 2 2 3 3
JuanitaCreekMean
AA WaterQuality
StandardspH 7.9 7.7 7.8 7.3 8.1 7.8 6.5-8.5Conductivity (µS/cm) 212 213 217 166 228 207 10-100Temperature (oC) 15.3 14.5 14.9 14.8 14.4 14.8 < 16*DO (mg/L) 8.4 8.1 9.4 9.2 9.7 8.9 > 9.5
Data are available for comparison from King County Metro water quality monitoring studies onJuanita Creek. Data are available from 1986 to the present. Samples were obtained by Metro at thebridge on NE 128th Street east of 100th Avenue NE, which is located in segment 3 of this habitatassessment. Data from 1986 to 1992 (obtained during the same months as samples taken for thisassessment) are shown in Table 10.
Percent of total

Habitat Inventory and Assessment of Juanita Creek in 2000 20
Table 10. October/November Metro water quality data from Juanita Creek (Quality of Local Lakes andStreams, 1987-1994). No data are available for October/November in 1989 and 1993.
Year pHConductivit
y (µS/cm)
Temperature(oC)
DO(mg/L)
1986 7.7 195 9.5 11.11987 7.7 200 10.0 9.51988 7.6 195 12.0 10.81990 7.2 130 10.4 10.01991 7.7 206 12.6 9.31992 7.1 114 12.8 10.0
For comparison, Table 11 (below) contains data from samples taken upstream and downstream of theMetro sampling location, during the same months of the year.
Table 11. Water quality data from Juanita Creek, near Metro sampling locations (samples takenOctober/ November).
Location pH Conductivity(µS/cm)
Temperature(oC)
DO(mg/L)
NE 129th Pl. 7.3 166 14.8 9.2NE 124th St. 7.8 217 14.9 7.2
Although the water quality data were only part of a preliminary sampling effort, the results suggestthat a more complete water quality study may be warranted. Temperatures were generally higher,and dissolved oxygen was generally lower than measurements taken from 1986-1993. During theMetro study (1986-1993), October water temperature values ranged from 9.5oC –12.8oC. Thesampling for this habitat assessment in October produced an average reading of 14.8oC. Streamtemperatures between 13.9oC and 17.8oC indicate that stream habitat conditions may be “at riskS” ofnot properly functioning (NOAA 1996). All temperatures measured in this habitat assessment werein this “at risk” range. In addition, all but one of the dissolved oxygen levels during November of theMetro study were above 9.5 = mg/L (1991 at 9.3 mg/L), the minimum water quality standard for aClass AA stream. Four out of five samples taken for this habitat assessment were below thisminimum level.
Biology Salmonids were seen in all five segments. Although many fish were not identified to species, thefollowing categories of aquatic biota were identified: salmonids, cutthroat trout, and crayfish.Table 12 presents specific notations on fish sightings.
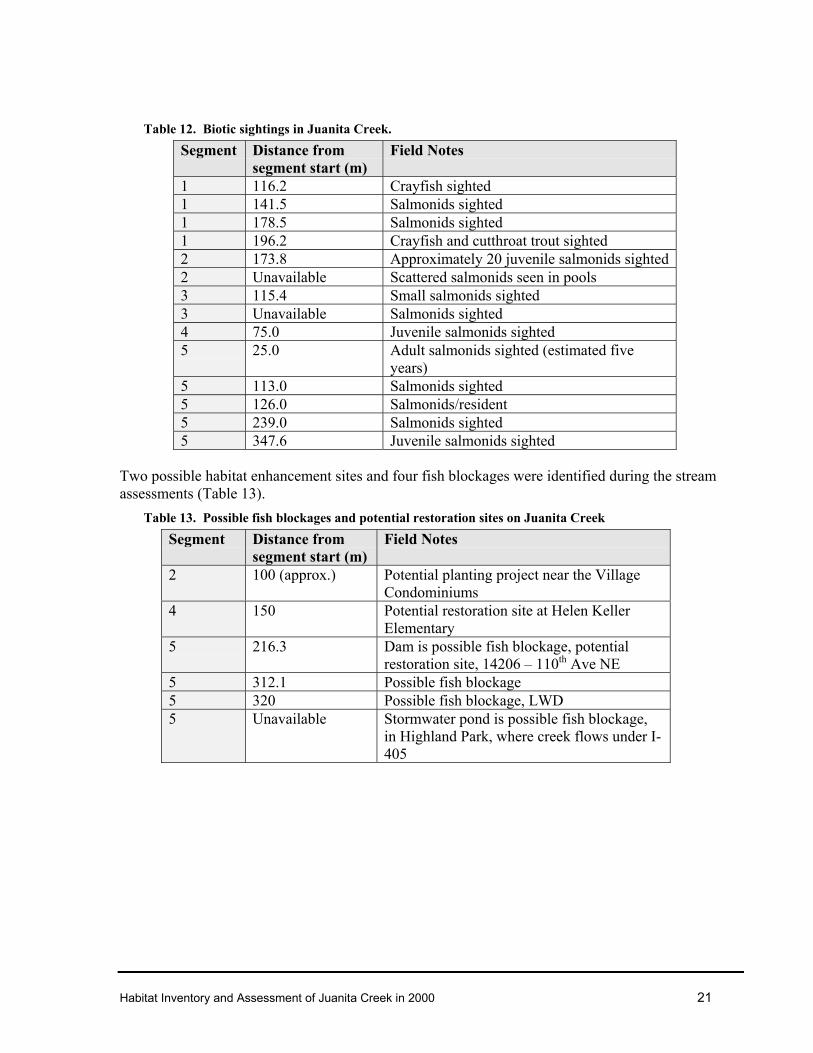
Habitat Inventory and Assessment of Juanita Creek in 2000 21
Table 12. Biotic sightings in Juanita Creek.
Segment Distance fromsegment start (m)
Field Notes
1 116.2 Crayfish sighted1 141.5 Salmonids sighted1 178.5 Salmonids sighted1 196.2 Crayfish and cutthroat trout sighted2 173.8 Approximately 20 juvenile salmonids sighted2 Unavailable Scattered salmonids seen in pools3 115.4 Small salmonids sighted3 Unavailable Salmonids sighted4 75.0 Juvenile salmonids sighted5 25.0 Adult salmonids sighted (estimated five
years)5 113.0 Salmonids sighted5 126.0 Salmonids/resident5 239.0 Salmonids sighted5 347.6 Juvenile salmonids sighted
Two possible habitat enhancement sites and four fish blockages were identified during the streamassessments (Table 13).
Table 13. Possible fish blockages and potential restoration sites on Juanita Creek
Segment Distance fromsegment start (m)
Field Notes
2 100 (approx.) Potential planting project near the VillageCondominiums
4 150 Potential restoration site at Helen KellerElementary
5 216.3 Dam is possible fish blockage, potentialrestoration site, 14206 – 110th Ave NE
5 312.1 Possible fish blockage5 320 Possible fish blockage, LWD5 Unavailable Stormwater pond is possible fish blockage,
in Highland Park, where creek flows under I-405

Habitat Inventory and Assessment of Juanita Creek in 2000 22
DISCUSSIONThe cumulative impacts of land-use practices over the past century, including timber harvest,agriculture, and urbanization, have significantly modified the natural landscape characteristics ofJuanita Creek basin, thereby altering many processes that maintain the natural structure and functionof this aquatic ecosystems. Due to increased population, development has emerged as the mostsignificant land-use in the basin today. The effects of watershed urbanization on aquatic resourcesare well documented and include extensive changes in basin hydrologic regime, channelmorphology, and physiochemical water quality (Leopold 1968, Hammer 1972, Hollis 1975, Klein1979, Arnold et al. 1982, Booth 1991, May et al. 1997, May and Horner 2000). The cumulative effectsof these alterations on natural ecosystem structure and function have produced an in-stream habitatthat is considerably different from that in which salmonids and other aquatic biota have evolved. Inaddition, development pressure has degraded riparian forests and wetlands, which are an integralcomponent of stream ecosystems (Richey 1982, Steward 1983, Scott et al. 1986, Booth 1990, Booth andReinelt 1993, May et al. 1997, Horner and May 1999). Parameters measured in this study suggest thaturbanization has induced changes in hydrology, channel morphology, riparian integrity and instreamhabitat quality in the Juanita Creek basin.
Riparian Corridor Riparian forest cover in the Juanita Creek basin is substantially diminished from pre-settlementconditions, although deciduous forest was the dominant vegetation in segments 3-5. The riparianvegetation has changed from the natural coniferous dominated forest cover to landscaped areas,grasses, shrubs, and various invasive species (Figure 4). Those areas where riparian forest stilloccurs are typically dominated by small diameter deciduous species including red alder, willow andbig-leaf maple. The absence of mature trees, especially conifers (western red-cedar, westernhemlock, Douglas-fir) in riparian areas reduces potential for LWD recruitment into streams(Table 2). Lack of LWD is also results in poor instream habitat quality and diversity (Sedell et al.1984, Andrus et al. 1988, Murphy and Koski 1989, Beechie and Sibley 1997).
These assessments did not quantify stream buffer width. However, the Watershed Company (1998)determined that stream buffers along the mainstem varied from 10 to 50 feet in the developed areas.Current recommendations for buffer widths on streams are one site potential tree height, which is theaverage maximum height a climax tree may grow (approximately 170 ft in the PNW) (FEMAT 1992).
Channel MorphologyWith increased surface water-dominated hydrology, streamflow tends to increase for a given stormevent, and the duration of high-flow events also increases (Booth 1991). The resultant higher peakflows and more frequent bankfull, channel-altering events increase streambank erosion, bedloadtransport, and streambed scour (Leopold 1968). Urbanizing streams tend to “over-widen” or incise asa result of more frequent bankfull flows (Dunne and Leopold 1978). Mean BFW:BFD ratios ofJuanita Creek were between 3 and 10 (Table 6), which are within the range of “properly functioningconditions” (< 10), and indicates that this stream is not “over-widening.” Armoring, however, wasnoted in the streambank stability data as well as the field notes, which may suggest that the streammay be prevented from over-widening by bank hardening, and may in fact be incising. Acomparison of these data to historical data may reveal whether such changes in channel morphologyare occurring.

Habitat Inventory and Assessment of Juanita Creek in 2000 23
Streambank Stability Some streambank armoring to protect properties from damage by high storm flows is present in allsegments (Figure 4), although the percentage of banks rated unstable or armored was low in allsegments, except segment 1. Basin urbanization and loss of riparian vegetation are two factors thatcontribute to erosion and instability of streambanks (Booth 1991, Booth and Reinelt 1995, May et al.1997). Riparian vegetation stabilizes streambanks and minimizes streambank erosion, the roots ofriparian vegetation and LWD provide the bulk of this function (Bilby and Likens 1980). Besidesvegetative cover, other stream corridor characteristics, such as soil-type and valley hillslope gradient,also contribute to the potential stability and current condition of the banks.
Large Woody DebrisThe assessed Juanita Creek segments were severely depleted of LWD. All segments had LWDfrequencies much lower that even the low end of published ranges for natural conditions in the PNW(range: 150-670 pieces/ km, (Ralph et al. 1994, Murphy and Koski 1989, calculated from Beechieand Sibley 1997). In general, small natural stream channels in the PNW tend to contain anabundance of LWD (Naiman and Bilby 1998). Large woody debris performs critical functions inforested lowland streams, including flow energy dissipation, streambank protection, streambedstabilization, sediment storage, and providing instream cover and habitat diversity (Keller andSwanson 1979, Bilby 1984, Harmon et al. 1986, Bisson et al. 1987, Gregory et al. 1991). Large woodydebris in low-gradient pool-riffle or plane-bed streams like Juanita Creek has the greatest range offunctional influences (Bilby and Ward 1989, 1991, Montgomery et al. 1995). The physically inducedbiological influences of LWD are substantial. Fish populations have been shown to decline rapidlyfollowing LWD removal (Bryant 1983, Hicks et al. 1991).
Numerous studies have found LWD recruitment potential depends heavily on riparian corridorquality and size (Murphy and Koski 1989, Van Sickle and Gregory 1990, Johnson and Ryba 1992,Fetherston et al. 1995, Rot et al. 2000). Although relatively high percentages of forested riparianreaches occurred in segments 3 through 5 of this assessment, natural levels of instream LWD was notpresent in these segments. This emphasizes that numerous mechanisms of LWD loss are operating inJuanita Creek, including transport downstream or out of the channel due to high storm flows, andremoval by streamside residents. Large woody debris is typically quite low in PSL urban streams(May et al. 1997) and Juanita Creek is no exception.
Pool HabitatThe quantity of pool habitat in Juanita Creeks segments 1-4 meets NMFS’ pool frequency standards(NOAA 1996), but the riparian vegetation does not provide an adequate source of LWD forrecruitment to the stream. This results in an “at risk” rating from the Matrix of “properly functioningconditions.” Segment 5 did not meet pool frequency standards or LWD recruitment standards andreceived a “not properly functioning” rating. The majority of pools in Juanita Creek were shallowand low quality, most likely due to cumulative effects of urbanization, such as changes in the naturalhydrologic regime, reduced LWD recruitment. Pool frequency and depth has been shown to bedirectly proportional to LWD frequency, in addition, surface area and cover-quality are also directlyrelated to LWD quantity and quality (Andrus et al. 1988, Robison and Beschta 1990, Ralph et al. 1994).
Field notes from these assessments observe occasional “nice gravels,” but more frequently observethe presence of unstable sand and fines in the streambed (Table 7). In general, these data suggest thatdegradation of spawning gravels may be occurring. A more quantitative study of stream substratecould determine this more conclusively.

Habitat Inventory and Assessment of Juanita Creek in 2000 24
Invasive SpeciesInvasive species were found in the riparian corridors in all assessed segments of Juanita Creek(Table 4). In general, fragmentation and encroachment of the riparian corridor has providedpathways for invasive and exotic species, especially plants. Himalayan blackberry (R. discolor) andfield bindweed (C. arvensis) are the most common invasive species along Juanita Creek, anddominate some of the riparian corridor. Of particular concern is the presence of Policeman’s Helmet(I. glandulifera), which is a relatively new invasive in King County. In Britain, where the climate issimilar to the Pacific Northwest, this plant is considered extremely invasive and is one of the “top20” non-native weeds. A single plant can produce up to 800 seeds, which are viable for 18 months ormore and can even germinate under water. Since the plant often grows along streams and ditches,seeds can be quickly spread downstream http://dnr.metrokc.gov/wlr/LANDS/Weeds/Mpatiens.htm While many of these invasive plants found in Juanita Creek may provide some beneficial functions tothe stream (shade, detritus, bank stabilization, etc.), they are undesirable because, among otherreasons, they are not a source of LWD and prevent native riparian species from becoming establishedin extensive areas.
Water Quality Increased water temperatures and decreased dissolved oxygen levels are consistent with the effects ofurbanization, and can be detrimental to salmonid and other aquatic life adapted to well oxygenatedwaters. Specific conductivity in urbanized streams and wetlands tends to be over 100 µS (May et al.1997, Horner et al. 2001). Metro data (1986-1993) and from this study (2000) reveal conductivitiesgreater than 150 µS in Juanita Creek, except in 1990 and 1992 when specific conductivities were 130and 114, respectively. Elevated conductivity occurs in urbanized watersheds most likely because ofions from concrete and other materials associated with urbanization are leached into the groundwater(May et al. 1997). Continued water quality monitoring designed to capture changes in temperatureand dissolved oxygen over the years would be beneficial to further determine habitat quality ofJuanita Creek.
Biology References that describe pre-development salmon runs in Juanita Creek are difficult to find. A 1948report on spawning in Juanita Creek mentions that a few coho, kokanee, and cutthroat occurred in thestream. This is presented as declined productivity due to urbanization (Fisheries 1948). In a shortWashington Department of Game report in 1968, Juanita Creek was described as a previouslyproductive salmonid stream, but was then currently essentially non-productive (Ward 1968).
Results from other studies of Juanita Creek that were designed to evaluate fish presence help to detailcurrent use of Juanita Creek by various fish species. According to a study recently conducted by TheWatershed Company (Kirkland’s Streams, Wetlands and Wildlife Study, July 1998), Juanita Creeksupports both coho salmon and cutthroat trout. During this electrofishing study done from February19th to March 17th, 1998, juvenile coho were captured as far upstream as King County’s EdithMoulton Park (~RM 2.0), and adult cutthroat spawners2 were seen even farther upstream. No fish ofany kind were detected upstream of I-405 (~RM 2.5) (The Watershed Company 1998). TheWashington Dept. of Fisheries Stream Catalog (1975) noted that coho and sockeye utilized themainstem. Volunteer data from the SalmonWatcher program provides information about use of thestream by spawning salmon. Eight volunteer Salmon Watchers saw 16 sockeye and 19 kokanee in
2 These were identified as sea run cutthroat by the consultants. The criteria on which this identification was based is unknown.

Habitat Inventory and Assessment of Juanita Creek in 2000 25
the mainstem of Juanita creek in 2000 (Vanderhoof 2001b). The one volunteer who watched JuanitaCreek in 1998 and 1999 saw no salmon (Vanderhoof 2001a).
Salmonids were observed in all of the segments assessed in Juanita Creek. The dates that thejuvenile salmonids were seen in Juanita Creek are after sockeye and kokanee leave their natalstreams, which suggests that these fish are either coho salmon or cutthroat trout.
Habitat Inventory and Assessment of Juanita Creek in 2000 26
CONCLUSIONSThe data from the habitat assessments described in this document indicate many segments of JuanitaCreek lack the complex habitat structure that is important for sustaining a long-term, diversesalmonid population. Inadequate pool habitat (shallow pools with little cover) is likely a result of thecumulative effects of the interruption of numerous natural processes such as large woody debrisrecruitment, and local and basin-wide hydrologic buffering processes that interact to create thesehabitats.
Numerous activities associated with urbanization impact drainage basin hydrology (Booth 1991).Magnified peak flows and increased number of peak flows combined with the loss of LWD resultincreased erosion rates that cause increased channel widths and depths (Hammer 1972, Leopold1973, in Booth 1991). Bankfull width to depth ratios of the assessed reaches of Juanita Creek do notstand alone to indicate increased erosion processes. Comparing channel dimension data from thisassessment to data collected previously or in the future would indicate if the channel is widening orincising. However, other indicators of channel instability were observed. An instream detentionpond at NE 124th Street on segment 2 has filled with sediment over a short period of time. Lack ofwood and simplified habitat are also typical of streams impacted by urbanization (Booth 1991).Restoration and conservation planning efforts need to assess, and take into account the alteredprocesses that create and maintain instream habitat structure in this basin.
Results from other studies in the PSL region demonstrate that retention of a wide, nearly continuousriparian buffer of native vegetation has greater and more flexible potential than other options touphold biological integrity when development increases (Horner and May 1999). In newlydeveloping areas riparian zones can be isolated from development. In developed landscapes, such asthe Juanita Creek basin, riparian zones are often more lightly developed than upland areas, and couldmore easily be purchased and placed into protective status. Riparian buffer retention fits nicely withother objectives, like flood protection and provision of wildlife corridors and open space. Instreamhabitat would benefit most from securing and protecting existing high quality riparian buffers,enhancing or restoring degraded, but undeveloped areas, and protecting developed riparian zones andupgrading the integrity of the buffer by planting native species (especially conifers) and removinginvasive plants.
General forest retention throughout watersheds has also been shown to offer important potentialmitigation benefits (Horner and May 1999). This should be a high priority, especially for managinggrowth of undeveloped and lightly developed areas of the watershed. Forest retention combined withimpervious surface limitation and riparian protection efforts would likely have the best results whenpursued jointly.
The foundation of any effective environmental management effort is the formulation of goalsdeveloped with firm knowledge of what the ecosystem is capable of under varying circumstances,and what it needs to flourish at specified levels. Objectives should be stated in specific andmeasurable terms. This study should provide a solid baseline for future management decisions basedon existing conditions in Juanita Creek.

Habitat Inventory and Assessment of Juanita Creek in 2000 27
REFERENCESAjwani, S. 1956. A review of Lake Washington Watershed, Historical, Biological, and Limnological. Located
in the King County DNR Library.
Andrus, C. W., B. A. Long, and H. A. Froehlich. 1988. Woody debris and its contribution to pool formation in acoastal stream 50 years after logging. Canadian Journal of Fisheries and Aquatic Sciences 45:2080-2089.
Arnold, C. L., P. J. Boison, and P. C. Patton. 1982. Sawmill Brook: an example of rapid geomorphic changerelated to urbanization. Journal of Geology 90:155-166.
Barbour, M. T., J. Gerritsen, B. D. Snyder, and J. B. Stribling. 1999. Rapid Bioassessment Protocols for Use inStreams and Wadeable Rivers: Periphyton, Benthic Macroinvertebrates and Fish. EPA 841-B-99-002, U.S.Environmental Protection Agency, Office of Water, Washington, D.C.
Beechie, T. J., and T. H. Sibley. 1997. Relationships between Channel Characteristics, Woody Debries, andFish Habitat in Northwestern Washington Streams. Transactions of the American Fisheries Society126:217-229.
Bilby, R. E. 1984. Removal of woody debris may affect stream channel stability. Journal of Forestry 82:609-613.
Bilby, R. E., and G. E. Likens. 1980. Importance of organic debris dams in the structure and function of streamecosystems. Ecology 61:1107-1113.
Bilby, R. E., and J. W. Ward. 1989. Changes in characteristics and function of woody debris with increasingsize of streams in Western Washington. Transactions of the American Fisheries Society 118:368-378.
Bilby, R. E., and J. W. Ward. 1991. Characteristics and function of large woody debris in streams draining old-growth, clear-cut, and second-growth forests in SW Washington. Canadian Journal of Fisheries andAquatic Sciences 48:2499-2508.
Bisson, P. A., R. E. Bilby, M. D. Bryant, C. A. Dolloff, G. B. Grette, R. A. House, M. L. Murphy, K. V. Koski,and J. R. Sedell. 1987. Large woody debris in forested streams in the Pacific Northwest: past, present, andfuture. in E. O. a. T. W. C. Salo, Eds, editor. Streamside Management: Forestry and Fisheries Interactions.UW Forestry Publication No. 59, Seattle, WA.
Bisson, P. A., T. P. Quinn, G. H. Reeves, and S. V. Gregory. 1992. Best management practices, cumulativeeffects, and long-term trends in fish abundance in Pacific Northwest river systems. in R. J. Naiman, editor.Watershed Management: Balancing Sustainability and Environmental Change. Springer-Verlag, NewYork.
Bjornn, T. C., and D. W. Reiser. 1991. Habitat requirements of salmonids in streams. Pages 18-138 in W. R.Meehan, editor. American Fisheries Society Special Publication. American Fisheries Society, Bethesda,MD.
Booth, D. B. 1990. Stream channel incision following drainage-basin urbanization. Water Resources Bulletin26:407-417.
Booth, D. B. 1991. Urbanization and the natural drainage system-- impacts, solutions and prognosis. TheNorthwest Environmental Journal 7:93-118.
Booth, D. B., and L. E. Reinelt. 1993. Consequences of urbanization on aquatic systems- measured effects,degradation thresholds, and corrective strategies. in Watershed ‘93 Conference, Seattle, WA.
Booth, D. B., and L. E. Reinelt. 1994. Consequences of Urbanization on Aquatic Systems - Measured Effects,Degradation Thresholds, and Corrective Strategies. King County Department of Natural Resources, Waterand Land Resources Division, Seattle, WA.
Bryant, M. D. 1983. The role and management of woody debris in west coast salmonid nursury streams. NorthAmerican Journal of Fisheries Management 3:322-330.

Habitat Inventory and Assessment of Juanita Creek in 2000 28
Chapman, D. W. 1988. Critical review of variables used to define effects of fines in redds of large salmonids.Transactions of the American Fisheries Society 117:1-21.
Crisp, D. T., and P. A. Carling. 1989. Observations on siting, dimensions, and structure of salmonid redds.Journal of Fish Biology 34:119-134.
Dunne, T., and L. B. Leopold. 1978. Water in Environmental Planning.
FEMAT. 1992. Forest ecosystem management: an ecological, economic, and social assessment. U.S.Department of Agriculture, Forest Service, Portland, OR.
Fetherston, K. L., R. J. Naiman, and R. E. Bilby. 1995. Large woody debris, physical process, and riparianforest development in montane river networks of the Pacific Northwest. Geomorphology 13:133-144.
Fisheries, S. I., and Hydraulics. 1948. Report on the Condition of the Spawning of Tributaries of the LakeWashington Watershed. Box 0061-23.
Franklin, J. F., and C. T. Dyrness. 1988. Natural vegetation of Oregon and Washington. Oregon StateUniversity Press, Corvallis, OR.
Giger, R. D. 1973. Streamflow requirements of salmonids. Job Final Report AFS-62-1, Oregon WildlifeCommission, Portland.
Gregory, S. V., F. J. Swanson, W. A. McKee, and K. W. Cummins. 1991. An ecosystem perspective of riparianzones: focus on links between land and water. BioScience 41:540-551.
Groot, C., and L. Margolis, editors. 1991. Pacific Salmon Life Histories. UBC Press, Vancouver.
Hammer, T. R. 1972. Stream channel enlargement due to urbanization. Water Resources Research 8:1530-1540.
Harmon, M. E., J. F. Franklin, P. Sollins, S. V. Gregory, J. D. Lattin, N. H. Anderson, S. P. Cline, N. G.Aumen, J. R. Sedell, G. W. Lienkaemper, K. Cromack, and K. W. Cummins. 1986. Ecology of coarsewoody debris in temperate ecosystems. Advanced Ecological Research 15:133-302.
Hartman, G. F., and T. G. Brown. 1987. Use of small, temporary, floodplain tributaries by juvenile salmonids ina west coast rainforest drainage basin, Carnation Creek, British Columbia. Canadian Journal of Fisheriesand Aquatic Sciences 44:262-270.
Hicks, B. J., J. D. Hall, P. A. Bisson, and J. R. Sedell. 1991. Responses of salmonids to habitat changes. in W.R. Meehan, Ed., editor. Influences of Forest and Rangeland Management on Salmonid Fishes and theirHabitats. American Fisheries Society.
Hollis, G. E. 1975. The effect of urbanization on floods of different recurrence interval. Water ResourcesResearch 66:84-88.
Horner, R., and C. M. May. 1999. Regional Study Supports Natural land cover Protection as the Leading BestManagement Practice for Maintaining Stream Ecological Integrity. in Comprehensive Stormwater andAquatic Ecosystem Conference, Auckland, NZ.
Horner, R. R., S. S. Cooke, L. E. Reinelt, K. A. Ludwa, and N. T. Chin. 2001. Water Quality and Soils. Pages47-67 in A. L. Azous and R. R. Horner, editors. Wetlands and Urbanization, Implication for the Future.Lewis, Boca Raton.
Johnson, A. W., and D. M. Ryba. 1992. A Literature Review of Recommended Buffer Widths to MaintainVarious Functions of Stream Riparian Areas. Special Report King County Surface Water ManagementDivision (SWM), Seattle.
Keller, E. A., and F. J. Swanson. 1979. Effects of large organic material on channel form and fluvial processes.Earth Surface Processes 4:361-380.
Kerwin, J. 2001. Salmon and Steelhead Habitat Limiting Factors

Habitat Inventory and Assessment of Juanita Creek in 2000 29
Report for the Cedar –Sammamish Basin (Water Resource Inventory Area 8). Washington ConservationCommission, Olympia, WA.
King County. 1990. Surface Water Design Manual. Department of Natural Resources, Water and LandResources Division, Seattle, WA.
Klein, R. D. 1979. Urbanization and stream quality impairment. Water Resources Bulletin 15:948-963.
Kondolf, G. M., and M. G. Wolman. 1993. The sizes of salmonid spawning gravel. Water Resources Research29:2275-2285.
Leopold, L. B. 1968. The Hydrologic Effects of Urban Land Use: Hydrology for Urban Land Planning-- AGuidebook of the Hydrologic Effects of Urban Land Use. USGS Circular No. 554, USGS.
Maser, C., R. F. Tarrant, J. M. Trappe, and J. F. Franklin. 1988. From the Forest to the Sea: A Story of FallenTrees. PNW-GTR-229, USDA Forest Service.
May, C. W., and R. R. Horner. 2000. The Cumulative Impacts of Urbanization on Stream-Riparian Ecosystemsin the Puget Sound Lowlands. in AWRA Riparian Ecology and Management Conference, Portland OR.
May, C. W., E. B. Welch, R. R. Horner, J. R. Karr, and B. W. Mar. 1997. Quality Indices for UrbanizationEffects in Puget Sound Lowland Streams. Final Report for Washington Department of Ecology. WaterResources Series, Technical Report No. 154, University of Washington, Department of Civil Engineering,Environmental Engineering and Science, Seattle, Washington.
McNeil, W. J. 1966. Effect of the spawning bed environment on reproduction of pink and chum salmon.Fisheries Bulletin 65.
Montgomery, D. R., E. M. Beamer, G. R. Pess, and T. P. Quinn. 1999. Channel type and salmonid spawningdistribution and abundance. Canadian Journal of Fisheries and Aquatic Sciences 56:377-387.
Montgomery, D. R., J. M. Buffington, R. D. Smith, K. M. Schmidt, and G. Pess. 1995. Pool spacing in forestchannels. Water Resources Research 31:1097-1105.
Murphy, M. L., and K. V. Koski. 1989. Input and depletion of woody debris in Alaska streams and implicationsfor streamside management. North American Journal Fisheries Management 9:427-436.
Naiman, R. J., and R. E. Bilby, editors. 1998. River Ecology and Management: Lessons from the PacificCoastal Ecoregion. Springer Publishing, NY.
Naiman, R. J., R. E. Bilby, and P. A. Bisson. 2000. Riparian Ecology and Management in the Pacific CoastalRain Forest. BioScience 50:996-1011.
Nawa, R. K., C. A. Frissell, and W. J. Liss. 1990. Life History and Persistence of Anadromous Salmonid Stocksin Relation to Stream Habitats and Watershed Classification. Oregon Department of Fish and Wildlife andOregon State University.
Nehlsen, W., J. Williams, and J. Lichatowich. 1991. Pacific salmon at the crossroads: Stocks at risk fromCalifornia, Oregon, Idaho, and Washington. Fisheries 16:4-21.
Nickelson, T. E., J. D. Rodgers, S. L. Johnson, and M. L. Solazzi. 1992. Seasonal changes in habitat use byjuvenile Coho salmon in Oregon coastal streams. Canadian Journal of Fisheries and Aquatic Sciences:783-789.
NOAA. 1996. Coastal Salmon Conservation: Working Guidance for Comprehensive Salmon RestorationInitiatives on the Pacific Coast. National Marine Fisheries Service.
NRC. 1996. Upstream: Salmon and Society in the Pacific Northwest. National Academy Press.
Overton, K. C., S. P. Wollrab, B. C. Roberts, and M. A. Radko. 1997. R1/R4 (Northern/ IntermountainRegions) Fish and Fish Habitat Standard Inventory Procedures Handbook. INT-GTR-346, USDA ForestService, Ogden.

Habitat Inventory and Assessment of Juanita Creek in 2000 30
Peterson, N. P., A. Hendry, and T. P. Quinn. 1992. Assessment of Cumulative Effects on Salmonid Habitat:Some Suggested Parameters and Target Conditions. TFW-F3-92-001, WA Timber, Fish and Wildlife.
Platts, W. S., W. F. Megahan, and G. W. Minshall. 1983. Methods for evaluating Stream, Riparian and BioticConditions. General Technical Report INT-138, U.S. Department of Agriculture, Forest Service,Intermountain Forest and Range Experiment Station, Ogden, UT.
Pleus, A. E., and D. Schuett-Hames. 1998. TFW Monitoring Program method manual for stream segmentidentification. TFW-AM9-98-001. DNR #103, Washington State Dept. of Natural Resources under theTimber, Fish, and Wildlife Agreement.
Ralph, S. C., G. C. Poole, L. L. Conquest, and R. J. Naiman. 1994. Stream channel morphology and woodydebris in logged and unlogged basins of Western Washington. Canadian Journal of Fisheries and AquaticSciences 51:37-51.
Richey, J. S. 1982. Effects of Urbanization on a Lowland Stream in Western Washington. Dissertation.University of Washington, Seattle.
Robison, E. G., and R. L. Beschta. 1990. Characteristics of coarse woody debris for several coastal streams ofsoutheast Alaska, USA. Canadian Journal of Fisheries and Aquatic Sciences 47:1684-1693.
Rot, B. W. 1995. The Interaction of Valley Constraint, Riparian Landform, and Riparian Plant Community Sizeand Age upon Channel Configuration of Small Streams of the Western Cascade Mountains, Washington.University of Washington, Seattle.
Rot, B. W., R. J. Naiman, and R. E. Bilby. 2000. Stream channel configuration, landform, and riparian foreststructure in the Cascade Mountains, Washington. Canadian Journal of Fisheries and Aquatic Sciences57:699-707.
Salo, E. O., and T. W. Cundy, editors. 1987. Streamside Management: Forestry and Fisheries Interactions. UWForestry Publication No. 59, Seattle.
Scholz, J., and D. Booth. 1998. Stream Habitat Assessment Protocols: An Evaluation of UrbanizingWatersheds in the Puget Sound Lowlands. Center for Urban Water Resources Management, University ofWashington, Seattle, WA.
Schuett-Hames, D., A. E. Pleus, J. Ward, M. Fox, and J. Light. 1999. TFW Monitoring Program method manualfor the large woody debris survey. Prepared for the Washington State Dept. of Natural Resources under theTimber, Fish, and Wildlife Agreement. TFW-AM9-99-004.
Scott, J. B., C. R. Steward, and Q. J. Stober. 1986. Effects of urban development on fish population dynamics inKelsey Creek, Washington. Transactions of the American Fisheries Society 115:555-567.
Sedell, J. R., F. J. Swanson, and S. V. Gregory. 1984. Evaluating fish response to woody debris. Pages 222-245in Pacific Northwest Stream Habitat Management Workshop. American Fisheries Society, WesternDivision, Humboldt State University, Arcata, California.
Steward, C. R. 1983. Salmonid Populations in an Urban Stream Environment. Masters. University ofWashington, Seattle.
The Watershed Company. 1998. Kirkland’s Streams, Wetlands, and Wildlife Study.
Van Sickle, J. V., and S. W. Gregory. 1990. Modeling inputs of large woody debris to streams from fallingtrees. Canadian Journal of Fisheries and Aquatic Sciences 20:1593-1601.
Vanderhoof, J. 2001a. 1998 and 1999 Volunteer Salmon Watcher Program in the Lake Washington Watershed.King County Department of Natural Resources, Seattle, WA.
Vanderhoof, J. 2001b. 2000 Volunteer Salmon Watcher Program in the Lake Washington Watershed. KingCounty Department of Natural Resources, Seattle.

Habitat Inventory and Assessment of Juanita Creek in 2000 31
Ward, J. M. 1968. Juanita Creek Siltation Investigation. Juanita Creek Siltation Investigation WashingtonDepartment of Game, Applied Research Division.
Washington Fish and Game Commission. 1997. Policy of the Washington Department of Fish and Wildlife andWestern Washington Treaty Tribes on Wild Salmonids. Washington Fish and Game Commission,
Olympia, WA.
Washington Forest Practices Board. 1997. Watershed Analysis Manual v4.0.
Williams, R. W., R. M. Laramie, J. J. Ames, and F. Biologists. 1975. A catalog of Washington Streams andsalmon utilization. Washington Department of Fisheries.

Habitat Inventory and Assessment of Juanita Creek in 2000 32
Appendix A:
Juanita Creek SSHIAP Segment andAssessment Reach Descriptions
Juanita Creek SSHIAP segments. Segments are contiguous; thus the start of one segment is where theprevious segment ends.SegmentNumber
Description Length(km)
LengthSurveyed (km)
PercentSurveyed
SSHIAP Gradient/Confinement
Category*1 Mouth to 1st RR tributary (near
1st crossing of 120th).55 .204 37% 0-1 %, U
2 Ends just d.s. of 126th St.crossing.
0.85 .412 48 0-1 %, U
3 Ends at confluence with 2nd RRtributary (near 108th)
1.34 .453 34 1-2 %, U
4 Ends just d.s. of 141st. .79 .215 27 1-2 %, U5 To I-405? Is there still significant
habitat above I-405?1.34 .498 37 2-4 %, U
*Segment breaks coincide with SSHIAP breaksRR is river rightd.s. is downstreamU is unconfined.
Assessment Reach Start and End locationsSegment Date Start location End location Meters
surveyed1 8/15/00 Juanita Beach Park Property 150 m upstream 1502A 8/15/00 NE 122nd St. End D.S. edge of NE 124th St. 75.82B 8/15/00 NE 124th St. 228.9 m upstream 228.93A 8/22/00 NE 129th Pl. 101st Lane NE 2383B 8/16/00 Rd. Bridge @ 13145 132nd 75m NE of 132nd (at road bridge?) 2154A 8/16/00 20 m d.s. footbridge which is
25 m d.s. 108th NE108th NE-Edith Moulton Park 650
4B 8/16/00 Edith Moulton Park 152 m u.s. 152 5A 8/17/00 Culvert @ 111st NE Footbridge @ 110 and 143rd 4045B 8/17/00 50 m east of I-405 Footbridge @ 93.7m 93.7

Habitat Inventory and Assessment of Juanita Creek in 2000 33
Appendix B: Stream Habitat Assessment Methods
Stream Habitat Assessment MethodsJuly 28, 2000
Karen Fevold, Hans Berge, Elissa Ostergaard (WLRD) King County Water and Land ResourcesDivision.
STREAM SEGMENTSReach breaks are determined by changes in gradient, channel confinement, and riparian landuse. Ifavailable use the TFW or SSHIAP segment boundaries. These breaks can be determined using GIStechnology and confirmed in the field. Gradient categories are: <1%, 1-2%, 2-4%, 4-8%, and greater than8-20% grade. Reach lengths should be 20 bankfull widths minimum length and 1200M maximum. Startand ends of reaches should be geo-referenced using GPS.
PREINVENTORY PREPARATION:Determine length of the sample reach by calculating 25% of the survey reach length. At least twenty-fivepercent of a stream segment should be surveyed to adequately represent segment conditions (May 1996).The starting point of a survey reach must be chosen randomly.
FIELD METHODSHabitat InventoryTwo persons, one with measurement and the other with note-taking tasks, conduct the surveys. Surveyswill be conducted in an upstream direction during low flow conditions. The start and end of the surveyreach will be marked with survey tape, so the GPS technician can identify and record the starting andending locations. At the start of the survey hip chain string will be tied to known reference points; as thesurveyors proceed upstream the locations and lengths of instream habitat units will be recorded. Habitatunits will be identified as pools, riffles or other (see definitions below). Categories are kept simple toavoid compounding error due to observer differences. The lengths and widths of all habitat units will berecorded to the nearest 10 cm (4 inches). In pool habitats, maximum depth, and pool tail-crest depths willbe recorded, as well as 4 thalweg depths. Pool Quality Index (PQI) (attached) will be determined for eachpool using a rating system adopted from Platts et al. (1983). Pools receive a higher rating if they are deep,large in relation to the size of the channel and have additional features that provide cover for fish such aswoody debris. Available discharge data will be noted on each survey day. Habitat units are defined as:
Pool: Habitat units where scouring water has carved out a non-uniform depression in thechannel bed or has been dammed. Slow water, with a width at least 1/2 of the wettedchannel width and 20 cm minimum residual pool depth (Max. depth–pool tail-out depth).Surveyor should note if the pool is a dam pool instead of a scour pool. Backwater andside-channel pools should be included in the survey.
Riffle: Swiftly flowing, turbulent water with hydraulic jumps (white-water); some partiallyexposed substrate; substrate cobble and/or boulder dominated.
Other: Includes non-turbulent fast water habitat types such as Glides: wide, uniform channelvolume, no thalweg, low to moderate water velocity, little surface agitation. Can appearpool like, but there is no significant scour depressions. Substrate is dominated by smallmaterials. Runs: deep and fast with defined thalweg and little surface agitation. Theremay be flow obstructions in the form of boulders. Typical substrate is gravel, smallcobble, cobble, small boulder, and boulders (definitions from Overton et al. 1997).
Habitat Inventory and Assessment of Juanita Creek in 2000 34
Large Woody Debris (LWD)All pieces within the bankfull width and spanning the channel will be counted. Pieces withrootwads and/ or in debris jams will also be identified. LWD are defined as logs at least 2 meters(6 feet) long and at least 15 cm in diameter. The length and diameter of each qualifying piece ofLWD will be measured and recorded in the habitat unit it occupies. The number of LWD piecesin a debris jam will be determined to the best of the surveyors ability and the volume of the DJ(including the small pieces) will be estimated from 3 dimensions: L x W x D.
REACH CHARACTERIZATIONBankfull width and depth will be measured approximately every 25 m at riffles where the channel isrelatively straight. At least 5 measurements will be taken per sample reach.Locations of fences and other property boundary markers were identified by hip chain and noted on datasheets. Riparian vegetation type changes will be noted on the data sheets. Categories will be:
• Forested (> 20ft. in height), coniferous, mixed, or deciduous;• Shrubs and/or vines (e.g. blackberries);• Tall herbaceous (e.g. unmowed field, reed canary grass, etc.);• Short herbaceous (e.g., mowed grass, pasture, etc.);• Impervious (e.g. buildings, roads, asphalt, etc.);• Residential landscaped (mowed lawn with ornamental shrubs/trees).
Presence and abundance (dominant or present) of invasive plant species are also noted (reed canary grass,blackberry, climbing nightshade, Japanese knotweed, etc. Use 4 letter abbreviations noted on thedefinition page.
BANK CONDITIONBank stability will be determined at every riffle on each bank using the method described by Booth(1994). Categories are:
• Stable: vegetated or low bars to level of low flow, or stabilizing features (rootwads, vegetation,etc.)
• Unstable: imminent signs of erosion, or less than 50% vegetative cover.• Armored: artificial bank protection of any kind (rip rap, wire mesh, etc.)
Stable banks show no signs of the following: Breakdown (clumps of bank are broken away and banks areexposed; slumping (banks have slipped down); tension cracking or fracture; vertical and eroding (thebank is mostly uncovered; i.e., less than 50% covered by perennial vegetation, roots, rocks of cobble sizeor larger and the bank angle is steeper than 80o). (From Overton 1997).
SIDE CHANNELS, TRIBUTARIES, PIPES AND WETLANDS• Location and size of pipes, and inflow or uptake will be noted. Tributaries and other side channels
entering the stream will be mapped, and length and width of side channels will be measured. • Locations of on-channel and nearby wetlands will also be noted and size will be estimated.• Estimate numbers of fish, life-history stage (juvenile, adult), and species (if possible), and note in
comments.• Location of road and driveway crossings will be noted (these data should not be extrapolated
beyond the survey reach).
REACH DESCRIPTION AND OTHER FEATURESOther channel features such as fences crossing the stream, possible barriers to fish passage, culverts, areasof erosion or large sediment deposition, dominant substrate size, hillside seeps or springs, undercut banks,

Habitat Inventory and Assessment of Juanita Creek in 2000 35
overhanging vegetation, etc. were noted. For each survey reach, the surveyor will write a brief narrative(about three to four sentences, longer if necessary) describing the quality of habitat, species and lifehistory stages observed, and relative abundance of fish and wildlife, and any obvious problems orconcerns such as point of discharge or withdrawal, and opportunity and/or need for protection or arestoration project.
PHOTOGRAPHSPhotographs depicting the general nature of each characterized reach will be taken as the surveyorsproceed upstream. Film rolls will be numbered and roll numbers, exposure numbers, and a description ofthe photograph will be noted on in the comments section of the field data sheets for later cross-reference.A single roll (KC 12 exp. Roll) will be used for each survey reach.
REFERENCES Booth, Derek. 1994. A Protocol for Rapid Channel Assessment. King County Water and Land Resources Division,
Seattle, WA.Entranco, King County Surface Water Management, J.F. Orsborn, Caldwell & Associates and Lee & Associates.
1994. Bear, Evans, Cottage Lake, and Mackey Creeks: Habitat Problems, Prioritization, and SolutionDevelopment - Technical Memorandum. King County Wastewater Treatment Division, CapitalImprovement Program, Seattle, WA.
Fevold, K.L., Berge, H.B. and C. May. In Progress. Habitat Assessments of Three Tributaries to the SammamishRiver: North, Swamp, and Little Bear Creeks 1999. King County, WLRD.
Groot, C. and L. Margolis, eds. 1991. Pacific Salmon Life Histories. UBC Press, Vancouver, B.C.Karr, J.R. and E.W. Chu. 1999. Restoring Life in Running Waters: Better Biological Monitoring. Island.May, C.W., E.B. Welch, R.R. Horner, J.R. Karr and B.W. Mar. 1997.Quality Indices for Urbanization Effects in
Puget Sound Lowland Streams. Washington Department of Ecology. Water Resources Series TechnicalReport No. 154. Seattle, WA.
Myers, J.M., R.G. Kope, G.J. Bryant, D. Teel, L.J. Lierheimer, T.C. Wainwright, W.S. Grant, F.W. Waknitz, K.Neely, S.T. Lindley, and R.S. Waples. 1998. Status Review of Chinook Salmon from Washington, Idaho,Oregon, and California. U.S. National Marine Fisheries Service, NOAA Technical Memorandum NMFS-NWFSC-35. Seattle, WA.
WRIA 8 Reconnaissance Assessment Workshop Matrix.Ostergaard, E.C. 1998. 1996 Salmon Spawning Surveys in the Lake Washington Watershed: Results of the 1996
Salmon Spawning Survey Program and Kokanee Spawner Survey Program. King County Water and LandResources Division, Seattle, WA.
Overton, C.K., S.P. Wollrab, B.C. Roberts and M.A. Radko. 1997. R1/R4 (Northern/Intermountain Regions) Fishand Fish Habitat Standard Inventory Procedures Handbook. U.S.D.A. Forest Service, IntermountainResearch Station, General Technical Report INT-GTR-346. Ogden, UT.
Peterson, N.P., A. Hendry and T.P. Quinn. 1992. Assessment of Cumulative Effects on Salmonid Habitat: SomeSuggested Parameters and Target Conditions. Timber, Fish and Wildlife and Center for Streamside Studies,University of Washington, Seattle, WA.
Platts, W.S., W.F. Megahan and G.W. Minshall. 1983. Methods for evaluating stream, riparian, and bioticconditions. Ogden, Utah, U.S. Forest Service General Technical Report. No. INT-138, 70 p.
Salo, E.O. and T.W. Cundy, eds. 1987. Streamside Management: Forestry and Fishery Interactions. Contribution no.57, Institute of Forest Resources, University of Washington, Seattle, WA.
Scholz, Jenna and D. Booth. 1998. Stream Habitat Assessment Protocols: An Evaluation of Urbanizing Watershedsin the Puget Sound Lowlands. Center for Urban Water Resources Management, University of Washington,Seattle, WA.
Schultz, L.P. and Students. 1935. The breeding activities of the little redfish, a landlocked form of the sockeyesalmon, Oncorhyncus nerka. Mid-Pacific Magazine, Jan-Mar.


Habitat Inventory and Assessment of Juanita Creek in 2000 37
Pool Quality Index (PQI) for Puget Sound Lowland Streams (1st to 3rd Order)(Modified from Platts et al., 1983)
Step Description PQI Score1A...............Maximum pool depth is >/ = to 1.0 m .........................................................................51B...............Maximum pool depth is < than 1.0 m…go to step 22A...............Pool wetted width spans most (>= 75%) of average wetted width…to step 32B...............Pool wetted width spans less than 75% of average wetted width…to step 53A...............Maximum pool depth < 0.5 m…to step 63B...............Maximum pool depth > 0.5 m…to step 44A...............Pool cover is abundant/ excellent ................................................................................44B...............Pool cover is fair to good.............................................................................................34C...............Pool cover is poor ........................................................................................................25A...............Maximum pool depth is > 0.5 m, with good to excellent cover ..................................45B...............Maximum pool depth is > 0.5 m, with fair to poor cover...........................................3 5C...............Maximum pool depth is < 0.5 m, with good to excellent cover ..................................25D...............Maximum pool depth is < 0.5 m, with fair to poor cover............................................16A...............Pool cover is excellent/abundant .................................................................................36B...............Pool cover is good to fair.............................................................................................26C...............Pool cover is poor ........................................................................................................1
Note: over conditions include LWD, over-hanging vegetation, undercut streambanks,and water surface agitation.

Habitat Inventory and Assessment of Juanita Creek in 2000 38
Stream Habitat Survey Data Sheet King County DNRP, WLR Division
Stream Segment Date____________Start Location End Location Page_____of____Start time End time____________________ Write summary segment notes on reverse side of datasheet.Water Temp F C Air Temp______________________ Weather____________Crew
Dist(m)
Habitat Unit Pools Wood
Type Width Type Mean depths (4 #s)
MaxDepth
TailDepth
PQI Type(L/RW/
DJ)
Diam Length

Habitat Inventory and Assessment of Juanita Creek in 2000 39
Stream Segment Date____________Measurements taken every 25 meters in straight riffles. Page______ of ________
Dist.(m)
Bankfull Riparian Veg. Bank Stability:S/U/A Invas
ives
Comments: Tribs., Fish use (#’s, Y/N), dominant and sub-dominant
substrate, pipes, etc. with meter distances
Width Depth RB LB RB LB
Dis Exp. Description of photo

Habitat Inventory and Assessment of Juanita Creek in 2000 40
Stream Habitat Survey Instructions King County DNR, Water and Land Resources Division General Instructions: First page is for recording habitat units and biological observations (habitat unit identification). Second page is for measurements taken at rifflesevery 25 meters. When finished with the sample reach, write a description of the habitat that may not be included in the data sheet—include a general substratedescription.Habitat Type: LWD: P - Slow water, scour depression in channel bed, length and width at least 1/2 the bankfullchannel width. R - Swiftly flowing, turbulent water; some partially exposed substrate; substrate cobble and/orboulder dominated; O –Glide: Wide, uniform channel volume, low to moderate water velocity, little surfaceagitation. Run: deep and fast with defined thalweg and little surface agitation. Enter OR, OG
Measure all, minimum 2 m (6 ft) length & 15 cm (6 in) diam, no min forstumps.
Qty/#: If DJ, enumerate as 1, measure 3 dimensions: L x W xH.Type: L=Log, RW = Root-wad, DJ=Debris jam Form Pool? Has the log caused a pool to form? (yes or no)
W - Riparian Wetland Pools:Type: D: dam pool, S: scour pool.
FW Mussels: Freshwater mussels - are they present? Indicate relative abundance. Tail Depth: Water depth @ hydraulic control at d/s end of poolFish?: Note whether salmonids (any age class) are seen in habitat unit. Estimate abundance.Substrate (sizes refer to intermediate diameter): Bank Condition:F - Fines <6 mm S - Stable – vegetated or low bars to level of low flowG - Gravel 7- 64 mm U - Unstable – steep, raw banks only below or above
bankfull levelC - Cobble 64-256 mm A - Armored – artificial bank protection of any kindB - Boulder >256 mm Riparian Type: Invasives: Dominant (D) = >20% cover on bank over reach. Species: (first two letters of genus &
species):FD, FC, FM = Forested deciduous, coniferous or mixed RUDI / RULA Himalayan blackberry (Rubus discolor) or Evergreen blackberry (Rubus laciniatus)SH = Shrubs or vines SODA climbing nightshade (Solanum dulcamara)HT = Herbaceous tall (unmowed/ungrazed) ILHE English ivy (Ilex hedera)HS = Herbaceous short (mowed/grazed) PHAR reed canary grass (Phalaris arundinacea)IMP = impervious (roads, pavement, buildings) SPDO spirea/hardhack (Spirea douglasii)LAND = Landscaped ( mowed lawn, ornamental shrubs/trees) POCU Japanese knotweed (Polygonum cuspidatum)
IRPS yellow flag iris (Iris pseudacorus)COAR bindweed (morning glory) (Convolvulus arvensis)LYSA - purple loosestrife (Lythrum salicaria)
Notes: Describe quality of habitat, species, life history stages, relative abundance of fish and wildlife, and any obvious problems or concerns such as point of discharge orwithdrawal, potential fish passage barrier, and opportunity and/or need for protection or a restoration project.

Habitat Inventory and Assessment of Juanita Creek in 2000 41
Appendix C:
Matrix of Pathways and Indicators
WRIA 8 Reconnaissance Assessment Workshop Matrix
Matrix developed using “Coastal Salmon Conservation: Working Guidance for Comprehensive Salmon Restoration Initiatives on the Pacific Coast, “ NOAA, Sept. 15, 1996, Appendix II. For additional parameter definition, use Timber, Fish and Wildlife Monitori
PATHWAY INDICATORS Properly functioning At risk Not properly functioningWater Quality: Temperature 50-57° F1 57-60° (spawning)
57-64° (migration & Rearing)2> 60° (spawning)> 64° (migration & Rearing)2
Sediment/Turbidity < 12% fines (<0.85mm) in gravel3,turbidity low
12-17% (west-side)3,12-20% (east-side)2,turbidity moderate
17% (west-side)3,20% (east-side)2, fines at surfaceor depth in spawning habitat2,turbidity high
ChemicalContamination/Nutrients
low levels of chemicalcontamination from agricultural,industrial, and other sources, noexcess nutrients, no CWA 303ddesignated reaches5
moderate levels of chemicalcontamination from agricultural,industrial, and other sources, someexcess nutrients, one CWA 303ddesignated reach5
high levels of chemicalcontamination from agricultural,industrial, and other sources, highlevels of excess nutrients, morethan one CWA 303d designatedreach5
Habitat Access: Physical Barriers any man-made barriers present inwatershed allow upstream anddownstream fish passage at allflows
any man-made barriers present inwatershed do not allow upstreamand/or downstream fish passage atbase/low flows
any man-made barriers present inwatershed do not allow upstreamand/or downstream fish passageat a range of flows
Habitat Elements: Substrate dominant substrate is gravel orcobble (interstitial spaces clear), orembeddedness <20%3
gravel and cobble is subdominant, or ifdominant, embeddedness 20-30%3
bedrock, sand, silt, or small graveldominant, or if gravel and cobbledominant, embeddedness >30%2

Habitat Inventory and Assessment of Juanita Creek in 2000 42
PATHWAY INDICATORS Properly functioning At risk Not properly functioning
Survey data, min.diameter used = 8”,minimum length =6.5ft.
Large Woody Debris Coast: >80 pieces/mile (50/km)>24” (.6) diameter >50 ft. length4;East-side: >20 pieces/mile>12”diameter >35 ft. length2;andadequate sources of woody debrisrecruitment in riparian areas
currently meets standards for properlyfunctioning, but lacks potential sourcesfrom riparian areas of woody debrisrecruitment to maintain that standard
does not met standards forproperly functioning and lackspotential large woody debrisrecruitment
Survey data:Juanita Creekaverage width = 20”
Pool Frequency
channel width#pools/mile6
5 feet .. 184 10“ .......... 96 15“ .......... 70 20” .......... 56 25“ .......... 47 50“ .......... 26 75“ .......... 23
meets pool frequency standards(left) and large woody debrisrecruitment standards for properlyfunctioning habitat (above)
meets pool frequency standards butlarge woody debris recruitmentinadequate to maintain pools over time
does not meet pool frequencystandards
Survey data: PQI
Pool Quality pools >1 meter deep (holdingpools) with good cover and coolwater3, minor reduction of poolvolume by fine sediment
few deeper pools (>1 meter) present orinadequate cover/temperature3,moderate reduction of pool volume byfine sediment
no deep pools (>1 meter) andinadequate cover/temperature3,major reduction of pool volume byfine sediment
Off-Channel Habitat backwaters with cover, and lowenergy off-channel areas (ponds,oxbows, etc.)3
some backwaters and high energy sidechannels3
few or no backwaters, no off-channel ponds3

Habitat Inventory and Assessment of Juanita Creek in 2000 43
PATHWAY INDICATORS Properly functioning At risk Not properly functioningRefugia (importantremnant habitat forsensitive aquaticspecies)
habitat refugia exist and areadequately buffered (e.g., by intactriparian reserves); existing refugiaare sufficient in size, number, andconnectivity to maintain viablepopulations or sub-populations7
habitat refugia exist but are notadequately buffered (e.g., by intactriparian reserves); existing refugia areinsufficient in size, number, andconnectivity to maintain viablepopulations or sub-populations7
adequate habitat refugia do notexist7
Channel Condition& Dynamics:
Survey data
Width/Depth Ration <102, 4 10-12 (we are unaware of any criteriato reference)
>12 (we are unaware of anycriteria to reference)
Survey data StreambankCondition
>90 % stable; i.e., on average, lessthan 10% of banks are activelyeroding2
80-90% stable <80% stable
FloodplainConnectivity
off-channel areas are frequentlyhydrologically linked to mainchannel; overbank flows occur andmaintain wetland functions, riparianvegetation and succession
reduced linkage of wetland,floodplains, and riparian areas to mainchannel; overbank flows are reducedrelative to historic frequency, asevidenced by moderate degradation ofwetland function, riparianvegetation/succession
severe reduction in hydrologicconnectivity between off-channel,wetland, floodplain, and riparianareas; wetland extent drasticallyreduced and riparianvegetation/succession alteredsignificantly
Flow-Hydrology: Change in Peak/BaseFlows
watershed hydrograph indicatespeak flow, base flow, and flowtiming characteristics comparableto an undisturbed watershed ofsimilar size, geology, andgeography
some evidence of altered peak flow,baseflow, and/or flow timing relative toan undisturbed watershed of similarsize, geology, and geography
pronounced changes in peak flow,baseflow, and/or flow timingrelative to an undisturbedwatershed of similar size, geologyand geography

Habitat Inventory and Assessment of Juanita Creek in 2000 44
PATHWAY INDICATORS Properly functioning At risk Not properly functioningIncrease in DrainageNetwork
zero or minimum increases indrainage network density due toroads8, 9
moderate increases in drainagenetwork density due to roads(e.g., = 5%)8, 9
significant increases in drainagenetwork density due to roads (e.g.,= 20-25%)8, 9
WatershedConditions:
Road Density &Location
<2mi.mi2, 11, no valley bottom roads 2-3- mi/mi2, some valley bottom roads >3 mi/mi2, many valley bottomroads
Disturbance History <15% ECA (entire watershed) withno concentration of disturbance inunstable or potentially unstableareas, and/or refugia, and/orriparian area; and for NWFP area(except AMAs), >15% retention ofLSOG in watershed10
<15% ECA (entire watershed) butdisturbance concentrated in unstableor potentially unstable areas, and/orrefugia, and/or riparian area; and forNWFP area (except AMAs), > 15%retention of LSOG in watershed10
<15% ECA (entire watershed) butdisturbance concentrated inunstable or potentially unstableareas, and/or refugia, and/orriparian area; does not meetNWFP standard for LSOGretention
Riparian Reserves the riparian reserve systemprovides adequate shade, largewoody debris recruitment, andhabitat protection and connectivityin all sub-watersheds, and buffersor includes known refugia forsensitive aquatic species (>80%intact), and/or for grazing impact
moderate loss of connectivity orfunction (shade, LWD recruitment, etc.)of riparian reserve system, orincomplete protection of habitats andrefugia for sensitive aquatic species(=70-80% intact), and/or for grazingimpacts: percent similarity of riparian
riparian reserve system isfragmented, poorly connected, orprovides inadequate protection ofhabitats and refugia for sensitiveaquatic species (<70% intact),and/or for grazing impacts: percentsimilarity of riparian vegetation tothe potential natural

Habitat Inventory and Assessment of Juanita Creek in 2000 45
Appendix D: Photographs of Assessed Reaches
Segment 1. Bank armoring and trampling wastypical in this segment. Blackberry vines (Rubuslacinatus) were also abundant.
Segment 1. Culvert at NE 120th Street. Armoringtypical of this segment.
Segment 2. Residential encroachment on theriparian zone and channelized stream reacheswere typical in this segment. A large piece ofwood on the right bank was viewed as aneyesore and a hazard by adjacent propertyowners.
Segment 2. This photo is taken lookingdownstream toward NE 124th Street. Note thelarge amount of sediment aggradation, andinvasives in the riparian zone.
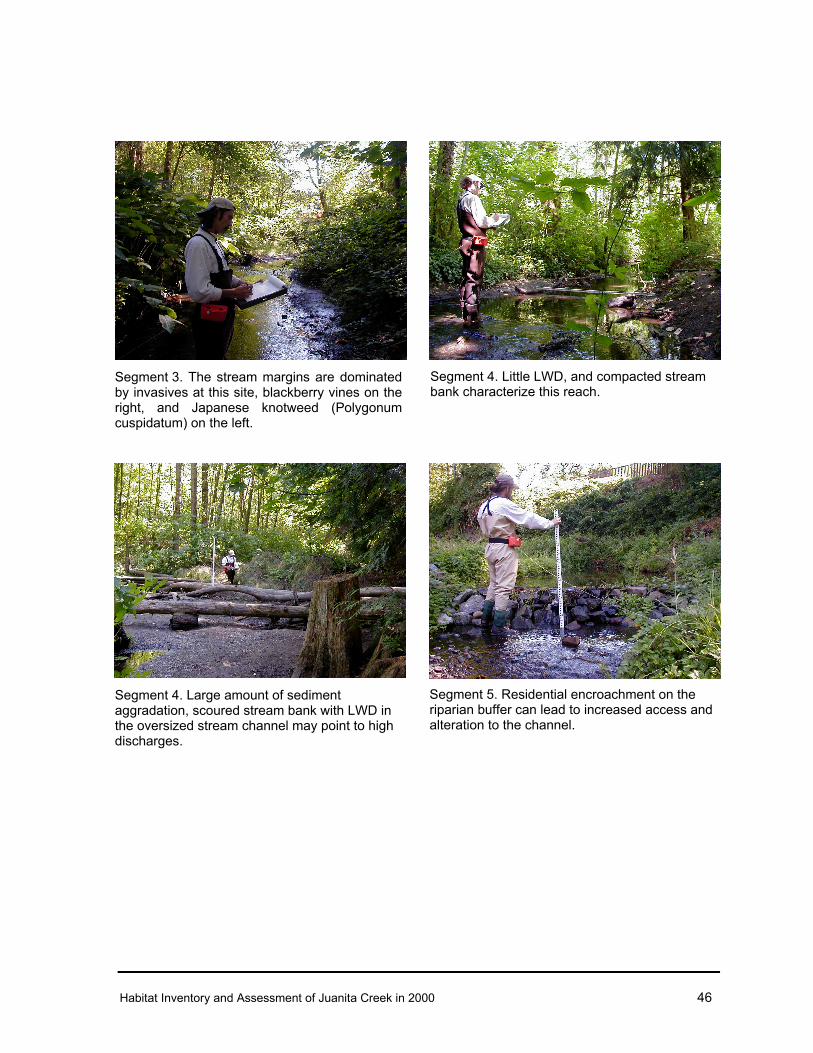
Habitat Inventory and Assessment of Juanita Creek in 2000 46
Segment 3. The stream margins are dominatedby invasives at this site, blackberry vines on theright, and Japanese knotweed (Polygonumcuspidatum) on the left.
Segment 4. Little LWD, and compacted streambank characterize this reach.
Segment 4. Large amount of sedimentaggradation, scoured stream bank with LWD inthe oversized stream channel may point to highdischarges.
Segment 5. Residential encroachment on theriparian buffer can lead to increased access andalteration to the channel.

Habitat Inventory and Assessment of Juanita Creek in 2000 47
Segment 5. Riparian buffer appears to be wellvegetated in this reach, and contains aconsiderable blackberry vine component.