H2020 EE 2014 3 MarketUptake - Home - waste water treatment … · 1 Standard method and online...
16
1 Standard method and online tool for assessing and improving the energy efficiency of waste water treatment plants H2020‐EE‐2014‐3‐MarketUptake D 3.1: Identification of key parameters and key performance indicators (KPIs) and ENERWATER methodology (draft 0) Acknowledgements & Disclaimer: The ENERWATER project has received funding from the European Union’s Horizon 2020 research and innovation programme under grant agreement No 649819. Although the project's information is considered accurate, no responsibility will be accepted for any subsequent use thereof. The EC accepts no responsibility or liability whatsoever with regard to the presented material, and the work hereby presented does not anticipate the Commission's future policy in this area. Due date of deliverable: 31 st August 2015 Actual submission date: 31 st August 2015 Organisation name of lead contractor for this deliverable: Cranfield University, UK. Version 1 Dissemination Level PU Public PP Restricted to other programme participants (including the Commission Services) RE Restricted to a group specified by the consortium (including the Commission Services) X CO Confidential, only for members of the consortium (including the Commission Services)
Transcript of H2020 EE 2014 3 MarketUptake - Home - waste water treatment … · 1 Standard method and online...

1
Standard method and online tool for assessing and improving the energy efficiency of waste water
treatment plants
H2020‐EE‐2014‐3‐MarketUptake
D 3.1: Identification of key parameters and
key performance indicators (KPIs) and
ENERWATER methodology (draft 0)
Acknowledgements & Disclaimer: The ENERWATER project has received funding from the European Union’s Horizon 2020 research and innovation programme under grant agreement No 649819. Although the project's information is considered accurate, no responsibility will be accepted for any subsequent use thereof. The EC accepts no responsibility or liability whatsoever with regard to the presented material, and the work hereby presented does not anticipate the Commission's future policy in this area.
Due date of deliverable: 31st August 2015 Actual submission date: 31st August 2015 Organisation name of lead contractor for this deliverable: Cranfield University, UK. Version 1
Dissemination Level PU Public PP Restricted to other programme participants (including the Commission Services) RE Restricted to a group specified by the consortium (including the Commission
Services) X
CO Confidential, only for members of the consortium (including the Commission Services)

1
Table of contents
1 SCOPE OF THE DOCUMENT ................................................................................................................................... 2
2 IDENTIFICATION OF KEY PARAMETERS AND KEY PERFORMANCE INDICATORS (KPIS) ..................... 2
3 ENERWATER METHODOLOGY ........................................................................................................................... 10

2
1 Scope of the document In the present deliverable we present our progress on the next tasks:
Task 3.1: Identification of key parameters and key performance indicators (KPIs)
In this first phase the consortium has identified the key energy parameters to be monitored in wastewater treatment plants (WWTPs). This task includes identifying where in the WWTPs the energy consumption/production should take place. Furthermore the energy consumption should be related with the performance of a WWTP and parameters such as effluent flow, nutrient removal, biochemical oxygen demand (BOD), chemical oxygen demand (COD), suspended solids, orthophosphate (PO4), ammonia (NH4) and nitrate (NO3) need to be estimated at various stages of the WWTP to an effective, estimation of energy consumption in WWTP.
Task 3.2: Methodology document
The ENERWATER methodology (draft 0) aims at describing in a systematic way the various steps required to establish the energy index of a particular WWTP. More specifically the methodology includes guidelines on how to select equipment/processes to place energy monitors, how to monitor the WWTP and how data should be reported. The methodology document intends to be a very simple and easy to follow document that can effortlessly understood and put in practice by operators, site managers, process engineers as well as energy auditors.
2 Identification of key parameters and key performance indicators (KPIs)
2.1 WWTP boundaries
Wastewater treatment plants (WWTPs) can be composed by a very wide variety of processes designed for removal pollutants from used water that has been discharged to a central facility. Independently of the processes implemented at the WWTPs, these facilities are organised in 7 ain stages (Figure 1). Not all stages have to be present to achieve wastewater treatment. The following definitions are applied in the ENERWATER methodology document:
Stage 1: Preliminary treatment includes all pumping required to discharge the wastewater to the WWTP (i.e.: pumping stations that can be found within the boundaries of the WWTP, that can include influent or effluent discharge), the equipment involved in screening, grit removal, oil separation and flow equalisation. Storage of wastewater in storm tanks and respective pumps is also included in Stage 1.
Stage 2: Primary treatment includes all the equipment involved on primary sedimentation/clarification. Equipment required for desludging the primary sedimentation and dose of chemicals (e.g.: iron dosing for phosphorus removal or coagulant dosing for enhanced solids removal) that takes place before or during primary sedimentation/clarification, should also be considered in Stage 2. Specific control and instrumentation tools that are required to operate Stage 2 should also be considered.
Stage 3: Secondary treatment includes all processes and their auxiliary equipment required for biological wastewater treatment after primary sedimentation (if present). Common processes used in secondary treatment include biofilm processes (e.g.: trickling filters) and flocculent processes (e.g.: activated sludge and biological nutrient removal) and their respective humus tank or secondary clarifier. Equipment required to operate the biological wastewater treatment pumping (recirculation), aeration and secondary clarification, should also be considered in Stage 3. Equipment required for desludging the secondary clarifier and dose of chemicals (e.g.: iron dosing for phosphorus removal that takes place before or during secondary clarification, should also be considered in Stage 3. Specific control and instrumentation tools that are required to operate Stage 3should also be considered.

3
Figure 1. General schematic representation of a WWTP with the various stages.
Stage 4: Tertiary and advanced treatment can be completed by a wide variety of processes including: chemical (e.g.: chlorination or ozonation), physical (e.g.: sand filters, UV disinfection) and biological (e.g.: reed‐beds; submerged aerated filters, tertiary nitrification) processes. For simplicity the ENERWATER methodology defines as Stage 4 any process that takes place between secondary treatment and effluent discharge and their respective equipment. Pumping required for effluent discharge should be included as part of Stage 4. Specific control and instrumentation tools that are required to operate Stage 4 should also be considered.
Stage 5: Sludge treatment often includes a range of steps such as thickening (e.g.: gravity thickeners), belt presses etc.); dewatering (e.g.: centrifuges) and sludge stabilisation technologies that range from alkalinity dosing, anaerobic digestion to thermal processes such as incineration, gasification and pyrolysis. For simplicity the ENERWATER methodology defines as Stage 5 any processes that process that handle concentrated streams derived from primary, secondary and physical‐chemical treatment, that are traditionally above 0.5% total solids and their respective equipment. Pumping required to handle streams should also be included. If the WWTP receives import sludge this should be also accounted as in the energy monitoring exercise. Nevertheless if the WWTP receives other waste to complete co‐digestion then processing of these wastes should be excluded from the exercise. Also of high relevance is the fact that many sludge stabilisation technologies are energy producers, not consumers. Energy production on site should be considered either by accounting for the biogas production on site, or if possible measuring the kWh produced by these processes. Specific control and instrumentation tools that are required to operate Stage 5 should also be considered.
Stage 6: Return liquors treatment can include processes for treatment of return liquors (reject water) that are usually focused on nitrogen removal and phosphorus removal through processes such as Anammox or struvite precipitation, respectively, just give some examples. Specific control and instrumentation tools that are required to operate Stage 6 should also be considered.
Stage 7: Odour treatment often includes recovering of extraction the air of air extracted from sludge processing technologies (Stage 5) or even pumping stations. Odour treatment technologies can be classified into physical/chemical (chemical scrubbers, incinerators, adsorption systems, and so forth) and biological (biofilters, biotrickling filters, bioscrubbers, and activated sludge diffusion reactors).
Primary sed. Second. sed. Tertiary treatment
Treated effluent
Sludge Sludge Large items
Grit
Screens Grit chamber
Biological treatment
Advanced treatment
Energy (biogas, etc.) Sludge stabilization
Stage 2: Primary
treatment Stage 3:
Secondary treatment Stage 4:
Tertiary treatment
Stage 1:
Pre-treatment
Sludge
Sludge processing (thickening, dewatering)
Sludge processing (thickening, dewatering)
Stage 5: Sludge
treatment
Sludge disposal or re-use
Wastewater influent
Return liquors Stage 6:
Return liquors
treatment
Stage 7:Odour treatment

4
Auxiliaries: Many WWTPs will have exterior lighting, offices and labs. Other possible auxiliaries include pumping of water for garden irrigation, servers for data storage and transfer etc. The energy consumption from these auxiliary facilities should be measured and considered for calculating the energy index.
2.2 WWTP key performance indicators
Various methodologies have been described to estimate energy consumption in WWTPs including: utilisation of the equipment specifications (power and usage time) power loggers and modelling. In Europe, the methodologies adopted vary from country to country even amongst water utilities. The limitations of exiting methodologies are related with the need to compare similar wastewater pollutant loads at the influent, including carbon to nitrogen ratios, and effluent consents, that might vary between geographical regions and therefore can be of limited energy consumption data when comparing sites in different locations. Another important aspect to take into consideration is how the energy consumption is reported. Some examples include energy consumption per volume of wastewater treated, connected people (population equivalent), pollutant load or per type of treatment process giving origin to a wide range of units on how to report the energy data (e.g.: kWh/PE; kWh/m3; kWh/PE.year; kWh/kgCODrem; €/m
3; kWh/kgNrem; kWh/kgBODrem; kWh/m3
biogas).
Hence, there is a clear need to establish suitable key performance indicators within the WWTP that allow a comparable, realistic and universal form of reporting the energy data. After thorough review of existing data in WP2 it become obvious that general energy consumption units such as kWh/PE; kWh/m3; kWh/PE.year have little value as it does not provide a suitable overview of the natural variability found amongst processes in WWTPs. At a first glance it is envisaged that the ENERWATER methodology will account for the KWh used by specific equipment but taking in consideration the function of the WWTP, i.e.: the key pollutants removed, efficiency and quality of the effluent according to specific regulation.
For the ENERWATER methodology it is recommended that different KPIs are considered depending on the different stages to the WWTP (Table 1). On an ideal scenario the wastewater treatment energy index (WTEI) should be based on the KPIs identified by on‐line or frequent monitoring of the KPIs through composite or grab samples to account for the key pollutants removed at the different stages of the process as well as the process efficiency. Nevertheless this data might not be available in the required detail or resources might be limited preventing the attainment of the WTEI. To respond to this pressure a number of scenarios is proposed when calculating the WTEI with the Platinum WTEI benefiting from more detailed data and consequently high levels of confidence all the way to Bronze WTEI that is based on text book information and general assumptions, and hence providing the lowest WTEI confidence values (Table 1)
The highest energy consumption in WWTPs is usually reported in Stage 3: Secondary treatment processes. As described above this stage can be highly variable and complex. Table 1 shows the required KPIs based on:
Secondary treatment for COD removal only: kWh/kg COD removed
Secondary treatment for COD and ammonia removal: kWh/kg COD removed, kWh/kg NH4 removed
Secondary treatment for COD and chemical P removal: kWh/kg COD removed, kWh/kg P chem removed
Secondary treatment for COD and TN removal: KWh/kg COD removed, kWh/kg TN removed
Secondary treatment for COD and phosphate (P) removal: kWh/kg COD removed, KWh/kg P removed
Secondary treatment for COD, TN and P removal: KWh/kg COD removed, kWh/kg TN removed kWh/kg P removed
Another highly variable part of the WWTPs is Stage 4: Tertiary and advanced treatment. Table 1 shows the required KPIs based on:
Tertiary treatment for solids removal: kWh/kg TSS removed
Tertiary treatment for ammonia removal: kWh/kg NH4 removed
Tertiary treatment for TN removal: kWh/kg TN removed
Tertiary treatment for solids and P removal: kWh/kg TSS removed, kWh/kg P removed
Tertiary treatment for pathogens removal: kWh/log reduction
Tertiary treatment for hazardous pollutants removal: kWh/model compound such as estradiol removed

5
During Stage 5: Sludge treatment, are used processes and equipment that can use electricity and also produce electricity. It is important to account for energy production on WWTP and subtract it from the energy consumption to calculate the WTIE. Table 1 shows the required KPIs based on:
Sludge treatment for solids concentration: kWh/kg TS processed
Sludge treatment for energy production: ‐ kWh produced/ton sludge processed
Sludge treatment for energy production: ‐ kWh produced/m3 sludge processed
Sludge treatment for energy production: ‐ kWh produced/kg VS removed Stage 6: Return liquors treatment can include processes for treatment of return liquors (reject water) and hence is highly variable on purpose and hence type of equipment used. Table 1 shows the required KPIs based on:
Return liquors treatment for TN removal: kWh/kg TN removed
Return liquors treatment for P removal: kWh/kg P removed
Stage 7: Odour treatment can include a wide variety of processes including physical, chemical and biological. Table 1 shows the required KPIs based on:
Odour treatment for volatile organic compounds removal: kWh/kg VOCs removed
Odour treatment for volatile inorganic compounds removal: kWh/kg VICs removed
Odour treatment for volatile sulphur compounds removal: kWh/kg VSCs removed

6
Table 1. Identification of KPIs according to treatment stage for various scenarios.
WTEI scenario
Treatment stage
Platinum Gold Silver Bronze
Stage 1: Preliminary treatment
kWh/m3
Requires measurement of the real flow wastewater treated through online flow meters or similar. Data can be reported based on daily, monthly or yearly averages.
kWh/m3
Requires measurement of the real flow wastewater treated through online flow meters or similar. Data can be reported based on daily, monthly or yearly averages
kWh/m3
Requires measurement sporadic measurements of the real flow of wastewater treated
kWh/m3designed
Assumes that real flow data is not available and uses the WWTP design flow
Stage 2: Primary treatment
KWh/kg TSS removed
KWh/kg P chem removed Requires measurement of TSS and PO4‐P before and after Stage 2. Measurements should be taken >2/ month using grab and composite samples. Data can be reported based on daily, monthly or yearly averages.
KWh/kg TSS removed
KWh/kg P chem removed
Requires measurement of TSS and PO4‐P before and after Stage 2. Measurements should be taken at least once a month using grab or composite samples. Data can be reported based on monthly or yearly averages.
KWh/kg TSS removed
Requires measurement of TSS before and after Stage 2. Only a few measurements per year (<12/year) might be available. Data can be reported based on yearly averages.
KWh/kg TSS removed
Text book assumptions or data from nearby sites might be used to assume a TSS removal (Table 2)
Stage 3: Secondary treatment
KWh/kg COD removed, KWh/kg NH4 removed, KWh/kg TN removed, KWh/kg P bio removed,
KWh/kg P chem removed
Requires measurement of COD, NH4‐N, TN and PO4‐P before and after Stage 3 depending on the aim of the secondary treatment as described above. Measurements should be taken >2/ month using grab and composite samples. Data can be reported based on daily, monthly or yearly averages.
KWh/kg COD removed, KWh/kg NH4 removed, KWh/kg TN removed, KWh/kg P bio
removed, KWh/kg P chem removed
Requires measurement of COD, NH4‐N, TN and PO4‐P before and after Stage 3 depending on the aim of the secondary treatment as described above. Measurements should be taken at least once a month using grab or composite samples. Data can be reported based on monthly or yearly averages.
KWh/kg COD removed, KWh/kg NH4 removed, KWh/kg TN removed, KWh/kg P bio removed, KWh/kg P
chem removed
Requires measurement of COD, NH4‐N, TN, and PO4‐P before and after Stage 3. Only a few measurements per year (<12/year) might be available. Data can be reported based on yearly averages.
KWh/kg COD removed, KWh/kg NH4 removed, KWh/kg TN removed, KWh/kg P removed
Text book assumptions or data from nearby sites might be used to assume a of COD, NH4‐N, TN and PO4‐P removal (Table 2)

7
Treatment stage
Platinum Gold Silver Bronze
Stage 4: Tertiary and advanced treatment
kWh/kg TSS removed, kWh/kg NH4 removed,
kWh/kg TN removed; kWh/kg P removed, kWh/log
reduction kWh/estradiol removed Requires measurement of TSS, NH4‐N, TN and PO4‐P, Log pathogen reduction and estradiol before and after Stage 4 depending on the aim of the secondary treatment as described above. Measurements should be taken >2/ month using grab and composite samples. Data can be reported based on daily, monthly or yearly averages
kWh/kg TSS removed, kWh/kg NH4 removed, kWh/kg TN removed; kWh/kg P removed, kWh/log reduction kWh/estradiol removed Requires measurement of TSS, NH4‐N, TN and PO4‐P, Log pathogen reduction and estradiol before and after Stage 4 depending on the aim of the secondary treatment as described above. Measurements should be taken at least once a month using grab or composite samples. Data can be reported based on monthly or yearly averages.
kWh/kg TSS removed, kWh/kg NH4
removed, kWh/kg TN removed; kWh/kg P removed, kWh/log reduction kWh/estradiol removed
Requires measurement of TSS, NH4‐N, TN and PO4‐P, Log pathogen reduction and estradiol before and after Stage 4 depending on the aim of the secondary treatment as described above. Only a few measurements per year (<12/year) might be available. Data can be reported based on yearly averages.
kWh/kg TSS removed, kWh/kg NH4 removed, kWh/kg TN removed; kWh/kg P removed, kWh/log reduction kWh/estradiol
removed
Text book assumptions or data from nearby sites might be used to assume a of COD, NH4‐N, TN and PO4‐P removal (Table 2)
Stage 5: Sludge treatment
kWh/kg TS processed; ‐ kWh produced/ton sludge processed; ‐ kWh produced/m
3 sludge processed;‐ kWh
produced/kg VS removed Requires measurement of weight or volume of sludge in relation to TS to be processes in the thickening or dewatering processes. For the sludge stabilisation processes the VS content should be measured before and after the processes. Measurements should be taken >2/ month using grab and composite samples. Data can be reported based on daily, monthly or yearly averages
kWh/kg TS processed; ‐ kWh produced/ton
sludge processed; ‐ kWh produced/m3 sludge
processed;‐ kWh produced/kg VS removed
Requires measurement of weight or volume of sludge in relation to TS to be processes in the thickening or dewatering processes. For the sludge stabilisation processes the VS content should be measured before and after the processes. Measurements should be taken at least once a month using grab or composite samples. Data can be reported based on monthly or yearly averages.
kWh/kg TS processed; ‐ kWh
produced/ton sludge processed; ‐ kWh
produced/m3 sludge processed;‐ kWh
produced/kg VS removed
Requires measurement of weight or volume of sludge in relation to TS to be processes in the thickening or dewatering processes. For the sludge stabilisation processes the VS content should be measured before and after the processes. Only a few measurements per year (<12/year) might be available. Data can be reported based on yearly averages.
kWh/kg TS processed; ‐ kWh
produced/ton sludge processed; ‐ kWh
produced/m3 sludge processed;‐ kWh
produced/kg VS removed
Text book assumptions or data from nearby sites might be used to assume a of COD, NH4‐N, TN and PO4‐P removal (Table 2)

8
Treatment stage
Platinum Gold Silver Bronze
Stage 6: Return liquors treatment
kWh/kg TN removed or kWh/kg TP removed
Requires measurement of TN and PO4‐P, before and after Stage 6 depending on the aim of the treatment process as described above. Measurements should be taken >2/ month using grab and composite samples. Data can be reported based on daily, monthly or yearly averages
kWh/kg TN removed or kWh/kg TP removed
Requires measurement of TN and PO4‐P, before and after Stage 6 depending on the aim of the treatment process as described above. Measurements should be taken at least once a month using grab or composite samples. Data can be reported based on monthly or yearly averages
kWh/kg TN removed or kWh/kg TP
removed
Requires measurement of TN and PO4‐P, before and after Stage 6 depending on the aim of the treatment process as described above. Only a few measurements per year (<12/year) might be available. Data can be reported based on yearly averages.
kWh/kg TN removed or kWh/kg TP
removed
Text book assumptions or data from nearby sites might be used to assume a of TN and PO4‐P removal (Table 2).
Stage 7: Odour treatment
kWh/kg VOCs removed or kWh/kg VICs removed or kWh/kg VSCs removed
Requires measurement of VOCs, or VICs or VSCs before and after Stage 7 depending on the aim of the treatment process as described above. Measurements should be taken >2/ month using grab and composite samples. Data can be reported based on daily, monthly or yearly averages
kWh/kg VOCs removed or kWh/kg VICs
removed or kWh/kg VSCs removed
Requires measurement of VOCs, or VICs or VSCs before and after Stage 7 depending on the aim of the treatment process as described above. Measurements should be taken at least once a month using grab or composite samples. Data can be reported based on monthly or yearly averages
kWh/kg VOCs removed or kWh/kg VICs removed or kWh/kg VSCs removed
Requires measurement of VOCs, or VICs or VSCs before and after Stage 7 depending on the aim of the treatment process as described above. Only a few measurements per year (<12/year) might be available. Data can be reported based on yearly averages
kWh/kg VOCs removed or kWh/kg VICs removed or kWh/kg VSCs removed
Text book assumptions or data from nearby sites might be used to assume a of VOCs, VICs or VSCs removal (Table 2).
Auxiliaries kWh/m2 office or kWh/number of persons on site or kWh/m2 site foot print Based on measured data on site.
kWh/m2 office or kWh/number of persons on site or kWh/m2 site foot print Based on measured data on site.
kWh/m2 office or kWh/number of persons on site or kWh/m2 site foot print Based on measured data on site or information from nearby sites
kWh/m2 office or kWh/number of persons on site or kWh/m2 site foot print Text book assumptions or data from nearby sites (Table 2)
9
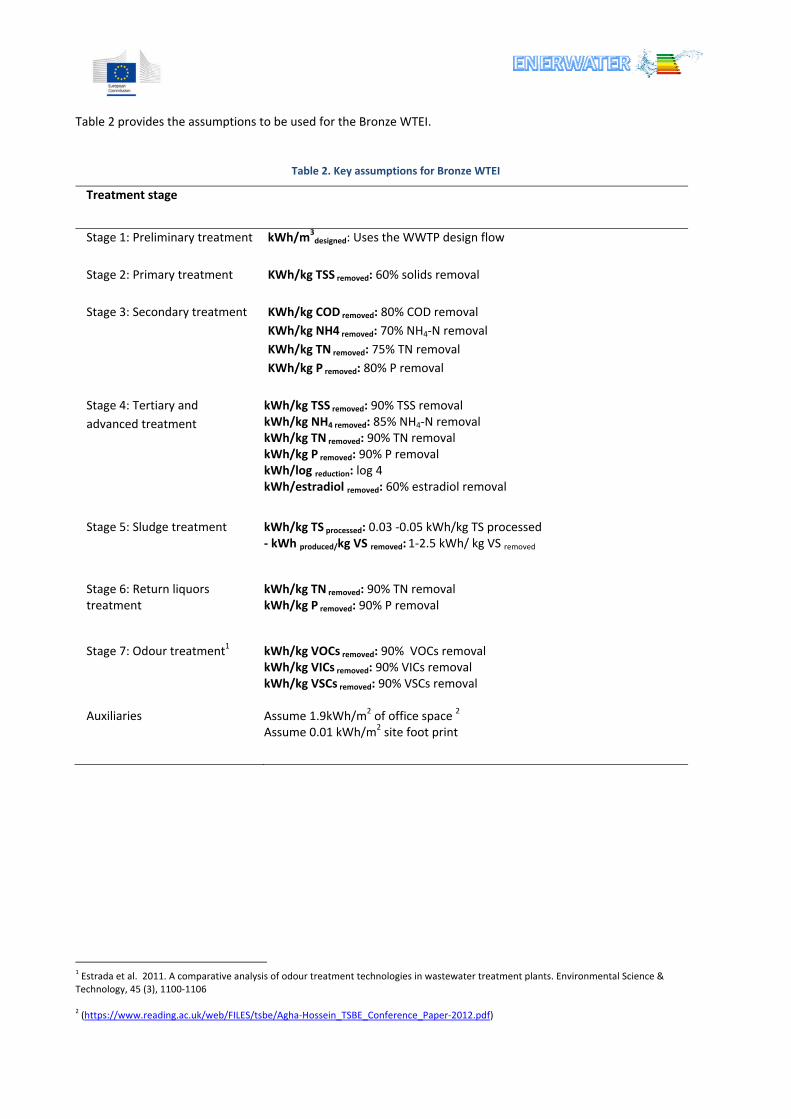
Table 2 provides the assumptions to be used for the Bronze WTEI.
Table 2. Key assumptions for Bronze WTEI
Treatment stage
Stage 1: Preliminary treatment kWh/m3designed: Uses the WWTP design flow
Stage 2: Primary treatment
KWh/kg TSS removed: 60% solids removal
Stage 3: Secondary treatment KWh/kg COD removed: 80% COD removal
KWh/kg NH4 removed: 70% NH4‐N removal
KWh/kg TN removed: 75% TN removal
KWh/kg P removed: 80% P removal
Stage 4: Tertiary and
advanced treatment
kWh/kg TSS removed: 90% TSS removalkWh/kg NH4 removed: 85% NH4‐N removal kWh/kg TN removed: 90% TN removal kWh/kg P removed: 90% P removal kWh/log reduction: log 4 kWh/estradiol removed: 60% estradiol removal
Stage 5: Sludge treatment
kWh/kg TS processed: 0.03 ‐0.05 kWh/kg TS processed‐ kWh produced/kg VS removed: 1‐2.5 kWh/ kg VS removed
Stage 6: Return liquors treatment
kWh/kg TN removed: 90% TN removalkWh/kg P removed: 90% P removal
Stage 7: Odour treatment1 kWh/kg VOCs removed: 90% VOCs removal kWh/kg VICs removed: 90% VICs removal kWh/kg VSCs removed: 90% VSCs removal
Auxiliaries Assume 1.9kWh/m2 of office space 2
Assume 0.01 kWh/m2 site foot print
1 Estrada et al. 2011. A comparative analysis of odour treatment technologies in wastewater treatment plants. Environmental Science & Technology, 45 (3), 1100‐1106 2 (https://www.reading.ac.uk/web/FILES/tsbe/Agha‐Hossein_TSBE_Conference_Paper‐2012.pdf)

10
3 ENERWATER methodology
The objective of this method is to guide expert auditors on how to evaluate the energy performance of a WWTP reaching a final energy diagnosis of them. The method will lead to the consecution of a final figure: the WATER TREATMENT ENERGY INDEX (WTEI). This index is the basis for comparison; the WTEI summarizes the general performance and makes results readily comparable.
The method will indicate which parameters have to be used and the proper way to take and handle them for the most used water treatment –technologies.
3.1 Points to consider when planning the estimation of energy consumption at a WWTP
Important information that should be obtained at planning stage includes:
Identification of the WWTP and become aware of any particular operation regimes or retrofitting work planned for the duration of the assessment that could impact the estimated WTEI.
Definition of the WWTP boundaries and identification of the treatment processes/ equipment according to the stages defined in Figure 1.
Identify of how is the electrical system organised at the WWTP (e.g.: what pieces of equipment can be monitored as stand alone and what units can be monitored as clusters)
Plan an extensive sampling programme according to the desired/possible WTEI scenario, this includes identifying samples to be collected and frequency (exact location in the WWTP, spot or composite sampling), identify persons/external contractor that will be responsible for the sample collection, identify parameters to be measured and cross check that the responsible lab is capable of utilizing standard methods (see more detail in section 3.8). Allocate a suitable budget for this activity
Identify the preferred equipment/methodology for monitoring electricity flows within the WWTP. To achieve high quality WTEI scenarios (platinum and gold) online energy monitors are recommended (these can be provided by a number of companies). For the development of the ENERWATER methodology the energy monitoring system were provided by Wellness that was made of circuits/clamps (power loggers) that allowed GPRS communication to allow frequent data recording (every 5 seconds) as well as live data streaming to the water utility. A suitable server for data collection and storage should be identified. Furthermore suitable software should be in place to process and analyze the data collected according to the ENERWATER methodology and hence allow the estimation of the WTEI. Special attention should also be given to ensure that the WWTP has GPRS or other forms of wireless communication available, if online energy monitors are to be installed.
By combining the information collected above, a plan and a budget should be put in place to estimate the number of energy monitors to be acquired, their exact location and the likely person/external contractor that will be completing the installation as well as sampling and analysis needs
3.2 Request required approvals and keep communication (operators, site managers, process engineers, budget holders and other possible end users) and health safety considerations
After a detailed plan and budget has prepared this should be approved by the water utility budget holders in the first instance. Depending on the water utility health and safety policy, any particular approvals, risk assessments etc., should be put in place and approved at this stage. Ordering of energy monitors/software and related analysis equipment etc. should be completed at this stage. Engagement groups should be created at various levels including operators, site managers, process engineers, budget holders and other possible end users to present the initiative and capture the professionals’ feedback. Communication with the various groups should be kept simple and effective in a suitable language for the target audience. The frequency of these meetings is important and to suggested at a later stage.

11
3.3 Create database describing all equipment on site
During this step it is vital to gain a full understanding of ALL the electrical equipment responsible for energy consumption/production on the WWTP. A full inventory should be created to ensure the pre‐identification of the equipment with highest energy consumption, which should be monitored during the assessment but also, it will provide valuable information for the validation of the data recorded. The inventory should identify the name of the equipment, location within the WWTP according to the stages identified in Figure 1, power requirement in kW and working hours. With the information collected it is possible to calculate the specific power consumption of each item of equipment (Equation 1)
Ep = P × T (Equation 1)
Where Ep is the specific power consumption in kWh, y, P the rated power of the electrical motor in kilowatt (kW) and T is the working hours in a day (h/day). A limitation of calculating the specific power consumption using Equation 1 is that the age of the equipment is not taken into consideration and some equipment were likely to be operating outside the best efficiency point. Hence, it is recommended that information such as age, maintenance schedule is also recorded. Table 3 can be used as a template for imputing the required information for this step.
Table 3. Template table for creating database describing all equipment on site
Name of the equipment
End use of equipment
Stage of treatment within the WWTP
Power requirement (kW)
Working hours
(h/day)
Specific power consumption
Age Maintenance schedule
3.4 Select equipment for online monitoring and install on‐line monitors according to manual
The highest energy consumption equipment should be monitored during the assessment according to the information collected in Table 2. It is recommended that the energy monitoring system is placed in such a way that allows for at least 90% of the total energy fluxes on the WWTP.
A final plan for the exact location of the energy monitoring systems should be now in place and a suitable schematic representation should be produced for operators, site managers, process engineers etc information as well as wider dissemination
The persons/external contractors should receive the appropriate training and have competence to install the energy monitoring systems at this stage as well as training of professionals to operate the analysis software. All monitors should be installed at the same time to achieve a complete overview of the WWTP energy fluxes. The manual for the installation of the Wellness energy monitoring systems can be found in annex, as an example.
3.5 Monitor site for KPIs (how often to monitor, methods used for monitoring)
A final plan for the sampling programme should be put in place to establish the samples to be collected and frequency (exact location in the WWTP, spot or composite sampling), identify persons/external contractor that will be responsible for the sample collection, identify parameters to be measured according to the KPIs in Table 1. It is recommended that only Standard Methods3 are used to achieve consistency amongst different WWTP and hence allow comparison of data.
3 APHA Standard Methods, Standard methods for the examination of water and wastewater, American Public Health Association/ American Water Works Association/ Water Environment Federation, Washington DC, USA., 1998

12
The frequency of the collection of samples is important. It is envisaged that the WTEI needs to be completed in a suitable timescale to respond to the water industry pressures. Ideally, the monitoring of the site should be completed within 1 week, but longer periods can be used to account for natural variations in WWTPs such as storm events, wastewater quality, temperature, etc.
The persons/external contractors should receive the appropriate training and have competence to complete the sampling and analysis work.
3.6 Training of people on the on‐line tool and audits
Energy audit is the general term used for a systematic procedure that aims to obtain adequate knowledge of the profile of the energy consumption of an industrial plant. One of the main aims of an energy audit is the configuration of energy baseline regarding the reference consumption or specific consumption with regard individual devices and installations (Table 4). With the use of these indices can be estimated energy consumption before and after the application of energy‐saving measure. Adequate analysis of energy data is therefore important in order to identify trends and areas for improvement. Table 5 contains information on the various stages for completing an energy audit.
3.7 National and international normative
UNI has established the minimum requirements of energy audit in the UNI‐CEI‐TR 11428:2011. The energy audit can be conducted by a specialist who also has knowledge of installation, heat transfer, and other techniques to evaluate the efficiency, such as an expert in energy management certificate in according to UNI CEI 11339. Various definitions can be found in Table 6.
Table 4. Stages for training energy auditors
Pre‐audit stage Define the purpose of the energy audit Training a team for the energy audit Estimate time and budget Collecting information about the plant
Energy audit stage Survey and measurements Analysis of the data collected Preparing the energy savings plans Detailed analysis of the opportunities for energy management proposal Preparation of the report on the energy audit
Post‐audit stage Implementation of energy management opportunities Monitoring and review

13
Table 5. Stages required for completing an energy audit.
Stage Task
1 – Analysis of useful data The main purpose is to evaluate the characteristics of the energy systems and the methods of use of energy for the industry. The modalities of energy use can be obtained from the compilation of bills relating to several years. Analysis of the historical variation of the utility bills allows the energy auditor to determine if there are seasonal and weather effects on energy consumption.
2 – Walk‐through survey Identify potential energy saving measures. The results of this phase are important as they determinate if the building/industry guarantees all further activities of energy auditing.
3 ‐ Baseline of energy use The main purpose of this phase is to develop a basic model that represents the existing energy consumption and the operating conditions of the building/industry.
4 – Evaluation of energy saving measures
In this phase determine a list of cost/benefit using both the energy savings and economical analysis.
5 – Report of energy audit The procedure of energy audit should be completed with the presentation of all proposals for energy savings in the form of technical‐economical report that is prepared by the auditor and presented to the leader of the structure.
Table 6. Definitions on energy audits according to UNI.
ESCo ESCo is defined as “Person or legal person that delivers energy services or other energy efficiency improvement measures in the facility of the users and accepts financial risk. Payment of the services delivered is based on energy efficiency improvement and on other agreed performance criteria.
UNI CEI 11352 Energy management – Companies providing energy services (ESCo) – General requirements and checklist for verification of requirements” is the Italian legislation establishing the minimum requirements for companies that want to play the role of ESCo. The standard outlines the minimum requirements for energy efficiency services and capabilities must posses in order to offer these activities to its customers. It is important have an expert in energy management in its staff.
UNI CEI 11339 Energy Management. Experts in energy management. General requirements for the qualification” is the standard that establishes the requirements for a person to become in expert in energy management.
UNI CEI EN 16231:2012 Defines the “Methodology benchmarking of energy efficiency. The normative defines requirements and gives recommendations on the methodology of benchmarking energy efficiency. The purpose of benchmarking is to identify key indicators of energy consumption.
UNI CEI EN ISO 50001:2011 “Energy management system – Requirements and guidelines for use” is the official Italian version of the ISO 150001
3.8 Audit, data collection and validation
For the energy audit methodology is possible follow the indication described on Technical Report UNI‐CEI‐TR 11420:2011 – Energy Management – Energy Diagnosis – General requirements of energetic diagnosis.

14
UNI‐CEI‐TR 11428 defines requirements, methodology and documentation for energy audits. The main tools of energy audit are:
1. Realization of energy flows; 2. Recovery of resources; 3. Identification of technologies for energy saving; 4. Optimization of energy supply contracts; 5. Management of technical and economic risks; 6. Improving the method of operation and maintenance.
It is important illustrate some important concepts before to describe the methodology (Table 7).
Table 7. Definition of concepts used to develop the energy audit methodology.
Balance flows Synthetic representation, possibly integrated with the diagram, able to highlight in a quantitative manner the flows of materials and energy input/output/processor within an energy system or part of it.
Reference consumption Consumption of energy system, measured or possibly calculated in a period of time and normalized via adjustment factors.
Adjustment factor Quantifiable magnitude that influences the energy consumption used to normalize and compare homogeneously consumption, period by period. Example: Climatic conditions, environmental conditions (temperature, light level..), variables related to the behaviour and user activity (work shifts, level of occupancy of building..), production level
Energetic inventory Analytical description of the distribution of consumption relative to the various energy vectors in the energy system. Note: the energy inventory is usually expressed through the census and the analytic quantification of energy use, equipment and their operating characteristics
Energetic system Organizations, company, urban settlement homogeneous (both civil and industrial), together with technological, organism, able to generate, manage or control a power demand, object of diagnosis
Energetic vectors Means to supply or produce energy locally
The energy audit is undertaken in order to make available a description of the situation of the global energy system under investigation, defining possible actions to improve energy efficiency and quantify the energy savings resulting.
Energy audit should have the following requirements:
1. Completeness: Energy system should include significant energy aspects; 2. Reliability: Real data must be acquired in number and quality needed to develop energy inventory of energy
system. Power consumption must be checked in line with the billing or with measurement equipment; 3. Traceability: an energy inventory should be identified and used, as well as adequate documentation on the
origin of data; 4. Utility: measures to improve energy efficiency should be identified and evaluated from a cost/benefit
analysis. 5. Verifiability: They must be identified elements that allow the customer to verify the achievement of
efficiencies resulting from the application of the proposed action.

15
3.9 Classify site according to WATER TREATMENT ENERGY INDEX (WTEI).
To be completed on the next methodology draft