h sn H igher u k.n et M athem atics - · PDF fileH igher M athem atics U nit 1 Ð Specim en...
17
Higher Mathematics HSN21510 This document was produced specially for the HSN.uk.net website, and we require that any copies or derivative works attribute the work to Higher Still Notes. For more details about the copyright on these notes, please see http://creativecommons.org/licenses/by-nc-sa/2.5/scotland/ hsn .uk.net UNIT 1 Specimen NAB Assessment
Transcript of h sn H igher u k.n et M athem atics - · PDF fileH igher M athem atics U nit 1 Ð Specim en...

Higher
Mathematics
HSN21510
This document was produced specially for the HSN.uk.net website, and we require that any copies or derivative works attribute the work to Higher Still Notes.
For more details about the copyright on these notes, please see http://creativecommons.org/licenses/by-nc-sa/2.5/scotland/
hsn .uk.net
UNIT 1
Specimen NAB Assessment

Higher Mathematics Unit 1 – Specimen NAB Assessment
Page 1 HSN21510 hsn.uk.net
UNIT 1
Specimen NAB Assessment
Outcome 1
1. A line passes through the points ( )A 4, 3− and ( )B 6,2− .
Find the equation of this line. 3
2. A line makes an angle of 40° with the positive direction of the x-axis, as shown in the diagram.
Find the gradient of this line. 1
3. (a) Write down the gradient of a line parallel to 4 1y x= + . 1
(b) Write down the gradient of a line perpendicular to 4 1y x= + . 1
Outcome 2
4. The diagram below shows part of the graph of ( )y f x= .
(a) Sketch the graph of ( )y f x= − . 1
(b) On a separate diagram, sketch the graph of ( )4y f x= + . 1
( )y f x=
2
y
3
O x
O 40°
y
x

Higher Mathematics Unit 1 – Specimen NAB Assessment
Page 2 HSN21510 hsn.uk.net
5. (a) The diagram below shows the curve siny x= ° and a related curve.
Write down the equation of the related curve. 1
(b) The diagram below shows the curve cosy x= ° and a related curve.
Write down the equation of the related curve. 1
6. The curve xy a= is shown in the diagram below.
Given that the curve passes through the point ( )1,3 , write down the
value of a. 1
7. The diagram below shows the graph of the function ( ) 2xf x = and its
inverse function.
Write down the formula for the inverse function. 1
O ( )2,1
2xy =
x
y
( )1,21
1
1
O
( )1,3
xy a=
x
y
360O x
y
1
1−
12
cosy x= °
12−
360O
y
x1−
3−
2−
1 siny x= °

Higher Mathematics Unit 1 – Specimen NAB Assessment
Page 3 HSN21510 hsn.uk.net
8. (a) Two functions f and g are defined by ( ) 3f x x= and ( ) 2 4g x x= − .
Find an expression for ( )( )f g x . 1
(b) Functions h and k are defined on suitable domains by ( ) 5h x x=
and ( ) tank x x= .
Find an expression for ( )( )k h x . 1
Outcome 3
9. Given that 5
3
3xy
x
−= for 0x ≠ , find
dy
dx. 4
10. The curve with equation 2 5 6y x x= − + is shown below.
Find the gradient of the tangent to the curve at the point ( )5,6 . 4
11. A curve has equation 3 213 4 12 3y x x x= − + − .
Find the stationary points on the curve and, using differentiation, determine their nature. 8
Outcome 4
12. A pond is treated weekly with a chemical to ensure that the number of bacteria is kept low. It is estimated that the chemical kills 68% of all bacteria. Between the weekly treatments, it is estimated that 600 million new bacteria appear. There are nu million bacteria at the start of a
particular week.
(a) Write down a recurrence relation for 1nu + , the number of millions of
bacteria at the start of the next week. 1
(b) Find the limit of the sequence generated by this recurrence relation and explain what the limit means in the context of this question. 3
O
( ) 5, 62 5 6y x x= − +
x
y

Higher Mathematics Unit 1 – Specimen NAB Assessment
Page 4 HSN21510 hsn.uk.net
( )y f x= −
2 x
y
O
3−
( )4y f x= +
2−
y
( ) 4, 3−
O x
Marking Instructions Pass Marks
Outcome 1 Outcome 2 Outcome 3 Outcome 4
4
6 6
8 11
16 3
4
Outcome 1 – Straight Lines
1. ( )
12
2 3
6 45
10
m− −
=− −
=−
= −
!
!
( )122 6
2 4 6
2 2 0
y x
y x
x y
− = − +
− = − −
+ + =
! Use gradient formula
Calculate gradient
Equation of line
3
2. tan40
0·84 (to 2 d.p.)
m = °
= !
Calculate gradient
1
3. (a) 4 ! State gradient 1
(b) 14 − ! State gradient 1
Outcome 2 – Functions and Graphs 4. (a) Sketch showing images
of given points
1
(b) Sketch showing images of given points
1

Higher Mathematics Unit 1 – Specimen NAB Assessment
Page 5 HSN21510 hsn.uk.net
5. (a) sin 2 y x= ° − Identify equation 1
(b) 12 cos y x= ° Identify equation 1
6. Since 3y = when 1x = : 1 3
3
a
a
=
=
State the value of a
1
7. ( )12log f x x− = State formula for inverse 1
8. (a) ( )( ) ( )
( )3
2 4
2 4
f g x f x
x
= −
= −
Expression for composite function
1
(b) ( )( ) ( )5
tan5
k h x k x
x
=
=
Expression for composite function 1
Outcome 3 – Differentiation
9. 5
3 3
2 3
4
3
3
2 9
xy
x x
x x
dyx x
dx
−
−
= −
= −
= +
Simplify first term
Simplify second term
Differentiate first term
Differentiate second term 4
10. Gradient of tangent is given by dy
dx
2 5 dy
xdx
= −
At 5x = , 2 5 5
5
m = × −
=
Know to differentiate
Differentiate
Know to evaluate derivative
Calculate gradient
4

Higher Mathematics Unit 1 – Specimen NAB Assessment
Page 6 HSN21510 hsn.uk.net
11. 2 8 12dy
x xdx
= − +
Stationary points exist where 0dy
dx=
( )( )
2 8 12 0
6 2 0
2 or 6
x x
x x
x x
− + =
− − =
= =
To find y-coordinates: At 6x = , ( ) ( ) ( )3 21
3 6 4 6 12 6 3
3
y = − + −
= −
At 2x = , ( ) ( ) ( )3 213
23
2 4 2 12 2 3
7
y = − + −
=
Stationary points are at ( )232,7 and ( )6, 3−
sketch
2 6
0 0dy
dx
x → → →
+ − +
( )232,7 is a maximum turning point !
( )6, 3− is a minimum turning point !
Know to differentiate
Differentiate
Set derivative equal to 0
Find x-coordinates of stationary points
Find y-coordinates of stationary points
Method to determine nature
Nature of one stationary point
Nature of second stationary point
8
Outcome 4 – Sequences 12. (a) 1
.0 32 600n nu u+ = + State recurrence relation 1
(b) A limit l exists since .1 0 32 1− < < 600
1 0.32.882 35 (to 2 d.p.)
l =−
=
In the long term, the number of bacteria will settle around 882 million !
Know how to calculate limit
Calculate limit
Interpret limit
3

Practice Assessment (1) Unit 1 - Mathematics 1 (H)
! Pegasys 2003 Outcome 2./ Cont'd.
Outcome 1 Marks
1. A line passes through the points (2,-7) and (6,1).
Find the equation of this line. (3)
2. A line makes an angle of 50o with the
positive direction of the x-axis, as shown
in the diagram, where the scales on the
axes are equal.
Find the gradient of the line. (1)
3. (a) Write down the gradient of any line parallel to 32
1 += xy . (1)
(b) Write down the gradient of a line perpendicular to 13 !!= xy . (1)
Outcome 2
4. See worksheet.
Diagrams 1 and 2 on the worksheet show part of the graph of )(xfy = .
(a) On Diagram 1, draw the graph of )(xfy != . (1)
(b) On Diagram 2, draw the graph of )4( += xfy . (1)
5. (a) The diagrams below show part of the graph of oxy sin= and the graph of a
related function. Write down the equation of the related function.
(1)
(b) The diagram shows part of the graph
of oxy sin= (drawn as a broken line)
and the graph of a related function.
Write down the equation of the
related graph.
(1)
x
y
o50
o
x
y
o 90 180 270 360
-1
-2
x
y
1
-1
o 90 180 270 360
oxy sin=
x
y
1
-1
o 90 180 270 360

! Pegasys 2003
6. See worksheet.
The graph of xy 2= is shown in Diagram 3 on the worksheet.
Write down the equation of the graph of the exponential function of the formxay = which passes through the point (2,9) as shown on the worksheet. (1)
7. See worksheet.
Diagram 4 on the worksheet shows part of the graph of the function xy 6= and
its inverse function.
Write down the equation of the inverse function. (1)
8. (a) Two functions f and g are given by 1)( 2!= xxf and 13)( != xxg .
Obtain an expression for ( ))(xgf . (1)
(b) Functions h and k, defined on suitable domains, are given by xxh 4)( = and
xxk cos)( = . Find ( ))(xhk . (1)
Outcome 3
9. Given 2
41
x
xy
+= , find
dx
dy. (4)
10. The diagram shows a sketch of the curve
with equation 862
+!= xxy with a tangent
drawn at the point (5,3).
Find the gradient of this tangent.
(4)
11. Find the coordinates of the stationary points of the curve with equation 13
3
1 +!= xxy .
Using differentiation determine their nature. (8)
Outcome 4
12. In a small colony 20% of the existing insects are eaten by predators each day, however during
the night 400 insects are hatched. There are Un insects at the start of a particular day.
(a) Write down a recurrence relation for Un+1, the number of insects at the start
of the next day. (1)
(b) Find the limit of the sequence generated by this recurrence relation and explain
what the limit means in the context of this question. (3)
(5,3)
x
y
o
862
+!= xxy

Unit 1 - Practice Assessment (1) Worksheet for Questions 4, 6 and 7
! Pegasys 2003
Name : __________________________ Class : ________
Question 4
Diagram 1 Diagram 2
Question 6
The equation of the graph passing
through (2,9) is ........
............................=y
Diagram 3
Question 7
The equation of the graph passing
through (1,0) is
................................................
Diagram 4
x
y
o 1
(8,0)
(4,-6)
3
x
y
o 1
(8,0)
(4,-6)
3
(2,9)
(2,4)
x
y
o 1 2 3-1
2
4
6
8
10
x
y
o
(0,1)
(1,0)
xy 6=
xy 2=

Practice Assessment (2) Unit 1 - Mathematics 1 (H)
! Pegasys 2003 Outcome 2./ Cont'd.
Outcome 1 Marks
1. A line passes through the points (-1,3) and (-4,2).
Find the equation of this line. (3)
2. A line makes an angle of 75o with the
positive direction of the x-axis, as shown
in the diagram, where the scales on the
axes are equal.
Find the gradient of the line. (1)
3. (a) Write down the gradient of any line parallel to 2!!= xy . (1)
(b) Write down the gradient of a line perpendicular to 12
3 != xy . (1)
Outcome 2
4. See worksheet.
Diagrams 1 and 2 on the worksheet show part of the graph of )(xfy = .
(a) On Diagram 1, draw the graph of )(xfy != . (1)
(b) On Diagram 2, draw the graph of )4( != xfy . (1)
5. (a) The diagrams below show part of the graph of oxy sin= and the graph of a
related function. Write down the equation of the related function.
(1)
(b) The diagram shows part of the graph
of oxy sin= (drawn as a broken line)
and the graph of a related function.
Write down the equation of the
related graph.
(1)
x
y
o75
o
y
xo 90 180 270 360
1
2
x
y
1
-1
o 90 180 270 360
oxy sin=
x
y
1
-1
o 90 180 270 360

! Pegasys 2003
6. See worksheet.
The graph of xy 3= is shown in Diagram 3 on the worksheet.
Write down the equation of the graph of the exponential function of the formxay = which passes through the point (1,6) as shown on the worksheet. (1)
7. See worksheet.
Diagram 4 on the worksheet shows part of the graph of the function xy 7= and
its inverse function.
Write down the equation of the inverse function. (1)
8. (a) Two functions f and g are given by 22)( xxf = and 1)( += xxg .
Obtain an expression for ( ))(xgf . (1)
(b) Functions h and k, defined on suitable domains, are given by xxh sin)( = and
xxk2
1)( = . Find ( ))(xhk . (1)
Outcome 3
9. Given 3
42
x
xy
+= , find
dx
dy. (4)
10. The diagram shows a sketch of the curve
with equation 24102
+!= xxy with a tangent
drawn at the point (7,3).
Find the gradient of this tangent.
(4)
11. Find the coordinates of the stationary points of the curve with equation xxxy 423
3
2 !+= .
Using differentiation determine their nature. (8)
Outcome 4
12. In a small rabbit colony one eighth of the existing rabbits are eaten by predators each
summer, however during the winter 24 rabbits are born.
There are Un rabbits at the start of a particular summer.
(a) Write down a recurrence relation for Un+1, the number of rabbits at the start
of the next summer. (1)
(b) Find the limit of the sequence generated by this recurrence relation and explain
what the limit means in the context of this question. (3)
(7,3)
x
y
o
24102
+!= xxy
Unit 1 - Practice Assessment (2) Worksheet for Questions 4, 6 and 7
! Pegasys 2003
Name : __________________________ Class : ________
Question 4
Diagram 1 Diagram 2
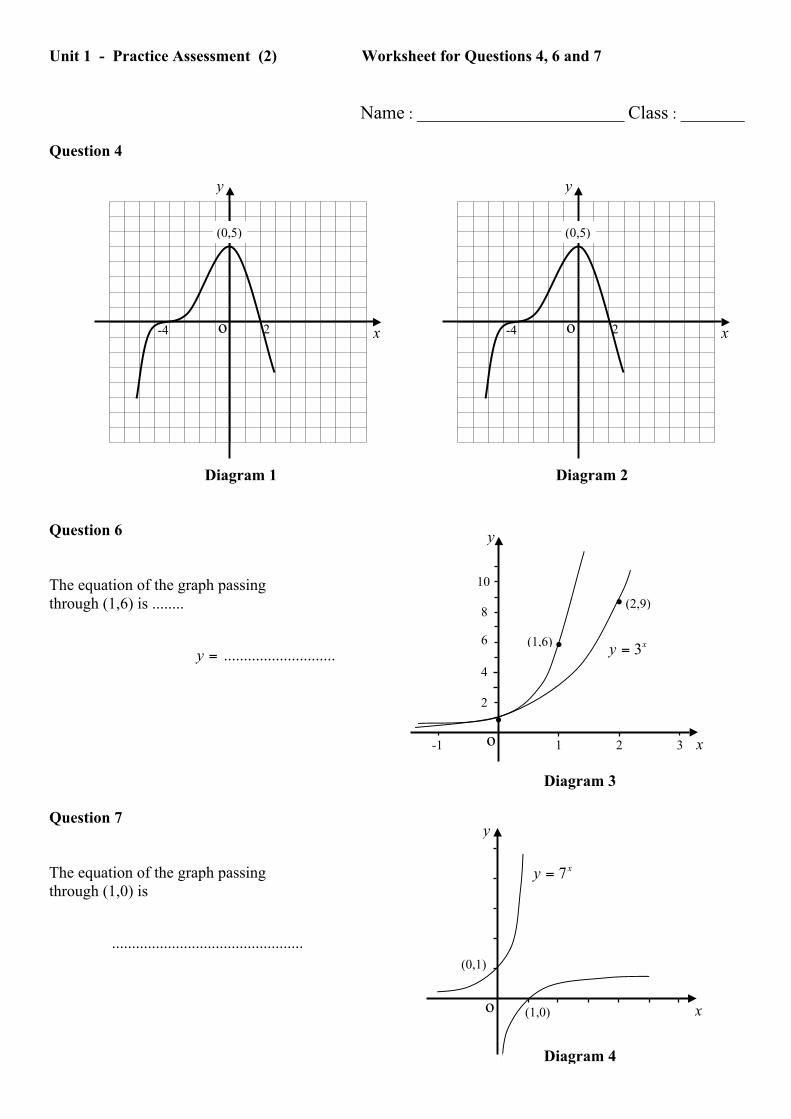
Question 6
The equation of the graph passing
through (1,6) is ........
............................=y
Diagram 3
Question 7
The equation of the graph passing
through (1,0) is
................................................
Diagram 4
(2,9)
(1,6)
x
y
o 1 2 3-1
2
4
6
8
10
.
..
x
y
o
(0,1)
(1,0)
xy 7=
xy 3=
x
y
o-4
(0,5)
2 x
y
o-4
(0,5)
2

Practice Assessment (3) Unit 1 - Mathematics 1 (H)
! Pegasys 2003 Outcome 2./ Cont'd.
Outcome 1 Marks
1. A line passes through the points (4,-4) and (2,6).
Find the equation of this line. (3)
2. A line makes an angle of 40o with the
positive direction of the x-axis, as shown
in the diagram, where the scales on the
axes are equal.
Find the gradient of the line. (1)
3. (a) Write down the gradient of any line parallel to 94
3 +!= xy . (1)
(b) Write down the gradient of a line perpendicular to 2!!= xy . (1)
Outcome 2
4. See worksheet.
Diagrams 1 and 2 on the worksheet show part of the graph of )(xfy = .
(a) On Diagram 1, draw the graph of )(xfy != + 2. (1)
(b) On Diagram 2, draw the graph of )3( != xfy . (1)
5. (a) The diagrams below show part of the graph of oxy sin= and the graph of a
related function. Write down the equation of the related function.
(1)
(b) The diagram shows part of the graph
of oxy sin= (drawn as a broken line)
and the graph of a related function.
Write down the equation of the
related graph.
(1)
x
y
o
y
xo 90 180 270 360
1
3
x
y
1
-1
o 90 180 270 360
oxy sin=
x
y
1
-1
o 90 180 270 360
40o
-1
2
careful !

! Pegasys 2003
6. See worksheet.
The graph of xy 5= is shown in Diagram 3 on the worksheet.
Write down the equation of the graph of the exponential function of the formxay = which passes through the point (1,2) as shown on the worksheet. (1)
7. See worksheet.
Diagram 4 on the worksheet shows part of the graph of the function xy 3= and
its inverse function.
Write down the equation of the inverse function. (1)
8. (a) Two functions f and g are given by xxxf +=2)( and 13)( += xxg .
Obtain an expression for ( ))(xgf . (1)
(b) Functions k and h, defined on suitable domains, are given by xxk cos)( = and
)2()( !+= xxh . Find ( ))(xhk . (1)
Outcome 3
9. Given 4
63
x
xy
+= , find
dx
dy. (4)
10. The diagram shows a sketch of the curve
with equation 35122
+!= xxy with a tangent
drawn at the point (4,3).
Find the gradient of this tangent.
(4)
11. Find the coordinates of the stationary points of the curve with equation 159323
+!!= xxxy .
Using differentiation determine their nature. (8)
Outcome 4
12. For an established ant hill 6% of the worker ants fail to return at the end of each day.
However, during the night 540 worker ants are hatched.
There are Un worker ants at the start of a particular day.
(a) Write down a recurrence relation for Un+1, the number of worker ants at the start
of the next day. (1)
(b) Find the limit of the sequence generated by this recurrence relation and explain
what the limit means in the context of this question. (3)
.(4,3)
x
y
o
35122
+!= xxy

Unit 1 - Practice Assessment (3) Worksheet for Questions 4, 6 and 7
! Pegasys 2003
Name : __________________________ Class : ________
Question 4
Diagram 1 Diagram 2
Question 6
The equation of the graph passing
through (1,2) is ........
............................=y
Diagram 3
Question 7
The equation of the graph passing
through (1,0) is
................................................
Diagram 4
(1,2)
(1,5)
x
y
o 1 2 3-1
2
4
6
8
10
.
.
.
x
y
o
(0,1)
(1,0)
xy 3=
xy 5=
x
y
o-5
(-3,4)
1
(3,-3)
5
1
x
y
o-5
(-3,4)
1
(3,-3)
5
1

Unit 1 - Practice Assessments Answers
! Pegasys 2003
Practice Assessment 1
Outcome 1 : 1. ))2(27)6(21(112,2 !=+!=!!== xyorxyxym
2. 191!=m 3. (a)2
1=m (b)3
1=m
Outcome 2 : 4. (a) diagram (reflection in x-axis) (b) diagram (translated 4 units left)
5. (a) 1sin !=oxy (b)
oxy 3sin= 6.
xy 3= 7. xy 6log=
8. (a) xxxxgf 691)13())(( 22!"!!= (b) xxhk 4cos))(( =
Outcome 3 : 9. xxdx
dy22
3+!=
!10. 4=m 11. min,),1(,max,),1(
3
1
3
5!
Outcome 4 : 12. (a) 400801
+!=+ nnUU (b) 2000=L , + explanation
Practice Assessment 2
Outcome 1 : 1. ))4(2)1(3(103,3
1
3
1
3
1 +=!+=!+== xyorxyxym
2. 733 !=m 3. (a) 1!=m (b)3
2!=m
Outcome 2 : 4. (a) diagram (reflection in x-axis) (b) diagram (translated 4 units right)
5. (a) 1sin +=oxy (b)
oxy 4sin= 6.
xy 6= 7. xy 7log=
8. (a) 242)1(2))(( 22++!+= xxxxgf (b) xxhk sin))((
2
1=
Outcome 3 : 9.4
61!
!= xdx
dy10. 4=m 11. min,)2,1(,max,)6,2(
3
1
3
2 !!
Outcome 4 : 12. (a) 248
7
1+=+ nn
UU (b) 192=L , + explanation
Practice Assessment 3
Outcome 1 : 1. ))2(56)4(54(165,5 !!=!!!=++!=!= xyorxyxym
2. 840 !=m 3. (a)4
3!=m (b) 1=m
Outcome 2 : 4. (a) diagram (reflection in x-axis then up 2) (b) diagram (translated 3 units right)
5. (a) 1sin2 +=oxy (b)
oxy
2
1sin= 6.
xy 2= 7. xy 3log=
8. (a) 29913)13())(( 22++!+++= xxxxxgf (b) )2cos())(( !+= xxhk
Outcome 3 : 9. xxdx
dy212
5+!=
!10. 4!=m 11. min,)12,3(,max,)20,1( !!
Outcome 4 : 12. (a) 5409401
+!=+ nnUU (b) 9000=L , + explanation