G:VOL 1 97CLAYCLAYS97 · clay and shale); J.M. Huber Corp. (kaolin); and Livelite Corp. ... with...
28
U.S. GEOLOGICAL SURVEY—MINERALS INFORMATION—1997 1 CLAYS By Robert L. Virta The amount of clay sold or used by domestic producers decreased less than 1% of U.S. clay output was from underground mines. All slightly to 42 million metric tons valued at $1.67 billion in 1997. of the underground production was in Ohio, where the clays are Production of ball clay, bentonite, fire clay, and kaolin increased mainly underclays associated with coal. while production of common clay and fuller’s earth decreased. Domestic production data for clays were developed by the U.S. Common clays accounted for 58% of the tonnage and kaolin Geological Survey from a voluntary survey of U.S. operations. Of accounted for 62% of the value of clays produced in 1997. Imports the 681 survey forms issued, 481 were completed, representing 71% of all clay types increased to 63,700 tons valued at $23.2 million. of the total clay and shale production sold or used shown in table 1. Exports increased to 5.08 million tons valued at $860 million. (See table 1.) Legislation and Government Programs Clay mining has an environmental impact because of the disturbance to the land. Overburden is moved and clays are removed, leaving a depression or pit. State laws usually require leveling or recontouring of the disturbed area and planting trees or grasses to prevent or minimize erosion. For processing, the impoundment of slimes and dust control are usually required. The rules for disposal of coarse tailings are similar to or included within those laws governing reclamation of the mined area. An issue that has recently arisen concerns dioxins in ball clay deposits. The dioxins were brought to the attention of the Food and Drug Administration when elevated levels of dioxins were detected States. (See table 3.) in poultry. The source was traced to ball clay, which was used as a United Clays Inc. reported the installation of new blending and flow control agent in the chicken feed. No apparent anthropogenic processing equipment at their facility in Huntingburg, IN. Beside sources for the dioxins in the ball clay were detected. Studies processing ball clay, the facility also handles talc from the company’s currently are underway to determine if the dioxin could have Texas operation and recycled tile from nearby tile plants (Watts occurred naturally (Food and Drug Administration, 1997). Blake Bearne & Co. PLC, WBB report and accounts 1997, accessed Production quarries in 10 States. Six producers were large, diversified firms Approximately 240 companies operating 766 clay pits or quarries reported production in 1997; of these, 21 companies, many with multiple operations, accounted for approximately 50% of the tonnage and 74% of the value for all types of clay produced and sold or used. Clay production was reported in most States except Alaska, Delaware, Hawaii, Rhode Island, Vermont, and Wisconsin, and the District of Columbia and Puerto Rico. (See table 2.) and California. The 10 leading producer States, in descending order of tonnage, Production of swelling bentonite increased to 3.63 million tons were Georgia, Wyoming, Alabama, North Carolina, Texas, Missouri, valued at $156 million. Wyoming led all States in the production of South Carolina, Ohio, California, and Tennessee. The 10 leading swelling bentonite, followed by Montana, Utah, California, Oregon, producing companies, in decreasing order of production, were Engelhard Corp. (fuller’s earth and kaolin); American Colloid Co. (bentonite and fuller’s earth); ECC International (kaolin); General Shale Products Corp. (common clay and shale); Holnam Inc. (common clay and shale); Thiele Kaolin Co. (kaolin); Dry Branch Kaolin Co. (kaolin); Solite Div., Big River Industries Inc. (common clay and shale); J.M. Huber Corp. (kaolin); and Livelite Corp. (common clay and shale). Most clay mining in the United States was by open pit methods; Production data for the nonrespondents were estimated from reported prior-year production levels adjusted by trends in the industry and other guidelines. Ball Clay.—Six companies mined ball clay in 1997 from 32 quarries in 5 States. Two of the producers were large, diversified firms with widespread foreign and domestic mineral interests. Production of domestic ball clay increased to 1.04 million tons valued at $48.1 million. Tennessee supplied 63% of the Nation’s output, followed by, in descending order of production, Kentucky, Texas, Mississippi, and Missouri. Although the data are withheld, production increased in Kentucky, Mississippi, and Texas and decreased in Missouri and Tennessee. Water-slurried ball clay was produced only in Tennessee. Air-float ball clay was produced in Kentucky, Mississippi, and Tennessee. Unprocessed clay was mined and then sold or used from mines in all five ball-clay-producing June 30, 1998, at URL http://www.wbb.co.uk/ page9.htm). Bentonite.—Eighteen companies produced bentonite from 57 with international mineral operations or interests in other types of clay in the United States. The quantity and value of all varieties of bentonite sold or used decreased to 4.02 million tons valued at $169 million. Production of nonswelling bentonite decreased to 397,000 tons valued at $13.5 million. Alabama led all States in the production of nonswelling bentonite, followed by Mississippi, Arizona, Texas, Utah, Nevada, Nevada, and Texas. (See table 5.) American Colloid announced plans to build a blending plant in Indiana. The plant will produce custom blends of bentonite and other components for the foundry industry (European Chemical News, 1997). Basic Resources Corp. has received most of the permits necessary to begin mining a calcium bentonite near Ephrata, WA. The deposit consists of a sequence of bentonite beds between basalt layers. Reserves are estimated to exceed 9 million tons. Production will be
Transcript of G:VOL 1 97CLAYCLAYS97 · clay and shale); J.M. Huber Corp. (kaolin); and Livelite Corp. ... with...
U.S. GEOLOGICAL SURVEY—MINERALS INFORMATION—1997 1
CLAYSBy Robert L. Virta
The amount of clay sold or used by domestic producers decreased less than 1% of U.S. clay output was from underground mines. Allslightly to 42 million metric tons valued at $1.67 billion in 1997. of the underground production was in Ohio, where the clays areProduction of ball clay, bentonite, fire clay, and kaolin increased mainly underclays associated with coal.while production of common clay and fuller’s earth decreased. Domestic production data for clays were developed by the U.S.Common clays accounted for 58% of the tonnage and kaolin Geological Survey from a voluntary survey of U.S. operations. Ofaccounted for 62% of the value of clays produced in 1997. Imports the 681 survey forms issued, 481 were completed, representing 71%of all clay types increased to 63,700 tons valued at $23.2 million. of the total clay and shale production sold or used shown in table 1.Exports increased to 5.08 million tons valued at $860 million. (Seetable 1.)
Legislation and Government Programs
Clay mining has an environmental impact because of thedisturbance to the land. Overburden is moved and clays areremoved, leaving a depression or pit. State laws usually requireleveling or recontouring of the disturbed area and planting trees orgrasses to prevent or minimize erosion. For processing, theimpoundment of slimes and dust control are usually required. Therules for disposal of coarse tailings are similar to or included withinthose laws governing reclamation of the mined area.
An issue that has recently arisen concerns dioxins in ball claydeposits. The dioxins were brought to the attention of the Food andDrug Administration when elevated levels of dioxins were detected States. (See table 3.)in poultry. The source was traced to ball clay, which was used as a United Clays Inc. reported the installation of new blending andflow control agent in the chicken feed. No apparent anthropogenic processing equipment at their facility in Huntingburg, IN. Besidesources for the dioxins in the ball clay were detected. Studies processing ball clay, the facility also handles talc from the company’scurrently are underway to determine if the dioxin could have Texas operation and recycled tile from nearby tile plants (Wattsoccurred naturally (Food and Drug Administration, 1997). Blake Bearne & Co. PLC, WBB report and accounts 1997, accessed
Production quarries in 10 States. Six producers were large, diversified firms
Approximately 240 companies operating 766 clay pits or quarriesreported production in 1997; of these, 21 companies, many withmultiple operations, accounted for approximately 50% of the tonnageand 74% of the value for all types of clay produced and sold or used.Clay production was reported in most States except Alaska,Delaware, Hawaii, Rhode Island, Vermont, and Wisconsin, and theDistrict of Columbia and Puerto Rico. (See table 2.) and California.
The 10 leading producer States, in descending order of tonnage, Production of swelling bentonite increased to 3.63 million tonswere Georgia, Wyoming, Alabama, North Carolina, Texas, Missouri, valued at $156 million. Wyoming led all States in the production ofSouth Carolina, Ohio, California, and Tennessee. The 10 leading swelling bentonite, followed by Montana, Utah, California, Oregon,producing companies, in decreasing order of production, wereEngelhard Corp. (fuller’s earth and kaolin); American Colloid Co.(bentonite and fuller’s earth); ECC International (kaolin); GeneralShale Products Corp. (common clay and shale); Holnam Inc.(common clay and shale); Thiele Kaolin Co. (kaolin); Dry BranchKaolin Co. (kaolin); Solite Div., Big River Industries Inc. (commonclay and shale); J.M. Huber Corp. (kaolin); and Livelite Corp.(common clay and shale).
Most clay mining in the United States was by open pit methods;
Production data for the nonrespondents were estimated from reportedprior-year production levels adjusted by trends in the industry andother guidelines.
Ball Clay.—Six companies mined ball clay in 1997 from 32quarries in 5 States. Two of the producers were large, diversifiedfirms with widespread foreign and domestic mineral interests.
Production of domestic ball clay increased to 1.04 million tonsvalued at $48.1 million. Tennessee supplied 63% of the Nation’soutput, followed by, in descending order of production, Kentucky,Texas, Mississippi, and Missouri. Although the data are withheld,production increased in Kentucky, Mississippi, and Texas anddecreased in Missouri and Tennessee. Water-slurried ball clay wasproduced only in Tennessee. Air-float ball clay was produced inKentucky, Mississippi, and Tennessee. Unprocessed clay was minedand then sold or used from mines in all five ball-clay-producing
June 30, 1998, at URL http://www.wbb.co.uk/ page9.htm).Bentonite.—Eighteen companies produced bentonite from 57
with international mineral operations or interests in other types ofclay in the United States.
The quantity and value of all varieties of bentonite sold or useddecreased to 4.02 million tons valued at $169 million. Production ofnonswelling bentonite decreased to 397,000 tons valued at $13.5million. Alabama led all States in the production of nonswellingbentonite, followed by Mississippi, Arizona, Texas, Utah, Nevada,
Nevada, and Texas. (See table 5.)American Colloid announced plans to build a blending plant in
Indiana. The plant will produce custom blends of bentonite andother components for the foundry industry (European ChemicalNews, 1997).
Basic Resources Corp. has received most of the permits necessaryto begin mining a calcium bentonite near Ephrata, WA. The depositconsists of a sequence of bentonite beds between basalt layers.Reserves are estimated to exceed 9 million tons. Production will be

2 U.S. GEOLOGICAL SURVEY—MINERALS INFORMATION—1997
approximately 36,000 tons per year, mainly for the production of Kaolin production in Georgia was 8.30 million tons valued at $981agricultural pellets (North American Minerals News, 1997f). million. Approximately 56% of the production was sold as water-
Common Clay and Shale.—One hundred and seventy-four firmsproduced common clay and shale from 454 pits in 42 States and (10%), and unprocessed (2%). (See table 16.) Production in SouthPuerto Rico in 1997. Most of these companies also were Carolina was 447,000 tons valued at $29 million, most of which wasmanufacturers of structural clay products such as clay pipe, drain tile,and sewer pipe; lightweight aggregates; and cement. More than 90%of the total production is used by the producer itself to manufacturestructural clay products, aggregate, and cement or for civilengineering applications.
Domestic sales or use of common clay and shale increased to 24.5million tons, valued at $149 million. The major producing Stateswere Alabama, North Carolina, Texas, Georgia, Ohio, SouthCarolina, Missouri, Arkansas, Indiana, and California, in descendingorder of tonnage. (See table 7.) company also will build a slurry plant in Wisconsin Rapids, WI.
Fire Clay.—Fire clay producers were mostly refractoriesmanufacturers that used the clays in firebrick and other refractories.Forty-nine quarries were operated in 1997 by 17 firms in 6 States.
Fire clay sold or used by domestic producers increased to 649,000tons valued at $9.45 million. Ohio was the leading producing State,followed by Missouri, California, Alabama, Kentucky, and NewMexico. (See table 9.)
Fuller’s Earth.—Seventeen companies produced fuller’s earthfrom 30 quarries in 12 States. Ten of the mines were in theattapulgite-type fuller’s earth areas of Florida and Georgia; these twoStates accounted for all of the domestic attapulgite production. Mostproducers were small, independent firms, but five were large,diversified corporations with international mineral interests.
Production of fuller’s earth decreased to 2.37 million tons valuedat $255 million. Production of attapulgite-type fuller’s earth was707,000 tons valued at $90 million in 1997. Over one-half of thisproduction came from Georgia, followed by Florida and Nevada.Production in Nevada was of sepiolite-type fuller’s earth.
Production of montmorillonite-type fuller’s earth was 1.66 milliontons valued at $165 million. Montmorillonite-type fuller’s earth wasproduced in Mississippi, Illinois, Missouri, California, Georgia,Florida, Kansas, Virginia, Tennessee, Texas, and Utah, in decreasingorder of production. (See table 11.)
Engelhard Corp. finalized its purchase of the Floridin Co. fromU.S. Borax Inc. Engelhard has shifted its sorbent granularattapulgite production from its Attapulgus, GA plant to Floridin’sQuincy, FL plant. Engelhard will continue to produce slurryproducts at its Attapulgite plant. As part of the sale of Floridin, ITCInc. acquired the Floridin product line and trademarks. LimeMountain Co. purchased Industrial Mineral Ventures (IMV), adivision of Floridin. IMV produces sepiolite, bentonite, and saponitefrom mines in Nevada (Chemical Week, 1997; North AmericanMinerals News, 1997c). decline. (See table 6.)
Kaolin.—Thirty firms mined kaolin from 120 quarries in 11States. Domestic production was 9.41 million tons valued at $1.04billion. Georgia was the largest kaolin producer, followed by SouthCarolina, Alabama, Arkansas, California, North Carolina, Florida,Texas, Nevada, Tennessee, and Pennsylvania, in decreasing order ofproduction. (See table 13.)
Approximately 50% of the kaolin produced was water-washed,followed by calcined (18%), delaminated (15%), airfloat (14%), andunprocessed kaolin (3%). (See table 14.) Production of low-temperature (pigment) and high-temperature (refractory) calcinedkaolin was 784,000 and 909,000 tons, respectively. (See table 15.)
washed, followed by delaminated (17%), calcined (15%), airfloat
airfloat or unprocessed. (See table 18.) Engelhard Corp. increased capacity on its hydrous kaolin
processing line at its middle Georgia facility. The expansion is partof a 4-year, $142 million program designed to improve its kaolin-based paper coatings business (Chemical Market Reporter, 1997).
Thiele Kaolin Co. began construction of a new calciner at itsSandersville, GA plant. The new calcining facility will increase thecompany’s calcining capacity to 100,000 tons per year. The calcinedproducts will be destined primarily for the paper industry. The
Initial output will be 100 tons per day and the plant will servesurrounding paper mills (North American Minerals News, 1997g).
Nord Resources Corp. sold its subsidiary, Nord Kaolin Co., to DryBranch Kaolin Co. With the purchase, Dry Branch acquired 31million tons of kaolin reserves in Georgia, gained access to Nord’sNorplex hybrid pigment products, and added an additional 300,000-ton-per-year capacity to its own existing capacity of 1.2 to 1.3million tons per year of water washed and calcined kaolin (IndustrialMinerals, 1997g).
Cytec Industries Inc. sold its kaolin reserves and calcining facilityin Georgia to GEO Specialty Chemicals Inc. The reserves, locatednear Andersonville, GA, include 30 million tons of kaolin, bauxiticclay, and bauxite. The calcining facility has a capacity of 146,000tons per year. The products are used for alum manufacture, high andlow alumina refractories, and paint fillers (Industrial Minerals,1997c).
Consumption
Ball Clay.—The principal domestic ball clay markets were floorand wall tile, pottery, and sanitaryware. (See table 4.) Consumptionincreased approximately 11% in 1997. The largest increases werein sales for floor and wall tile. Increases in ball clay sales for the past4 to 5 years have resulted from the expanding home building marketwith its demands for sanitaryware and tile.
Bentonite.—Major markets for bentonite were drilling mud,foundry sand, iron ore pelletizing, and pet waste absorbents.Consumption increased about 7% in 1997, mainly on the strength ofsales for animal feed, civil engineering and sealing, drilling mud,filtering and clarifying of oils and greases, foundry sand, and paintmarkets. Total sales of bentonite for iron ore pelletizing (domesticand export) were 590,000 tons versus 685,000 tons in 1996, a 14%
With regard to the sales of swelling versus nonswelling bentonite,most of the data were concealed to avoid disclosing companyproprietary data. More than 95% of the bentonite sold for pet wasteabsorbent and more than 90% for adhesives applications was theswelling variety. For animal feed applications, more than 80% ofbentonite sold was the swelling variety. Approximately two-thirdsof the bentonite sold for ceramics was swelling bentonite andessentially all of the bentonite used in drilling mud applications wasthe swelling variety. Swelling bentonite accounted for almost 90%of the bentonite sold for filler and extender applications. More thantwo-thirds of the bentonite sold for foundry sand applications was
U.S. GEOLOGICAL SURVEY—MINERALS INFORMATION—1997 3
swelling bentonite. Most of the bentonite sold for filtering, for adhesive, asphalt tile, cement, drilling mud, gypsum products,clarifying, and decolorizing applications was of the nonswelling paint, tile, and miscellaneous refractories and less than 20% ofvariety. Bentonite sold for pelletizing iron ore was exclusively animal feed sales. More than 75% of the fertilizer sales wereswelling bentonite. More than 90% of the bentonite used for civil attapulgite. More than one-half of the fuller’s earth used as pesticideengineering, waterproofing and sealing was swelling bentonite. The carriers was montmorillonite and most of the fuller’s earth sold formajor domestic uses for swelling bentonite were drilling mud, filtering, clarifying, and decolorizing oils and greases was attapulgite.foundry sand, pet waste absorbent, iron ore pelletizing,waterproofing and sealing, and animal feed, in decreasing order ofconsumption. Major export markets were in foundry sand, drillingmud, and iron ore pelletizing applications. The major domestic usesfor nonswelling bentonite were in foundry sand, filtering, clarifying,and decolorizing of oils and greases, miscellaneous civil engineeringapplications, animal feed, absorbents, and drilling mud, in decreasingorder of consumption. Exports were limited to foundry sand.
Common Clay and Shale.—Common clay was used mostfrequently in the manufacture of heavy clay products such as buildingbrick, flue linings, sewer pipe, drain tile, structural tile, and terracotta; portland cement clinker; and lightweight aggregate. (See table market for kaolin from South Carolina was rubber, followed by8.) Consumption of common clay and shale decreased about 6% in1997. The largest losses were made in sales for civil engineeringand sealing, cement, and miscellaneous heavy clay products.
Fire Clay.—Fire clays were used in refractory products such asfirebrick and block, grogs and calcines, high-alumina brick andspecialties, saggers, refractory mortars and mixes, and ramming and Absorbent Uses.—Absorbent uses for clays were about 2.44gunning mixes. Fire clays also were used to produce such items as million tons, a decrease of 4% from that of 1996. Fuller’s earthbrick and pottery. accounted for more than 70% of the clay used for absorbent
Consumption of fire clay increased approximately 29% in 1997 to purposes, followed by bentonite (more than 20%), and kaolin (less649,000 tons. Major markets for fire clay were common brick,firebrick, refractory mortar and cement, grogs and calcines, andpottery, in decreasing order of consumption. (See table 10.) and grease absorbents (11%), and miscellaneous absorbentIncreased sales for the production of common brick accounted for the applications (4%).bulk of the increase in overall sales of fire clay.
Fuller’s Earth.—The major uses for attapulgite-type and for clay in the manufacture of ceramics, ranging from china tomontmorillonite-type of the fuller’s earths were as pet waste sanitaryware to tile to roofing granules, was approximately 1.81absorbents, oil and grease absorbents, pesticide carriers, and flow million tons, an increase of 12% from that of 1996. The largestcontrol agents in animal feed, in decreasing order of consumption. ceramics market was in ceramic floor and wall tile (40% of the(See table 12.) Overall consumption of fuller’s earth decreased 9%in 1997. Sales of attapulgite-type fuller’s earth decreased 19% in1997 primarily because of the sale and subsequent split of Floridinoperations and products between Engelhard Corp. and ITC Inc.Overall sales of montmorillonite-type fuller’s earth decreased 4% intonnage. However, sales for oil and grease absorbents, drilling mudapplications, and miscellaneous floor and wall tile markets increased.Consumption of montmorillonite-type fuller’s earth declined for mostof the remaining markets. Most of the sales loses were in the export,pesticide carriers, and pet waste absorbent markets.
With regard to the sales of attapulgite-type fuller’s earth versusmontmorillonite-type fuller’s earth, most of the data were concealed predominant clays used in floor and wall tile manufacture. (Seeto avoid disclosing company proprietary data. Major markets forattapulgite were pet waste absorbents, oil and grease absorbents,pesticide carriers, ceramic tile, fertilizer carriers, drilling mud,gypsum products, cement clinker, animal feed, and adhesiveapplications, in decreasing order of consumption. Major markets formontmorillonite-type fuller’s earth were pet waste absorbents, oiland grease absorbents, pesticide carriers, and fertilizer carrierapplications, in decreasing order of consumption.
Attapulgite sales account for less than one-third and one-quarterof the fuller’s earth sold for oil and grease absorbents and pet wasteabsorbents, respectively. Attapulgite accounted for all of the sales
Kaolin.—The major markets were for paper coating, paper filler,refractories, fiberglass, paint, catalyst, rubber, and chemicalmanufacture, in decreasing order of consumption. (See table 20.) Consumption increased approximately 3% in 1997. The largestgains from a tonnage standpoint were made in fiber glass (about an8% gain), paper coating (6%), paper filler (7%), paint (14%), andrefractories (11%). Major domestic markets for kaolin from Georgiawere paper coating, paper filling, refractories, fiber glass, and paint,in decreasing order of consumption. Major gains were made inpaper coating (4%), paper filler (7%), paint (13%), and refractories(8%). Loses were reported in rubber and export markets. The major
catalyst, fiber glass, common brick, face brick, roofing granules,adhesives, paper coating and filler, pesticide carriers, and firebrick,in decreasing order of consumption. Gains made in the rubber andfiberglass sales were offset by loses in sales to the common brick andexport markets. (See tables 17 and 19.)
than 1%). (See tables 6 and 12.) Pet waste absorbents accountedfor approximately 85% of absorbent consumption, followed by oil
Ceramics.—All varieties of clays were used in ceramics. Demand
market), followed by sanitaryware (15%), catalyst (13%), roofinggranules (10%), pottery (9%), quarry tile (4%), electrical porcelain(1.8%), fine china (1.6%), and glaze applications (0.5%). Ball clayaccounted for 38% of the clay used in ceramics, followed by commonclay and shale (31%) and kaolin (26%). Small amounts of bentonite,fire clay, and fuller’s earth also were used in the manufacture ofceramics. With regard to individual ceramics markets, ball claydominated the electrical porcelain, glazing, pottery, and sanitarywaremarkets. Common clay and shale was the predominant clay used inroofing granules. Kaolin dominated the catalyst, crockery, and finechina markets. Common clay and shale and ball clay were the
tables 4, 8, 10, and 20.)Construction.—Common clays and shales were used to
manufacture a wide variety of construction materials such asexpanded aggregates, hydraulic cement, and structural clay products.
Expanded Clay and Shale.—Approximately 3.99 million tonsof clays was used in the production of lightweight aggregate. Nearlyall of the clay used to manufacture lightweight aggregate wascommon clay and shale. Lightweight aggregates were used inconcrete block, structural concrete, and highway surfacing, indecreasing order of consumption. (See tables 8 and 21.)
Hydraulic Cement.—Clays provide the alumina and silica
4 U.S. GEOLOGICAL SURVEY—MINERALS INFORMATION—1997
required to manufacture hydraulic cements. Approximately 5.96 products, such as adhesives, flooring products, paint, paper, andmillion tons of clays was consumed, a 17% decrease from that of rubber. Paper coating and filling accounted for 70% of the filler and1996. Common clays, kaolin, fuller’s earth, and fire clay, in extender market consumption, followed by paint (6%), pesticidesdecreasing order of consumption, were used in the manufacture of (6%), animal feed (4%), rubber (4%), and wallboard productionportland cement clinker. More than 99% of the clay consumed by (2%). Asphalt emulsion, fertilizer carrier, plastic, gypsum products,the cement industry was common clay and shale. (See tables 8 and20.)
Metakaolin, which is kaolin that has been calcined over acontrolled temperature range, can be used in cement to improve thelife of the concrete, reduce permeability, and improve resistance tochemical attack. The metakaolin is used as a pozzolan, partiallyreplacing some of the portland cement in the mix. The metakaolinreacts with lime produced by the portland cement hydration reaction,converting the lime to a cementitious product that increase thedensity and fills channels in the concrete (Gypsum, Lime, & BuildingProducts, 1997).
Structural Clay Products.—Approximately 13.5 million tons ofclays was used in the manufacture of structural clay products such asbuilding brick, roofing tile, and sewer pipe. Common and face brickaccounted for 98% of this total. Other markets, in decreasing orderof consumption, were flue linings, flower pots, sewer pipe, drain tile,structural tile, terra cotta, and roofing tile. Approximately 97% ofthe clay used in these applications was common clay and shale. (Seetables 8, 20, and 22.)
Surface pigments can be used to expand product lines for brickmanufacture. The pigments typically are oxides of iron, manganese,zinc, titanium, tin, cobalt, and zirconium. The color is determined bythe stability of the oxide during firing, the kiln atmosphere, the firingtemperature, and source of the individual pigments. Sometimes thepigments are mixed with inert and reactive fillers to produce colorsnormally not associated with the pure oxide compounds. By usingpigments, the manufacturer can produce unique finishes, use inferiorcolor quality clays if necessary, and produce more uniform productcolors (Barber, 1997).
The U.S. Bureau of the Census reported domestic shipments of7.71 billion building and face bricks valued at $1.34 billion, anincrease from 7.62 billion bricks in 1996. Shipments of clay floorand wall tile were 59.2 million square meters valued at $874 millioncompared with 54 million square meters in 1996. Shipments ofvitrified clay and sewer pipe fittings were 134,000 tons valued at$44.4 million, a 7% decrease from that of 1996. The increase inshipments of brick and tile is corroborated by statistics on housingstarts; the Bureau of the Census estimated that the seasonallyadjusted annual rate for privately owned housing starts in Decemberwas 1.52 million units in 1997, compared with 1.35 million units in1996.
Drilling Mud.—Reported demand for clays in drilling muds(domestic and exports) was 837,000 tons, a 38% increase from that Paper Products.—Kaolin accounted for essentially all of the clayof 1996. This magnitude of increase is partially corroborated by the used for paper coating (3 million tons) and all of the clay used forhigher domestic rotary drill rig count for 1997 (Oil & Gas Journal, paper filling (918,000 tons). Sales for both markets increased 7%1997). The sizable increase in exports of drilling grade bentonitealso suggests healthy oil drilling markets. Swelling-type bentoniteremained the principal clay used in drilling mud mixes (more than90%). Fuller’s earth, used mostly in saltwater drilling techniques,accounted for less than 10% of the total. Some ball clay and kaolinalso were used in drilling mud applications. (See tables 6 and 12.) utilization rates for paper and products ranged from 87% to 91% in
Fillers, Extenders, and Binders.—Approximately 5.61 milliontons of clays was used as fillers, extenders, and binders, an increaseof 11% from that of 1996. Clays are used in a wide variety of
asphalt tile, textile, medical (pharmaceutical and cosmetic), vinylflooring, and ink each account for less than 1% of the fillers andextenders markets, in decreasing order of consumption.
Kaolin accounted for approximately 84% of the clay used in fillerand extender applications, followed by fuller’s earth (7%), commonclay and shale (4%), bentonite (3%), ball clay (1%), and traceamounts of fire clay. (See tables 4, 6, 12, and 20.) Ball claydominated the asphalt emulsion market. Bentonite was thepredominant clay used for ink applications. Common clay was thepredominant clay used in wallboard production. Fuller’s earth wasthe predominant clays used in fertilizer, gypsum product, andpesticide applications. Kaolin dominated the adhesive, paint, paper,plastics, rubber, textile, and vinyl flooring markets. Bentonite,fuller’s earth, and kaolin were the major clays used in asphalt tile.Bentonite and fuller’s earth were the predominant clays in animalfeeds and medical, pharmaceutical, and cosmetic applications.
Bentonite is used in paints as rheological additives. Having a largeparticle diameter-to-thickness ratio and a negative charge on thesurface and positive charge on the edges, smectites act as thixotropicagents. They thicken the paint to prevent settling under low shearconditions. When stirred, the edge to surface bonding of thebentonite is disrupted and the viscosity of the paint is reduced. Theresult is a paint that has a high solids content while remainingpourable. Another advantage is that flow and leveling propertiesalso are improved in some paints. Smectite has been used to replaceattapulgite and cellulose thickeners in many water-based paints(Brennan, 1997).
Glass.—Approximately 479,000 tons of kaolin was consumed inthe manufacture of fiberglass and mineral wool. This was anincrease of 8% from that of 1996. (See table 20.)
Iron Ore Pelletizing.—Domestic demand decreased to 536,000tons in 1997. This represents a decrease of 20% of bentonitereported as domestic sales. Total sales (including exports) were598,000 tons, approximately 12% less than in 1996. Thiscorresponds to a slight decline in the production of pelletized iron orefor blast furnaces. Demand also may be lower due to improvedpelletizing properties of new bentonite products and differentpelletizing characteristics of the iron ore mined during the year. Atleast one iron ore pelletizer noted that pelletized ore also facedcompetition from the use of steel scrap in minimills, iron oreagglomerates, and steel slab imports. All of the clay used inpelletizing was bentonite. (See table 6.)
over that of 1996. (See table 20.) Small amounts of fuller’s earthwere used in paper coating applications.
The paper industry recovered somewhat from the downturn thatoccurred in late 1995 and early 1996 with growth rates expected tobe approximately 3% per year (Burns, 1997). Monthly capacity
1997. This compares with monthly rates of 85.5% to 90% in 1996.Kaolin-based pigments are widely used by the paper industry. The
standard hydrous kaolin-based product finds uses in number 3 and 4
U.S. GEOLOGICAL SURVEY—MINERALS INFORMATION—1997 5
coated woodfree papers and number 4 and 5 coated groundwood lightweight aggregate was $14.63 per ton.papers. In contrast, the premium hydrous kaolin-based pigments areused in number 1 and 2 coated woodfree paper. Delaminated gradesare used in high quality, art-type paper and calcined grades areparticularly valuable as more cost-effective opacifiers than otherpigments. To meet the needs of the paper industry, the kaolinindustry has made several advances. These include tighter control onparticle size distributions, reduction of impurities and improvementsin brightness, whiteness and rheological properties and developmentof co-pigments (Jeffries, 1997).
Refractories.—Approximately 2.94 million tons of clays was usedfor the manufacture of refractories, a 13% increase from that of 1996.The largest markets were foundry sand (31%), grogs and calcines(30%), refractory mortar and cement (14%), firebrick (9%), highalumina brick (1%), and high alumina specialties (less than 1%).The market percentages for refractories must be used with cautionfor all but the foundry sand and refractory mortar and cementcategories because of the uncertainty in the data for specific marketdestinations.
Ball clay, bentonite, common clay and shale, fire clay, fuller’searth, and kaolin accounted for 2%, 31%, 21%, 12%, less than 1%,and 33%, respectively, of the refractories markets. Fire claydominated the firebrick market, bentonite dominated the foundrysand market, and kaolin dominated the grog, calcine, high aluminabrick, kiln furniture, and plug, tap, and wad markets. Common claydominated the refractory mortar and cement market. (See tables 4,6, 8, 10, and 20.)
Production data for refractories manufactured in 1997 are notavailable at this time from the U.S. Bureau of the Census. For 1996,the Bureau reported shipments of clay refractories to be valued at$944 million in 1996, a slight increase from those of 1995.Shipments of clay refractory brick and shapes were 815,000 tons(280 million bricks) valued at $559 million. This can be broken outinto fire clay brick and shapes at 386,000 tons (128 million bricks)valued at $209 million; high alumina brick and shapes, 371,000 tons(100 million bricks) valued at $286 million; and insulating brick andshapes, 57,400 tons (51.9 million bricks) valued at $64.3 million.Shipments of unshaped clay refractories were 648,000 tons valuedat $330 million. This is broken out into refractory mortars, 48,200tons valued at $25.4 million; plastic refractories, 144,000 tonsvalued at $76.8 million; castable refractories, 292,000 tons valuedat $166 million; and fire clay gunning mixes, 164,000 tons valued at$61.7 million. Approximately 194,000 tons of miscellaneousrefractories valued at $24 million also were sold in 1996.
Prices
Ball Clay.—The average value for ball clay reported by domesticproducers was $46.34 per ton. The average values for imported andexported ball clay were $317.13 and $64.86 per ton, respectively.
Bentonite.—The average value reported by domestic producersfor nonswelling bentonite was $33.91 per ton. The average value forswelling bentonite was $42.92 per ton. The average value for alltypes of bentonite was $42.03 per ton. The average value ofimported bentonite was $371.33 per ton. The average value ofexported bentonite was $99.67 per ton.
Common Clay and Shale.—The average value for all commonclay and shale produced in the United States and Puerto Rico was$6.09 per ton. The average value of clay and shale used in
Fire Clay.—The average value for fire clay reported by domesticproducers was $14.57 per ton. The average of imported fire claywas $1,144.93 per ton. The average value of exported fire clay was$105.65 per ton. The unit value of domestically produced fire claydecreased because of increased sales for lower value applicationssuch as brick manufacture.
Fuller’s Earth.—The average value of attapulgite-fuller’s earthreported by domestic producers was $127.28 per ton. The averagevalue of montmorillonite-fuller’s earth was $99.02 per ton. Theaverage value of all types of fuller’s earth was $107.45 per ton. Theaverage value of imported fuller’s earth was $133.88 per ton. Theaverage value of exported fuller’s earth was $112.05 per ton.
Kaolin.—The average value of kaolin was $120.19 per ton for allkaolin grades. The average value for airfloat kaolin was $54.44 perton; for high-temperature calcined (refractory grade) kaolin, $17.74;for low-temperature calcined (pigment grade) kaolin, $322.64; forall types of calcined kaolin, $158.90 per ton; for delaminated kaolin,$101.63 per ton; for water-washed kaolin, $116.99 per ton; and forunprocessed kaolin, $23.97 per ton. The average value of theimported kaolin was $239.14 per ton. The average value of exportedkaolin was $172.48 per ton. Prices for paper-grade kaolin productsdeclined, resulting in lower unit values for pigment-grade,delaminated, and water-washed kaolin in 1997.
Foreign Trade
Ball Clay.—Ball clay exports increased to 91,000 tons valued at$5.90 million, according to the Bureau of the Census. (See table 23.)Domestic ball clay producers reported that 146,000 tons of ball claywas exported in 1997. The discrepancy observed between the exporttonnage reported by the U.S. Bureau of the Census and that reportedby producers probably results from a combination of factors. Onereason is that the producers often do not control the final sale andmovement of the clays, as when a mineral broker is involved. Someclays originally destined for export may be sold domestically and viceversa without the knowledge of the producer. Another reason is thatsome clay may be exported under an export code other than thatcorresponding to ball clay to the U.S. Bureau of the Census.
Ball clay exports were used mainly for floor and wall tileproduction and sanitaryware production. Other markets includeasphalt emulsions, china, dinnerware, and miscellaneous refractoryand filler and extender applications. In 1996, imports were 823 tons of ball clay valued at $261,000.(See table 24.)
Bentonite.—Bentonite exports increased to 850,000 tons valuedat $84.7 million. Domestic bentonite producers reported exports of544,000 tons. The discrepancy between producer and U.S. Bureauof Census appears to result from producers including most of theexports destined for Canadian and Mexican markets (approximately195,000 tons) under domestic sales. Also see the discussion underball clay concerning discrepancies between export data reported byproducers and those reported by the U.S. Bureau of the Census. (Seetables 6 and 23.)
Bentonite imports consisted mainly of untreated bentonite clay andchemically or artificially activated materials. Imports of untreatedbentonite were 7,560 tons valued at $2.81 million. Imports ofchemically activated material were 18,600 tons valued at $10.3million. (See table 24.)
6 U.S. GEOLOGICAL SURVEY—MINERALS INFORMATION—1997
Fire Clay.—Approximately 222,000 tons of fire clay valued at$23.5 million was exported. Sixty-nine tons of fire clay valued at$79,000 was imported in 1997. (See tables 23 and 24.)
Fuller’s Earth.—Approximately 144,000 tons of fuller’s earthvalued at $16.1 million was exported. Domestic producers reportedmore than 44,000 tons of exports in 1997. Again, the discrepancybetween producer and U.S. Bureau of the Census data is partiallyexplained by the fact that producers apparently include much of theexports destined for Canada and Mexico (approximately 65,000tons) under domestic sales. Several of producers manufacturecommercial products such as pet waste absorbent and commercialabsorbents that may have been reported under export classificationsother than fuller’s earth. Also see the discussion under ball clayconcerning discrepancies between export data reported by producersand those reported by the U.S. Bureau of the Census. (See table 12.)Approximately 3,530 tons of decolorizing and fuller’s earth valuedat $473,000 was imported in 1997. (See tables 12, 23, and 24.)
Kaolin.—The U.S. Bureau of the Census reported that 3.38million tons of kaolin valued at $583 million was exported in 1997.Producers reported exports of 2.39 million tons. Most of the kaolindestined for Canadian and Mexican markets (approximately 800,000tons) appears to have been reported under domestic consumption.Also, discrepancies between producer and Bureau of the Census dataare similar to the situation with ball clay. (See tables 20 and 23.)Kaolin imports increased to 30,400 tons valued at $7.27 million.(See table 24.)
World Review
World production of bentonite was approximately 9.68 milliontons, fuller’s earth production was estimated to be 3.45 million tons,and kaolin production was about 39.1 million tons. The United Statescontinued to be the leading producer of all three clay types, followedby the former U.S.S.R. for bentonite, Germany for fuller’s earth, andUzbekistan for kaolin. Spain led all countries in the production ofsepiolite. (See tables 25, 26, and 27.)
Australia.—CRA Ltd. completed a 3-year exploration program forhigh whiteness kaolin. The company located several promisinglocations in the Wickepin District (Industrial Minerals, 1997k).
Commercial Minerals Ltd. purchased Australian Bentonite fromCudgen R.Z., Ltd. The purchase included the 60,000-ton-per-yearmine and a 120,000-ton-per-year mill. Commercial Minerals alsooperates a bentonite mine in New South Wales (Industrial Minerals,1997b).
Australian Kaolin NL proceeded with the development of a kaolindeposit in Queensland. The company initially expects to produce75,000 tons and 100,000 tons annually of calcined kaolin andhydrous kaolin, respectively. Production is expected to begin in1998 (Industrial Minerals, 1997h).
Brazil.—Companhia de Pesquisas de Recursos Minerais, the Stategeological survey, announced plans to auction its kaolin deposit inRip Capim. The deposit contains approximately 560 million tons ofkaolin reserves. The move is an effort by Brazil to privatize itsholdings (Industrial Minerals, 1997a).
Kaolin deposits in Brazil are remarkably similar to those inGeorgia. Both are sedimentary deposits, laid down in fluvial deltaicand foreshore environments. Deposition was followed by subsequentintense weathering by ground water. As in Georgia, there are hardkaolins (finer grained) and soft kaolins (consisting of books of
kaolin). The coarse kaolin was likely to have been at least partiallyrecrystallized during the weathering process (Pickering and Linkous,1997).
Canada.—ECC International announced plans to build a kaolinslurry plant in Port Hawkesbury, Nova Scotia. The plant will receivedry kaolin from ECC’s operations in England. The plant will supply140,000 tons annually for the paper market (North AmericanMineral News, 1997b).
Bruneau Minerals Inc. continued testing of its kaolin deposit in St.Jovite, Quebec. The 5.4-million-ton deposit consists of brown kaolincontaining no alkali. The kaolin will probably be marketed forcement and concrete manufacture (North American Minerals News,1997a).
China.—ECC International announced a joint venture with FujianJiuzhou Longyan Kaolin Clay Co. to produce ceramic-grade kaolin.Production capacity of the operation will be 100,000 tons per yearwith an estimated 50-year reserve of kaolin (American CeramicSociety Bulletin, 1997).
Volclay International and Jianping Redhill Bentonite Co. formeda joint venture, which now operates as Beijing Prosperity Clay &Construction Materials. The venture will focus on the foundry sand,oil drilling, construction, and cat litter markets in the Pacific Rimarea (Industrial Minerals, 1997j).
Watts Blake Bearne & Co. PLC entered into a joint venture withJianbei (Group) Co. Ltd. to produce ball clay near Qingyuan,Guangdong Province. The new venture will serve the growingChinese ceramics market. Production is scheduled to begin in 1998(Watts Blake Bearne & Co. PLC, What’s new at WBB, accessedJune 30, 1998, at URL http://www/.wbb.co.uk/ page10.htm).
India.—Volclay International finalized a joint venture withAshapura Minechem Ltd. The venture will operate as AshapuraVolclay Ltd. and manufacture and sell value-added bentoniticproducts (Industrial Minerals, 1997j).
Italy.—Süd-Chemie AG acquired 50% of Laviosa Minerals SpA’sownership in Società Sarda di Bentonite SpA. Under the agreement,one mine and two plants were transferred to Süd-Chemie. The180,000-ton-per-year mine is located in northwest Sardinia and theplants are located in Oristano and Sant Antioco, southwesternSardinia (Industrial Minerals, 1997e).
Mexico.—Volclay de Mexico SA de CV built a new blendingfacility at its Gomez Palacio operation. The facility, which is highlyautomated, prepares blends of bentonite and coal for its foundrycustomers. The foundry market is believed one of the major growthareas for the Mexican bentonite industry. There has been increasedinvestment in the foundry industry and major plant expansions in thepast 2 years. This has resulted in large part because of the largegrowth in the automobile manufacturing industry in Mexico (NorthAmerican Minerals News, 1997e; Nebergall, 1997).
Spain.—Tolsa SA agreed to purchase the Iboughardian bentonitemine from the Bureau de Recherches et de Participations Minieres.The mine is near Nador and has reserves of 600,000 tons (IndustrialMinerals, 1997i).
Guzman Minerales SA and Stephan Schmidt KG formed a jointventure to mine and process clay for the tile and sanitaryware market(Industrial Minerals, 1997f).
Laporte PLC sold its subsidiary, Minas de Gador SA, to a Spanishinvestment bank. Minas de Gador has a production capacity of130,000 tons per year of bentonite and saponite. The sale is part ofa reorganization that Laporte is currently undergoing (Industrial
U.S. GEOLOGICAL SURVEY—MINERALS INFORMATION—1997 7
Minerals, 1997d).Thailand.—Volclay Siam Ltd. Co. built a bentonite processing
plant in Rayong. Volclay International, the parent company ofVolclay Siam, will provide technical support and assist with newproduct development (Industrial Minerals, 1997j).
Turkey.—Kalemaden Endüstriyel Sanayii ve Ticaret A.Ô.completed a processing facility for kaolin and other ceramic-gradeclays. The plant will supply clay for engobe, glaze, and sanitarywaremarkets (Asian Ceramics, 1997).
Research
Research was conducted on the use of montmorillonite to improvethe properties of polymers. Tests showed increases in tensilestrength, tensile modulus, flexural strength, and flexural modulus. Inaddition, the polymers exhibited better resistance to heat distortionand were less flammable (lower heat release rates). A purifiedmontmorillonite is produced for this application by separating themontmorillonite from a bentonite sample and modifying its surfaceto make it organophilic. The fine grain size of the montmorilloniteimproves its dispersion in the polymer. The attached organicmolecules on the montmorillonite improve its bonding with thepolymer. Courser, untreated clay particles are dispersed throughoutthe polymer as clusters of platelets rather than individual plateletsand tend to behave an immiscible components, resulting in twodistinct phases. (Chemical & Engineering News, 1997; NorthAmerican Minerals News, 1997d).
Bentonite which has been surface treated with quaternary aminessuch as alkyl di-methyl ammonium halide effectively removed oilsand other organic compounds from water treatment systems. Theamines rendered the bentonite lipophilic and hydrophobic, permittingit to absorb up to 50 weight-percent of organics (ChemicalEngineering, 1997).
Outlook
The outlook for the domestic clay industry looks promising withmodest growth expected for the next couple of years. The U.S.economy has been growing over the past 6 or 7 years with anaccompanying growth in industrial manufacturing, housing, and otherindustries that consume clays. The strength of the economy shouldensure that clay markets remain strong for several years to come.
References Cited
American Ceramic Society Bulletin, 1997, ECCI establishes joint venture in China:American Ceramic Society Bulletin, v. 76, no. 9, September, p. 29.
Asian Ceramics, 1997, Kalemaden offers new material source: Asian Ceramics,December, p. 8.
Barber, Martyn, 1997, Surface pigments expand product range for brickmanufacturers: Ceramic Industry, v. 147, no. 11, October, p. 44-48.
Brennan, T.P., 1997, A novel liquid smectite additive for water-based coatings: Paint& Coatings Industry, v. 13, no. 10, October, p. 94-100.
Burns, R. A., 1997, Kaolin and calcium carbonate–markets, supply and the future:SME preprint 97-62, Society of Mining, Metallurgy, and Exploration, Inc.,Littleton, CO, 4 p.
Chemical & Engineering News, 1997, Making polymers take the heat: Chemical andEngineering News, v. 75, no. 40, October 6, p. 35.
Chemical Engineering, 1997, Use organoclay to extend the life of filter media:Chemical Engineering, v. 104, no. 2, February, p. 109.
Chemical Market Reporter, 1997, Engelhard is bullish on kaolin: Chemical MarketReporter, v. 252, no. 23, December 8, p. 7.
Chemical Week, 1997, Attapulgite shift: Chemical Week, v. 159, no. 47, December10, p. 36.
European Chemical News, 1997, American Colloid builds blending unit: EuropeanChemical News, v. 68, no. 1792, December 8-14, p. 45.
Food and Drug Administration, 1997, FDA requests that ball clay not be used inanimal feeds: Washington, DC, Food and Drug Administration/Center forVeterinary Medicine press release, October 14, 1997, 2 p.
Gypsum, Lime, & Building Products, 1997, Concrete proof of lifespan: Gypsum,Lime, & Building Products, April, p. 29.
Industrial Minerals, 1997a, CPRM to privatise kaolin deposit-again: IndustrialMinerals, no. 362, November, p. 9.
———1997b, Cudgen offloads Australian bentonite: Industrial Minerals, no. 354,March, p. 9.
———1997c, Cytec sells alum & kaolin assets: Industrial Minerals, no. 353,February, p. 16.
———1997d, Laporte Out of Pet Litter & Minas de Gador Sold: Industrial Minerals,no. 363, December, p. 8.
———1997e, Laviosa/Süd-Chemie bentonite agreement: Industrial Minerals, no.359, August, p. 15.
———1997f, New Spanish clays jv: Industrial Minerals, no. 359, August, p. 74.———1997g, Nord sells kaolin subsidiary to Dry Branch: Industrial Minerals, no.
357, June, p. 23.———1997h, Skardon kaolin to go into production: Industrial Minerals, no. 358,
July, p. 9.———1997i, Tolsa buys Moroccan clay mine from BRPM: Industrial Minerals, no.
363, December, p. 14.———1997j, Volclay moves into Asian bentonite: Industrial Minerals, no. 356, May,
p. 9.———1997k, Western’s Australia’s industrial minerals: Industrial Minerals, no.
354, March, p. 58-75.Jeffries, Jan, 1997, Kaolin-based pigment use shifts with customized formulations:
Pulp & Paper, v. 71, no. 5, May, p. 21-25.North American Minerals News, 1997a, Bruneau Minerals inches towards mine
development: North American Minerals News, no. 31, December, p. 3.———1997b, ECC invests in Nova Scotia slurry plant: North American Minerals
News, no. 26, July, p. 2.———1997c, Engelhard & ITC get Floridin: North American Minerals News, no.
26, p. 1-2.———1997d, Nano-clays: North American Minerals News, no. 30, November, p.
9-12.———1997e, New blending plant for Volclay de Mexico: North American Minerals
News, no. 31, December, p. 2.———1997f, New western Ca-bentonite source: North American Minerals News,
no. 25, June, p. 16.———1997g, Thiele Kaolin in $40 million expansion: North American Minerals
News, no. 30, November, p. 3.Nebergall, R.S., 1997, Bentonite in Mexico—A changing and growing market, in
North American Industrial Minerals Annual Meeting, 2nd, Cancun, Mexico,1997, Proceedings: Industrial Minerals Information Ltd., 13 p.
Oil & Gas Journal, 1997, Baker Hughes rig count: Oil & Gas Journal, v. 95, no. 51,p. 113.
Pickering, S.M., Jr. and Linkous, M.A., 1997, Comparison of fine and coarsecommercial kaolin deposits from Georgia (USA) and Brazil: SME preprint 97-163, Society of Mining, Metallurgy, and Exploration, Inc., Littleton, CO, 4 p.
SOURCES OF INFORMATION
U.S. Geological Survey Publications
Clays. Ch. in Mineral Commodity Summaries, annual.1
Clays. Ch. in United States Mineral Resources, U.S. GeologicalSurvey Professional Paper 820, 1973.
Other
American Forest and Paper Association.Clays. Ch. in Mineral facts and problems, U.S. Bureau of Mines
Bulletin 675, 1985.Cosmetic, Toiletry, and Fragrance Association.
Prior to January 1996, published by the U.S. Bureau of Mines.1
8 U.S. GEOLOGICAL SURVEY—MINERALS INFORMATION—1997
Engineering and Mining Journal. National Paint and Coatings Association.Industrial Minerals and Rocks, 6th ed., AIME, 1994. North American Minerals News.Mining Engineering. Society of the Plastics Industry.Mining Journal (London). World Mining.Mining Magazine.

TABLE 1SALIENT U.S. CLAY STATISTICS 1/ 2/
(Thousand metric tons and thousand dollars)
1993 1994 1995 1996 1997 Domestic clays sold or used by producers: Quantity 40,700 42,000 43,100 43,100 42,000 Value $1,470,000 $1,590,000 $1,730,000 $1,710,000 $1,670,000Exports: Quantity 4,150 4,620 4,680 4,830 5,080 Value $670,000 $739,000 $812,000 $825,000 $860,000Imports for consumption: Quantity 39 36 35 45 64 Value $17,600 $14,900 $16,000 $21,000 $23,2001/ Excludes Puerto Rico.2/ Data are rounded to three significant digits, where applicable.
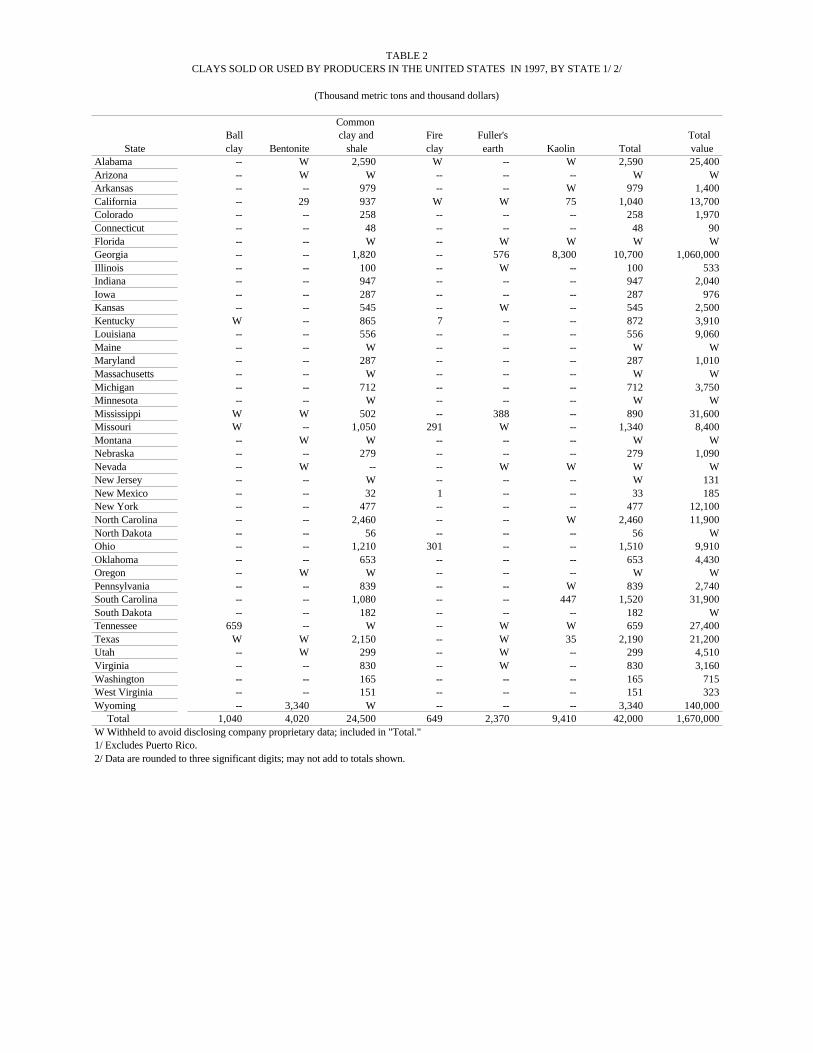
TABLE 2CLAYS SOLD OR USED BY PRODUCERS IN THE UNITED STATES IN 1997, BY STATE 1/ 2/
(Thousand metric tons and thousand dollars)
Common Ball clay and Fire Fuller's Total
State clay Bentonite shale clay earth Kaolin Total value Alabama -- W 2,590 W -- W 2,590 25,400Arizona -- W W -- -- -- W W Arkansas -- -- 979 -- -- W 979 1,400California -- 29 937 W W 75 1,040 13,700Colorado -- -- 258 -- -- -- 258 1,970Connecticut -- -- 48 -- -- -- 48 90Florida -- -- W -- W W W W Georgia -- -- 1,820 -- 576 8,300 10,700 1,060,000Illinois -- -- 100 -- W -- 100 533Indiana -- -- 947 -- -- -- 947 2,040Iowa -- -- 287 -- -- -- 287 976Kansas -- -- 545 -- W -- 545 2,500Kentucky W -- 865 7 -- -- 872 3,910Louisiana -- -- 556 -- -- -- 556 9,060Maine -- -- W -- -- -- W W Maryland -- -- 287 -- -- -- 287 1,010Massachusetts -- -- W -- -- -- W W Michigan -- -- 712 -- -- -- 712 3,750Minnesota -- -- W -- -- -- W W Mississippi W W 502 -- 388 -- 890 31,600Missouri W -- 1,050 291 W -- 1,340 8,400Montana -- W W -- -- -- W W Nebraska -- -- 279 -- -- -- 279 1,090Nevada -- W -- -- W W W W New Jersey -- -- W -- -- -- W 131New Mexico -- -- 32 1 -- -- 33 185New York -- -- 477 -- -- -- 477 12,100North Carolina -- -- 2,460 -- -- W 2,460 11,900North Dakota -- -- 56 -- -- -- 56 W Ohio -- -- 1,210 301 -- -- 1,510 9,910Oklahoma -- -- 653 -- -- -- 653 4,430Oregon -- W W -- -- -- W W Pennsylvania -- -- 839 -- -- W 839 2,740South Carolina -- -- 1,080 -- -- 447 1,520 31,900South Dakota -- -- 182 -- -- -- 182 W Tennessee 659 -- W -- W W 659 27,400Texas W W 2,150 -- W 35 2,190 21,200Utah -- W 299 -- W -- 299 4,510Virginia -- -- 830 -- W -- 830 3,160Washington -- -- 165 -- -- -- 165 715West Virginia -- -- 151 -- -- -- 151 323Wyoming -- 3,340 W -- -- -- 3,340 140,000 Total 1,040 4,020 24,500 649 2,370 9,410 42,000 1,670,000W Withheld to avoid disclosing company proprietary data; included in "Total."1/ Excludes Puerto Rico.2/ Data are rounded to three significant digits; may not add to totals shown.

TABLE 3BALL CLAY SOLD OR USED BY PRODUCERS IN THE UNITED STATES, BY STATE 1/
(Thousand metric tons and thousand dollars)
Airfloat Water-slurried Unprocessed TotalState Quantity Value Quantity Value Quantity Value Quantity Value
1996: Tennessee 255 13,900 187 8,270 236 6,870 679 29,000 Other 2/ 118 r/ 6,990 r/ (3/) (3/) 139 5,920 257 r/ 12,900 r/ Total 373 r/ 20,800 r/ 187 8,270 375 12,800 935 r/ 41,900 r/1997: Tennessee 252 13,400 157 6,960 249 7,120 659 27,400 Other 2/ 178 13,000 -- -- 202 7,650 379 20,700 Total 430 26,400 157 6,960 451 14,800 1,040 48,100r/ Revised.1/ Data are rounded to three significant digits; may not add to totals shown.2/ Includes Kentucky, Mississippi, Missouri, and Texas.3/ Included with "Unprocessed."
TABLE 4BALL CLAY SOLD OR USED BY PRODUCERS
IN THE UNITED STATES, BY USE 1/
(Metric tons)
Use 1996 1997Filler, extenders, binders 2/ 74,900 r/ 78,600Floor and wall tile 223,000 315,000Miscellaneous ceramics 3/ 45,500 26,500Pottery 118,000 102,000Refractories 4/ 78,900 68,500Sanitaryware 207,000 219,000Miscellaneous 5/ 59,800 r/ 82,800Exports 6/ 129,000 146,000 Total 935,000 r/ 1,040,000r/ Revised.1/ Data are rounded to three significant digits, may not add to totals shown.2/ Includes animal feed, asphalt emulsions, pesticides, rubber, and other filler, extendersand binders.3/ Includes catalysts, electrical porcelain, fine china/dinnerware, glazes, and miscellaneousceramics.4/ Includes firebrick, blocks, and shape, high-alumina brick and specialties, and miscellaneousrefractories.5/ Includes brick (common), waterproofing seals, drilling mud, and other unknown uses.6/ Includes ceramics and glass, fillers, extenders and binders, floor and wall tile, miscellaneous refractories, and other unknown uses.

TABLE 5BENTONITE SOLD OR USED BY PRODUCERS IN THE UNITED STATES, BY STATE 1/
(Thousand metric tons and thousand dollars)
Nonswelling Swelling TotalState Quantity Value Quantity Value Quantity Value
1996: California W W W W 148 13,900 Colorado 1 19 -- -- 1 19 Mississippi 145 4,480 -- -- 145 4,480 Nevada W W W W 6 580 Oregon W W W W 33 1,530 Wyoming -- -- 3,030 98,400 r/ 3,030 98,400 r/ Other 2/ 315 17,400 251 13,500 r/ 566 15,000 r/ Total 461 21,900 3,280 112,000 3,740 134,0001997: California W W W W 29 3,420 Colorado -- -- -- -- -- -- Mississippi W W W W W W Nevada W W W W W W Oregon -- -- W W W W Wyoming -- -- 3,340 140,000 3,340 140,000 Other 2/ 397 13,500 283 15,900 651 25,900 Total 397 13,500 3,630 156,000 4,020 169,000r/ Revised. W Withheld to avoid disclosing company proprietary data; included with "Other " or "Total." 1/ Data are rounded to three significant digits; may not add to totals shown.2/ Includes Alabama, Arizona, Montana, Texas, and Utah.

TABLE 6BENTONITE SOLD OR USED BY PRODUCERS
IN THE UNITED STATES, BY USE 1/
(Metric tons)
Use 1996 1997Domestic: Absorbents: Pet waste absorbents 607,000 604,000 Other absorbents 90,500 W Adhesives 11,200 15,100 Animal feed 65,200 110,000 Ceramics (except refractories) 2/ W W Drilling mud 572,000 789,000 Filler and extender applications 3/ 33,500 41,300 Filtering, clarifying, decolorizing: minerals oils and greases, vegetable oils, desiccants (1997) W 82,400 Foundry sand 772,000 901,000 Pelletizing (iron ore) 4/ 674,000 536,000 Miscellaneous refractories and kiln furniture 5/ 16,700 7,800 Miscellaneous 6/ 242,000 126,000 Waterproofing and sealing 227,000 267,000 Total 3,310,000 3,480,000Exports: Drilling mud 102,000 150,000 Foundry sand 278,000 293,000 Other 7/ 46,400 101,000 Total 426,000 544,000 Grand total 3,740,000 4,020,000W Withheld to avoid disclosing company proprietary data; included with "Miscellaneous."1/ Data are rounded to three significant digits; may not add to totals shown.2/ Includes floor and wall tile, and pottery.3/ Includes medical, pharmaceutical, cosmetics, paint, pesticides and related products, plastics, asphaltemulsions and tiles, ink, and miscellaneous fillers and extenders applications.4/ Excludes shipments to Canada. Total sales were 685,000 tons in 1996 and 598,000 tons in 1997.5/ Includes kiln furniture (1996), plugs, taps, wads, and miscellaneous refractories.6/ Includes chemical manufacturing, filtering and clarifying oils, heavy clay products, and other unknown uses.7/ Includes absorbents, waterproofing and sealing, fillers and extenders, and pelletizing refractories, andmiscellaneous refractories.
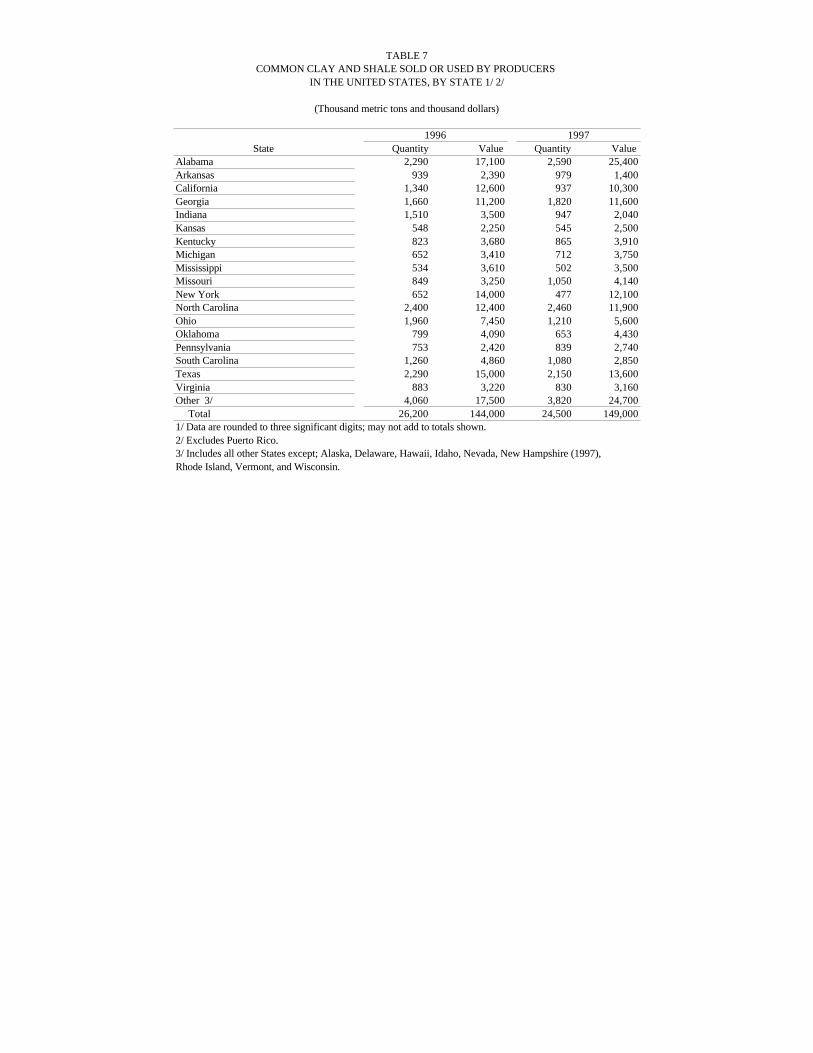
TABLE 7COMMON CLAY AND SHALE SOLD OR USED BY PRODUCERS
IN THE UNITED STATES, BY STATE 1/ 2/
(Thousand metric tons and thousand dollars)
1996 1997State Quantity Value Quantity Value
Alabama 2,290 17,100 2,590 25,400Arkansas 939 2,390 979 1,400California 1,340 12,600 937 10,300Georgia 1,660 11,200 1,820 11,600Indiana 1,510 3,500 947 2,040Kansas 548 2,250 545 2,500Kentucky 823 3,680 865 3,910Michigan 652 3,410 712 3,750Mississippi 534 3,610 502 3,500Missouri 849 3,250 1,050 4,140New York 652 14,000 477 12,100North Carolina 2,400 12,400 2,460 11,900Ohio 1,960 7,450 1,210 5,600Oklahoma 799 4,090 653 4,430Pennsylvania 753 2,420 839 2,740South Carolina 1,260 4,860 1,080 2,850Texas 2,290 15,000 2,150 13,600Virginia 883 3,220 830 3,160Other 3/ 4,060 17,500 3,820 24,700 Total 26,200 144,000 24,500 149,0001/ Data are rounded to three significant digits; may not add to totals shown.2/ Excludes Puerto Rico.3/ Includes all other States except; Alaska, Delaware, Hawaii, Idaho, Nevada, New Hampshire (1997), Rhode Island, Vermont, and Wisconsin.

TABLE 8COMMON CLAY AND SHALE SOLD OR USED BY PRODUCERS
IN THE UNITED STATES, BY USE 1/ 2/
(Metric tons)
Use 1996 1997 Ceramics and glass 3/ 142,000 158,000Civil engineering and sealing 279,000 W Floor and wall tile: Ceramic 293,000 318,000 Other 4/ 61,900 57,700Heavy clay products: Brick, extruded 11,300,000 10,900,000 Brick, other 1,730,000 1,940,000 Drain tile and sewer pipe 123,000 56,800 Flowerpots 47,400 W Flue linings 45,200 59,900 Structural tile 21,500 W Other 5/ 505,000 122,000Lightweight aggregate: Concrete block 2,450,000 2,550,000 Highway surfacing 245,000 278,000 Structural concrete 887,000 740,000 Miscellaneous 6/ 471,000 429,000Portland and other cements 7,000,000 5,720,000Refractories 7/ 519,000 619,000Miscellaneous 8/ 117,000 513,000 Total 26,199,488 24,466,984W Withheld to avoid disclosing company proprietary data; included with "Other" or"Miscellaneous."1/ Data are rounded to three significant digits; may not add to totals shown.2/ Excludes Puerto Rico.3/ Includes pottery and roofing granules.4/ Includes quarry tile and miscellaneous floor and wall tiles.5/ Includes flower pots (1997), roofing tile, structural tile, terra cotta, and miscellaneousclay products.6/ Includes miscellaneous lightweight aggregates.7/ Includes firebrick, blocks and shapes, grogs and calcines, mortar and cement, andmiscellaneous refractories.8/ Includes asphalt emulsions, civil engineering and sealing (1997), pelletizing (iron ore)(1996), exports, and other unknown uses.
TABLE 9FIRE CLAY SOLD OR USED BY PRODUCERS
IN THE UNITED STATES, BY STATE 1/ 2/
(Thousand metric tons and thousand dollars)
1996 1997State Quantity Value Quantity Value
Alabama 52 2,800 W W Missouri 223 3,220 291 4,270Ohio 103 3,230 301 4,310Other 3/ 127 1,450 57 874 Total 505 10,700 649 9,450W Withheld to avoid disclosing company proprietary data; included with "Other."1/ Refractory uses only.2/ Data are rounded to three significant digits; may not add to totals shown. 3/ Includes Arkansas (1996), California, Kentucky (1997), Montana (1996), New Mexico, Oklahoma (1996), and South Carolina (1996).
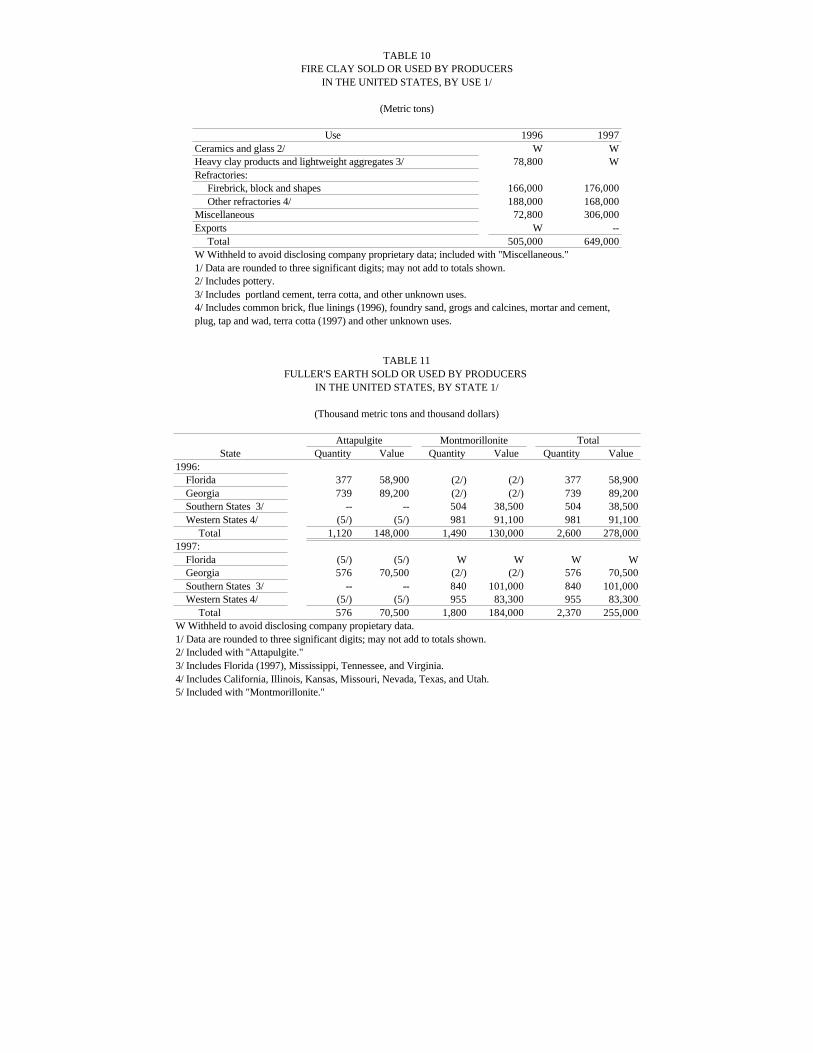
TABLE 10FIRE CLAY SOLD OR USED BY PRODUCERS
IN THE UNITED STATES, BY USE 1/
(Metric tons)
Use 1996 1997Ceramics and glass 2/ W W Heavy clay products and lightweight aggregates 3/ 78,800 W Refractories: Firebrick, block and shapes 166,000 176,000 Other refractories 4/ 188,000 168,000Miscellaneous 72,800 306,000Exports W -- Total 505,000 649,000W Withheld to avoid disclosing company proprietary data; included with "Miscellaneous."1/ Data are rounded to three significant digits; may not add to totals shown.2/ Includes pottery.3/ Includes portland cement, terra cotta, and other unknown uses.4/ Includes common brick, flue linings (1996), foundry sand, grogs and calcines, mortar and cement,plug, tap and wad, terra cotta (1997) and other unknown uses.
TABLE 11FULLER'S EARTH SOLD OR USED BY PRODUCERS
IN THE UNITED STATES, BY STATE 1/
(Thousand metric tons and thousand dollars)
Attapulgite Montmorillonite TotalState Quantity Value Quantity Value Quantity Value
1996: Florida 377 58,900 (2/) (2/) 377 58,900 Georgia 739 89,200 (2/) (2/) 739 89,200 Southern States 3/ -- -- 504 38,500 504 38,500 Western States 4/ (5/) (5/) 981 91,100 981 91,100 Total 1,120 148,000 1,490 130,000 2,600 278,0001997: Florida (5/) (5/) W W W W Georgia 576 70,500 (2/) (2/) 576 70,500 Southern States 3/ -- -- 840 101,000 840 101,000 Western States 4/ (5/) (5/) 955 83,300 955 83,300 Total 576 70,500 1,800 184,000 2,370 255,000W Withheld to avoid disclosing company propietary data.1/ Data are rounded to three significant digits; may not add to totals shown.2/ Included with "Attapulgite."3/ Includes Florida (1997), Mississippi, Tennessee, and Virginia.4/ Includes California, Illinois, Kansas, Missouri, Nevada, Texas, and Utah.5/ Included with "Montmorillonite."

TABLE 12FULLER'S EARTH SOLD OR USED BY PRODUCERS
IN THE UNITED STATES, BY USE 1/
(Metric tons)
Use 1996 1997 Absorbents: Oil and grease absorbent 258,000 274,000 Pet waste absorbent 1,530,000 1,470,000 Miscellaneous absorbent W W Animal feed 89,600 113,000Drilling mud 24,000 W Fertilizers 48,900 42,500Fillers, extenders, binders 2/ 76,600 73,000Filtering, clarifying, decolorizing, animal, mineral, vegetable oils, and greases 8,170 5,930Pesticides and related products 261,000 176,000Miscellaneous 3/ 145,000 173,000Exports 4/ 164,000 44,000 Total 2,600,000 2,370,000W Withheld to avoid disclosing company proprietary data; included with "Miscellaneous."1/ Data are rounded to three significant digits; may not add to totals shown.2/ Includes adhesives, asphalt tiles, gypsum products, medical, pharmaceutical and cosmetics (1996),paint, paper coating (1997), plastics (1996), asphalt emulsions, textiles, and other unknown uses.3/ Includes catalysts (oil-refining), roofing granules, chemical manufacturing (1996), portlandcement, refractories, waterproofing and sealing (1997), and other unknown uses.4/ Includes absorbents, fillers, extenders and binders, floor and wall tiles, refractories, and otherunknown uses.
TABLE 13KAOLIN SOLD OR USED BY PRODUCERS
IN THE UNITED STATES, BY STATE 1/
(Thousand metric tons and thousand dollars)
1996 1997State Quantity Value Quantity Value
Arkansas 161 W W W Florida 35 3,760 W W Georgia 8,040 1,050,000 8,300 981,000South Carolina 442 r/ 21,400 r/ 447 29,000Other 2/ 494 r/ 23,400 617 26,900 Total 9,180 r/ 1,100,000 r/ 9,410 1,040,000r/ Revised. W Withheld to avoid disclosing company proprietary data; included with "Otheror Total."1/ Data are rounded to three significant digits; may not add to totals shown.2/ Includes Alabama, California, Colorado, Minnesota (1996), Nevada, North Carolina, Pennsylvania, Tennessee, Texas, and items indicated by symbol W.
TABLE 14KAOLIN SOLD OR USED BY PRODUCERS
IN THE UNITED STATES, BY KIND 1/
(Thousand metric tons and thousand dollars)
1996 1997Kind Quantity Value Quantity Value
Airfloat 1,210 r/ 66,200 r/ 1,320 71,900Calcined 2/ 1,670 309,000 1,690 269,000Delaminated 1,520 191,000 1,440 146,000Unprocessed 450 8,430 296 7,090Water-washed 4,340 525,000 4,670 546,000 Total 9,180 r/ 1,100,000 r/ 9,410 1,040,000r/ Revised.1/ Data are rounded to three significant digits; may not add to totals shown.2/ Includes pigment-grade and refractory-grade calcined kaolin.
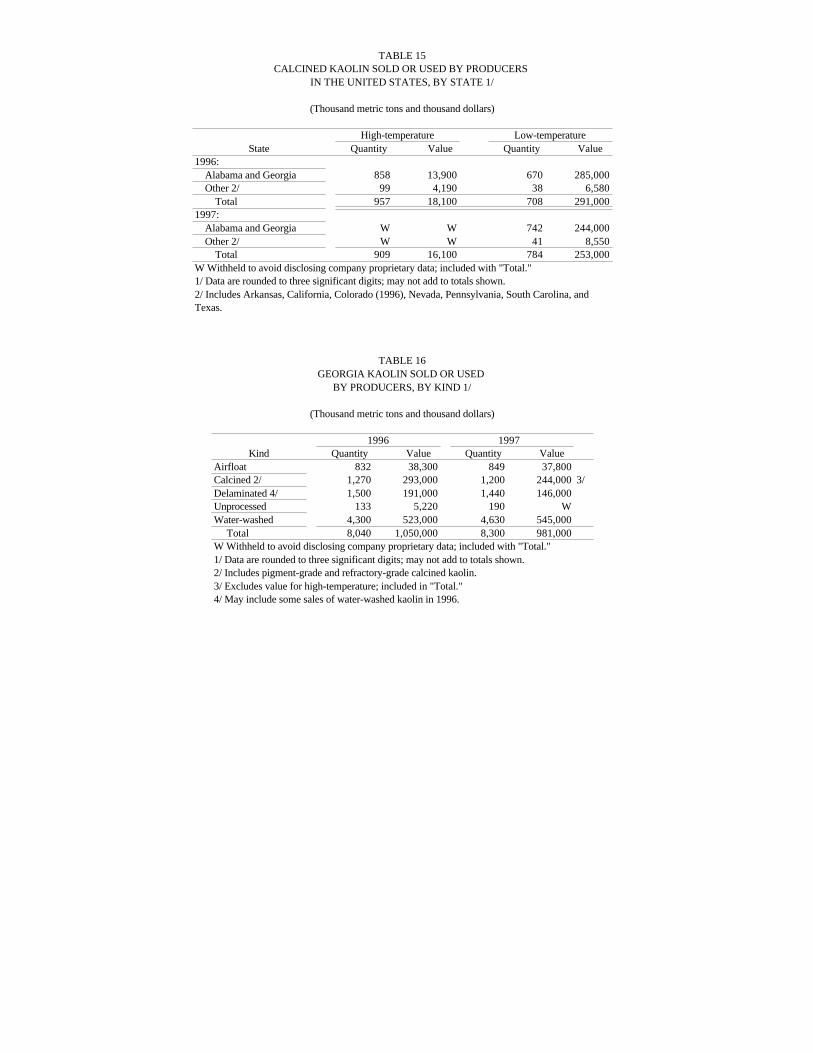
TABLE 15CALCINED KAOLIN SOLD OR USED BY PRODUCERS
IN THE UNITED STATES, BY STATE 1/
(Thousand metric tons and thousand dollars)
High-temperature Low-temperatureState Quantity Value Quantity Value
1996: Alabama and Georgia 858 13,900 670 285,000 Other 2/ 99 4,190 38 6,580 Total 957 18,100 708 291,0001997: Alabama and Georgia W W 742 244,000 Other 2/ W W 41 8,550 Total 909 16,100 784 253,000W Withheld to avoid disclosing company proprietary data; included with "Total."1/ Data are rounded to three significant digits; may not add to totals shown.2/ Includes Arkansas, California, Colorado (1996), Nevada, Pennsylvania, South Carolina, andTexas.
TABLE 16GEORGIA KAOLIN SOLD OR USED
BY PRODUCERS, BY KIND 1/
(Thousand metric tons and thousand dollars)
1996 1997Kind Quantity Value Quantity Value
Airfloat 832 38,300 849 37,800Calcined 2/ 1,270 293,000 1,200 244,000 3/Delaminated 4/ 1,500 191,000 1,440 146,000Unprocessed 133 5,220 190 W Water-washed 4,300 523,000 4,630 545,000 Total 8,040 1,050,000 8,300 981,000W Withheld to avoid disclosing company proprietary data; included with "Total."1/ Data are rounded to three significant digits; may not add to totals shown.2/ Includes pigment-grade and refractory-grade calcined kaolin.3/ Excludes value for high-temperature; included in "Total."4/ May include some sales of water-washed kaolin in 1996.

TABLE 17GEORGIA KAOLIN SOLD OR USED BY PRODUCERS, BY USE 1/ 2/
(Metric tons)
Use 1996 1997Domestic: Ceramics and glass: Catalysts (oil-refining) W W Electrical porcelain 5,930 W Fiber glass 418,000 429,000 Roofing granules 9,660 W Sanitaryware 64,200 W Other 3/ 234,000 319,000 Fillers, extenders, and binder: Adhesives 78,400 71,100 Paint 262,000 296,000 Paper coating 2,800,000 2,980,000 Paper filling 847,000 905,000 Plastic 31,000 33,600 Rubber 112,000 84,500 Other 4/ 86,500 98,400 Heavy clay products 5/ 20,900 46,600 Refractories 6/ 523,000 565,000 Undistributed 7/ 150,000 137,000 Total 5,650,000 5,970,000Exports: Paint 66,300 72,800 Paper coating 8/ 2,000,000 2,010,000 Paper filling 8/ 142,000 105,000 Rubber 8,570 7,020 Undistributed 9/ 185,000 138,000 Total 2,400,000 2,330,000 Grand total 8,040,000 8,300,000W Withheld to avoid disclosing company proprietary data; included with "Other" or "Undistributed."1/ Includes high-temperature calcined, low-temperature calcined, and delaminated.2/ Data are rounded to three significant digits; may not add to totals shown.3/ Includes crockery/earthenware, fine china/dinnerware, glazes, glass and enamels, pottery, and miscellaneous ceramics.4/ Includes asphalt emulsion, asphalt tile, fertilizers, gypsum products, medical, pharmaceutical and cosmetics, pesticides and related products, textiles and miscellaneous fillers, extenders and binders, and ink.5/ Includes brick (common and face), portland cement, and miscellaneous clay products.6/ Includes firebrick, blocks and shapes, grogs and calcines, high-alumina specialties, kiln furniture, and miscellaneous refractories.7/ Includes chemical manufacturing, civil engineering and sealings, drilling mud, filtering, clarifying, and decolorizing, floorand wall tiles, pet waste absorbents, and other unknown uses.8/ Some export sales may be included under Domestic sales.9/ Includes fiber glass, sanitaryware, ink, miscellaneous fillers, extenders and binders, and other unknown uses.

TABLE 18SOUTH CAROLINA KAOLIN SOLD OR USED BY PRODUCERS,
BY KIND 1/
(Thousand metric tons and thousand dollars)
1996 1997Kind Quantity r/ Value Quantity Value
Airfloat 276 20,000 r/ 390 27,500Unprocessed 2/ 166 1,460 57 1,540 Total 442 21,400 r/ 447 29,000r/ Revised.1/ Data are rounded to three significant digits; may not add to totals shown.2/ Includes pigment-grade calcined kaolin.
TABLE 19SOUTH CAROLINA KAOLIN SOLD OR USED
BY PRODUCERS, BY KIND AND USE 1/
(Metric tons)
Kind and use 1996 1997 Adhesives W 14,800Animal feed and pet waste absorbent W W Ceramics 2/ 18,900 r/ 24,400Fertilizers, pesticides and related products 5,220 W Fiber glass W W Paper coating and filling 8,290 W Plastics W 5,290Rubber 119,000 r/ 133,000Refractories 3/ 10,200 10,300Other uses 4/ 253,000 r/ 201,000Exports 5/ 27,400 r/ 57,500 Total 442,000 r/ 447,000r/ Revised. W Withheld to avoid disclosing company proprietary data; included with "Other uses."1/ Data are rounded to three significant digits; may not add to totals shown.2/ Includes crockery and earthenware (1996), fine china/dinnerware, floor and wall tile, pottery,roofing granules, and sanitaryware (1997).3/ Includes refractory calcines and grogs, firebrick, blocks and shapes, refractory mortar and cement(1996), and high-alumina refractories.4/ Includes brick (face and common), catalysts (oil refining), asphalt emulsion, asphalt tile (1997),gypsum products, and unknown uses.5/ Includes paint, paper filling, and rubber.

TABLE 20KAOLIN SOLD OR USED BY PRODUCERS IN THE UNITED STATES, BY USE 1/
(Metric tons)
Use 1996 1997Domestic: Ceramics: Catalyst (oil and gas refining) 212,000 227,000 Electrical porcelain 12,300 13,700 Fine china and dinnerware 26,400 19,800 Floor and wall tile 31,800 33,400 Pottery 25,700 27,100 Roofing granules 21,300 22,900 Sanitaryware 72,100 53,700 Miscellaneous 100,000 66,700 Chemical manufacture W W Civil engineering 7,780 6,930 Glass fiber, mineral wool 458,000 496,000 Filler, extender, binder: Adhesive 93,700 r/ 85,900 Fertilizer W 5,200 Medical, pharmaceutical cosmetic W W Paint 288,000 329,000 Paper coating 2,810,000 2,990,000 Paper filling 854,000 918,000 Pesticide 16,700 19,000 Plastic 36,300 38,900 Rubber 231,000 r/ 218,000 Miscellaneous 94,500 r/ 114,000 Heavy clay products: Brick, common and face 214,000 105,000 Portland cement W 71,000 Refractories: Firebrick, block and shapes 565,000 13,700 Grogs and calcines 173,000 867,000 High alumina brick, specialties, kiln furniture 86,800 45,700 Foundry sand, mortar, cement, miscellaneous refractories 78,000 73,300 Miscellaneous applications 231,000 163,000 Total 6,740,000 r/ 7,020,000Exports: Ceramics 179,000 129,000 Foundry sand, grogs and calcines; other refractories W W Paint 66,300 72,800 Paper coating 2,000,000 2,010,000 Paper filling 142,000 105,000 Rubber 35,800 64,600 Miscellaneous 19,900 10,500 Total 2,440,000 2,390,000 Grand total 9,180,000 r/ 9,410,000r/ Revised. W Withheld to avoid disclosing company proprietary data; included with "Miscellaneous" or "Miscellaneousapplications."1/ Data are rounded to three significant digits; may not add to totals shown.
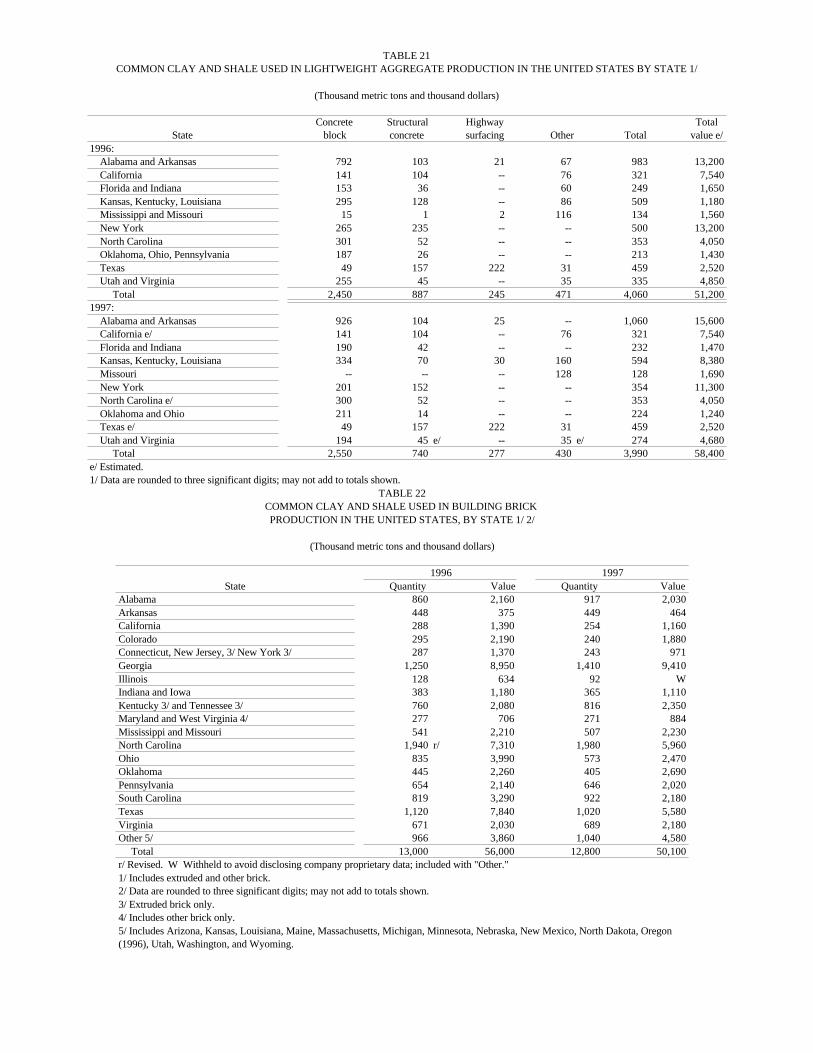
TABLE 21COMMON CLAY AND SHALE USED IN LIGHTWEIGHT AGGREGATE PRODUCTION IN THE UNITED STATES BY STATE 1/
(Thousand metric tons and thousand dollars)
Concrete Structural Highway TotalState block concrete surfacing Other Total value e/
1996: Alabama and Arkansas 792 103 21 67 983 13,200 California 141 104 -- 76 321 7,540 Florida and Indiana 153 36 -- 60 249 1,650 Kansas, Kentucky, Louisiana 295 128 -- 86 509 1,180 Mississippi and Missouri 15 1 2 116 134 1,560 New York 265 235 -- -- 500 13,200 North Carolina 301 52 -- -- 353 4,050 Oklahoma, Ohio, Pennsylvania 187 26 -- -- 213 1,430 Texas 49 157 222 31 459 2,520 Utah and Virginia 255 45 -- 35 335 4,850 Total 2,450 887 245 471 4,060 51,2001997: Alabama and Arkansas 926 104 25 -- 1,060 15,600 California e/ 141 104 -- 76 321 7,540 Florida and Indiana 190 42 -- -- 232 1,470 Kansas, Kentucky, Louisiana 334 70 30 160 594 8,380 Missouri -- -- -- 128 128 1,690 New York 201 152 -- -- 354 11,300 North Carolina e/ 300 52 -- -- 353 4,050 Oklahoma and Ohio 211 14 -- -- 224 1,240 Texas e/ 49 157 222 31 459 2,520 Utah and Virginia 194 45 e/ -- 35 e/ 274 4,680 Total 2,550 740 277 430 3,990 58,400e/ Estimated.1/ Data are rounded to three significant digits; may not add to totals shown.
TABLE 22COMMON CLAY AND SHALE USED IN BUILDING BRICK PRODUCTION IN THE UNITED STATES, BY STATE 1/ 2/
(Thousand metric tons and thousand dollars)
1996 1997State Quantity Value Quantity Value
Alabama 860 2,160 917 2,030Arkansas 448 375 449 464California 288 1,390 254 1,160Colorado 295 2,190 240 1,880Connecticut, New Jersey, 3/ New York 3/ 287 1,370 243 971Georgia 1,250 8,950 1,410 9,410Illinois 128 634 92 W Indiana and Iowa 383 1,180 365 1,110Kentucky 3/ and Tennessee 3/ 760 2,080 816 2,350Maryland and West Virginia 4/ 277 706 271 884Mississippi and Missouri 541 2,210 507 2,230North Carolina 1,940 r/ 7,310 1,980 5,960Ohio 835 3,990 573 2,470Oklahoma 445 2,260 405 2,690Pennsylvania 654 2,140 646 2,020South Carolina 819 3,290 922 2,180Texas 1,120 7,840 1,020 5,580Virginia 671 2,030 689 2,180Other 5/ 966 3,860 1,040 4,580 Total 13,000 56,000 12,800 50,100r/ Revised. W Withheld to avoid disclosing company proprietary data; included with "Other."1/ Includes extruded and other brick.2/ Data are rounded to three significant digits; may not add to totals shown.3/ Extruded brick only.4/ Includes other brick only.5/ Includes Arizona, Kansas, Louisiana, Maine, Massachusetts, Michigan, Minnesota, Nebraska, New Mexico, North Dakota, Oregon(1996), Utah, Washington, and Wyoming.
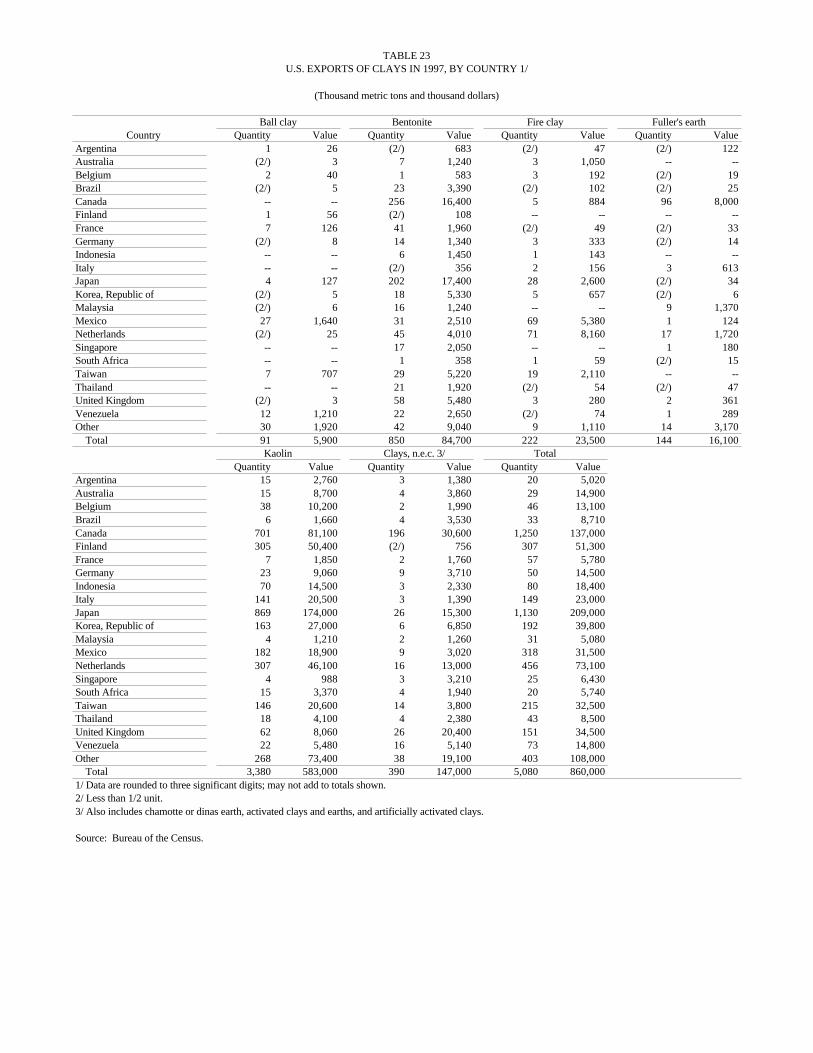
TABLE 23U.S. EXPORTS OF CLAYS IN 1997, BY COUNTRY 1/
(Thousand metric tons and thousand dollars)
Ball clay Bentonite Fire clay Fuller's earth Country Quantity Value Quantity Value Quantity Value Quantity Value Argentina 1 26 (2/) 683 (2/) 47 (2/) 122Australia (2/) 3 7 1,240 3 1,050 -- -- Belgium 2 40 1 583 3 192 (2/) 19Brazil (2/) 5 23 3,390 (2/) 102 (2/) 25Canada -- -- 256 16,400 5 884 96 8,000Finland 1 56 (2/) 108 -- -- -- -- France 7 126 41 1,960 (2/) 49 (2/) 33Germany (2/) 8 14 1,340 3 333 (2/) 14Indonesia -- -- 6 1,450 1 143 -- -- Italy -- -- (2/) 356 2 156 3 613Japan 4 127 202 17,400 28 2,600 (2/) 34Korea, Republic of (2/) 5 18 5,330 5 657 (2/) 6Malaysia (2/) 6 16 1,240 -- -- 9 1,370Mexico 27 1,640 31 2,510 69 5,380 1 124Netherlands (2/) 25 45 4,010 71 8,160 17 1,720Singapore -- -- 17 2,050 -- -- 1 180South Africa -- -- 1 358 1 59 (2/) 15Taiwan 7 707 29 5,220 19 2,110 -- -- Thailand -- -- 21 1,920 (2/) 54 (2/) 47United Kingdom (2/) 3 58 5,480 3 280 2 361Venezuela 12 1,210 22 2,650 (2/) 74 1 289Other 30 1,920 42 9,040 9 1,110 14 3,170 Total 91 5,900 850 84,700 222 23,500 144 16,100
Kaolin Clays, n.e.c. 3/ TotalQuantity Value Quantity Value Quantity Value
Argentina 15 2,760 3 1,380 20 5,020Australia 15 8,700 4 3,860 29 14,900Belgium 38 10,200 2 1,990 46 13,100Brazil 6 1,660 4 3,530 33 8,710Canada 701 81,100 196 30,600 1,250 137,000Finland 305 50,400 (2/) 756 307 51,300France 7 1,850 2 1,760 57 5,780Germany 23 9,060 9 3,710 50 14,500Indonesia 70 14,500 3 2,330 80 18,400Italy 141 20,500 3 1,390 149 23,000Japan 869 174,000 26 15,300 1,130 209,000Korea, Republic of 163 27,000 6 6,850 192 39,800Malaysia 4 1,210 2 1,260 31 5,080Mexico 182 18,900 9 3,020 318 31,500Netherlands 307 46,100 16 13,000 456 73,100Singapore 4 988 3 3,210 25 6,430South Africa 15 3,370 4 1,940 20 5,740Taiwan 146 20,600 14 3,800 215 32,500Thailand 18 4,100 4 2,380 43 8,500United Kingdom 62 8,060 26 20,400 151 34,500Venezuela 22 5,480 16 5,140 73 14,800Other 268 73,400 38 19,100 403 108,000 Total 3,380 583,000 390 147,000 5,080 860,0001/ Data are rounded to three significant digits; may not add to totals shown.2/ Less than 1/2 unit.3/ Also includes chamotte or dinas earth, activated clays and earths, and artificially activated clays.
Source: Bureau of the Census.

TABLE 24U.S. IMPORTS FOR CONSUMPTION OF CLAY IN 1997, BY KIND 1/
Quantity Value Kind (metric tons) (thousands)
China clay or kaolin: Brazil 17,400 $2,760 China 3,230 621 New Zealand 1,380 873 United Kingdom 8,030 2,720 Other 342 290 Total 30,400 7,270 Fire clay: Canada 25 17 France 23 37 United Kingdom 13 4 Other 8 22 Total 69 79 Decolorizing earths and fuller's earth: Canada 3,290 342 France 220 109 Netherlands 2 11 Switzerland 20 11 Total 3,530 473 Bentonite: Canada 1,190 348 Japan 1,640 156 Mexico 978 223 United Kingdom 2,740 1,600 Other 953 478 Total 7,560 2,810 Common blue clay and other ball clay: Germany 30 30 United Kingdom 793 231 Total 823 261 Other clay: Canada 629 254 Italy 194 73 South Africa 519 728 United Kingdom 1,140 494 Other 245 494 Total 2,720 2,040 Chamotte or dina's earth: Denmark 33 14 Artificially activated clay and activated earth: Austria 751 992 Canada 985 727 Germany 1,110 1,660 Mexico 14,600 4,920 Other 1,110 2,010 Total 18,600 10,300 Grand total 63,700 23,2001/ Data are rounded to three significant digits; may not add to totals shown.
Source: Bureau of the Census.

TABLE 25BENTONITE: WORLD PRODUCTION, BY COUNTRY 1/ 2/
(Metric tons)
Country 3/ 1993 1994 1995 1996 1997 e/Algeria 4/ 20,833 20,215 17,088 r/ 17,200 r/ 17,000Argentina 96,706 313,407 r/ 111,011 r/ 134,588 r/ 140,000Armenia 50 e/ 100 e/ 110 2,750 2,750Australia e/ 4/ 35,000 35,000 35,000 35,000 35,000Bosnia and Herzegovina e/ 800 800 800 800 800Brazil (beneficiated) 113,180 r/ 144,950 r/ 150,000 r/ 186,000 r/ 180,000Bulgaria 78,000 76,300 125,800 118,212 120,000Burma 200 795 2,655 2,600 e/ 2,500Chile 989 1,213 684 r/ 1,191 r/ 1,200Croatia 10,000 e/ 10,391 7,327 9,728 7,331 5/Cyprus 51,689 46,530 49,487 r/ 70,600 r/ 71,000Czech Republic 63,000 65,000 54,000 59,000 110,000 5/Egypt 6,013 2,379 1,930 r/ 2,210 r/ 2,200France e/ 6,000 7,000 -- -- --Georgia e/ 13,000 13,000 13,000 13,000 5/ 12,000 5/Germany 473,102 499,000 r/ 529,000 r/ 491,000 r/ 500,000Greece 677,578 697,773 1,115,119 973,517 r/ 950,000Guatemala e/ 12,300 4,408 5/ 4,500 4,500 4,500Hungary 9,404 14,700 22,792 15,376 14,848 5/Indonesia 13,707 14,409 26,057 26,000 e/ 25,000Iran 6/ 53,667 r/ 71,759 r/ 54,798 r/ 85,000 e/ 85,000Italy 327,000 386,000 591,000 r/ 475,000 r/ 500,000Japan 517,389 484,115 478,056 468,728 487,670 5/Macedonia e/ 35,000 30,000 30,000 30,000 30,000Mexico 94,600 100,000 e/ 72,599 69,810 r/ 111,503 5/Morocco 10,811 24,919 29,308 39,680 r/ 49,633 5/Mozambique e/ 100 3,349 5/ 3,000 3,000 3,000New Zealand (processed) 1,613 930 3,699 13,734 r/ 14,000Pakistan 7,991 11,180 5,759 15,290 12,000Peru 10,250 27,682 26,961 18,592 18,600Philippines 5,050 3,415 r/ 7,636 r/ 8,000 r/ e/ 8,000Poland 19,800 19,900 6,300 r/ 8,000 r/ 10,000Romania 50,000 e/ 41,056 42,277 43,543 r/ 27,133 5/Serbia and Montenegro 110 215 192 95 100South Africa 7/ 50,441 71,773 70,927 48,076 30,615 5/Spain 162,405 179,233 172,265 r/ 151,155 r/ 150,000Tanzania e/ 70 70 70 75 r/ 75Turkey 456,597 516,187 602,499 600,000 e/ 600,000Turkmenistan e/ 50,000 50,000 50,000 50,000 50,000U.S.S.R. e/ 8/ 1,600,000 1,300,000 1,300,000 1,200,000 1,100,000United States 2,870,000 3,290,000 3,820,000 3,740,000 4,020,000 5/Zimbabwe 7/ 113,470 r/ 169,097 169,823 r/ 185,953 r/ 170,000 Total 8,120,000 r/ 8,750,000 r/ 9,800,000 r/ 9,420,000 r/ 9,680,000e/ Estimated. r/ Revised. 1/ World totals, U.S. data, and estimated data are rounded to three significant digits; may not add to totals shown.2/ Table includes data available through July 15, 1998.3/ In addition to the countries listed, Canada and China are believed to produce bentonite, but output is not reported, and available information is inadequate tomake reliable estimates of ouput levels.4/ Includes bentonitic clays.5/ Reported figure.6/ Year beginning March 21 of that stated.7/ May include other clays.8/ Dissolved in December 1991; however, information is inadequate to formulate reliable estimates for individual countries, except Armenia, Georgia, andTurkmenistan.

TABLE 26 FULLER'S EARTH: WORLD PRODUCTION, BY COUNTRY 1/ 2/
(Metric tons)
Country 3/ 1993 1994 1995 1996 1997 e/Algeria 3,229 4,550 4,500 e/ 4,500 e/ 4,500Argentina e/ 1,600 1,600 1,600 1,500 1,500Australia (attapulgite) e/ 15,000 15,000 15,000 15,000 15,000Germany (unprocessed) e/ 670,000 498,000 600,000 600,000 600,000Italy 30,000 e/ 24,000 r/ 34,000 r/ 26,000 r/ 30,000Mexico 36,068 21,377 15,755 41,800 r/ 51,430 4/Morocco (smectite) 38,680 22,782 15,027 16,623 17,000Pakistan 20,941 15,335 12,862 13,415 14,000Senegal (attapulgite) e/ 119,000 119,000 120,000 120,000 100,000South Africa (attapulgite) 7,030 10,230 8,049 14,318 9,017 4/Spain (attapulgite) 98,336 91,124 94,266 r/ 94,000 r/ 94,000United Kingdom 5/ 187,100 134,000 132,300 143,000 r/ e/ 140,000United States 6/ 2,450,000 2,640,000 2,640,000 2,600,000 2,370,000 Total 3,680,000 3,600,000 3,690,000 3,690,000 r/ 3,450,000e/ Estimated. r/ Revised. 1/ World totals, U.S. data, and estimated data are rounded to three significant digits; may not add to totals shown.2/ Excludes centrally planned economy countries and former such countries, some of which presumably produce fuller's earth, but for which no information is available. Table includes data available through July 9, 1998.3/ In addition to the market economy countries listed, France, India, Iran, Japan, and Turkey have reportedly produced fuller's earth in the pastand may continue to do so, but output is not reported, and available information is inadequate to make reliable estimates of output levels.4/ Reported figure.5/ Salable product.6/ Sold or used by producers.

TABLE 27KAOLIN: WORLD PRODUCTION, BY COUNTRY 1/ 2/
(Metric tons)
Country 3/ 1993 1994 1995 1996 1997 e/Algeria 12,586 16,984 24,068 24,000 e/ 25,000Argentina 42,052 50,471 39,860 r/ 64,241 r/ 60,000Australia (includes ball clay) e/ 180,000 200,000 210,000 210,000 220,000Austria (marketable) 64,381 65,000 57,000 60,000 e/ 60,000Bangladesh 4/ 7,500 3,283 6,541 7,000 e/ 7,200Belgium e/ 300,000 300,000 300,000 300,000 300,000Bosnia and Herzegovina e/ 3,000 3,000 3,000 3,000 3,000Brazil (beneficiated) 916,048 r/ 1,037,570 r/ 1,067,109 r/ 1,105,000 r/ 1,100,000Bulgaria 111,000 115,000 115,000 e/ 115,000 e/ 115,000Burundi e/ 5,000 5,000 1,000 1,000 1,000Chile 66,939 73,081 10,845 r/ 13,452 r/ 13,000Colombia (includes common clay) 2,097,491 6,700,000 7,300,000 7,300,000 r/ e/ 7,500,000Czech Republic 2,336,000 2,706,000 r/ 2,800,000 r/ 2,798,000 r/ 2,982,000 5/Denmark (sales) e/ 3,500 3,500 3,500 3,000 3,000Ecuador 12,000 6,883 8,000 7,000 e/ 7,000Egypt 184,004 180,000 e/ 293,381 r/ 115,409 r/ 120,000Eritrea XX 5,231 3,200 r/ e/ 2,620 2,500Ethiopia e/ 6/ 500 8 r/ e/ 15 r/ e/ 15 r/ e/ 15France (marketable) 295,000 e/ 327,000 345,000 326,000 r/ 330,000Germany 981,000 e/ 1,631,000 1,925,000 r/ 1,800,000 r/ 1,800,000Greece 89,473 r/ 117,254 68,682 r/ 60,453 r/ 65,000Guatemala e/ 3,000 3,000 3,100 3,100 3,200Hungary (processed) 15,000 5,000 4,847 5,000 e/ 5,000India: Processed 129,271 134,002 r/ 160,689 r/ 183,268 r/ 190,000 Saleable crude 518,629 548,467 r/ 552,128 r/ 557,778 r/ 550,000Indonesia 42,365 53,236 14,373 15,000 e/ 16,000Iran 254,413 227,650 r/ 265,591 r/ 250,000 e/ 250,000Israel e/ 40,000 5/ 40,000 40,000 40,000 40,000Italy: Kaolinitic earth e/ 15,000 7,000 10,000 10,000 9,000Japan 110,318 138,412 182,122 141,230 110,915 5/Korea, Republic of 2,328,921 2,675,485 2,792,139 2,501,600 r/ 2,688,489 5/Madagascar e/ 1,000 1,200 1,545 5/ 1,500 1,500Malaysia 249,852 252,628 211,182 209,562 187,411 5/Mexico 216,000 193,034 221,685 253,971 r/ 552,840 5/New Zealand 26,543 40,720 13,662 26,325 r/ 26,000Nigeria e/ 1,300 105,000 105,000 r/ 105,000 r/ 110,000Pakistan 37,179 47,894 30,746 54,860 55,000Paraguay e/ 74,000 74,000 66,300 5/ 74,000 65,000Peru 5,100 5,100 8,445 14,295 14,300Poland (washed) 47,900 52,600 r/ 53,000 71,700 r/ 70,000Portugal 178,285 r/ 181,933 r/ 180,000 r/ e/ 180,000 r/ e/ 180,000Romania 50,000 e/ 47,566 49,024 45,199 r/ 29,169 5/Serbia and Montenegro: Crude 37,627 69,927 56,926 55,000 e/ 55,000 Washed 4,800 7,110 4,900 5,000 e/ 5,000Slovakia 25,000 24,100 13,300 23,240 24,000Slovenia: e/ Crude 10,000 10,000 10,000 10,000 10,000 Washed 4,000 4,000 4,000 7,000 7,000South Africa 147,349 131,863 146,587 146,496 140,218 5/Spain (marketable): 7/ Crude and washed 284,382 337,339 316,074 r/ 315,000 r/ e/ 315,000Sri Lanka 7,000 e/ 7,500 e/ 16,000 r/ 7,700 r/ 7,600Sweden e/ 100 100 100 100 100Taiwan e/ 100,000 100,000 100,000 100,000 100,000Thailand (beneficiated) 397,330 417,064 460,629 553,770 r/ 367,000Turkey 210,356 179,775 489,635 490,000 r/ e/ 500,000Ukraine 1,100,000 e/ 1,015,000 950,000 900,000 e/ 850,000United Kingdom (sales) 8/ 2,577,160 2,653,918 2,585,881 2,281,000 r/ 2,400,000United States 9/ 8,830,000 8,770,000 9,480,000 9,120,000 9,410,000 5/See footnotes at end of table.

TABLE 27--ContinuedKAOLIN: WORLD PRODUCTION, BY COUNTRY 1/ 2/
(Metric tons)
Country 3/ 1993 1994 1995 1996 1997 e/Uzbekistan e/ 5,500,000 5,500,000 5,500,000 5,500,000 5,500,000Venezuela 22,000 10,345 3,020 7,542 r/ 8,225 5/Vietnam e/ 800 1,000 1,000 1,000 1,000Zimbabwe 90 e/ 462 57 -- r/ -- Total 31,300,000 r/ 37,600,000 r/ 39,700,000 r/ 38,600,000 39,600,000e/ Estimated. r/ Revised. XX Not applicable.1/ World totals, U.S. data, and estimated data are rounded to three significant digits; may not add to totals shown.2/ Table includes data available through July 9, 1998.3/ In addition to the countries listed, China, Morocco, and Suriname may also have produced kaolin, but information is inadequate to make reliableestimates of output levels.4/ Data for year ending June 30 of that stated.5/ Reported figure.6/ Data for year ending July 7 of that stated.7/ Includes crude and washed kaolin and refractory clays not further described.8/ Dry weight.9/ Kaolin sold or used by producers.