
GVANTSA SHANSHIASHVILI
60
VYTAUTAS MAGNUS UNIVERSITY FACULTY OF NATURAL SCIENCE DEPARTMENT OF BIOLOGY GVANTSA SHANSHIASHVILI NUTRITIONAL VALUE AND BIOACTIVITY ASSESSMENT METHODS OF BEVERAGE AND WINES (GĖRIMŲ IR VYNŲ MAISTINĖS VERTĖS IR BIOAKTYVUMO VERTINIMO METODAI) Master final Thesis Applied Biotechnology study programme, state code 6211FX013 Supervisor: Prof., Habil. Dr. Audrius Sigitas Maruška _______ _____ (signature) (date) Defended: Prof., Saulius Mickevicius _______ _____ (Dean of Faculty/Director of Institute/ Head of Group of Programmes) (signature) (date) KAUNAS, 2021
Transcript of GVANTSA SHANSHIASHVILI

VYTAUTAS MAGNUS UNIVERSITY
FACULTY OF NATURAL SCIENCE
DEPARTMENT OF BIOLOGY
GVANTSA SHANSHIASHVILI
NUTRITIONAL VALUE AND BIOACTIVITY ASSESSMENT METHODS OF
BEVERAGE AND WINES
(GĖRIMŲ IR VYNŲ MAISTINĖS VERTĖS IR BIOAKTYVUMO
VERTINIMO METODAI)
Master final Thesis
Applied Biotechnology study programme, state code 6211FX013
Supervisor: Prof., Habil. Dr. Audrius Sigitas Maruška _______ _____
(signature) (date)
Defended: Prof., Saulius Mickevicius _______ _____
(Dean of Faculty/Director of Institute/ Head of Group of Programmes) (signature) (date)
KAUNAS, 2021
2
CONTENTS
List of tables .............................................................................................................................................. 6
List of figures ............................................................................................................................................ 7
Introduction ............................................................................................................................................... 8
1. Review of Literature......................................................................................................................... 11
1.1 Fermentation role in beverages ......................................................................................................... 12
1.1.1 Different types of winemaking technology .................................................................................... 15
1.2 Wine and beer nutritional value ........................................................................................................ 16
1.3 Active compounds of beverages. ...................................................................................................... 19
1.4 Non-Alcoholic Beverages ................................................................................................................. 24
2. Materials and Methods ........................................................................................................................ 26
2.1 Screening bioactive compounds from natural product and their preparations using capillary
electrophoresis. ........................................................................................................................................ 26
2.2High-performance liquid chromatography (HPLC) for oligomers and polymers separation ............ 28
2.3 Determination of phenolic compounds by Liquid chromatography-tandem mass spectrometry (LC-
MS/MS) ................................................................................................................................................... 30
2.4 Spectrophotometry method ............................................................................................................... 31
2.4.1 Determination of Total polyphenols in beer and wort ................................................................... 31
2.4.2 Determination of Total polyphenols in Wines by Folin Denis’ reagent ........................................ 34
2.4.3 Determination of Total flavonoids by using AlCl3 method ........................................................... 36
2.4.4 Determination of Total polyphenols in fresh and commercial juices by Folin Ciocalteus’
method ..................................................................................................................................................... 38
2.5 Inductively Coupled Plasma Optical Emission spectroscopy for measuring Elements .................... 40
2.6 Statistical data analysis by SPSS Software ....................................................................................... 42
Results & Discussion .............................................................................................................................. 43
Conclusions ............................................................................................................................................. 52
References ............................................................................................................................................... 53

3
The full title of Master Thesis: Nutritional value and bioactivity assessment methods
of beverage and wines.
Gėrimų ir vynų maistinės vertės ir bioaktyvumo vertinimo metodai.
Number of pages 60
Number of Tables 11
Number of figures 15
Supervisor: Prof., Habil. Dr. Audrius Sigitas Maruška
Presented at: Vytautas Magnus University, Faculty of Natural Sciences,
Applied Biotechnology, Kaunas, 26.05.2021

4
Summary
In recent times, beverages are more widely regarded as functional food. There has been growing
recognition of the key role of foods and beverages in disease prevention, treatment and its important role
in assessing the medicinal properties is due to the biologically active substances of beverages, such as
phenolic compounds, organic acids, amino acids, etc.
Beverages are an excellent source for nutrients and bioactive compounds, including plant
extracts, fiber, prebiotics and probiotics, vitamins, minerals, antioxidants, ω‐3 fatty acids. Bioactive
compounds have an effect on the body as whole or specific tissues or cells.
Bioactive compounds are capable of modulating metabolic processes and demonstrate positive
properties such as antioxidant effect, inhibition of receptor activities, inhibition or induction of enzyme,
and induction and inhibition of gene expression.
Nowadays, increasing attention to polyphenols is due to the prevention of cancer, oxidative
stress-associated diseases. Apart from antioxidant activities, polyphenols are a key role in biological
functions, including cardiovascular diseases and modulation of carcinogenesis.
The food and nutritional sciences can further help us to understand the influence of food on
disease risk, pathogenesis, progression, and outcomes in obesogenic, carcinogenic, atherosclerotic,
atherogenic, toxic and teratogenic environments.
Nutritional value and biologically active compounds concentration differs in alcoholic or non-
alcoholic beverages and depends on biotic/abiotic factors, fermentation, and overall technology types
For bioactivity assessment, Capillary Electrophoresis, HPLC for oligomers and polymers
separation, Liquid chromatography-mass spectrometry method, and spectrophotometry methods were
used.
We examined the total polyphenols content in beer wort, beer, wines, fresh and commercial
juices, by Folin–Ciocalteu/Denis’ method, flavonoids by AlCl3 method in different types of wines, and
Elements in white and red wines with Inductively Coupled Plasma Optical Emission spectroscopy.
Keywords: Biologically active compounds, Beverages, HPLC, Nutritional Value,
Spectrophotometry method, Wine.
5
Santrauka
Pastaruoju metu gėrimai plačiau vertinami kaip funkcinis maistas. Vis labiau pripažįstamas
pagrindinis maisto produktų ir gėrimų vaidmuo ligų prevencijoje, gydyme, o svarbų vaidmenį vertinant
gydomąsias savybes lemia biologiškai aktyvios gėrimų medžiagos, tokios kaip fenolio junginiai,
organinės rūgštys, amino rūgštys ir kt.
Gėrimai yra puikus maistinių medžiagų ir bioaktyvių junginių, įskaitant augalų ekstraktus,
skaidulas, prebiotikus ir probiotikus, vitaminus, mineralus, antioksidantus, ω - 3 riebalų rūgštis, šaltinis.
Bioaktyvūs junginiai turi poveikį visam kūnui arba tam tikriems audiniams ar ląstelėms.
Bioaktyvūs junginiai gali moduliuoti medžiagų apykaitos procesus ir pasižymi tokiomis teigiamomis
savybėmis kaip antioksidacinis poveikis, receptorių veiklos slopinimas, fermentų slopinimas ar indukcija
ir genų ekspresijos indukcija bei slopinimas.
Šiais laikais vis daugiau dėmesio polifenoliams lemia vėžio, su oksidaciniu stresu susijusių ligų
prevencija. Be antioksidacinės veiklos, polifenoliai yra pagrindinis vaidmuo atliekant biologines
funkcijas, įskaitant širdies ir kraujagyslių ligas bei kancerogenezės moduliavimą. Maisto ir mitybos
mokslai gali mums padėti suprasti maisto įtaką ligų rizikai, patogenezei, progresavimui ir nutukimo,
kancerogeno, aterosklerozės, aterogeno, toksiškumo pasekmėms teratogeninėje aplinkoje. Paprastai
mitybos vertinimo metodai yra pagrįsti dietiniais, laboratoriniais-biocheminiais, antropometriniais ir
klinikiniais stebėjimais.
Maisto ir mitybos mokslai gali mums padėti suprasti maisto įtaką ligų rizikai, patogenezei, ligų
progresavimui ir nutukimo, kancerogeno, aterosklerozės, aterogeno, toksiškumo pasekmėms
teratogeninėje aplinkoje. Maistinė vertė ir biologiškai aktyvių junginių koncentracija skiriasi
alkoholiniuose ar nealkoholiniuose gėrimuose. Tai taip priklauso nuo biotinių ir abiotinių veiksnių,
fermentacijos bei gamybos technologijos rūšių.
Bioaktyvumui įvertinti buvo naudojama kapiliarinė elektroforezė, HPLC oligomerų ir polimerų
atskyrimui, skysčių chromatografijos - masių spektrometrijos ir spektrofotometrijos metodai.
Mes ištyrėme bendrą polifenolių kiekį alaus misoje, aluje, vynuose, šviežiose ir komercinėse
sultyse Folin – Ciocalteu / Denis metodu, flavonoidus AlCl3 metodu skirtingų tipų vynuose ir elementus
baltuose ir raudonuose vynuose su induktyviai sujungta plazmos emisijos spektroskopija.
Reikšminiai žodžiai: Biologiškai aktyvūs junginiai, Gėrimai, HPLC, Maistinė vertė, Spektrofotometrijos metodas, Vynas.

6
List of tables
Table 1. Lager and Pilsner type beer some parameters produced by 5 types of malt
Table 2. Wine samples and dilutions.
Table 3. Fresh and commercial juices for analysis.
Table 4. Total polyphenols (mg/L) concentration in beer wort.
Table 5. Total polyphenols (mg/L) concentration in ready beer bottles.
Table 6. Total polyphenols (g/L) in different types of wine.
Table 7. Total Flavonoids concentration (mg/L) in different types of wine.
Table 8. Elements in wines (mg/ml)
Table 9. Elements in wines (mg/ml)
Table 10. Elements in wines (mg/ml)
Table 11. Total polyphenols Concentration (mg/ml) in fresh and commercial juices.

7
List of figures
Fig 1. Saccharomyces cerevisiae in production of fermented beverages
Fig 2. Classification of phenolic compounds.
Fig 3. Wine phenolic compounds.
Fig 4. Basic structure of flavonoids.
Fig 5. Samples for measuring spectrophotometrically
Fig. 6 Wine filtration process.
Fig 7. samples for measuring spectrophotometrically
Fig 8. Samples for the standard calibration curve (quercetin)
Fig 9. Total polyphenols (mg/L) concentration in beer wort made by 5 types malt.
Fig. 10 Total polyphenols (mg/L) concentration in ready beer bottles.
Fig 11. Total polyphenols (g/L) in different types of wine.
Fig 12. Total Flavonoids concentration (mg/L) in different types of wine.
Fig. 13 Elements in wines (mg/ml)
Fig 14. Elements in wines (mg/ml)
Fig 15. Elements in wines (mg/ml)
Fig 16. Total polyphenols Concentration (mg/ml) in fresh and commercial juices.

8
Introduction
Wine has been used since the dawn of human civilization, it is an alcoholic beverage produced
as a result of alcoholic fermentation of fresh Vitis vinifera grapevine fruits. Wine is classified as red,
white, and rosé wines. Wine types differ from sweetness, alcohol content, carbon dioxide content, color,
grape variety. The fermentation process also not the same for every wine with a maturation process.
Geographic origin, cultivar identification, and years of vintage are also important aspects of wine. (Artero
2015)
Beer is one of the most consumed alcoholic beverages around the world, which is rich in
nutrients such as carbohydrates, polyphenols, Hop (Humulus lupulus L.) which is a beer raw material
and the main source of polyphenols around 30 %, and malt with 70%-80%. (Keukeleire et al., 2003)
Polyphenols in beer are present as benzoic, simple phenols, di, and tri-oligomeric
proanthocyanidins, α/iso-α acids, minerals, vitamins, amino acids, and other compounds such as
polyphenols. Red wines contain a variety of polyphenolic antioxidants and organic compounds, also they
have a unique taste, bouquet, and medical properties. (Agric. Food Chem. 1996)
Nowadays, non-alcoholic beverages are getting more popular, due to the different populations
might be looked at from different aspects such as health, diet (high caloric content), or prohibition of
alcohol consumption in factories and shops caused by labor protection laws or forbidden by health
problems. (Agric. Food Chem. 1996).
Flavonoids are plant origin and belong to the class of metabolites. Plant polyphenols, that have
one of the main potentials as antioxidant properties and positive effects in the prevention of cancer which
is various oxidative stress-associated diseases. Free radicals can cause mutations in the genetic material
and have shown a link to cancer, aging in humans, and arthritis. (Hussain, 2012)
Antioxidants may promote longevity and can help protect against heart disease and harmful
inflammation, cardiovascular diseases, and modulation of carcinogenesis. Antioxidants act as scavengers
and remove free radicals and prevent further oxidation. Fruits, vegetables contain high source of phenolic
compounds, vitamins, flavonoids, and tannins. (Pandey and Rizvi, 2009).
The large number of polyphenols are naturally occurring in non-alcoholic beverages and some
fruit like apple, pear, grapes can contain more than 200-300 mg per 100-gram fresh weight. (Scalbert et
al., 2005)

9
Red wine polyphenols are a complex mixture of flavonoids including anthocyanins and flavan-
3-ols and nonflavonoids: resveratrol, cinnamates, and gallic acid. Flavan-3-ols are the most abundant,
with polymeric procyanidins (condensed tannins) composing up to 50% of the total phenolic constituents.
Flavonoids that are in beer include quercetin, naringin, and catechins. (Taylor et al., 2003)
Around 30% of polyphenols from beer comes from hops and 70%–80% originate from malt
and14 % of polyphenols are in dried hops and present as phenolic acids, chalcones, catechins, flavonoids,
and proanthocyanidins. (Taylor et al., 2003)
Non-alcoholic drinks last decade made a huge revolution and nowadays wide range of drinks
are available. Beverages can be affordable and found with different aspects, including sugar or sugar-
free, Beverages as a source of some vitamins, also with reduced calories. The main criteria for
classification involve sugar, proteins, fat, saturated fat, carbohydrates, and salt content per 100mL.
(Buglass, 2015)
Major chemical aspects include pigments, which can be natural like anthocyanins,
carbohydrates, sweeteners which can include natural or non-calories sweeteners, acids, colorants typical
for lemonades, volatile compounds, nitrogen amines, amino acids, phenolic compounds, steroids
proteins, minerals, vitamins mostly added to juices, ethanol in alcoholic beverages, carbon dioxide for
carbonated drinks and preservatives. (Buglass, 2015)
Vitamins and minerals in beverages are sources for daily intake dozes and consider as a part of
a healthy pattern. Juices can be a source of vitamins and elements of A, C, E, K, B6, iron, potassium,
manganese. (Slavin, and LIoyd 2012)
So, alcoholic and non-alcoholic beverages can be a part of daily diet and the importance of
their nutritional value becoming more and more popular these days, as nowadays lots of variations of
beverages are affordable.

10
Aim and Tasks
Aim:
To determine the nutritional value of beverages, wine and chemical composition and bioactivity
assessment methods.
Tasks:
1. Comparative analysis of the nutritional value of beverages and wine.
2. Fermentation, its role, and tasks producing fermented drinks.
3. Instrumental analysis methods used for quality assessment of raw materials and products in the
production of beverages and wines.

11
1. Review of Literature
The brewing of beer and winemaking is an ancient art. Brewing dates back to about 6000 B.C.
(Hardwick, 1994) The main components of wine are water (approximately 86%) and ethyl alcohol (12%
on average), sugars, organic acids, tannins, mineral compounds, vitamins, biologically active
compounds, which are also responsible for wine’s pro-health properties, such as its antioxidant, anti-
carcinogenic, anti-inflammatory, immunomodulating, anti-virus and anti-bacterial effects. (Shen, J.
2015)
Bioactive compounds of plants are produced and known as secondary metabolites. Such as
flavonoids, resveratrol, alkaloids, steroids. In wine and beer, antioxidant contents differ because of raw
materials, as in wines specific antioxidants come from the grapes and in beer cases from hops and barley.
The antioxidant is classified as synthetic, natural, and namely. Natural antioxidant has the ability to
presumed safety and known as the therapeutical effect. (Lopez-Velez, et al., 2003)
In daily intake fermented beverages becoming more and more popular due to their nutritional
value and source of essential compounds. Reactive oxygen species (ROS) can cause oxidative stress in
a body which can lead to various injurious processing and lipids, DNA, proteins, carbohydrates
oxidation. (Lopez-Velez, et al., 2003)
Oxidative stress can cause several non-communicable diseases (NCDs) such as cardiovascular
diseases, arthritis, type 2 diabetes, different types of cancer, autoimmune diseases, and neurodegenerative
disorders, among others. (Chandrasekara, Shahidi 2018)
Natural antioxidants include phenolics, vitamins that can be found not only in food, also in
beverages, especially red wines. An everyday antioxidant diet can protect against cancer, cardiovascular
diseases, and disorders related to age. (Steffer, L.M et al., 2003)
For food preservation fermentation is one of the ancient methods. The fermentation process
enables the preservation of food, beverages to enhance nutritional value and give unique properties.
(Tamang, JP Samuel, D 2010)
12
1.1 Fermentation role in beverages
The fermentation process varies in different beverages and can be count as a cost-effective and
low energy process of preservation, moreover, this process is important for the safety of product and
shelf-life. Fermentation also enhances organoleptic properties such as texture, taste. (Dimidi et al., 2019)
The process of fermentation product in traditional fermented products occurs spontaneously and
uncontrolled, while in companies everything is under control, in traditional one a lot of factors are
important for quality, such as local climatic conditions, land, raw material. Alcoholic and non-alcoholic
beverages are prepared in commercial or traditional ways. (Maicas, 2020)
The production of alcohol in beer and wine is based on yeast fermentation. The production of
alcohol in beer and wine is based on yeast fermentation with traditionally Saccharomyces cerevisiae
strains and thus yeast is available commercially also. (Walker, Stewart 2016)
In non-alcoholic beverages, Lactic acid fermentation has been shown to improve food
nutritional properties, flavor, and health-related aspects. Including water kefir, kombucha, Soymilk, etc.
Mostly in lactic acid fermentation, the main substrates are plant materials. Lactobacillus strains some
fruit juices such as apple, orange, and grape juices showed that L. paracasei has the ability to reduce
total sugar concentration, or L. plantarum can increase lactic and succinic acids and decrease malic,
tartatric, glucose, and citric acids. (Remize et al., 2020)
Under anaerobic conditions, S. cerevisiae conducts fermentative metabolism to ethanol and
carbon dioxide (as the primary fermentation metabolites) as the cells strive to make energy and regenerate
the coenzyme NAD+. Yeasts also produce secondary metabolites that serve as important beverage flavor
congeners, such as higher alcohols, sulfur compounds esters, also esters, carbonyls and they play a
significant role in beer, wine final flavor, and aroma characteristics. (Walker, Stewart 2016)
Yeasts are critical in providing the alcohol content and sensory profiles of such beverages. This
introductory chapter examines the growth, physiology, and metabolism of S. cerevisiae in alcoholic
beverage fermentations in general. (Vigentini et al. 2016). Temperature and pH requirements for
alcoholic fermentation are crucial. A warm and acidic environment is needed for most S. cerevisiae
strains and better growing temperatures ranging from 20 to 30 °C and pH levels ranging from 4.5 to 6.5.
There are some exemptions like S. Pastorius they can ferment 8-15 °C. The requirement for yeast include

13
oxygen due to S. cerevisiae is sometimes referred to as a facultative anaerobe and growth in anaerobic
conditions is not possible. (Walker, Stewart 2016)
Fig 1. Saccharomyces cerevisiae in production of fermented beverages. (Walker, Stewart 2016)
Although malt wort, molasses, wine must, for yeast growth normally contains adequate levels
of inorganic ions supplementation with additional minerals like zinc, but it can be deficient.
Brewer’s yeasts are very rich in essential minerals and B vitamins, except for vitamin B12. By
the fermentation activity of microorganisms, other types of alcoholic beverages can be produced. Yeast
is not only for alcoholic production, it can maintain the quality of beverages. (Walker, Stewart 2016)
In the winemaking process, the extraction of grape juice (‘must') is followed by yeast
fermentation, S. cerevisiae Yeast can be present as naturally or commercial starter cultures.
Fermentations for whisky and other distilled spirits derived from cereals are carried out by specific strains

14
of Saccharomyces cerevisiae, which convert mash sugars into ethanol, carbon dioxide, and numerous
secondary fermentation metabolites that act as flavor congeners in the final spirit. (Vigentini et al., 2016)
Sugars can be used anaerobically by fermentative yeasts as electron donors, acceptors, and
carbon sources. S. cerevisiae is an ethanologenic yeast, meaning it can easily convert glucose, fructose,
mannose, galactose, sucrose, maltose, and maltotriose into ethanol and carbon dioxide. (Walker, Stewart
2016) Malolactic fermentation in the winemaking process reduces acidity improves taste in wine. During
this time Certain bacteria are necessary and results in the decarboxylation of L-malic acid to L-lactic acid.
(Ribereau-Gayon et al., 2000)
Higher alcohols, polyols, esters, organic acids, vicinal diketones, and aldehydes are among the
secondary fermentation metabolites of S. cerevisiae. Glycerol and succinic acid are two of the most
important secondary fermentation metabolites. Diacetyl is a vicinal diketone produced by S. cerevisiae
are side reactions products of the amino acid valine synthesis. It may also be present in beer as a result
of lactic acid bacteria contamination and it can affect the beer taste. (Ribereau-Gayon et al., 2000)

15
1.1.1 Different types of winemaking technology
According to archeological evidence, winemaking in Georgia began 8000 years ago.
According to ancient Georgian traditional winemaking technology, the squeezed grape is placed in a
clay vessel (qvevri) dug in the ground, and alcoholic fermentation occurs alongside cluster components.
This type of winemaking is known as the ‘’Kakhetian style’’ and qvevri has its advantage that
fermentation occurs in a more normal manner in the qvevri dug in the ground and the quality of wine
is better to compare wooden vessel wine. As Qvevri is underground, the fermentation temperature is
maintained relatively low. (Vigentini et al., 2016) In Qvevri different types of wine are made, first ''The
Kakhetian style '' where skins, pips, and stalks, a mixture called ''chacha'', fermentates, and ''Imeretian
style, where 3 % of chacha fermentates. Compare with ''European style'', only juice fermentates,
without chacha. (Vigentini et al. 2016) Kakhetian style winemaking involves chacha fermentation
either it is in Qvevri or different vessels.
In European areas, mostly a red wine from must is made and fermented with grape skins due
to color. In white wine cases, by pressing crushed grapes, skins are removed and have minimal contact.
Overall, the juice is fermented. This main difference affects the concentration of active compounds.
(Vigentini et al., 2016)
The winemaking process also affects the active compound concentration, the total content of
phenolic compounds in Kakhethian white wines made from various grapes ranges between 1330 and
2430 mg/L, while in European white wines it ranges between 210 and up to 468 mg/L.
In red wines total phenols from 2848 mg to up to 4400 per liter and exceed European style
wines, 1600mg up to 3100mg. (Vigentini et al., 2016) This tendency is also for other compounds such
as anthocyanins, catechins, proanthocyanidins, tannins. Skin and seed contact finally raise the
concentration of the active compounds, improve the bouquet of wine and overall raise its medical
properties or organoleptic properties.
Wines with long maceration with stems have a crucial impact on the nature of the wines.
Phenolic compounds present in the skins and seeds of the grape. Flavonols are found also in grape
skins while flavan-3-ol in grape seeds. In red wines resveratrol concentration due to different
technology, different technology process affects concentration. (Cheynier, Rigaud 1986)

16
1.2 Wine and beer nutritional value
Wine has been used since the dawn of human civilization, it is an alcoholic beverage produced
as a result of alcoholic fermentation of fresh Vitis vinifera grapevine fruits. Wine is classified as red,
white, and rosé wines. Wine types differ from sweetness, alcohol content, carbon dioxide content, color,
grape variety. The fermentation process also not the same for every wine with a maturation process.
Geographic origin, cultivar identification, and years of vintage are also important aspects of wine.
(Artero, 2015)
Red wine polyphenols are a complex mixture of flavonoids including anthocyanins and flavan-
3-ols and nonflavonoids: resveratrol, cinnamates, and gallic acid. Flavan-3-ols are the most abundant,
with polymeric procyanidins (condensed tannins) composing up to 50% of the total phenolic
constituents.
Resveratrol role especially for anticancer agent as it has effects on initiation, promotion,
progression stages, and also apoptotic pathway. It has also anti-oxidant activity, anti-atherogenic, anti-
platelet aggregation effect. It can also interact on tumor cell surface selectively upregulate CD95-CD95L
interaction and induced apoptosis by the mitochondrial release of cytochrome C and 9 and 3 caspases
downstream activation. (Perviaz, 2001)
Flavonoids are plant origin and belong to the class of metabolites. Plant polyphenols, that have
one of the main potentials as antioxidant properties and positive effects in the prevention of cancer which
is various oxidative stress-associated diseases.
Free radicals can cause mutations in the genetic material and have shown a link to cancer, aging
in humans, and arthritis. Resveratrol plays an important role also to modulate the metabolism of lipids
and inhibit low-density lipoproteins and aggregation of platelets. (Frémont, 2000)
Volatile compounds give wines odor and flavor which are essential parameters. Volatile
compounds have grape must origin, fermentation yeast metabolic products, and chemical reaction
origins. In grapes, juice many volatiles naturally exist as odorless glycosides or L-cysteine conjugates.
(Buglass, 2015)
The major wine acid is L- (+)-tartaric acid and L- ()-malic acid. Concentration around 104 g/L.
D-lactic acid present with low concentrations. In wine also exist other acids from different metabolic
pathways. e g., citric, fumaric, pyruvic, and shikimic acids. (Buglass, 2015)

17
Flavonoids that are in beer include quercetin, naringin, hesperetin and catechins. (Waterhouse,
2002) Most studies focus on resveratrol and its health benefits, especially for reducing the risk of
cardiovascular disease. (Arranz et al., 2012)
Antioxidants may promote longevity and can help protect against heart disease and harmful
inflammation, cardiovascular diseases, and modulation of carcinogenesis. Antioxidants act as scavengers
and remove free radicals and prevent further oxidation. Fruits, vegetables are also a good source of
vitamins, flavonoids, tannins, and phenolic compounds. (Khurana et al., 2013)
Wine has also a positive effect on low risk of myocardium infarction and lipoproteins,
coagulation, and insulin. (Mukamal et al. 2005) Red wine also reduces plasma superoxide dismutase
activity and malondialdehyde levels, blood pressure and inhibits oxidation of LDL particles, which are
low-density lipoprotein particles. Another important benefit is reducing inflammation and cell adhesion
and activating proteins that prevent cell death. (Estruch et al., 2011)
Wine also contains minerals and it can be used as a discriminate of the geographical origin of
wines. (Hideaki et al. 2020) Maceration type and origin of the wine affect the mineral composition and
concentration. Elements in wine which has also health benefits are Na, Mg, P, S, Ca, K. Mn,
Fe. Concentrations of minerals in beverages are essential for daily diet and also in wines mineral
concentration discriminate geographic origin and techniques of winemaking.
The minerals that are often detected are Mg, K, Ca, Na, Mn, Zn, Cu, Fe, Cl, Cd, As, Pb, P, Si,
etc. (Yaneris et al., 2018) So, alcoholic and non-alcoholic beverages can be a part of daily diet and the
importance of their nutritional value becoming more and more popular these days, as nowadays lots of
variations of beverages are affordable.
Beer nutritional value: Beer is a worldwide consumption beverage, alcoholic drink, which can
be made either at home or brewing company. During the brewing process, the starch source is converted
into a wort, which is a sugary liquid, and finally wort by yeast effect into an alcoholic drink beer.
(Hardwick et al., 1994)
The studies showed that beer consumption reduces cardiovascular risk and also low moderate
alcohol intake reduces the risk to develop neurodegenerative diseases. But as it every alcoholic beverage,
there are some consumption recommendations for specific groups of people to take so few dozes or not
at all. As heavy consumption of beer may increase some organ disease risks. (Bamforth 2006;
Caspermeyer, 2015)

18
Nutritional value and active compounds quantity and quality depend on raw material. As beer
also contain phenolic compounds and during the brewing process, compounds change. Carbohydrates
are the main nutrients of beer with vitamins, minerals, and phenolic compounds. (Caspermeyer, 2016)
Mostly they are extracted, enzymatically released. They can be also precipitated with or adsorbed yeast
cells and stabilization agents or to the hot and cold tubes. (Denke 2000)
The main source of phenols and phenolic acids, hydrolyzable tannins are hop and malt. The
main part of phenolic compounds present as glycosides, esters and also as monomeric and oligomeric
flavonoid compounds. It should be noted that in beer 4658 compounds were detected and 246 out of
4568 included esters, aldehydes, and alcohols.
Also, malt analyses detected 5042 compounds and 217 included amino acids, amines, and
amides due to biochemical degradation of amino acids in beer. (Marova et al. 2011) (Nykänen and
Suomalainen,1983) This occurs in malting starting and leads with the fermentation process. lipid acids,
fatty acids, sugar, organic acids, terpenes, aldehydes, etc. (Nykänen and Suomalainen, 1983) (Tressl et
al., 1977)
B-complex vitamins are found in beer and can help prevent a variety of diseases. B-complex
vitamins are particularly well known for their healthy nervous system and role and the growth of red
blood cells in helping maintain red plasma cells in your body and keeping your nervous system healthy.
(Mayer, 2001) B vitamins are the main factor for cellular metabolic pathways, cofactors for axonal
transport, play a key role in the synthesis of neurotransmitters, also for excitability of neurons. (Song
2017)
Beer is low ethanol content beverages, determine the nutritional quality of its antioxidant
activity should be determined. Some research showed that it has the ability to increase plasma
antioxidants and has in humans positive on plasma lipids, also anticoagulant activity.
Moreover, moderate beer consumption has been reported to exert protective effects on the
cardiovascular risk factor. B vitamins can act as an anticarcinogenic activity. (Pérez-Jiménez et al. 2010;
Scalbert A. et al., 2005)
Meta-analyses demonstrate an overall meta-analysis showed benefits of wine and beer and its
consumption can prevent cardiovascular risk and mortality. (Spaggiari et al., 2020; Padro et al., 2018)

19
1.3 Active compounds of beverages.
Beverages are source of phenolic compounds which are produced almost universally and they
are secondary metabolites produced by plants and play a key role in reproduction, against stress, plant
growth, colour, and against the pathogens defense mechanisms. Apart from these, they have huge
biological benefits such as antioxidant activity, including cardiovascular, inflammation, cancer, diabetes
risk prevention. (Liu, 2004; Khoddami et al., 2013; Khatiwora et al., 2010)
Phenolic compounds are associated with the nutritional quality of food and beverages. The
source of phenolics can be found in various fruits and vegetables. including fruit juices, alcoholic/non-
alcoholic beverages, and in food. (Brumaghim and Perron, 2009)
Fig 2. Classification of phenolic compounds.
Phenolic compounds are produced almost universally by plants. There are three main three
known pathways: the shikimic acid pathway, also known as phenylpropanoid, where three aromatic
amino acids tyrosine, phenylalanine, and phenolics– tryptophan is key precursors from which pathways
they form. By shikimic and malonate–acetate pathways some combining products from both pathways
phenolics produced. (Stewart 2008)

20
The phenolic compounds are low molecular weight substances with one phenolic ring and
decarboxylation products, comprised from substance groups. When the fermentation process occurs,
tyrosol is formed from tyrosine by the Ehrich pathway. (Floridi et al.,2003, Wannenmacher et al., 2018).
From chalcone compounds which formed via condensation with three molecules of malonyl‐
CoA, phenylpropanoids, prenylated hop‐derived chalcone xanthohumol in beer has biological activity.
In beer glycosides, esters are found. (Nardini & Ghiselli, 2004). In beer also exist nonflavonoid
polyphenols.Polyphenols by definition and classification are flavonoids, chalcones, lignans, and
stilbenes. Flavonoids as a structure have two A and B aromatic rings and bound 3 carbon atoms which
form ring C, oxygenated heterocycle. Flavonoids are divided into flavones, anthocyanidins, and flavanols
(catechins and proanthocyanidins), isoflavones, flavanones. (Manach et al., 2004).
Fig.3 Wine phenolic compounds.
The phenolic compounds of the wine, and particularly the flavanols for example catechins,
proanthocyanidins due to their beneficial health effects on human body has nowadays increased attention
and interest. Phenolic compounds in beer originate from either cereal or hops. The cereal compound
mainly used in brewing is malted barley. (López-Vélez et al., 2003)
Resveratrol (3,4′,5- trihydroxystilbene) is a nutraceutical, as a therapeutic agent which first
isolated in Veratrum grandiflorum in 1940 and from the wine phenolics nowadays most interest and most
studies focus on resveratrol due to its and its health benefits. (Perviaz, 2001)

21
Five anthocyanins are found in grapes, wines. Including delphinidin, petunidin, malvidin,
cyanidin and peonidin — and their 3-monoglucosides and 3,5-diglucosides.Also, Quercetin-3-glucoside,
quercetin-3-glucuronide and myricetin-3-glucoside (the principal flavonols), kaempferol-3-glucoside,
kaempferol-3-galactoside and isorhamnetin-3-glucoside (minor compounds) and caffeoyl tartaric acid
and para-coumaroyl tartaric acid all contribute to the pigment of grapes and wines. (Van Buren et al.,
1970) In distilled alcoholic beverages are also aromatic acids can be found. (Nykänen & Suomalainen,
1983)
Wine goes maturation process, where unpleasant flavours disappear. Some aromatic aldehydes
present also in wines and lignin is responsible for their presence. Distillation process also influences on
volatile compounds presence. (Nykänen and Suomalainen, 1983)Flavonoids are part of the polyphenol
class of phytonutrients. Found in food and beverages including non-alcoholic, alcoholic beverages, fruits
and vegetable. Flavonoids including anthocyanidins, isoflavones, flavonols, flavones, flavonols, and
flavones. (Burak, Imen1999, Samanta et al., 2011)
Fig. 4 Basic structure of flavonoids.
Almost every group of flavonoids can act as antioxidants. Flavonoids play also an important
role in free radicals scavenging caused by oxidative stress and they can prevent some various diseases
and injuries. (Das and Das, 2011)

22
Flavonoids in cancer prevention have complementary and overlapping mechanisms of action
including antioxidant activity and scavenging free radicals, modulation of carcinogen metabolism,
regulation of gene expression on oncogenes and tumor-suppressor genes in cell proliferation and
differentiation, induction of cell cycle arrest and apoptosis, modulation of enzyme activities in
detoxification, oxidation and reduction, anti-inflammatory properties and action on other possible targets.
(Panche et al,. 2016)
Flavonoids as a benefit for human health and prevention for some diseases including cancer
prevention have ability to scavenge free radicals and activates antioxidant activities. It also regulates the
expression of genes and tumor-suppressor genes in cell proliferation and differentiation, induction of cell
cycle arrest and apoptosis, modulation of enzyme activities in detoxification, oxidation and reduction,
anti-inflammatory properties, and action on other possible targets. (Panche et al,. 2016)
Flavonoids biological activities included anti-allergenic, antiviral, anti-inflammatory, and
vasodilating actions. During the fermentation process of wine, in grapes rich in phytochemicals
compounds modify and finally more than 200 phenolic compounds that attract interests to the nutritional
value arises. These compounds include flavonoids and also non-flavonoids compositions. (Panche et al,.
2016) Juices can be a source of vitamins and elements of A, C, E, K, B6, iron, potassium, manganese.
Different technologies can improve the stability of vitamins, bioavailability, and nutritional value
increases. Vitamins are generally divided into two main groups: lipid- and water-soluble vitamins.
(Gironés, Vilaplana et al., 2017).
In one bottle of beer can be found all the essential minerals for daily health, B vitamins,
riboflavin, zinc, niacin, Zn dependent enzymes are involved in macronutrient metabolism and cell
replication and noticed reduced Zn level in consumers of alcohol. These two processes were on the
increase in alcohol consumers and their productions (Szabo et al., 1999).
Reducing the Zn levels as in Zn level in alcoholics and beverages is of considerable importance
because of the significant role it plays in the metabolism of other micronutrients, which are quite a way
to healthy living. Also, Zinc dependent is vitamin A and E. When the deficiency occurs of these elements
or vitamins, may increase their risks of infections and diseases. (Szabo et al., 1999).
Cu is a component of SOD and it is transported by caeruloplasmin. Thus, both Cu and
caeruloplasmin are parts of endogenous antioxidants that ameliorate alcohol-induced oxidative stress.

23
Cu was found to be significantly raised in consumers of alcoholic beverages. Importantly raised
level of Copper might be one of the mechanisms to compensate for significantly reduced Zn since both
Cu and Zn are among the micronutrients needed for effective immune responses. (Limuro et al., 2000)
Fe was reduced in alcoholic beverage consumers. Fe is a pro-oxidant that is also needed by
micro-organisms for proliferation (Galan et al., 2005). Se deficiency was found to result in lower
glutathione peroxidase activity of phagocytic cells, the reduced microbicidal activity of NKC, and T-cell
mediated cytotoxicity (Galan et al., 2005).
Another element that is found is Se in alcohol and alcohol consumers have the ability to reduce
immunity in chronic alcoholics. Zn has a positive effect to boost the immune system. (Limuro et al.,
2000) The most significant elements are Calcium, Iron, copper, magnesium, fluorine and daily intake is
about 16-25 % of each other for adults.
While taking Alcoholic drinks about 35% of the alcohols and beverages, they are likewise the
main source of minerals. These minerals can be iodine and iron which are mostly in wines, beer is rich
with selenium, fluorine calcium and copper can be found in all alcoholic drinks. (Galan et al., 2005).

24
1.4 Non-Alcoholic Beverages
The non-alcoholic d starts with mixture preparation, the mixture can include different
ingredients. Basic syrup, ingredients sugar, fruit juice, aromas are added to water for flavor. Some non-
alcoholic beverages include vitamins, quinine, caffeine, depending on the type of beverages. (Serrano et
al., 2016)
Different ingredients are added nowadays to the water as a taste improving and also for health
benefits alcoholic industry is fast growing and allows consumers to choose individual needs and various
beverages with supplements and antioxidant properties.
Fruit juices include fruit drinks and nectars, also fruit-vegetable mixtures, and milk substitutes
like drinks made from almonds, rice, soy, and non-alcoholic beverages functional beverages in sports,
health, energy, mineral or spring water, soda water/pop, cola drinks, etc.
Fruits and vegetable supplement diets with nutrients have a connection to lower the risks of
heart disease, diabetes, age-related cognitive impairment, some cancers, and all-cause mortality. Several
studies have found an inverse relationship between fruit and vegetable consumption and future
improvements in anthropometric parameters, as well as the risk of adiposity. Diabetes, CVD, glucose
homeostasis, lipid concentrations, and blood pressure were among the health outcomes studied. (Ferruzzi
et al., 2020)
In some cases to the beverage, apart from natural compounds can be added synthetic ingredients
which can be isolated from spices, herbs, colouring substances, essential oils to improve flavour. Organic
acid citric acid and malic acid are added too.
The important elements like calcium, phosphorus, potassium, iron, magnesium, manganese,
iodine, and vitamins can be found in high-quality non-alcoholic beverages. The main criteria depend on
raw material quality and technology aspects. (Buglass, 2014)
Vegetable juices can be a rich source of vitamins and most of the nutrients can be included.
They are a source of vitamins and minerals are made from vegetables and as additives sweeteners, salt,
some juice, or cocoa, sugar is added. In addition, phytonutrients such as flavonoids (anthocyanins,
flavonols) and carotenoids, contained in fruit and vegetable juices, have health benefit. Fruit and
vegetable juices provide 10–20% of daily requirements and also they are source of potassium and
vitamins A and C. (O’Neil et al., 2012)
Beverages can not replace food as it is difficult to reach daily requirements for vitamin E or
essential fatty acids only for beverages, but they are a good source of active compounds including
phenolic acids, flavonoids, and other daily nutrients. Consumers can choose from a wide range of

25
sparkling and still beverages, sugar or sugar-free, fat or non-fat, with or without fruit juice, vitamins, as
well as different flavors. (Ferruzzi et al, 2020) Other types of non-alcoholic beverages include sports
drinks as an alternative help to replace water, electrolytes to the athletes and for energy also. Some studies
claim that they absorb water better while exercisings.
Energy drinks that contain stimulants and provide mental or physical stimulation, main
stimulants are caffeine and additional ingredients such as sugar, taurine, B vitamins, and herbal extracts
too.
In contrast, non-alcoholic beer, made with similar ingredients but lacking alcohol content, can
help boost health as it can be a high source of vitamins. Non-alcoholic beer can help maintain levels of
electrolytes.
Ethanol distillation is used to separate alcoholic drinks into what are advertised as non-alcoholic
drinks and spirits, non-alcoholic drinks cannot be further purified to 0.00% alcohol by volume by
distillation. While determining the compounds from non-alcoholic beverages, conventional methods are
used and minimize the risk as long extraction, heating, and organic solvents can cause degradation
through oxidative enzymes. (Russell and Mumper 2010)
Beverages as a source of some vitamins, also with reduced calories. The main criteria for
classification involve sugar, proteins, fat, saturated fat, carbohydrates, and salt content per 100mL.
Major chemical aspects include pigments, which can be natural like anthocyanins,
carbohydrates, sweeteners which can include natural or non-calories sweeteners, acids, colorants typical
for lemonades, volatile compounds, nitrogen amines, amino acids, phenolic compounds, steroids
proteins, minerals, vitamins mostly added to juices, ethanol in alcoholic beverages, carbon dioxide for
carbonated drinks and preservatives. (Ferruzzi et al., 2020)
In beverages per 100 mL energy value is expressed in kilojoules (kJ) and kilocalories (kcal).
The average 100 mL kcal ranges from 0 to 55 kcal. Around 0-13 g carbohydrates for soft drinks and 2-
17 g for fruit juices, nectars. This information should be labeled. For energy value determination
carbohydrates, sugars, fats, proteins, salts, vitamins, and minerals are crucial factors. (Serrano et al.,
2016)
Depending on the composition of the diet, the intake of polyphenols may be several hundreds
of milligrams per day, particularly in wine, coffee, beer, and tea consumers, largely exceeding that of
other antioxidants such as vitamin E and C and β-carotene. (Hurum et al., 2010)
26
2. Materials and Methods
2.1 Screening bioactive compounds from natural product and their preparations using
capillary electrophoresis.
Capillary electrophoresis plays a vital role in screening active compounds. It has unique features
such as high-efficiency separation, minimal sample consumption, and short-analysis time which makes
it on of the leading method for screening compounds.
With this technique is possible to determine active compounds and screen from natural products
in complex matrix, also it has benefits for highly polar compounds and also simultaneous analysis of
analytes in a single run.
The principal components of CE include a fused silica capillary column as a separating channel
and a high-voltage power supply as a driving force. Chemical compounds which are separated are visible
and shown in a electropherogram as a peaks. (Chang, 2012)
Another feature and benefit for the Capillary Electrophoresis are that in most cases sample
preparation does not need special treatment. (Gomez and Romina 2012)
Screening active compounds other models include CZE, MEKC, etc. with integrated capillary
electrophoresis chips. With the combination of other apparatuses, CE sensitivity can improve.
Micellar electrokinetic chromatography (MEKC) applies micelles as pseudo stationary phase,
in CZE is an electrolyte with charged micelle. MEKC separates electrolytes from each other due to
different mobility and between water and micelle phase partition coefficient. Neutral compounds can be
separates with this technique. Active compounds including phenolic acids and flavonoids can be
determined by MEKC.
Affinity capillary electrophoresis (ACE) is another method for active compound screening,
including protein, polypeptide, and nucleic acid fragments. In ACE on the inner wall target receptors are
immobilized of the capillary tube as stationary phase. It can screen from solutions ligands. ACE is high
specificity and reversibility. (Yu et al., 2004)
With the development of technique, CE also can be coupled with various detectors such as
ultraviolet detection (UV), LIF, evaporative light-scattering detector, radiation, MS, electrochemical
method, or even other analytical techniques such as HPLC.

27
MS is one of the most sensitive detector with combination CE. In separation detection with MS
useful information and unknown compounds can be identified. (Herrero et al., 2005)
The determination of trans-resveratrol, ()-epicatechin, and (+)-catechin in red wine can be done
by using capillary electrophoresis with electrochemical detection (CE-ED). The analytes could be
separated in a 100 mmol/L borate buffer (pH 9.2) in 20 minutes under optimal conditions. For all
analytes, a carbon disk electrode with a diameter of 300 m has a good response at +0.85 V (vs
SCE). (Peng et al., 2004)
Overall. when compared to chromatographic methods, one advantage of CE is that injection
volumes are small (a few nanoliters), which may be important if sample volume is limited. Furthermore,
CE separations are frequently very fast (a few seconds to a few minutes), and a wide range of analytes
(polar, nonpolar, volatile, nonvolatile) can be analyzed using the same basic instrument. (Frazier et al.,
2000)

28
2.2High-performance liquid chromatography (HPLC) for oligomers and polymers
separation
HPLC can separate hundreds of compounds at the same time and this makes it one of the leading
methods. This technique is suitable for molecules whose molecular weight is from a few to hundreds to
thousands of daltons, including tannins, proteins, and polysaccharides, polar/nonpolar and nonvolatile
analytes.
Flavanoids are UV absorptive and can be analyzed by HPLC with UV/visible detectors. HPLC
provides separation monomers, procyanidin oligomers and polymers. (Conte et al., 2011)
HPLC is a type of column chromatography in which a sample mixture or analyte in a solvent
(known as the mobile phase) is pumped at high pressure through a column with chromatographic packing
material (stationary phase). A moving carrier gas stream of helium or nitrogen transports the sample.
HPLC has the ability to separate and identify compounds that have previously been separated. (Sontag
et al.1988)
Instrumentation:
Main components in an HPLC system include the solvent reservoir, or multiple reservoirs, a
high-pressure pump, a column, an injector system, and the detector. (Ebeler 2017)
The interaction between the stationary phase, the molecules being analyzed, and the solvent or
solvents used will affect sample retention time. The sample interacts with the two phases at different
rates as it passes through the column, owing to the analytes' different polarities analytes with the least
and most amount of interaction with the stationary phase.
The main components of an HPLC system include the solvent reservoir, or multiple reservoirs,
a column, an injector system, a high-pressure pump, and the detector are. The solvent is held in the
reservoir and is referred to as the mobile phase because it moves. (Ebeler 2017)
A system typically includes at least two reservoirs, each of which can hold up to 1000 cc of
solvent, and is equipped with a gas diffuser through which helium can be bubbled. A pump is used to
produce a predetermined flow of the mobile phase. Although manual sample injection is still possible,
most HPLCs are controlled by a computer and fully automated.

29
The injector (autosampler) introduces the solvent into a phase stream. From the injector sample
transports to the high pressure (up to 400 bar) column which has specific packing material for separation.
Column hardware held this specific material and referred as stationary phase. (Ebeler, 2017)
To see the separated compound bands as they elute from the high-pressure column, a detector
is required. The data from the detector is sent to a computer, which generates the chromatogram. The
mobile phase exits the detector and is either discarded or collected, depending on the situation.
To avoid unstable baselines caused by dissolved air, Helium sparging is an efficient method of
degassing the mobile phase. Nitrogen is used as a nebulization gas in the Evaporative Light Scattering
Detector (ELSD), which evaporates the solvent from the sample, leaving a mist that is measured. (Ebeler,
2017) Another type of HPLC is uHHPLC. Comparison with HPLC, column particles size ranges from 3
to 5m and pressures of around 400 bar, while uHPLC uses 1.7m particles and columns are designed
specially, pressure is over 1000 bar. The main advantage of an uHPLC is its speed. These systems are
faster, more sensitive, and use smaller volumes of organic solvents than standard HPLC, allowing them
to perform more complex analyses.
High-performance liquid chromatography-flame ionization detection (HPLC-FID) for ethanol
detection in beverages is suitable method. An FID system could be directly connected to an HPLC system
using pure water as a mobile phase and HPLC separation of alcoholic beverages can be carried out on
the C30-silica gel stationary phase. (Rajcsanyi, 1975) While Because reversed-phase high-performance
liquid chromatography (RP-HPLC) produces higher resolution in organic compound separation, it is used
as an analytical technique in a wide range of chemical laboratories.
The detection method of ethanol in the determination of ethanol in alcoholic beverages is a
technical problem. A differential refractive index detector can be used to detect ethanol but its stability
for detecting analytes is temperature-dependent. An electrolyte solution can be used as a mobile phase
in the conductometric detection of ethanol in alcoholic beverages. (Rajcsanyi, 1975)

30
2.3 Determination of phenolic compounds by Liquid chromatography-tandem mass
spectrometry (LC-MS/MS)
Tandem MS has been used in grapes and wines for targeted analysis of smoke taint glycosides
quantification of trace levels of compounds that impact wine aroma, such as haloanisoles. (Hjelmeland
et al., 2012) and methoxypyrazines and over one hundreds of polyphenols in wines. (Lambert et al.,
2015) With LC/MS/MS it is possible to make quantification of bitter compounds of beer. These
compounds are hop-derived and include the post, pre-congeners of iso-acids, etc. Also prenylflavonoid
isoxanthohumol and the chalcone xanthohumol. (Ochiai et al., 2015).
This analysis can be performed for the first time in a single HPLC run on authentic beer samples
without the need for any cleanup procedures. In LC-MS/MS analysis is suitable for fresh and storage
beer quantitative analysis of hop-derived bitter compounds. (Ochiai et al., 2015). MS is becoming the
preferred detector for a wide range of chromatographic separations. The mass to charge ratio (m/z) of
charged analytes is used to separate them in a mass spectrometer. As analytes elute from the
chromatographic column are ionized. Tandem MS (MS/MS or MSn) configurations enable two (or more)
MS analyses to take place after the analytes have been eluted from the column. MS/MS instruments are
classified into two types. (Ebeler, 2017)
Analyte ions enter the analyzers which are places in the instrument and other analytes enter one
after the other principle. This is called first configuration. In the other configuration, the MS analyzer
trapping all of the ions in the analyzer and manipulating them in time so that only ions of a specific mass
are released and detected at a given time. (Ebeler, 2017) There are several ways to apply MS detection:
(MS1) Precursors which are analyte ions enter the mass analyzer. They separate and in the collision cells
fragmentation. From this selected ions monitor and detect in the MS2, second mass analyzer. (Ebeler,
2017) Some structural information can be obtained by carefully selecting MS1 and MS2, for example,
identifying the productions detected in MS2 that are formed from specific precursor ions selected in
MS1. MS1 is responsible that analytes react in collision cell and MS2 scans them which are constant
neutral losses from analytes, known as precursors.
MS1 and MS2 both select only for pre-identified masses which are specific. Using two or more
mass analyzers, not interesting analytes can be removed, and sensitivity for interested analytes increases.
(Sleeman, Carter, 2005)

31
2.4 Spectrophotometry method
2.4.1 Determination of Total polyphenols in beer and wort
Principle:
polyphenols are reacting with Fe3+ ions in an alkaline solution. The iron complex is forming,
the reaction yields a brownish color. Samples are measured spectrophotometrically at 600 nm. (Aron and
Shellhammer 2012)
Used Apparatus:
Spectrophotometer 600 nm
Cuvettes, 1 cm path length
Centrifuge
25 ml Flask
10 ml pipettes;
1 ml pipettes;
Used reactions:
Carboxymethyl cellulose ethylenediaminetetraacetic acid (Sodium salt) solution. (CMC-EDTA-Na2)
Ammonium iron (III) citrate;
Ammonia diluted; One part ammonia with two-part H20; 1:2 dilution.
Distilled water
Procedure:
1. By shaking degas beer, remove CO2
2. Sample should be clear, so turbid wort or beer should be clarified through centrifugation
3. Transferred 10 ml analysis sample (beer, wort) and added 8 ml CMC-EDTA solution to a 25 ml
volumetric flask and mixed.
Added 0,5 ml iron Fe3+ solution and mixed again.
4. Next step, added 0,5 ml diluted ammonia solution and mixed thoroughly. a 25 ml volumetric flask
filled with H20 and again mixed.
5. Ready Samples measured after 10 min at 600 nm against a blank sample. Cuvettes, 1 cm path length.
(Mebak 2012)

32
Prepare Blank sample:
Each sample is measured against a blank sample.
10 ml solution was tested in addition to 8 ml CMC-EDTA solution.
Added 0,5 ml diluted ammonia solution.
Sample filled with H20 to the 25 ml mark and again mixed.
Remark: Samples before measuring should be mixed, also after adding each solution.
Calculation: (Ap-Ab) X 820; where Ap is a sample, Ab blank sample, absorption.
Results are in mg/ml with no decimal.
Object of research
For research, we chose five beers, that are made from different malt and hops.
We can also observe and compare total polyphenol concentration in wort and ready bottle beer.
Each sample is measured against a blank sample.
10 ml the solution was tested in addition to an 8 ml CMC-EDTA solution.
Added 0,5 ml diluted ammonia solution. Sample filled with H20 to the 25 ml mark and again mixed.
Remark: Samples before measuring should be mixed, also after adding each solution.
Calculation:
(Ap-Ab) X 820; where Ap is a sample, Ab blank sample, absorption. (Mebak, 2012)
Remark: Results are in mg/ml with no decimal.
33
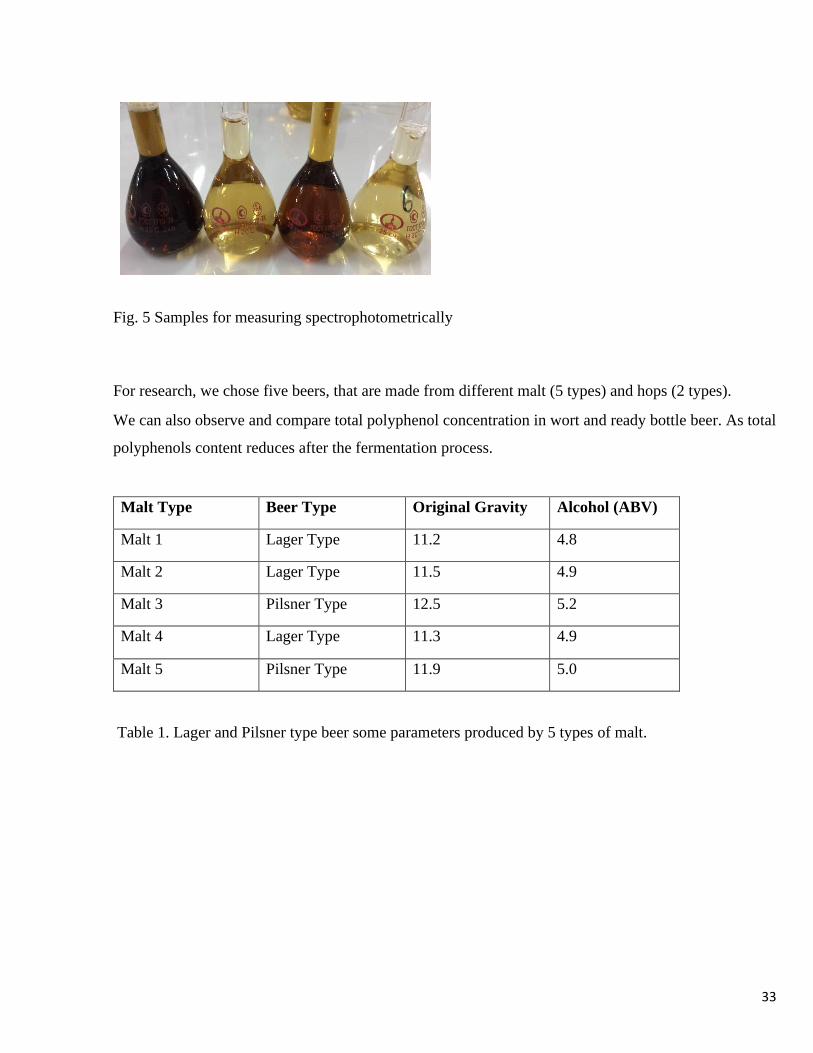
Fig. 5 Samples for measuring spectrophotometrically
For research, we chose five beers, that are made from different malt (5 types) and hops (2 types).
We can also observe and compare total polyphenol concentration in wort and ready bottle beer. As total
polyphenols content reduces after the fermentation process.
Malt Type Beer Type Original Gravity Alcohol (ABV)
Malt 1 Lager Type 11.2 4.8
Malt 2 Lager Type 11.5 4.9
Malt 3 Pilsner Type 12.5 5.2
Malt 4 Lager Type 11.3 4.9
Malt 5 Pilsner Type 11.9 5.0
Table 1. Lager and Pilsner type beer some parameters produced by 5 types of malt.

34
2.4.2 Determination of Total polyphenols in Wines by Folin Denis’ reagent
Principle: Determination is based on Folin Denis’s reagent, a specific reaction between
phosphotungstic acid (H3PW12O40 ) and phosphomolybdic acid (H3PMo12O40 ) and phenolic
compounds, in alkaline medium blue coloring obtained and is dependent on the number of
phenols. Samples are measured spectrophotometrically at 600 nm.
Used Apparatus:
• Spectrophotometer 750 nm
• Cuvettes, 1 cm path length
• 25 ml Flask
• 1,5 ml Eppendorf
• 1000 µl and 5 ml variable pipettes;
Used reagents & reactive
Folin-Denis’ reagent
10 % Na2CO3
H20
Procedure:
Transfer 250 µl diluted samples in 25 ml flask. Samples are filtered.
Added 1,25 ml Folin-Denis reagent
Incubate for 3 min at room temperature and gently shaking samples
Added 2,5 ml 10%-იან Na2CO3
Filed flask to the mark with H20
Incubation 30 minutes and periodically shaking samples
35
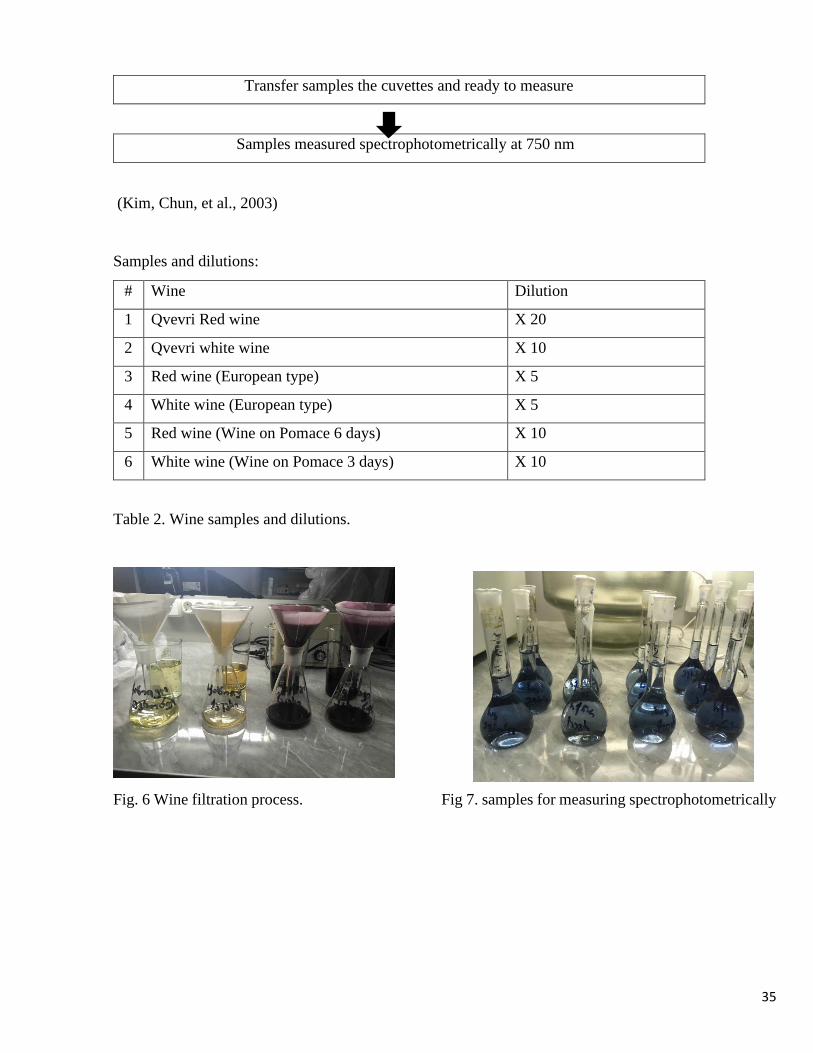
Transfer samples the cuvettes and ready to measure
Samples measured spectrophotometrically at 750 nm
(Kim, Chun, et al., 2003)
Samples and dilutions:
# Wine Dilution
1 Qvevri Red wine X 20
2 Qvevri white wine X 10
3 Red wine (European type) X 5
4 White wine (European type) X 5
5 Red wine (Wine on Pomace 6 days) X 10
6 White wine (Wine on Pomace 3 days) X 10
Table 2. Wine samples and dilutions.
Fig. 6 Wine filtration process. Fig 7. samples for measuring spectrophotometrically

36
2.4.3 Determination of Total flavonoids by using AlCl3 method
The detection of total flavonoids in wines is based on the principle of the Aluminium chloride
colorimetric method, as Aluminium chloride with C-4 keto groups forms acid-stable complexes, this
same complex can form with C-3, C-5 hydroxyl group pf flavonols and flavones and also acid-labile
complexes with the orthodihydroxyl groups in the A- or B-ring of flavonoids.
The total flavonoid content was calculated using Equation 1 as milligrams of Quercetin
Equivalent (QE). So, as the standard calibration curve quercetin solutions of various concentrations were
used. (Bhaigyabati et al., 2015)
Used reagents:
• 5 % NaNO2
• 1M NaOH
• 10 % AlCl3
• H20
Used apparatus:
• Cuvettes, 1 cm path length
• 25 ml Flask
• 1,5 ml Eppendorf
• 1000 µl and 5 ml variable pipettes;
• Spectrophotometer 750 nm
Procedure:
Added 10 ml H20 to the 25 ml flask
Added 250 µl sample
Added 0.75 ml 5 %-იან NaNO2-ს
Incubate for 5 minutes
37
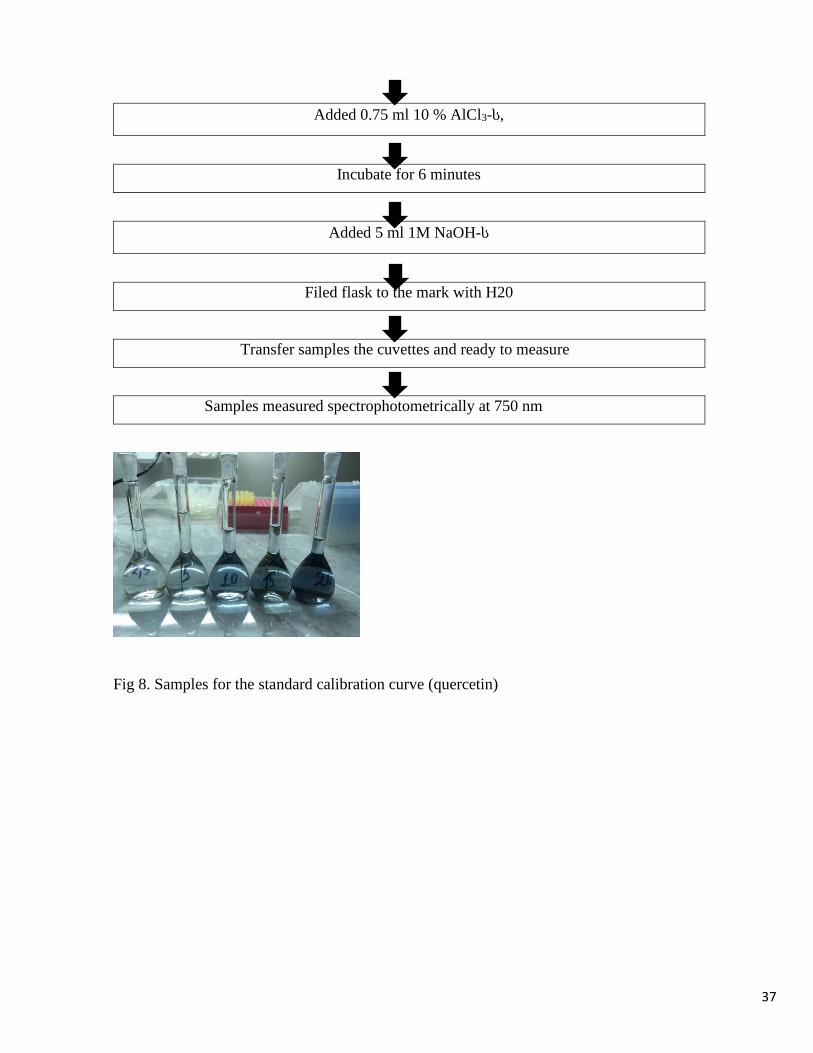
Added 0.75 ml 10 % AlCl3-ს,
Incubate for 6 minutes
Added 5 ml 1M NaOH-ს
Filed flask to the mark with H20
Transfer samples the cuvettes and ready to measure
Samples measured spectrophotometrically at 750 nm
Fig 8. Samples for the standard calibration curve (quercetin)

38
2.4.4 Determination of Total polyphenols in fresh and commercial juices by Folin Ciocalteus’
method
Determination of total polyphenols in fresh juices and commercial juices using by Folin
Ciocalteu reagent. The polyphenol contents are different in fresh and commercial juices and also based
on the extraction method and vary from fruit with/without peeled fruits.
The total polyphenol content is expressed as gallic acid equivalents. (Donovan, Meyer,
Waterhouse, Agric 1998)
Used apparatus:
• 1,5 ml Eppendorf
• 1000 µl and 5 ml variable pipettes;
• Spectrophotometer 755 nm
• Centrifuge
• Mortar and pestle
Used reagents:
• 20 % Na2Co3
• Folin Ciocalteu reagent
• H20
Procedure:
0.5 ml Folin Ciocalteu reagent was added to the 0,1 ml diluted sample.
Next step added 1,7 ml 20 % Na2Co3 .
Added 10 ml distilled water.
Incubation 20 minutes.
Samples measured at Spectrophotometer 755 nm.
Remark: results are in mg of gallic acid equivalents per 100 g sample.

39
Table 3. Fresh and commercial* juices for analysis.
For the analysis extraction method is important and dilution for the samples. With turbidity
samples centrifuge was used. Dilution factor 1:5
*For the analysis commercial juices ware taken with written on labels 100 % natural juices.
Orange fresh juice
Apple fresh juice
Pear fresh juice
Grape fresh juice
Commercial Orange juice
Commercial Apple juice
Commercial Pear juice
Commercial Grape juice
40
2.5 Inductively Coupled Plasma Optical Emission spectroscopy for measuring Elements.
Inductively Coupled Plasma Optical Emission Spectroscopy (ICP-OES) is used to determine
certain elements in a sample. The detection principle is based on the principle of atoms and ions
absorption energy to move electrons from ground to excited state.
So, the Exciting atoms or ions using an argon plasma. The intensity of the light emitted is
measured when ions or electrons in atoms return to a lower energy state or ground state. Specific elements
calculation in solution is based on calibration graphs.
Samples are measured on Inductively Coupled Plasma Optical Emission spectroscopy and
detected elements results in mg/ml. (Mirabal-Gallardo et al.,
Control software calculates the concentration of each element in the sample before the sample
analysis calibration is performed and results by the software are shown as a report.
Used Apparatus:
Inductively Coupled Plasma Optical Emission Spectroscopy (ICP-OES). ICAP-7400 Duo
1 ml, 5 ml Pipettes
100 ml graduated cylinder
Solutions:
Cu, Zn, K, Ca, Na, Mg, Mn, Cl, Cd, Al, Pb, As certificated standard solutions (CRM); Concentration
1000 mg/l.
HCL (1:5 dilution)
HNO3 (1:10 dilution)
Purified Argon gas 99.99 %
NaOH
NaBH4
Prepared calibration solutions MIX 1, MIX 2, MIX 3, K2000 and K500 with CRM.
Solutions MIX 1 – 20 mg/l Cu, Zn, K, Ca, Na, Mg, Mn, Cl, Cd, Al, Pb. To prepare solution 2
ml CRM filled in 100 ml flask and added 1 ml HCL, with H20 filled flack to the mark.
41
MIX 2 solution- 5 mg/l Pb. To prepare solution Pb CRM 0,5 ml added to 100ml flask and added
HCL, with H20 filled flack to the mark.
MIX 3 solution – 5 mg/l Cd. To prepare solution Cd CRM 0.5 ml added to 100ml flask and
added HCL, with H20 filled the flack to the mark.
Calibration solutions:
K2000-
10 ml MIX 1;
2 ml MIX;
0.2 ml MIX 3
To these mixes added to the 100 ml graduated cylinder and added 2 mg HCL, 1 mg HNO3 , 25 ml k
solution (1g/l) and filled the flask with H20 to the mark.
K500-
2,5 ml MIX 1;
10 ml MIX;
10 ml MIX 3
To these mixes added to the 100 ml graduated cylinder and added 2 mg HCL, 1 mg HNO3 , 25 ml k
solution (1g/l) and filled flask with H20 to the mark.
Remark : if the sample is not homogenized, it should be filtered or degas.
42
2.6 Statistical data analysis by SPSS Software
A statistical research method is a crucial part of confidence level (CI) which in statistics
estimates the observed data. For our research data analysis, a 95 % confidence level was used. The most
commonly used statistics test include T-tests, one-way ANOVA, etc.
Statistical which is a range of values, bounds statistics’ mean which is above and below of it
and contains true populations.
Statistical analysis includes also error bars which sometimes can be showed by standard
deviation, confidence intervals such as 95 % interval, or just one standard error. (IBM SPSS, 2009) For
our study, this kind of standard error bar was used.
Important terms are small SD bars which show the low spread of data and large SD bars which
indicate the large bars by meaning that data from the mean is variable. Also when the bars are small they
reveal that values are concentrated and plot the average value. When the result shows large error bars,
more or less data is not reliable and values are spread. Overall, they are the measurement for the
variability with graphical representation and help us to make general ideas about measurements.
For our research data analysis, IBM SPSS software was used, which gives us results in data
analysis 95 % confidence and shows error bars. Depend on the data graphs or pie charts, histograms, etc.
could be represented. (Landau and Everitt 2004)

43
Results & Discussion
Results of Total polyphenols in beer and beer wort.
Wort (Malt types) Total Polyphenols (mg/L)
Wort 1 (Malt 1) 202(mg/L)
Wort 2 (Malt 2) 210(mg/L)
Wort 3 (Malt 3) 270(mg/L)
Wort 4 (Malt 4) 276(mg/L)
Wort 5 (Malt 5) 215(mg/L)
Table 4. Total polyphenols (mg/L) concentration in beer wort.
Fig 9. Total polyphenols (mg/L) concentration in beer wort made by 5 types malt.

44
Results of Total polyphenols (mg/l) Ready beer bottles.
Table 5. Total polyphenols (mg/L) concentration in ready beer bottles.
Fig 10. Total polyphenols (mg/L) concentration in ready beer bottles
Remark: Total polyphenols (mg/l) in beer bottles are after fermentation and filtration process.
Fermentation and Filtration process effects the total polyphenols concentration. The range of
concentration is between 120-150 mg/L.
Bottle Beers (wort types) Total polyphenols (mg/l)
Beer 1 (Wort 1) 130
Beer 2 (Wort 2) 138
Beer 3 (Wort 3) 146
Beer 4 (Wort 4) 120
Beer 5 (Wort 5) 143

45
Results of Total polyphenols (g/l) concentration in different types of wines.
Wine Types Total polyphenols (g/L)
White European Wine 162 (g/L)
Qvevri White Wine 232 (g/L)
Red European Wine 174 (g/L)
Qvevri Red Wine 250 (g/L)
White Wine (3 days on Pomace) 168 (g/L)
Red Wine (6 days on Pomace) 181 (g/L)
Table 6. Total polyphenols (g/L) in different types of wine.
Fig 11. Total polyphenols (g/L) in different types of wine.
Total polyphenols concentration depend on winemaking process and differs in White and Red wines.
46
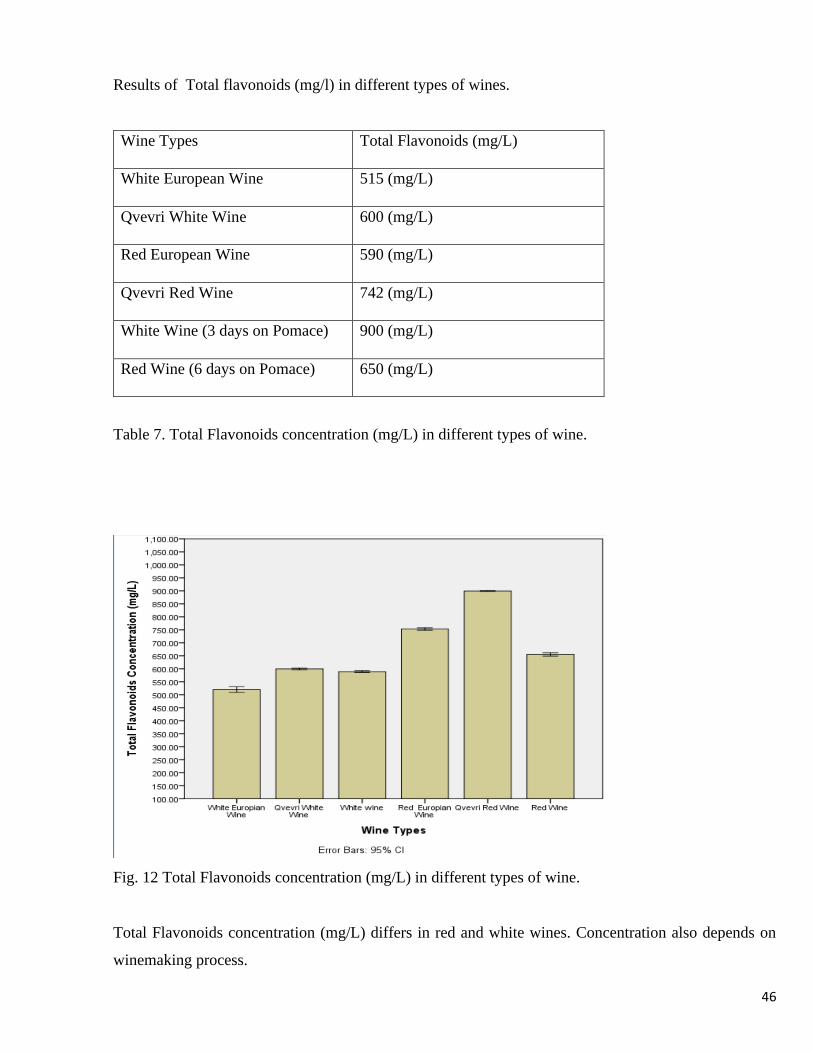
Results of Total flavonoids (mg/l) in different types of wines.
Wine Types Total Flavonoids (mg/L)
White European Wine 515 (mg/L)
Qvevri White Wine 600 (mg/L)
Red European Wine 590 (mg/L)
Qvevri Red Wine 742 (mg/L)
White Wine (3 days on Pomace) 900 (mg/L)
Red Wine (6 days on Pomace) 650 (mg/L)
Table 7. Total Flavonoids concentration (mg/L) in different types of wine.
Fig. 12 Total Flavonoids concentration (mg/L) in different types of wine.
Total Flavonoids concentration (mg/L) differs in red and white wines. Concentration also depends on
winemaking process.

47
Results of Na, CL, Fe, Zn concentration (mg/ml) in red and white wines.
Wine Types Elements Concentration(mg/ml)
White wine Na 3,3 (mg/ml)
Red wine Na 4,1 (mg/ml)
White wine Cl 2,1 (mg/ml)
Red wine Cl 2,1 (mg/ml)
White wine Fe 0,5 (mg/ml)
Red wine Fe 0,8 (mg/ml)
White wine Zn 0,22 (mg/ml)
Red wine Zn 0,22 (mg/ml)
Table 8. Elements in wines (mg/ml)
Fig .13 Elements in wines (mg/ml)
Different elements concentration in some cases is different in white and wine wines. Na and Cl
concentration exceeds in wines Fe and Zn concentration.

48
Results of K, Ca, Mg concentration (mg/ml) in red and white wines.
Wine Types Elements Concentration(mg/ml)
White wine K 350 (mg/ml)
Red wine K 422 (mg/ml)
White wine Ca 60 (mg/ml)
Red wine Ca 65 (mg/ml)
White wine Mg 46 (mg/ml)
Red wine Mg 52 (mg/ml)
Table 9. Elements in wines (mg/ml)
Fig. 14 Elements in wines (mg/ml)
Different elements concentration in some cases is different in white and wine wines. K concentration
exceeds in wines Ca and Mg elements concentration.

49
Results of Mn, Cu, Cd, As concentration (mg/ml) in red and white wines.
Wine Types Elements Concentration(mg/ml)
White wine Mn 0.02 (mg/ml)
Red wine Mn 0.02 (mg/ml)
White wine Cu 0.07 (mg/ml)
Red wine Cu 0.08 (mg/ml)
White wine Cd 0.002 (mg/ml)
Red wine Cd 0.002 (mg/ml)
White wine As 0.005 (mg/ml)
Red wine As 0,006 (mg/ml)
Table 10. Elements in wines (mg/ml)
Fig 15. Elements in wines (mg/ml)

50
Mn, Cu, Cd and As elements concentration ranges between 0.002-0.02 mg/ml concentration.
Results of Total polyphenols concentration (mg/ml) in fresh and commercial juices.
Fresh and Commercial juices Total polyphenols Concentration (mg/ml)
Orange fresh juice 180 (mg/ml)
Commercial Orange juice 214 (mg/ml)
Pear fresh juice 215 (mg/ml)
Commercial Pear juice 122 (mg/ml)
Grape fresh juice 525 (mg/ml)
Commercial Grape juice 445 (mg/ml)
Apple fresh juice 464 (mg/ml)
Commercial Apple juice 245 (mg/ml)
Table 11. Total polyphenols Concentration (mg/ml) in fresh and commercial juices.
Fig 16. Total polyphenols Concentration (mg/ml) in fresh and commercial juices.

51
Total polyphenols Concentration depend on fruit extraction type, raw material. In some fruit
cases, like apple, skin is main source for polyphenols.
Polyphenolic composition varies among different wines according to the type of grape used,
vinification process used, type of yeast that participates in the fermentation, and whether grape solids are
present in the maceration process. Winemaking types also affect active compound concentration.
Even the same type of grapes in the fermentation and winemaking process could show different
phenolic content which is due to temperature, weather variations, and also biological effects like
insecticides, fungi. Wine quality depends on various parameters which overall affect its quality. The total
phenolic compound quantity depends on maceration, fermentation, and technology type.
In general, non-alcoholic beverages contain a high amount of carbs and it exceeds beer carbs
content. Added sugar is the main reason. Commercial and fresh juices quality and quantity of nutritional
value also depend on raw material choice and companies' technology process.
Essential oils are key components for non-alcoholic beverages, which are extracted from the
fruit with the addition of other ingredients such as sugar, water, colorants, preservatives, thickeners and
they mainly are responsible for the taste.
In alcoholic drinks, yeast plays an important role in aroma mostly flavor is achieved naturally
from already existing essential oils.
52
Conclusions
1. Determination of quantitative contents of phenolic compounds in beverages showed a
high number in red wines compared to white wines and non-alcoholic beverages, such as grape juice,
red wines could be a beneficial part of a nutritious diet.
2. The fermentation process enhances nutritional value of beverages and gives unique
properties, yeast type affects the polyphenolic composition of alcoholic and non-alcoholic beverages.
3. The phenolic content and antioxidant activity of beer, wine, and beverages depend on the
quantity and quality of starting materials and on the technology type. For the assessment of
biologically active compounds and elements in beverages HPLC and Spectrophotometry methods are
useful.

53
References
[1] Artero A, Artero A, Tarín JJ, et al. 2015 The impact of moderate wine consumption on
health. Maturitas. 2015;80(1):3–13
[2] D De Keukeleire 1, L De Cooman, H Rong, A Heyerick, J Kalita, S R Milligan, 2003. Functional
properties of hop polyphenols. doi: 10.1007/978-1-4615-4139-4_41.
[3] J.Agric.Food Sato M., Ramarathnam N., Suzuki Y., Ohkubo T., Takeuchi M., Ochi H. “Varietal
differences in the phenolic content and superoxide radical scavenging potential of wines from different
sources”
[4] Hussain MS, Fareed S, Ansari S, Rahman MA, Ahmad IZ, Saeed M J Pharm Bioallied Sci. 2012 Jan;
Current approaches toward production of secondary plant metabolites. 4(1):10-20. doi: 10.4103/0975-
7406.92725
[5] Kanti Bhooshan Pandey and Syed Ibrahim Rizv, 2009. Plant polyphenols as dietary antioxidants in
human health and disease. doi: 10.4161/oxim.2.5.9498
[6] Augustin Scalbert, Claudine Manach, Christine Morand, Christian Rémésy, Liliana Jiménez, 2005.
Dietary polyphenols and the prevention of diseases. DOI: 10.1080/1040869059096
[7] Alan W Taylor 1, Elizabeth Barofsky, James A Kennedy, Max L Deinzer. 2003. Hop (Humulus lupulus
L.) proanthocyanidins characterized by mass spectrometry, acid catalysis, and gel permeation
chromatography. doi: 10.1021/jf0340409
[8] Alan J. Buglass, 2015. Chemical Composition of Beverages and Drinks 10. p. 227-245. DOI
10.1007/978-3-642-36605-5_29
[9] Joanne L. Slavin, and Beate Lloyd. 2012 Jul; 3(4): 506–516. Health Benefits of Fruits and Vegetables.
doi:10.3945/an.112.002154
[10] Hardwick, W.A. 1994; History and antecedents of brewing. In Handbook of Brewing; New York, 1994;
37–52.
[11] Shen J, Wilmot KA, Ghasemzadeh N, Molloy DL, Burkman G, Mekonnen G, Gongora MC, Quyyumi
AA, Sperling LS, (2015). "Mediterranean Dietary Patterns and Cardiovascular Health" Annual Review
of Nutrition. doi: 10.3945/jn.116.241919

54
[12] Lopez-Velez, M., Martinez-Martinez, F. and Del Valle-Ribes, C. (2003) The Study of Phenolic
Compounds as Natural Antioxidants in Wine. Critical Reviews in Food Science and Nutrition, 43, 233-
244. http://dx.doi.org/10.1080/10408690390826509
[13] Steffen, L.M., Jacobs, D.R., Stevens, J., Shahar, E., Carithers, T. and Folsom, A.R. (2003) Associations
of Whole Grain, Refined-Grain, and Fruit and Vegetable Consumption with Risks of All-Cause Mortality
and Incident Coronary Artery Disease and İschemic Stroke: The Atherosclerosis Risk in Communities
(ARIC) Study. The American Journal of Clinical Nutrition, 78, 383-390.
[14] Anoma Chandrasekara, Fereidoon Shahidi, 2018. Herbal beverages: Bioactive compounds and their role
in disease risk reduction. Pages 451-458 https://doi.org/10.1016/j.jtcme.2017.08.006
[15] Tamang J.P, 2016. Ethnic Fermented Foods and Alcoholic Beverages of Asia. 2016. pp. 341–382.
[16] SergiMaicas,2020. The Role of Yeasts in Fermentation Processes. doi: 10.3390/microorganisms8081142
[17] Eirini Dimidi, Selina Rose Cox,Megan Rossi, and Kevin Whelan. 2019. Fermented Foods: Definitions
and Characteristics, Impact on the Gut Microbiota and Effects on Gastrointestinal Health and Disease.
doi: 10.3390/nu11081806
[18] Garcia Orc, Marie Guerin, Kaies Souidi and Fabienne Remize. 2020. Lactic Fermented Fruit or
Vegetable Juices: Past, Present and Future. https://doi.org/10.3390/beverages6010008
[19] Walker G.M., Stewart G.G.. 2016. Saccharomyces cerevisiae in the Production of Fermented
Beverages. Beverages. doi: 10.3390/beverages2040030.
[20] Ribereau-Gayon, P.; Dubourdieu, D.; Doneche, B.; Lonvaud, A. Handbook of Enology Volume 1. The
Microbiology of Wine and Vinifications; John Wiley & Sons: Chichester, UK, 2000.
[21] Ileana Vigentini, David Maghradze, Maurizio Petrozziello, Federica Bonello, Vito Mezzapelle, Federica
Valdetara, Osvaldo Failla, and Roberto Foschino, 2016. Indigenous Georgian Wine-Associated Yeasts
and Grape Cultivars to Edit the Wine Quality in a Precision Oenology Perspective.
doi: 10.3389/fmicb.2016.00352
[22] V. Cheynier, J. Rigaud 1986. HPLC separation and characterization of flavonols in the skins of Vitis
vinifera var. Cinsault. American Journal of Enology and Viticulture.
[23] S Pervaiz 2001. Resveratrol--from the bottle to the bedside? DOI: 10.3109/10428190109097648
55
[24] Van Buren J.P., Bertino J.J., Einset J., Remaily G.W., Robinson W.B. A comparative study of the
antocyanin pigment composition in wines derived from hybrid grapes. Am. J. Enol. Vitic. Doi:
1970;21:117–130.
[25] Nykänen, L. & Suomalainen, H. (1983) Aroma of Beer, Wine and Distilled Alcoholic Beverages, Berlin,
Akademie-Verlag.
[26] Nykänen L., Puputti E., Suomalainen H. Volatile fatty acids in some brands of whisky, cognac and rum.
J. Food Sci. 1968;33:88–92.
[27] L.Frémon. 2000 Jan 14;66(8):663-73. Biological effects of resveratrol. DOI:10.1016/s0024-
3205(99)00410-5
[28] Andrew L Waterhouse. 2002 ;957():21-36 Wine phenolics. DOI: 10.1111/j.1749-6632.2002.tb02903.x
[29] Sara Arranz, Gemma Chiva-Blanch, Palmira Valderas-Martínez, Alex Medina-Remón, Rosa M.
Lamuela-Raventós, and Ramón Estruch, 2012 Wine, Beer, Alcohol and Polyphenols on Cardiovascular
Disease and Cancer. doi: 10.3390/nu4070759
[30] Khurana S, Venkataraman K, Hollingsworth A, Piche M, Tai TC. 2013 Sep 26; 5(10):3779-827.
Polyphenols: benefits to the cardiovascular system in health and in aging. doi: 10.3390/nu5103779
[31] Mukamal KJ, Jensen MK, Grønbaek M, Stampfer MJ, Manson JE, Pischon T, Rimm EB Circulation.
2005 Sep 6; 112(10):1406-13. Drinking frequency, mediating biomarkers, and risk of myocardial
infarction in women and men. DOI: 10.1161/CIRCULATIONAHA.105.537704
[32] Estruch R, Sacanella E, Mota F, Chiva-Blanch G, Antúnez E, Casals E, Deulofeu R, Rotilio D, Andres-
Lacueva C, Lamuela-Raventos RM, de Gaetano G, Urbano-Marquez A, 2011. ’Moderate consumption
of red wine, but not gin, decreases erythrocyte superoxide dismutase activity: a randomised cross-over
trial’’ doi: 10.3390/nu4070759
[33] Hideaki Shimizu, Fumikazu Akamatsu, Aya Kamada, Kazuya Koyama, Kazuhiro Iwashita, Nami Goto-
Yamamoto, 2020. Variation in the mineral composition of wine produced using different winemaking
techniques. DOI: 10.1016/j.jbiosc.2020.03.012
[34] Yaneris Mirabal-Gallardo, María A. Caroca-Herrera, Luis Muñoz, Macarena Meneses, and V. Felipe
Laurie. 2018 ‘’Multi-element analysis and differentiation of Chilean wines using mineral composition
and multivariate statistics’’, DOI:10.7764/rcia.v45i2.1883

56
[35] Charles W. Bamforth (2006). "Beer as liquid bread: Overlapping science. World Grains Summit 2006:
Foods and Beverages. San Francisco, California, US.
[36] Joseph Caspermeyer, 2015. The Evolution of Beer. Page 295, doi.org/10.1093/molbev/msv229
[37] Margo. A. Denke 2000. Nutritional and health benefits of beer. DOI: 10.1097/00000441-200011000-
00004.
[38] Ivana Marova, Ivana Marova, Katerina Parilova, Katerina Parilova, 2011. Analysis of Phenolic
Compounds in Lager Beers of Different Origin: A Contribution to Potential Determination of the
Authenticity of Czech Beer. DOI: 10.1007/s10337-011-1916-7.
[39] Nykänen, L. & Suomalainen, H. (1983) Aroma of Beer, Wine and Distilled Alcoholic Beverages, Berlin,
Akademie-Verlag.
[40] Tressl, R., Renner, R., Kossa, T. & K 2vppler, H. (1977) Gas chromatographic-mass spectrometric
analysis of volatile compounds in hops, wort and beer and their genesis. III. Nitrogen-containing aroma
components in malt and beer (Ger.). In: Proceedings in the 16th European Brewery Convention Congress,
Amsterdam, pp. 639–707.
[41] Mayer Jr 1, J Simon, H Rosolová, 2001. Population study of the influence of beer consumption on folate
and homocysteine concentrations. DOI: 10.1038/sj.ejcn.1601191
[42] X.-J. Song, in Nutritional Modulators of Pain in the Aging Population, 2017. Analgesic and
Neuroprotective Effects of B Vitamins eBook ISBN: 9780128053362
[43] Pérez-Jiménez J, Neveu V, Vos F, Scalbert A. 2010. Identification of the 100 richest dietary sources of
polyphenols: an application of the Phenol-Explorer database. DOI: 10.1038/ejcn.2010.221
[44] Scalbert A., Manach C., Morand C., Rémésy C., Jimenez L. 2005. Dietary Polyphenols and the
Prevention of Diseases. doi: 10.1080/1040869059096.
[45] Giorgia Spaggiari, Angelo Cignarelli, Andrea Sansone, Matteo Baldi,Daniele Santi. 2020, To beer or not
to beer: A meta-analysis of the effects of beer consumption on cardiovascular health.
[46] Padro T, Munoz-Garcia N, Vilahur G, Chagas P, Deya A, Antonijoan RM, et al. 2018. Moderate Beer
Intake and Cardiovascular Health in Overweight Individuals.
[47] R.H. Liu, L.G. Malta, 2004. Analyses of Total Phenolics, Total Flavonoids, and Total Antioxidant
Activities in Foods and Dietary Supplements.

57
[48] Elija Khatiwora, Vaishali B, Adsul Vaishali, B AdsulManik, M Kulkarni. 2013. Spectroscopic
determination of total phenol and flavonoid contents of Ipomoea carnea. Research 2(3):974-4290
[49] Ali Khoddami, Meredith A Wilkes, Thomas H Roberts. 2013 Techniques for Analysis of Plant Phenolic
Compounds. DOI: 10.3390/molecules18022328
[50] Nathan R Perron, Julia L Brumaghim. 2009. A review of the antioxidant mechanisms of polyphenol
compounds related to iron binding. DOI: 10.1007/s12013-009-9043-x
[51] A.J. Stewart, R.F. Stewart, 2008 Encyclopedia of Ecology, Production of Naturally Occurring Phenols
[52] S Floridi, L Montanari, O Marconi, P Fantozzi. 2003. Determination of free phenolic acids in wort and
beer by coulometric array detection.
[53] Julia Wannenmacher , Martina Gastl, Thomas Becker. 2018. Phenolic Substances in Beer: Structural
Diversity, Reactive Potential and Relevance for Brewing Process and Beer Quality.
https://doi.org/10.1111/1541-4337.12352
[54] Mirella Nardini, Andrea Ghiselli, 2004. Determination of free and bound phenolic acids in beer. Food
Chemistry 84(1):137-143 DOI: 10.1016/S0308-8146(03)00257-7
[55] Mirella Nardini, Andrea Ghiselli, 2004. Determination of free and bound phenolic acids in beer. Food
Chemistry 84(1):137-143 DOI: 10.1016/S0308-8146(03)00257-7
[56] M López-Vélez, F Martínez-Martínez, C Del Valle-Ribes. 2003. The study of phenolic compounds as
natural antioxidants in wine DOI: 10.1080/10408690390826509
[57] Burak, M & Imen, Y (1999) Flavonoids and their antioxidant properties.
[58] A. N. Panche, A. D. Diwan and S. R. Chandra. 2016. Journal of Nutritional Science. DOI:
https://doi.org/10.1017/jns.2016.41
[59] Samanta, A, Das, G & Das, S (2011) Roles of flavonoids in plants. P.12–35. ISSN: 0975-0525
[60] Amadeo Gironés-Vilaplana, Débora Villaño, Javier Marhuenda Diego A.Moreno Cristina García-
Viguera. 2017. Nutraceutical and Functional Food Components Chapter 6 – Vitamins. Pages 159-201,
doi.org/10.1016/B978-0-12-805257-0.00006-5
[61] Deanna C. Hurum, Brian M. De Borba, and Jeffrey S. Rohrer 2010. Determination of Soluble Vitamins
in Beverages

58
[62] Szabo, G., S. Chavan, P. Mandrekar and D. Catalano, 1999. Acute alcohol consumption attenuates IL-8
and MCP – 1 induction in response to ex vivo stimulation. J. Clin. Immunol., 19: 67-76
[63] Limuro,Y., B.U. Bradford, and S. Yamashina, 2000. The glutathione precursor 1 - 2 - oxothiazolidine -
4 - carboxylic acid protects against liver injury due to chronic enteral ethanol exposure in the rat.
Hepathol., 31: 391-398. doi.org/10.1002/hep.510310219
[64] Galan, P., F. Viteri, S. Bertrais, S. Czernichow and H. Faure, 2005. Serum concentrations of beta -
carotene, vitamins C and E, Zinc and selenium are influenced by sex, age, diet, smoking status, alcohol
consumption and corpulence in a general French adult population. DOI: 10.1038/sj.ejcn.1602230
[65] María Serrano Iglesias, María de Lourdes Samaniego Vaesken, and Gregorio Varela Moreiras. 2016.
Composition and Nutrient Information of Non-Alcoholic Beverages in the Spanish Market: An Update.
doi: 10.3390/nu8100618
[66] Drewnowski, A., Rehm, C.D. & Constant, F. Water and beverage consumption among adults in the
United States: cross-sectional study using data from NHANES 2005–2010. BMC Public Health 13, 1068
(2013). https://doi.org/10.1186/1471-2458-13-1068
[67] Alan J. Buglass. 2014. Chemical Composition of Beverages and Drinks. DOI 10.1007/978-3-642-41609-
5_29-1
[68] Mario G Ferruzzi, Jirayu Tanprasertsuk, Penny Kris-Etherton 2020. Perspective: ‘’ Role of Beverages as
a Source of Nutrients and Phytonutrients. doi: 10.1093/advances/nmz115.
[69] O'Neil CE, Nicklas TA, Rampersaud GC, Fulgoni VL 3rd. 2012. 100% orange juice consumption is
associated with better diet quality, improved nutrient adequacy, decreased risk for obesity, and improved
biomarkers of health in adults: National Health and Nutrition Examination Survey, 2003-2006. doi:
10.1186/1475-2891-11-107.
[70] Properties Jin Dai and Russell J. Mumper 2010. Plant Phenolics: Extraction, Analysis and Their
Antioxidant and Anticancer. doi: 10.3390/molecules15107313
[71] Ma H, Bai Y, Li J, Chang XY, 2012 Screening bioactive compounds from natural product and its
preparations using capillary electrophoresis’. doi.org/10.1002/elps.201700239
[72] Federico J V. Gomez, Romina P Monasterio, Verónica Carolina, Soto Vargas, María F Silva. 2012.
Analytical characterization of wine and its precursors by capillary electrophoresis. DOI:
10.1002/elps.201100595

59
[73] Yu, H. M., Tseng, M. J., Fang, J. M., Phutrakul, S., Chen,S. T 2004.,Electrophoresis
[74] Herrero, M., Arr ́aez-Rom ́an, D., Segura, A., Kenndler,E., Gius, B., Raggid, M. A., Ib ́a ̃nez, E.,
Cifuentes, A.,J.Chromatogr. A 2005,1084, 54–62
[75] Sontag G, Friedrich O. Determination of phenolic compounds in alcoholic beverages by HPLC with an
electrochemical detector. doi: 10.1007/BF01042706.
[76] L.S. Conte, S. Moret, G. Purcaro. 2011. HPLC in food analysis.
[77] Y. Peng, Q. Chu, F. Liu, J. Ye. 2004. Determination of phenolic constituents of biological interest in red
wine by capillary electrophoresis with electrochemical detection J. Agric. Food Chem., 52 (2004), pp.
153-156
[78] R.A. Frazier, J.A. Ames, H.E. Nursten. 2000. Capillary Electrophoresis for Food Analysis. Method
Development. https://doi.org/10.1039/9781847550316
[79] Hildegarde Heymann, Susan E. Ebeler, 2017, Instrumental analyses for alcoholic beverages, Pages 106-
132. https://doi.org/10.1016/B978-0-12-802727-1.00006-5.
[80] P.M. Rajcsanyi, E. Rajcsanyi 1975 High-Speed Liquid Chromatography.Chapter 2.6
[81] A.K. Hjelmeland, T.S. Collins, J.L. Miles, P.L. Wylie, A.E. Mitchell, S.E. Ebeler. 2012. High
throughput, sub ng/L analysis of haloanisoles in wines using HS-SPME with GC-triple quadrupole MS.
pp. 494-499
[82] N. Ochiai, K. Sasamoto, T. Kishimoto 2015. Development of a method for the quantitation of three thiols
in beer, hop, and wort samples by stir bar sorptive extraction with in situ derivatization and thermal
desorption-gas chromatography-tandem mass spectrometry J. Agric. Food Chem., 63 (2015), pp. 6698-
6706
[83] R. Sleeman, J.F. Carter, 2005. Encyclopedia of Analytical Science (Second Edition)
[84] Patricia M. Aron and Thomas H. Shellhammer. 2012 A Discussion of Polyphenols in Beer Physical and
Flavour. https://doi.org/10.1002/j.2050-0416.2010.tb00788.x
[85] Dr. Gerd Bender, PD Dr. Mehmet Coelhan, Helmut Klein and Dr. Martin Zarnkow. 2012 THE
MEBAK® COLLECTION OF BREWING ANALYSIS METHODS.

60
[86] Dae-Ok Kim, Ock Kyoung Chun, Young Jun Kim, Hae-Yeon Moon Ans Chang Y.Lee 2003
Quantification of Polyphenolics and Their Antioxidant Capacity in Fresh Plums.
DOI: 10.1021/jf0343074
[87] G.C. Bag , P. Grihanjali Devi and Th. Bhaigyabati. 2015 Assessment of Total Flavonoid Content and
Antioxidant Activity of Methanolic Rhizome Extract of Three Hedychium Species of Manipur Valley.
Article No. 28, Pages: 154-159
[88] Donovan, J. L.; Meyer, A. S.; Waterhouse, A. L. J. Agric. Food Chem. 1998. Phenolic composition and
antioxidant activity of prunes and prune juice (Prunus domestica)
[89] Yaneris Mirabal-Gallardo, María A. Caroca-Herrera, Luis Muñoz, Macarena Meneses, and V. Felipe
Laurie. 2018 Multi-element analysis and differentiation of Chilean wines using mineral composition and
multivariate statistics“. doi.org/10.7764/rcia.v45i2.1883
[90] IBM IBM to acquire SPSS Inc. to provide clients predictive analytics capabilities. 2009
[91] Sabine Landau and Brian S. Everitt 2004. A Handbook of Statistical Analyses using SPSS
