Guyana Goldfields - Aurora Gold Project Summary of PA Key ... · 4 4 Property Description and...
55
1 Insert picture(s) here Guyana Goldfields - Aurora Gold Project Summary of PA Key Findings August 24, 2009 IMPORTANT NOTICE This report was prepared exclusively for Guyana Goldfields Inc. by AMEC Americas Limited (AMEC). The quality of information, conclusions and estimates contained herein is consistent with the level of effort involved in AMEC’s services and based on: i) information available at the time of preparation, ii) data supplied by outside sources and iii) the assumptions, conditions and qualifications set forth in this report. This report is intended to be used by Guyana Goldfields Inc. only, subject to the terms and conditions of its contract with AMEC. Any other use of, or reliance on, this report by any third party is at that party’s sole risk.
Transcript of Guyana Goldfields - Aurora Gold Project Summary of PA Key ... · 4 4 Property Description and...

1
Insert picture(s) here
Guyana Goldfields - Aurora Gold ProjectSummary of PA Key Findings
August 24, 2009
IMPORTANT NOTICE
This report was prepared exclusively for Guyana Goldfields Inc. by AMEC Americas Limited (AMEC). The quality of information, conclusions and estimates contained herein is consistent with the level of effort involved in AMEC’s services and based on: i) information available at the time ofpreparation, ii) data supplied by outside sources and iii) the assumptions, conditions and qualifications set forth in this report. This report is intended to be used by Guyana Goldfields Inc. only, subject to the terms and conditions of its contract with AMEC. Any other use of, or reliance on, this report by any third party is at that party’s sole risk.
2
2
TABLE OF CONTENTS
Property Description and LocationGeology and ResourcesMiningProcessField StudiesInfrastructure and PowerTailings and Water ManagementFinancialsSchedule
2
AMEC Americas Limited (AMEC) has been retained by Guyana Goldfields Inc. (Guyana Goldfields) to prepare an independent technical report on the wholly-owned Aurora Gold property in northern Guyana. The country of Guyana is located on the northeast coast of South America.
This report summarizes key findings to date of the 2009 AMEC update (to be entitled “Guyana Goldfields: Aurora Project Preliminary Assessment” (PA)) of a Preliminary Economic Assessment prepared by Snowden in August 2008.
The update of the mineral resources for the Aurora Project was prepared by AMEC in conformance with the CIM Definition Standards for Mineral Resources and Mineral Reserves which are incorporated by reference into NI 43–101.
AMEC cautions that the results herein indicated are partly based on Inferred Mineral Resources that are considered too speculative geologically to have the economic considerations applied to them that would enable them to be categorized as Mineral Reserves, and there is no certainty that the preliminary assessment based on these Mineral Resources will be realized. The results of the economic analyses discussed in this report represent forward-looking information as defined under Canadian securities law. The results depend on inputs that are subject to a number of known and unknown risks, uncertainties and other factors that may cause actual results to differ materially from those presented here.

3
3
PROPERTY DESCRIPTION AND LOCATION
3
4
4
Property Description and Location
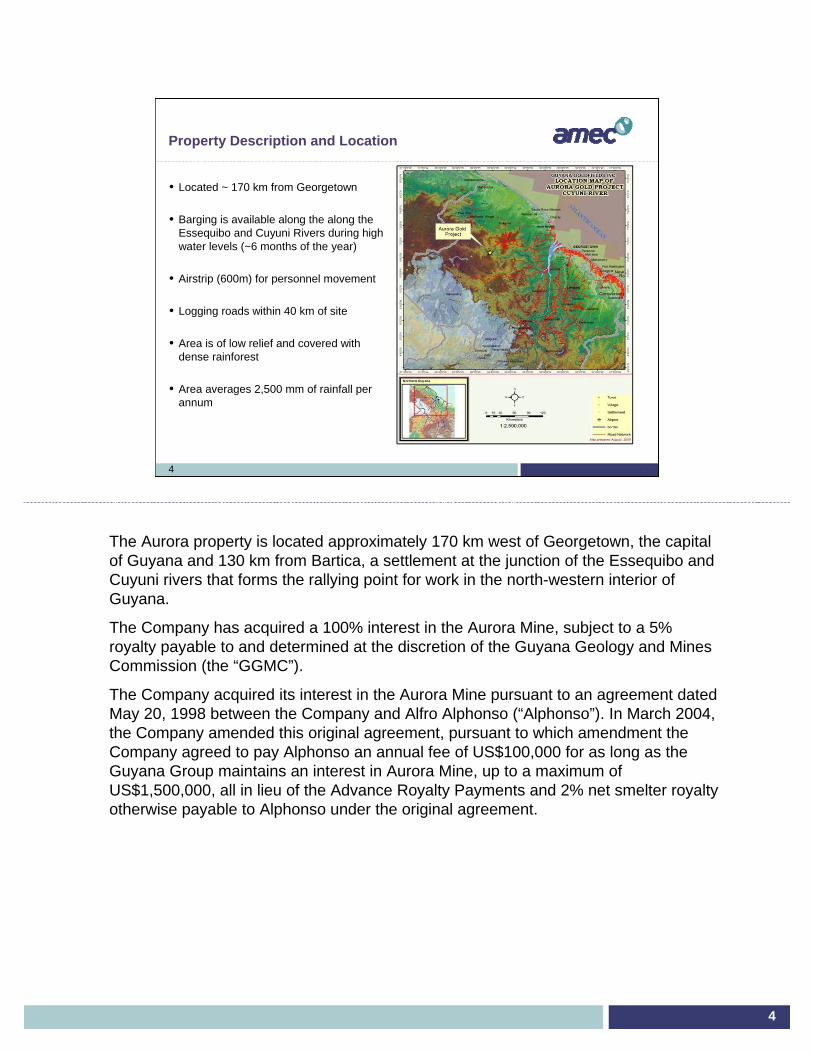
• Located ~ 170 km from Georgetown
• Barging is available along the along the Essequibo and Cuyuni Rivers during high water levels (~6 months of the year)
• Airstrip (600m) for personnel movement
• Logging roads within 40 km of site
• Area is of low relief and covered with dense rainforest
• Area averages 2,500 mm of rainfall per annum
4
The Aurora property is located approximately 170 km west of Georgetown, the capital of Guyana and 130 km from Bartica, a settlement at the junction of the Essequibo and Cuyuni rivers that forms the rallying point for work in the north-western interior of Guyana.
The Company has acquired a 100% interest in the Aurora Mine, subject to a 5% royalty payable to and determined at the discretion of the Guyana Geology and Mines Commission (the “GGMC”).
The Company acquired its interest in the Aurora Mine pursuant to an agreement dated May 20, 1998 between the Company and Alfro Alphonso (“Alphonso”). In March 2004, the Company amended this original agreement, pursuant to which amendment the Company agreed to pay Alphonso an annual fee of US$100,000 for as long as the Guyana Group maintains an interest in Aurora Mine, up to a maximum of US$1,500,000, all in lieu of the Advance Royalty Payments and 2% net smelter royalty otherwise payable to Alphonso under the original agreement.

5
5
Property Description and Location
• Aurora property hosts 8 known deposits within “The Golden Square Mile”
• Covers an area ~14,131 acres
• Much of the area remains unexplored
5
The property forms an oblong shape trending northwest to southeast, beginning at the Cuyuni River. The site, which has a history of exploratory operations dating to the 1940s, is in a largely uninhabited area of Guyana, and there are no villages within 40 km of the site. Land cover is relatively undisturbed forest, but there is a commercial forest concession on much of the surrounding area, and selective harvesting of higher value tree species is ongoing.
Deposits and Prospects:• Aleck Hill• North Aleck Hill, about 500 m north of Aleck Hill• Rory’s Knoll• East Walcott Hill and Walcott Hill. The geometry of the zone suggests that it might be an up dip extension of the Rory’s Knoll zone. The Walcott Hill prospect is 150 m west of East Walcott Hill• Mad Kiss, located about 450 m east of Aleck Hill• West Mad Kiss, located 200 m west of Mad Kiss• South Mad Kiss, located about 250 m south of Mad Kiss

6
6
GEOLOGY AND RESOURCES
6
AMEC was requested by Guyana Goldfields to review and validate the Aurora mineral resources. The Aurora Project mineral resources review was conducted by AMEC Americas in conformance with the CIM Definition Standards for Mineral Resources and Mineral Reserves which are incorporated by reference into NI 43–101.
Richard Kilpatrick, P.Geo. Principal Geologist and Jeff Smith, P.Geo. Senior Geologist both from the AMEC-Oakville office are responsible for validating the geology and mineral resources, respectively and are independent of Guyana Goldfields. Nikki Grieco, P. Eng., also of the AMEC Oakville office and Waldo Arias, MAusIMM, AMEC Lima, Peru, provided assistance in validating the mineralresources. The mineral resources for Aurora, as validated by AMEC, have an effective date of June 10, 2009, which represents the cut-off date for the drilling information used by AMEC for the Aurora mineral resource validation models.
A site visit to the Aurora site was completed by Jeff Smith, P.Geo and Richard Kilpatrick, P.Geo from March 20-24, 2009

7
7
Geology
• Hosted in Cuyuni Greenstone Belt, with known history of gold mining
• Lower Proterozoic metasedimentary and metavolcanic rocks of Cuyuni Formation
• Rocks metamorphosed to Greenschistfacies
• 5 tectonic events prepared host rock
• 8 deposits/prospects
• 571 core holes – 152,346m (to 10/6/09)
• Excellent exploration potential
7
The Guiana Shield is the northern part of the Amazon Craton, which is surrounded by Neo-Proterozoic orogenic belts. The craton was part of the West African Craton until the opening of the Atlantic Ocean about 115 Ma.
The Project is hosted in the Cuyuni greenstone belt.
Exploration and Drilling:
Exploration activities on the Project have included geophysical surveys, geochemical sampling, trenching, and drilling. Small-scale mining activity occurred during the 1940s.
Reconnaissance geological mapping of outcrop on the various hills in the Project area has been completed.
An airborne magnetic, radiometric and EM survey was flown in December 2004 by Terraquest Ltd. The survey consisted of east-west lines flown at a 400 m spacing and north-south lines flown at a 200 m spacing. All lines were flown at a 70 m mean terrain clearance. These profiles were interpreted by Dr. A. Spector, consulting geophysicist, who identified 62 geophysical anomalies.
During 2004, a regional stream-silt survey was undertaken. The program collected 306 stream sediment samples, 1,819 deep, auger samples from 832 stations, and 415 rock float samples. The results of the program were used to select additional ground holdings, and to vector into targets for drill hole follow-up.
8
8
Geology and Resources
8
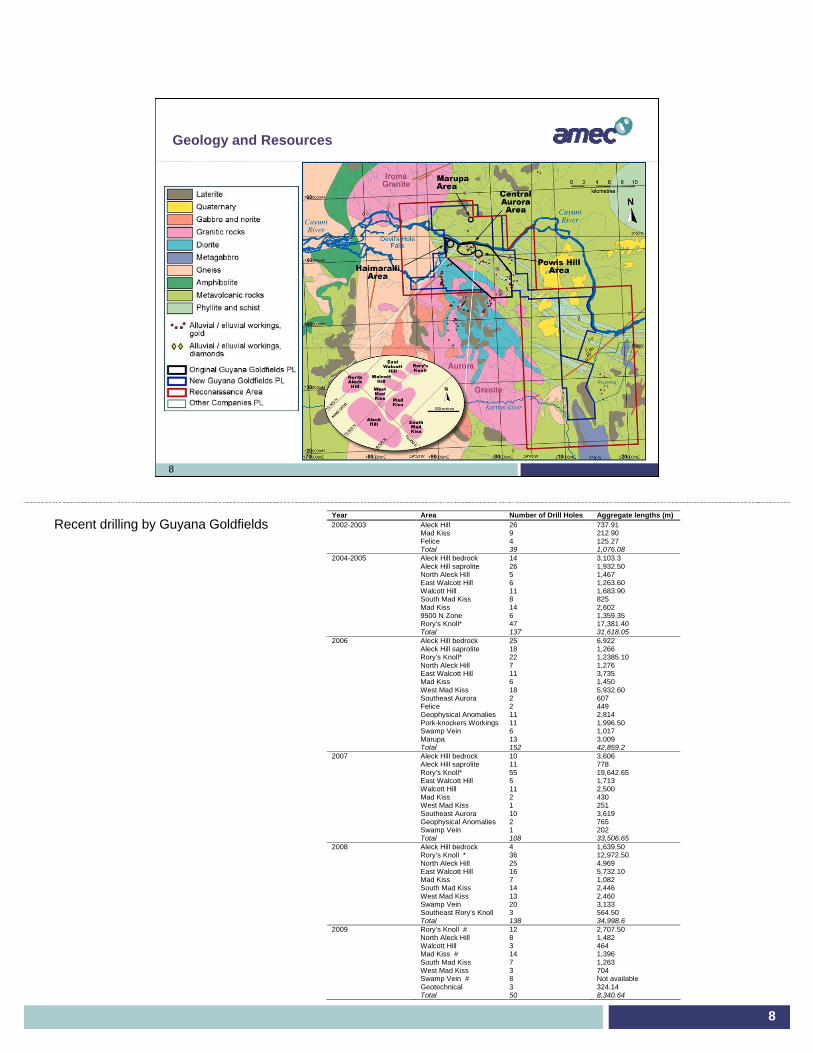
Year Area Number of Drill Holes Aggregate lengths (m) 2002-2003 Aleck Hill 26 737.91 Mad Kiss 9 212.90 Felice 4 125.27 Total 39 1,076.08 2004-2005 Aleck Hill bedrock 14 3,103.3 Aleck Hill saprolite 26 1,932.50 North Aleck Hill 5 1,467 East Walcott Hill 6 1,263.60 Walcott Hill 11 1,683.90 South Mad Kiss 8 825 Mad Kiss 14 2,602 9500 N Zone 6 1,359.35 Rory’s Knoll* 47 17,381.40 Total 137 31,618.05 2006 Aleck Hill bedrock 25 6,922 Aleck Hill saprolite 18 1,266 Rory’s Knoll* 22 1,2385.10 North Aleck Hill 7 1,276 East Walcott Hill 11 3,735 Mad Kiss 6 1,450 West Mad Kiss 18 5,932.60 Southeast Aurora 2 607 Felice 2 449 Geophysical Anomalies 11 2,814 Pork-knockers Workings 11 1,996.50 Swamp Vein 6 1,017 Marupa 13 3,009 Total 152 42,859.2 2007 Aleck Hill bedrock 10 3,606 Aleck Hill saprolite 11 778 Rory’s Knoll* 55 19,642.65 East Walcott Hill 5 1,713 Walcott Hill 11 2,500 Mad Kiss 2 430 West Mad Kiss 1 251 Southeast Aurora 10 3,619 Geophysical Anomalies 2 765 Swamp Vein 1 202 Total 108 33,506.65 2008 Aleck Hill bedrock 4 1,639.50 Rory’s Knoll * 36 12,972.50 North Aleck Hill 25 4,969 East Walcott Hill 16 5,732.10 Mad Kiss 7 1,082 South Mad Kiss 14 2,446 West Mad Kiss 13 2,460 Swamp Vein 20 3,133 Southeast Rory's Knoll 3 564.50 Total 138 34,998.6 2009 Rory’s Knoll # 12 2,707.50 North Aleck Hill 8 1,482 Walcott Hill 3 464 Mad Kiss # 14 1,396 South Mad Kiss 7 1,263 West Mad Kiss 3 704 Swamp Vein # 8 Not available Geotechnical 3 324.14 Total 50 8,340.64
Recent drilling by Guyana Goldfields
9
9
Geology and Resources (cont.)
9
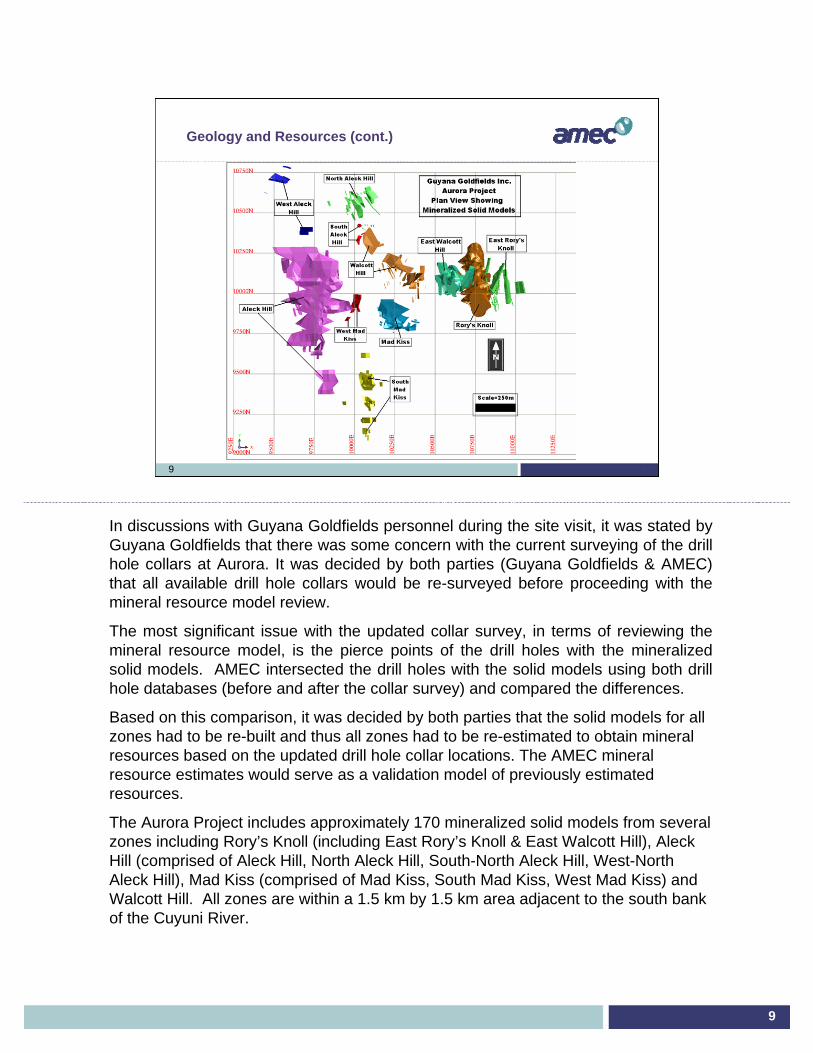
In discussions with Guyana Goldfields personnel during the site visit, it was stated by Guyana Goldfields that there was some concern with the current surveying of the drill hole collars at Aurora. It was decided by both parties (Guyana Goldfields & AMEC) that all available drill hole collars would be re-surveyed before proceeding with the mineral resource model review.
The most significant issue with the updated collar survey, in terms of reviewing the mineral resource model, is the pierce points of the drill holes with the mineralized solid models. AMEC intersected the drill holes with the solid models using both drill hole databases (before and after the collar survey) and compared the differences.
Based on this comparison, it was decided by both parties that the solid models for all zones had to be re-built and thus all zones had to be re-estimated to obtain mineral resources based on the updated drill hole collar locations. The AMEC mineral resource estimates would serve as a validation model of previously estimated resources.
The Aurora Project includes approximately 170 mineralized solid models from several zones including Rory’s Knoll (including East Rory’s Knoll & East Walcott Hill), Aleck Hill (comprised of Aleck Hill, North Aleck Hill, South-North Aleck Hill, West-North Aleck Hill), Mad Kiss (comprised of Mad Kiss, South Mad Kiss, West Mad Kiss) and Walcott Hill. All zones are within a 1.5 km by 1.5 km area adjacent to the south bank of the Cuyuni River.

10
10
Geology and Resources (cont.)
10
Mineralized Solid Models & Pit DesignThe pit design used to capture the open pit mineral resources was based on the mineral resource model prepared by SRK (2009).

11
11
Geology and Resources (cont.)
11
Mineralized Solid Models & Pit Design
The pit design used to capture the open pit mineral resources was based on the mineral resource model prepared by SRK (2009).
AMEC is of the opinion that Guyana Goldfields drill several oriented drill holes in all zones to establish greater confidence in the geologic interpretation. AMEC also recommends that Guyana Goldfields layout several drill holes on the same section and along strike to visualize the structures, alteration and veins for each zone.
The underground mineral resources were generated from the same mineralized grade shell solids as the open pit mineral resources. Although this is adequate for the PA, AMEC recommends that Guyana Goldfields create new mineralized grade shells that are appropriate for underground mineralization. An underground grade shell should use an approximate cut-off grade of 1.50 g/t Au for capturing underground mineralization.
12
12
Geology and Resources (cont.)
12
Zone COG (g/t) K Tonnes** Au g/t Kg Au K Oz Au** Zone COG (g/t) K Tonnes** Au g/t Kg Au K Oz Au**0.75 7,956 2.93 23,289 749 0.75 1,296 2.71 3,508 1130.80 7,762 2.98 23,139 744 0.80 1,253 2.77 3,475 1120.85 7,532 3.05 22,951 738 0.85 1,213 2.84 3,442 1110.90 7,327 3.11 22,772 732 0.90 1,185 2.88 3,417 1100.95 7,125 3.17 22,586 726 0.95 1,140 2.96 3,376 1091.00 6,936 3.23 22,402 720 1.00 1,104 3.03 3,341 1070.75 3,007 4.01 12,058 388 0.75 3,047 1.99 6,077 1950.80 2,950 4.07 12,013 386 0.80 2,953 2.03 6,004 1930.85 2,895 4.13 11,969 385 0.85 2,871 2.07 5,936 1910.90 2,832 4.21 11,913 383 0.90 2,753 2.12 5,833 1880.95 2,774 4.28 11,859 381 0.95 2,670 2.16 5,757 1851.00 2,713 4.35 11,800 379 1.00 2,569 2.20 5,659 1820.75 264 3.76 994 32 0.75 675 3.37 2,276 730.80 261 3.79 992 32 0.80 672 3.39 2,274 730.85 259 3.82 989 32 0.85 662 3.42 2,266 730.90 250 3.92 982 32 0.90 652 3.46 2,257 730.95 240 4.06 972 31 0.95 640 3.51 2,246 721.00 232 4.15 965 31 1.00 625 3.57 2,232 720.75 479 2.05 983 32 0.75 289 2.05 594 190.80 469 2.08 975 31 0.80 277 2.11 585 190.85 450 2.13 959 31 0.85 267 2.16 576 190.90 443 2.15 953 31 0.90 261 2.19 571 180.95 427 2.20 939 30 0.95 258 2.21 568 181.00 411 2.25 923 30 1.00 249 2.25 560 180.75 11,706 3.19 37,323 1,200 0.75 5,307 2.35 12,456 4000.80 11,442 3.24 37,120 1,193 0.80 5,155 2.39 12,338 3970.85 11,136 3.31 36,868 1,185 0.85 5,013 2.44 12,221 3930.90 10,852 3.37 36,620 1,177 0.90 4,850 2.49 12,078 3880.95 10,566 3.44 36,356 1,169 0.95 4,707 2.54 11,947 3841.00 10,292 3.51 36,090 1,160 1.00 4,548 2.59 11,792 379
** All the tonnes and Au Oz have been rounded to the nearest thousand, as these numbers are estimates.
Mad Kiss (including South
& West Mad Kiss)
Mad Kiss (including South
& West Mad Kiss)
Walcott Hill Walcott Hill
TOTAL OP-Indicated Mineral
Resources
TOTAL OP-Inferred Mineral
Resources
OPEN PIT-INDICATED MINERAL RESOURCES OPEN PIT-INFERRED MINERAL RESOURCES
Rory's Knoll (including East Rory's Knoll & East Walcott
Hill)
Rory's Knoll (including East Rory's Knoll & East Walcott
Hill)
Aleck Hill (including North,
South & West Aleck Hill)
Aleck Hill (including North,
South & West Aleck Hill)
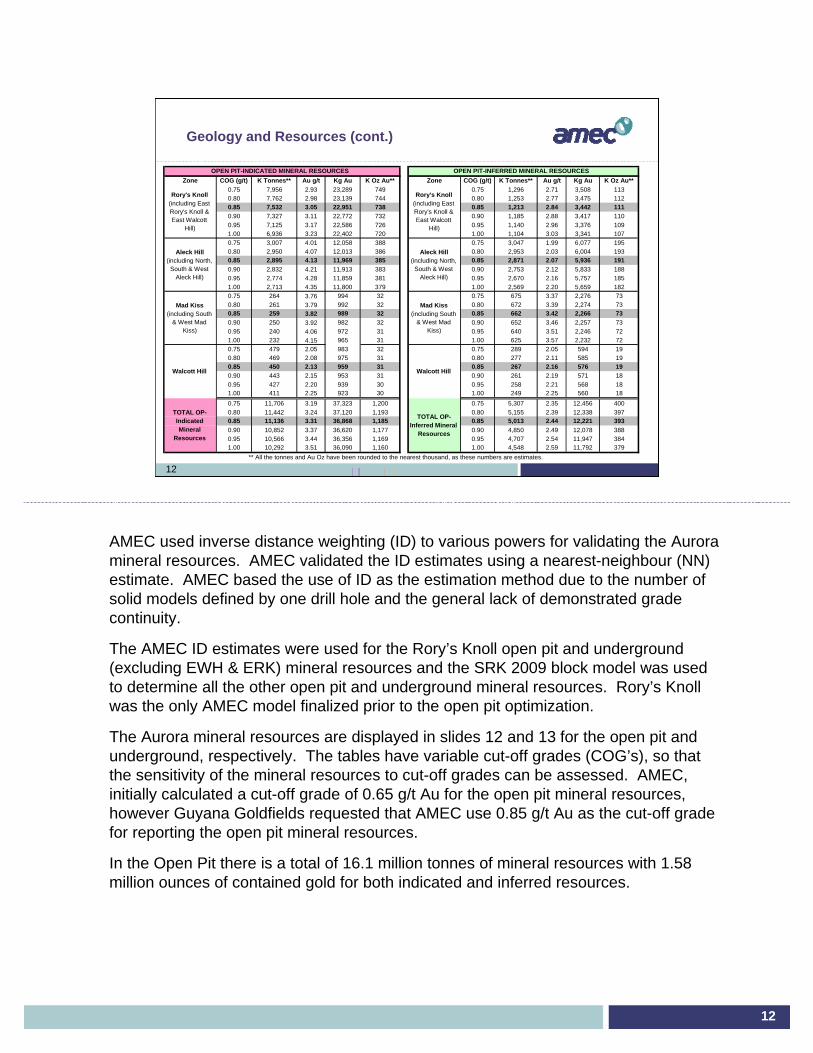
AMEC used inverse distance weighting (ID) to various powers for validating the Aurora mineral resources. AMEC validated the ID estimates using a nearest-neighbour (NN) estimate. AMEC based the use of ID as the estimation method due to the number of solid models defined by one drill hole and the general lack of demonstrated grade continuity.
The AMEC ID estimates were used for the Rory’s Knoll open pit and underground (excluding EWH & ERK) mineral resources and the SRK 2009 block model was used to determine all the other open pit and underground mineral resources. Rory’s Knoll was the only AMEC model finalized prior to the open pit optimization.
The Aurora mineral resources are displayed in slides 12 and 13 for the open pit and underground, respectively. The tables have variable cut-off grades (COG’s), so that the sensitivity of the mineral resources to cut-off grades can be assessed. AMEC, initially calculated a cut-off grade of 0.65 g/t Au for the open pit mineral resources, however Guyana Goldfields requested that AMEC use 0.85 g/t Au as the cut-off grade for reporting the open pit mineral resources.
In the Open Pit there is a total of 16.1 million tonnes of mineral resources with 1.58 million ounces of contained gold for both indicated and inferred resources.

13
13
Geology and Resources (cont.)
13
Zone COG (g/t) K Tonnes** Au g/t Kg Au K Oz Au** Zone COG (g/t) K Tonnes** Au g/t Kg Au K Oz Au**1.80 13,132 4.71 61,876 1,989 1.80 6,787 3.64 24,676 7931.90 12,593 4.84 60,939 1,959 1.90 6,456 3.73 24,060 7742.00 12,139 4.95 60,057 1,931 2.00 6,119 3.82 23,400 7522.10 11,629 5.07 58,926 1,895 2.10 5,797 3.93 22,759 7322.20 11,133 5.20 57,932 1,863 2.20 5,250 4.11 21,592 6942.30 10,691 5.32 56,883 1,829 2.30 4,921 4.24 20,861 6712.40 10,144 5.49 55,667 1,790 2.40 4,622 4.36 20,161 6481.80 989 3.07 3,035 98 1.80 1,614 3.31 5,346 1721.90 905 3.18 2,878 93 1.90 1,442 3.49 5,031 1622.00 824 3.30 2,721 87 2.00 1,324 3.62 4,799 1542.10 772 3.38 2,608 84 2.10 1,219 3.77 4,599 1482.20 698 3.51 2,450 79 2.20 1,141 3.88 4,429 1422.30 631 3.65 2,304 74 2.30 1,031 4.05 4,180 1342.40 588 3.74 2,199 71 2.40 963 4.17 4,021 1291.80 48 5.38 260 8 1.80 527 4.07 2,143 691.90 48 5.38 260 8 1.90 505 4.16 2,101 682.00 47 5.48 257 8 2.00 488 4.24 2,070 672.10 46 5.58 254 8 2.10 466 4.35 2,028 652.20 46 5.58 254 8 2.20 452 4.41 1,996 642.30 46 5.58 254 8 2.30 429 4.53 1,942 622.40 46 5.58 254 8 2.40 411 4.62 1,901 611.80 0 0.00 0 0 1.80 0 0.00 0 01.90 0 0.00 0 0 1.90 0 0.00 0 02.00 0 0.00 0 0 2.00 0 0.00 0 02.10 0 0.00 0 0 2.10 0 0.00 0 02.20 0 0.00 0 0 2.20 0 0.00 0 02.30 0 0.00 0 0 2.30 0 0.00 0 02.40 0 0.00 0 0 2.40 0 0.00 0 01.80 14,169 4.60 65,171 2,095 1.80 8,928 3.60 32,166 1,0341.90 13,546 4.73 64,077 2,060 1.90 8,402 3.71 31,192 1,0032.00 13,010 4.85 63,035 2,027 2.00 7,931 3.82 30,269 9732.10 12,446 4.96 61,788 1,987 2.10 7,483 3.93 29,386 9452.20 11,877 5.11 60,636 1,950 2.20 6,844 4.09 28,017 9012.30 11,367 5.23 59,440 1,911 2.30 6,381 4.23 26,983 8682.40 10,778 5.39 58,120 1,869 2.40 5,996 4.35 26,082 839
Mad Kiss (including South
& West Mad Kiss)
Mad Kiss (including South
& West Mad Kiss)
Walcott Hill Walcott Hill
** All the tonnes and Au Oz have been rounded to the nearest thousand, as these numbers are estimates.
TOTAL Underground
Indicated Mineral
Resources
TOTAL Underground
Inferred Mineral
Resources
* UG mineral resources for Aurora have been estimated using a preliminary UG design at a PA level for economic extraction.
Aleck Hill (including North,
South & West Aleck Hill)
Aleck Hill (including North,
South & West Aleck Hill)
UNDERGROUND-INDICATED MINERAL RESOURCES* UNDERGROUND-INFERRED MINERAL RESOURCES*
Rory's Knoll (including East Rory's Knoll & East Walcott
Hill)
Rory's Knoll (including East Rory's Knoll & East Walcott
Hill)
A cut-off grade of 2.0 g/t has been calculated by AMEC for reporting the underground mineral resources. In the Underground there is a total of 20.9 million tonnes of mineral resources with 3 million ounces of contained gold for both indicated and inferred resources.

14
14
Geology and Resources (cont.)
COG (g/t) K Tonnes** Au g/t Kg Au K Oz Au** COG (g/t) K Tonnes** Au g/t Kg Au K Oz Au**0.60 12,717 2.99 38,000 1,222 0.60 5,714 2.23 12,732 4090.65 12,354 3.06 37,774 1,214 0.65 5,596 2.26 12,658 4070.70 12,019 3.12 37,550 1,207 0.70 5,453 2.30 12,562 4040.75 11,706 3.19 37,323 1,200 0.75 5,307 2.35 12,456 4000.80 11,442 3.24 37,120 1,193 0.80 5,155 2.39 12,338 3970.85 11,136 3.31 36,868 1,185 0.85 5,013 2.44 12,221 3930.90 10,852 3.37 36,620 1,177 0.90 4,850 2.49 12,078 3880.95 10,566 3.44 36,356 1,169 0.95 4,707 2.54 11,947 3841.00 10,292 3.51 36,090 1,160 1.00 4,548 2.59 11,792 379
1.80 14,169 4.60 65,171 2,095 1.80 8,928 3.60 32,166 1,0341.90 13,546 4.73 64,077 2,060 1.90 8,402 3.71 31,192 1,0032.00 13,010 4.85 63,035 2,027 2.00 7,931 3.82 30,269 9732.10 12,446 4.96 61,788 1,987 2.10 7,483 3.93 29,386 9452.20 11,877 5.11 60,636 1,950 2.20 6,844 4.09 28,017 9012.30 11,367 5.23 59,440 1,911 2.30 6,381 4.23 26,983 8682.40 10,778 5.39 58,120 1,869 2.40 5,996 4.35 26,082 839
0.65/1.80 26,886 3.83 102,945 3,310 0.65/1.80 14,642 3.06 44,824 1,4410.75/1.90 25,252 4.02 101,400 3,260 0.75/1.90 13,709 3.18 43,648 1,4030.85/2.00 24,147 4.14 99,903 3,212 0.85/2.00 12,944 3.28 42,490 1,3660.90/2.10 23,298 4.22 98,409 3,164 0.90/2.10 12,332 3.36 41,464 1,3330.95/2.20 23,319 4.16 96,993 3,118 0.95/2.20 11,999 3.33 39,965 1,2851.00/2.30 21,659 4.41 95,530 3,071 1.00/2.30 10,928 3.55 38,774 1,247
OP & UG-INDICATED MINERAL RESOURCES OP & UG-INFERRED MINERAL RESOURCES
TOTAL UG Indicated Mineral
Resources
TOTAL OP+UG Indicated Mineral
Resources
TOTAL OP+UG Inferred Mineral
Resources
TOTAL OP Indicated Mineral
Resources
TOTAL OP Inferred Mineral
Resources
TOTAL UG Inferred Mineral
Resources
** All the tonnes and Au Oz have been rounded to the nearest thousand, as these numbers are estimates.
The combined Open Pit and Underground production schedule for the Aurora project indicates a total of 37 million tonnes of mineral resources with an estimated gold content of approximately 4.58 million ounces of gold for both indicated and inferred resources.

15
15
MINING
15

16
16
Open Pit Mining
Area Parameter Unit Value
Geology Block size m 10x10x5
Geotechnical Inter-ramp slopes (Saprolite) deg Variable (26.5 to 34.3)
Inter-ramp slopes (Volcanic) deg Variable (51.3 to 52.6) Face slopes (Saprolite) deg Variable (45 dyke side & 65
the rest) Face slopes (Volcanic) deg Variable (70 & 75) Berms (Saprolite) m 15 Berms (Volcanic) m Variable (6 & 8)
Bench height m 5
Benching m 15 (Triple)
Physical constraints 50m from toe of dyke (no ramps on dyke side of Rory’s Knoll pit)
Mine Pit bottom (Rory’s Knoll) m -165
Crown Pillar (Rory’s Knoll) m 50
Minimum mining width m 40
Two lane ramp width m 25
Single lane ramp width m 15 (bottom 5 benches)
16
Open Pit Mining Study
The block model data used for the open pit portion of this study is from the SRK Engineering Consultants’ (SRK) block model (April 2009) including each of the deposit areas: Rory’s Knoll, East Rory’s Knoll, Aleck Hill, West Aleck Hill, South Aleck Hill, North Aleck Hill, Walcott Hill, East Walcott Hill, Mad Kiss, South Mad Kiss, and West Mad Kiss. The data for the Rory’s Knoll deposit has been replaced by AMEC revised data, which was modified only to include updated collar information.
The resource class categories utilized in this study are Indicated and Inferred. No Measured category blocks were found in the block model. Another category, Inferred2, was found in the SRK block model but not used for mine planning due to limited estimation confidence.
A gold grade cut-off for the pit optimization was calculated as 0.65g/t Au. This cut-off grade was also used to determine block dilution so that a diluted model could be used for pit optimization.
For open pit design, a cut-off grade of 0.85 g/t Au has been used.
The pit design is based on the parameters listed in slide 16.

17
17
Indicated and Inferred Resources Blocks > 0.85 g/t
17
Whittle Results
The optimization, based on maximum undiscounted cash flow, resulted in one large pit containing smaller pits in five major areas:
1 Rory’s Knoll (RK) - includes Rory’s Knoll, East Rory’s Knoll and East Walcott
2 Aleck Hill (AH) - includes Aleck Hill, South Aleck Hill and West Mad Kiss
3 South Mad Kiss (SMK)
4 North Aleck Hill (NAH)
5 Walcott Hill (WH) - includes Walcott Hill and Mad Kiss
The West Aleck Hill (WAH) deposit falls outside the optimized pit area as it was shown not to be economic.
Slide 17 shows the Indicated and Inferred mineralized areas within the pits based on a diluted gold (DAu) cut-off of 0.85g/t Au.

18
18
Indicated Resource Blocks > 0.85 g/t
18
Slide 18 shows the Indicated mineralized areas only.
This figure shows the lack of material classified as Indicated Mineral Resources in the North Aleck Hill and South Mad Kiss pits as well as the South Aleck Hill area between the Aleck Hill and South Mad Miss pits. The differences between Slides 17 and 18 provide an indication of the areas that may be reduced in size during any additional studies, which would be performed on Measured and Indicated Resources only.

19
19
Pit Production Schedule
19
Production Schedule
The open pit schedule is based on mining Rory’s Knoll first in order to open up the underground operation as soon as possible. Once enough space has been opened for underground to begin the development of the portal 15m below the saprolite/rock contact, mining continues in Rory’s Knoll but other pits will begin in order to continue saprolite feed to the mill.
This production schedule has been developed using mill feed and waste material on a bench-by-bench basis. Significant waste material has been left on upper benches during the early years in order to smooth out the truck requirements. This waste material is mined in later years. Future studies should further improve the detailed scheduling by using pit phases to implement best practice operational sequencing and use of equipment.
The mining schedule is based on a 350 day year and starting the preproduction one year prior to mill start up. This is so as to better utilize the equipment fleet and reduce the strip ratio over the first two years of mine production.
Slide 19 illustrates the proposed open pit mine production schedule. The LOM for the open pit is 9.6 years including preproduction. Saprolite is mined first in each of the pits before fresh rock, except when trying to smooth out the strip ratio for more constant equipment fleet sizes.

20
20
Open Pit Mill Feed Schedule
20
Mill production for the open pit portion of the feed has been targeted as 8000tpd for the first three years then reducing to 5000 t/d for the remainder of the open pit LOM, to incorporate the underground production.
The mine equipment required for the scheduled open pit production is 14 trucks, four loaders and four drills. For this study the equipment sizing assumed is Cat 777 trucks, Cat 992 loaders and 6.5” DTH drills. These assumptions are based on benchmarking from the Omai Mine in Guyana.
The development of the proposed open pit will generate excavatedsaprolite and blasted waste rock. Excavated overburden (alluvium and saprolite) and waste rock materials will need to be stored in on-land stockpiles. The stockpile slopes will be designed to meet the required minimum factor of safety under long term and pseudo-static loading conditions of 1.3 and 1.1, respectively.

21
21
Underground Mining
• Cut-off Grade: 2.5 (RK)/2.0 (Sat.) g/tDilution Grade: 1.0 g/t
• Solid model resource: 16.8 Mt @ 5.0 g/t containing 2.7 Moz (using 2.0 g/tcut-off)
• Production Rate: 3,600 – 4,400 tpd, based on first principles
• 3.5 yr pre-production development
• U/G Mine Life: 2 yr ramp up, 10 yr peak production, 2 yr ramp down
• LOM U/G Mill Feed 18.1 Mt @ 4.5 g/t containing 2.6 MozAu
21
Rory's Knoll Underground
(Hoisted)
The Remaining dfUnderground
(Trucked)
0
200
400
600
800
1,000
1,200
1,400
1,600
1,800
Yr1
Yr2
Yr3
Yr4
Yr5
Yr6
Yr7
Yr8
Yr9
Yr10
Yr11
Yr12
Yr13
Yr14
Yr15
Yr16
Yr17
Yr18
Yr19
Yr20
Project Life
Mill
Fee
d (k
t)
Slide 21 right figure shows the life of underground mine production sources based on the mill feed tonnage.

22
22
Mine Access and Major Development
• Rory’s Knoll:Shaft-Ramp Development System
• Satellites:Ramp/Adit Development System
22
The underground mine plan was based on five different mining zones, all below the open pits. The predominant one is the Rory’s Knoll Underground, including Rory’s Knoll, East Rory’s Knoll, and East Walcott Hill, by a means of shaft-ramp development system (right figure slide 22). The selection of the access methods was based on mine access/haulage trade-off studies between shaft hoisting, decline trucking, and decline conveying.
A 5.8 m inner diameter concrete lined shaft will be sunk to a depth of about 1,400 m, and a double-drum production hoist equipped with 12 t skips with slung cages on both sides, will be installed.
Ramp dimensions are designed as 4.5 m wide by 4.5 m high with a gradient of negative 17% to facilitate mobile equipment movement.
The Satellite zones are Mad Kiss Underground, including Mad Kiss and West Mad Kiss; South Mad Kiss Underground; Aleck Hill Underground; North Aleck Hill Underground. These zones are accessed by means of ramp and/or adit development systems with portals established near the pit bottoms (left figure slide 22).
23
23
U/G Mining Method and Mining Sequence
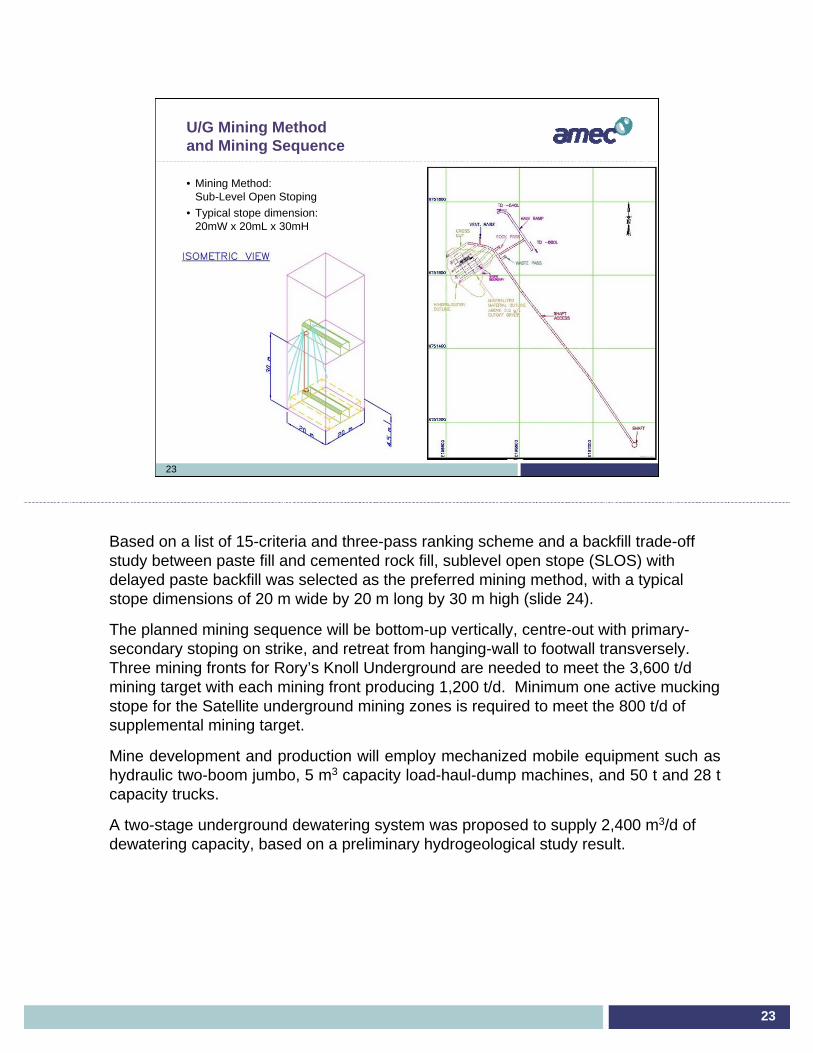
• Mining Method: Sub-Level Open Stoping
• Typical stope dimension: 20mW x 20mL x 30mH
23
Based on a list of 15-criteria and three-pass ranking scheme and a backfill trade-off study between paste fill and cemented rock fill, sublevel open stope (SLOS) with delayed paste backfill was selected as the preferred mining method, with a typical stope dimensions of 20 m wide by 20 m long by 30 m high (slide 24).
The planned mining sequence will be bottom-up vertically, centre-out with primary-secondary stoping on strike, and retreat from hanging-wall to footwall transversely. Three mining fronts for Rory’s Knoll Underground are needed to meet the 3,600 t/dmining target with each mining front producing 1,200 t/d. Minimum one active mucking stope for the Satellite underground mining zones is required to meet the 800 t/d of supplemental mining target.
Mine development and production will employ mechanized mobile equipment such as hydraulic two-boom jumbo, 5 m3 capacity load-haul-dump machines, and 50 t and 28 t capacity trucks.
A two-stage underground dewatering system was proposed to supply 2,400 m3/d of dewatering capacity, based on a preliminary hydrogeological study result.

24
24
Underground Mine Major Surface Infrastructure - Surface Plan View
24
Slide 24 shows the planned major surface infrastructure for underground mining zones with respect to the proposed open pits and mill plant.

25
25
Ventilation Schematic
• Rory’s Knoll Air Flow Volume: 236 m³/s (500k cfm)
• Ventilation Strategy:Ventilation-on-Demand
• Air FlowIntake: RK Shaft and RampExhaust: Ventilation Raise
25
A 4.2 m diameter ventilation raise will be bored to intake 236 m3/s of fresh air flow and fresh air flow will intake through the shaft and the ramp. Air cooling requirement was benchmarked based on assumptions and will be updated based on the on-going geothermal study results.
26
26
Underground Mining Schedule
26
Yr 1 Yr 2 Yr 3 Yr 4 Yr 5 Yr 6 Yr 7 Yr 8 Yr 92012 2013 2014 2015 2016 2017 2018 2019 2020
Total Mill Feed (t) 273,143 907,800 1,260,000 1,259,999 1,259,999 1,448,400Head Grade (g/t Au) 4.82 5.07 4.83 4.55 4.83 4.56Head Metal (g Au) 1,317,483 4,606,675 6,090,206 5,726,800 6,085,593 6,604,194Head Metal (oz Au) 42,358 148,108 195,805 184,121 195,656 212,330
Rory's Knoll Underground:Mill Feed - Hoisted (t) 273,143 907,800 1,260,000 1,259,999 1,259,999 1,264,400
Satellites Underground:Mill Feed - Trucked (t) 184,000
Total Waste (t) 94,644 252,279 307,598 221,152 93,394 83,852 82,560 82,520 145,541Hoist Waste (t) 154,807 93,394 83,852 82,560 82,520 86,573
Trucked Waste (t) 94,644 252,279 307,598 66,346 58,968
Total Hoist (Rock+Waste) (t) 427,949 1,001,194 1,343,852 1,342,559 1,342,519 1,350,973Total Trucked (Rock+Waste) (t) 94,644 252,279 307,598 66,346 242,968
Backfill Requirement (cu.m) 73,551 324,214 450,000 450,000 450,000 517,286
Year
Yr 10 Yr 11 Yr 12 Yr 13 Yr 14 Yr 15 Yr 16 Yr 172021 2022 2023 2024 2025 2026 2027 2028
Total Mill Feed (t) 1,539,999 1,539,999 1,540,000 1,544,400 1,540,000 1,539,999 1,497,401 960,982 18,112,122Head Grade (g/t Au) 4.40 4.80 4.40 4.96 4.60 4.37 3.99 3.30 4.53Head Metal (g Au) 6,769,472 7,387,280 6,777,011 7,661,086 7,088,788 6,732,308 5,969,045 3,167,813 81,983,754Head Metal (oz Au) 217,644 237,507 217,886 246,310 227,910 216,449 191,909 101,848 2,635,839
Rory's Knoll Underground:Mill Feed - Hoisted (t)1,259,999 1,259,999 1,260,000 1,263,600 1,260,000 1,259,999 1,217,401 174,000 15,180,340
Satellites Underground:Mill Feed - Trucked (t) 280,000 280,000 280,000 280,800 280,000 280,000 280,000 786,982 2,931,782
Total Waste (t) 141,543 122,414 119,765 161,854 129,630 132,472 36,886 2,208,105Hoist Waste (t) 82,743 83,277 70,716 89,593 86,948 79,024 3,908 1,079,914
Trucked Waste (t) 58,800 39,137 49,049 72,262 42,682 53,448 32,978 1,128,191
Total Hoist (Rock+Waste) (t) 1,342,743 1,343,276 1,330,716 1,353,192 1,346,948 1,339,023 1,221,309 174,000 16,260,254Total Trucked (Rock+Waste) (t) 338,800 319,137 329,049 353,062 322,682 333,448 312,978 786,982 4,059,974
Backfill Requirement (cu.m) 550,000 550,000 550,000 551,571 550,000 550,000 534,786 367,208 6,468,615
Year Total
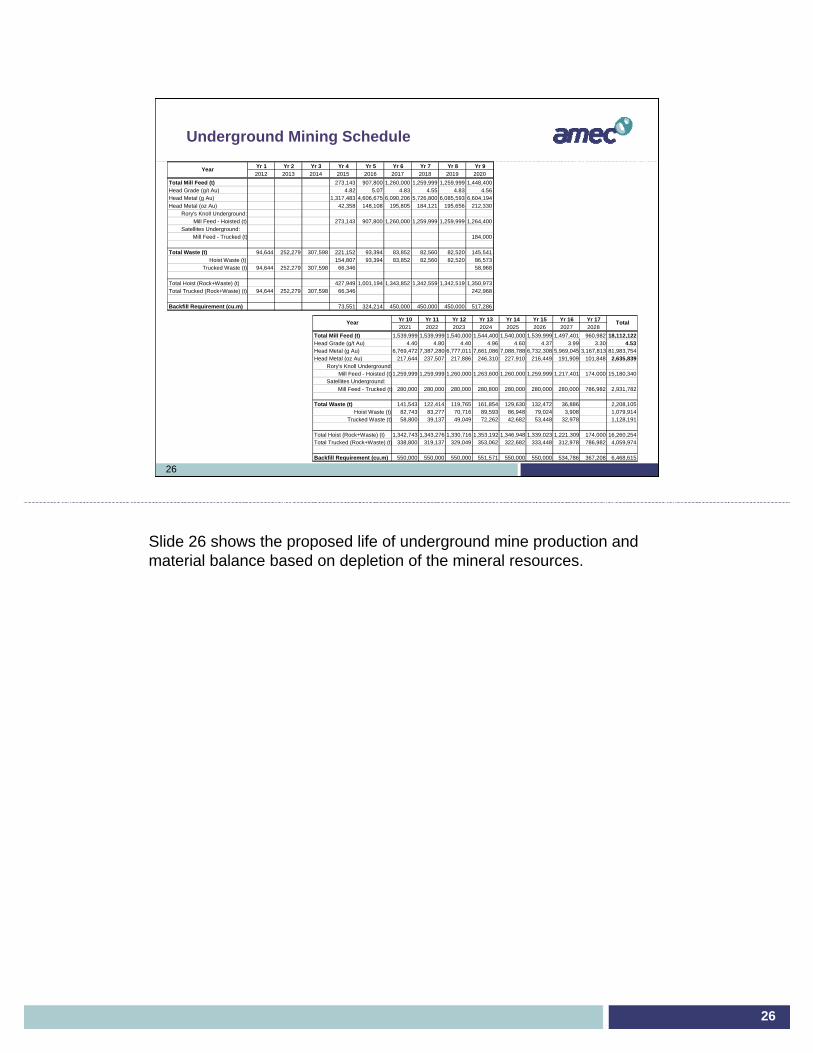
Slide 26 shows the proposed life of underground mine production and material balance based on depletion of the mineral resources.

27
27
Combined OP-UG Production Plan2010 - 2019
27
Year (December 31st) 2010 2011 2012 2013 2014 2015 2016 2017 2018 2019Project time 0 1 2 3 4 5 6 7 8 9Production time -2 -1 1 2 3 4 5 6 7 8Time until mine closure 18 17 16 15 14 13 12 11 10 9Discounting index Totals 1.0 2.0 3.0 4.0 5.0 6.0 7.0 8.0 9.0 10.0Mining production Open pit saprolite UNITS LOMOverburden kt 0.000Waste tonnes kt 51,185 14,497 1,404 13,984 10,104 4,062 1,960 2,441 2,013 628Ore tonnes kt 2,635 112 829 1,175 270 95 41 69 43 -Gold grade g/t 3.114 2.213 3.514 3.460 2.113 2.364 1.206 1.052 1.376 1.376Open pit rockOverburden kt 0Waste tonnes kt 119,876 8,576 21,206 1,714 8,177 16,351 18,742 16,051 8,636 13,754Ore tonnes kt 15,289 4 1,855 1,625 2,530 1,724 1,709 1,681 1,707 1,750Gold grade g/t 2.709 2.709 2.311 2.672 2.979 3.356 2.875 2.504 2.344 2.258Underground Waste tonnes kt 2,208 - 95 252 308 221 93 84 83 83Ore tonnes kt 18,112 - - - - 273 908 1,260 1,260 1,260Gold grade g/t 4.526 4.823 5.075 4.833 4.545 4.830Mining production summaryWaste mined kt 173,269 - 23,072 22,704 15,950 18,588 20,634 20,796 18,575 10,732 14,465Open pit ore kt 17,925 - 117 2,683 2,800 2,800 1,819 1,750 1,750 1,750 1,750
Open pit grade g/t 2.77 - 2.23 2.68 3.00 2.90 3.30 2.84 2.45 2.32 2.26Contained gold kg 49,623 - 260 7,199 8,408 8,108 6,011 4,962 4,282 4,061 3,952Contained gold k oz 1,595 - 8 231 270 261 193 160 138 131 127
Underground ore kt 18,112 - - - - - 273 908 1,260 1,260 1,260Underground grade g/t 4.53 - - - - - 4.82 5.07 4.83 4.55 4.83Contained gold kg 81,984 - - - - - 1,317 4,607 6,090 5,727 6,086Contained gold k oz 2,636 - - - - - 42 148 196 184 196
Total ROM ore kt 36,037 - 117 2,683 2,800 2,800 2,092 2,658 3,010 3,010 3,010Average ROM ore grade g/t 3.65 - 2.23 2.68 3.00 2.90 3.50 3.60 3.45 3.25 3.33Contained gold k oz 4,231 - 8.36 231.45 270.32 260.69 235.62 307.63 333.48 314.69 322.72Mill Feed kt 36,037 1,750 3,000 2,800 2,800 2,800 2,800 2,800 2,800Ore to Stockpile kt 0 - 117 933 (200) 0 (708) (142) 210 210 210Contained gold to stockpile k oz 0 - 8.36 80.51 (16.93) 0.00 (59.91) (12.04) 23.27 21.95 22.52Ore in Stockpile (cumulative) kt - 117 1,050 850 850 142 (0) 210 420 630Average grade in stockpile g/t 2.23 2.63 2.63 2.63 2.63 - 3.45 3.35 3.34Contained gold to mill feed k oz 4,231 - - 150.93 287.25 260.69 295.53 319.67 310.21 292.73 300.20Average Grade to mill g/t 3.77 - - 2.68 2.98 2.90 3.28 3.55 3.45 3.25 3.33Milling productionGold Recovery % 95% - 95.0% 95.0% 95.0% 95.0% 95.0% 95.0% 95.0% 95.0% 95.0%Gold sent to refinery k oz 4,020 - - 143.39 272.88 247.65 280.75 303.69 294.70 278.10 285.19Dore productionDore bar kg 134,437 - - 4,796 9,127 8,283 9,390 10,157 9,856 9,301 9,538
The combined Open Pit and Underground production schedule for the Aurora project indicates a total of 36 million tonnes of mineralized material to be mined and milled with an estimated gold content of approximately 4 million ounces over a combined mine life of 17 years.
This combined production schedule is summarized in slides 27 and 28. As per NI 43-101 guidelines, this schedule included both indicated and inferred resources of mineralized material.

28
28
Combined OP-UG Production Plan2020 - 2028
28
Year (December 31st) 2020 2021 2022 2023 2024 2025 2026 2027 2028 2029Project time 10 11 12 13 14 15 16 17 18 19Production time 9 10 11 12 13 14 15 16 17 18Time until mine closure 8 7 6 5 4 3 2 1 0 -1Discounting index Totals 11.0 12.0 13.0 14.0 15.0 16.0 17.0 18.0 19.0 20.0Mining production Open pit saprolite UNITS LOMOverburden kt 0.000Waste tonnes kt 51,185 93 -Ore tonnes kt 2,635 - -Gold grade g/t 3.114 1.376Open pit rockOverburden kt 0Waste tonnes kt 119,876 6,669 -Ore tonnes kt 15,289 706 -Gold grade g/t 2.709 3.373 0.000Underground Waste tonnes kt 2,208 146 142 122 120 162 130 132 37 - -Ore tonnes kt 18,112 1,448 1,540 1,540 1,540 1,544 1,540 1,540 1,497 961 -Gold grade g/t 4.526 4.560 4.396 4.797 4.401 4.961 4.603 4.372 3.986 3.296Mining production summaryWaste mined kt 173,269 6,908 142 122 120 162 130 132 37 - -Open pit ore kt 17,925 706 - - - - - - - - -
Open pit grade g/t 2.77 3.37 - - - - - - - - -Contained gold kg 49,623 2,380 - - - - - - - - -Contained gold k oz 1,595 77 - - - - - - - - -
Underground ore kt 18,112 1,448 1,540 1,540 1,540 1,544 1,540 1,540 1,497 961 -Underground grade g/t 4.53 4.56 4.40 4.80 4.40 4.96 4.60 4.37 3.99 3.30 -Contained gold kg 81,984 6,604 6,769 7,387 6,777 7,661 7,089 6,732 5,969 3,168 -Contained gold k oz 2,636 212 218 238 218 246 228 216 192 102 -
Total ROM ore kt 36,037 2,154 1,540 1,540 1,540 1,544 1,540 1,540 1,497 961 -Average ROM ore grade g/t 3.65 4.17 4.40 4.80 4.40 4.96 4.60 4.37 3.99 3.30 -Contained gold k oz 4,231 288.86 217.64 237.51 217.89 246.31 227.91 216.45 191.91 101.85 -Mill Feed kt 36,037 2,500 1,824 1,540 1,540 1,544 1,540 1,540 1,497 961Ore to Stockpile kt 0 (346) (284) - - - - - - - -Contained gold to stockpile k oz 0 (37.19) (30.54) - - - - - - - -Ore in Stockpile (cumulative) kt 284 0 0 0 0 0 0 0 0 0Average grade in stockpile g/t 3.34 - - - - - - - - -Contained gold to mill feed k oz 4,231 326.06 248.18 237.51 217.89 246.31 227.91 216.45 191.91 101.85 -Average Grade to mill g/t 3.77 4.06 4.23 4.80 4.40 4.96 4.60 4.37 3.99 3.30 -Milling productionGold Recovery % 95% 95.0% 95.0% 95.0% 95.0% 95.0% 95.0% 95.0% 95.0% 95.0% 0.0%Gold sent to refinery k oz 4,020 309.75 235.77 225.63 206.99 233.99 216.51 205.63 182.31 96.76 -Dore productionDore bar kg 134,437 10,360 7,885 7,546 6,923 7,826 7,241 6,877 6,097 3,236 -

29
29
Combined OP- UG Production Plan2012 - 2028
Total Mill Feed - Feed components
-
500
1,000
1,500
2,000
2,500
3,000
3,500
2012 2013 2014 2015 2016 2017 2018 2019 2020 2021 2022 2023 2024 2025 2026 2027 2028
kt/ y
r
Mill FeedOpen pit rockOpen pit saproliteUnderground
Slide 29 shows total mill feed and mill feed by source for the LOM.

30
30
PROCESS
30
31
31
Metallurgy
• Gold recovery by gravity and cyanidation
• SAG and ball milling, gravity concentration, intensive cyanidation and conventional Carbon-In-Pulp (CIP)
• Gold recovery by gravity ranges from 35% for saprolite to 50% for hard rock
• Recovery is expected to be >95%
• Initial processing as a blend of saprolite and hard rock
• Cyanide destruction by Inco SO2/Air method
• One 28 x 16 SAG Mill, 5500 HP installed power• Two 16 x 24 Ball Mills each with 2500 HP
installed power
• Two 48” Knelson Concentrators
31
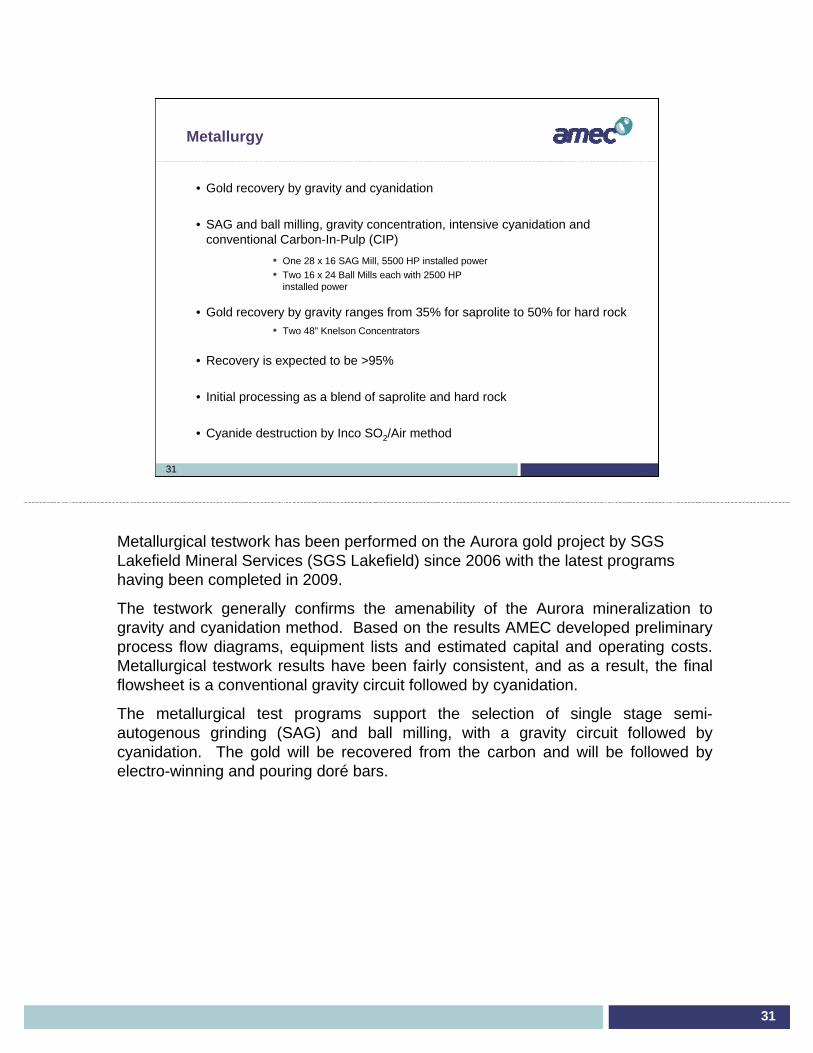
Metallurgical testwork has been performed on the Aurora gold project by SGS Lakefield Mineral Services (SGS Lakefield) since 2006 with the latest programs having been completed in 2009.
The testwork generally confirms the amenability of the Aurora mineralization to gravity and cyanidation method. Based on the results AMEC developed preliminary process flow diagrams, equipment lists and estimated capital and operating costs. Metallurgical testwork results have been fairly consistent, and as a result, the finalflowsheet is a conventional gravity circuit followed by cyanidation.
The metallurgical test programs support the selection of single stage semi-autogenous grinding (SAG) and ball milling, with a gravity circuit followed by cyanidation. The gold will be recovered from the carbon and will be followed by electro-winning and pouring doré bars.

32
32
Metallurgy – Process Flow Diagram
32
Hard Rock Feed
Soft Rock Feed
Jaw Crusher
Hard Rock Stockpile
SAG Mill
SAG Discharge
ScreenBall Mill #1 and #2
Cyclopak #1 and #2
Gravity Concentrator
#1 and #2
Intensive Leach Reactor
Elution Electrowinning
Cell #1
Elution Electrowinning
Cell #2
ILR Electrowinning
Cell #3
ILR Pregnant Solution Tank
Eluate Tank
Barren Solution Tank
Carbon Stripping Vessel
Acid Wash Vessel
Cyanide Leach Tank #1 - #5
PreaerationTank
Heat Exchanger #1 and #2
Carbon Adsorption Tank #1 - #5
Gold Smelting Furnace
To Carbon Reactivation
Reactivated Carbon
Cyanide Destruction
Tank
To Tailings Management
Thickener
Pebble Crusher

33
33
FIELD STUDIES
33
• Geotechnical• Geomechanical• Geochemistry• Hydrological

34
34
Hydrological Assessment & 2009 Field Investigation
• Average precipitation: 2,450 mm/year
• Average evaporation: 1,250 mm/year
• Cuyuni River mean annual flow: 1,000 m³/s
• Cuyuni River 1 in 10,000 year event flow: 8,000 m³/s
• Overburden comprises of low permeability and low compressibility materials (competent foundation materials)
• In general rock mass quality is “Good” to “Very Good” with variations in minor units
• Groundwater 2 to 4 m below original ground surface
Hydrological Assessment
2009 Field Investigation
Geotechnical and geomechanical (rock mechanics) investigations were carried out at selected locations for the proposed River Dyke (6 holes), Open Pit area (17 rock mechanical holes and 6 geotechnical holes), Tailings Management Area (TMA) (9 holes, currently still in progress), Water Management Pond (WMP) (6 holes) and the plant areas (10 holes).
The objective of the geotechnical investigation was to determine the conditions and geotechnical engineering characteristics of the subsurface soil and rock units as they affect the design of the various structures. These investigations comprised boreholes put down through overburden units and bedrock, soil sampling and testing, rock coring, field hydraulic conductivity testing in soil and rock, piezometer installations and laboratory testing of the recovered soil samples.
The existing overburden (alluvial deposit) and residual soil unit comprise low permeability and low compressibility materials, which are considered competent foundation materials.
The stable groundwater table was measured and was generally within 2 to 4 m below the original ground surface.

35
35
INFRASTRUCTURE AND
POWER

36
36
Infrastructure – Off-site Facilities
Buckhall Port Facilities1
• Design completed – 25 hectare secured lay-down yard with operating facilities• Wharf and Pier• Materials management, storage and handling• Fuel
• Port annual fuel handling• 3M USG #2 diesel fuel (vehicles)• 16M USG #6 HFO (power generation)
• Marine delivery and tanker truck inland transport
Main Access Road1
• Maintenance of existing 150-km access road required• Upgrading of some creek crossings of existing access road required• 40-km road extension to be built very early• Truck-trailer cargo transport operations port to mine
1 Design by 3rd party consultants to Guyana Goldfields Inc
Buckhall Port
The Buckhall location features 650 m of river water front with suitable draft for heavy lift vessels typical of those currently servicing the estuaries in the region. Barge access is available for large river and ocean going barge equipment.
The port will operate as the mine development and operations supply terminal for the life of project. All cargo will be landed at these facilities for furtherance by road to the Aurora site.
A wharf and pier will be constructed that is adequate to breast vessels for discharge. A barge landing will be provided to meet barge cargo volume and shore discharge requirements.
The port will serve as the operational base for cargo and fuel supply truck transport equipment and operations.
Access Road
Barama Company Limited has constructed forest access road for its logging operations that is in close proximity to the Cuyuni River and within 40km of the Aurora project. Sections of the 150 km of Barama logging road from the Buckhall Port to the Cuyuni River will require upgrading and surfacing. The 40km section of undeveloped road will require new road construction and feature barge landings and standard river barge equipment to transit the Cuyuni River.

37
37
Infrastructure – Site Facilities
Administration• Senior management, accounting, logistics and procurement, engineering, survey, geology, HR, training, IT
Security, Safety, Fire, Medical Station• Emergency response equipment
Accommodation and Kitchen• Permanent camp 500 beds
Airstrip – 1,200 m• International transportation to/from Georgetown Commercial air carriers
• Air cargo and out-of-country personnel• Local transportation from Georgetown (or other Guyanese cities) to site
• Guyana charter air services - Local and out-of-country personnel• Purpose-built terminal for security screening• Portable lighting deployed for emergency situations
Personnel transportation to the project site will be by air from a designated consolidation point. Air service for all project personnel will be executed utilizing a charter air service provider. Flights will consist of a combination of passenger and freight as required by the project.

38
38
Infrastructure - Services
Water• Potable water plant with 20 L bottling capabilities• Process water – reclaimed, recycled closed loop• Fire water – meet or exceed regulatory and insurance requirements
Sewer• Sewage treatment and discharge
Communications• Satellite, microwave, operations FM PTT radio• Security communications network and center
Fuel• Storage and dispensing, 14-day site supply, 14 days at Port (28-day inventory)
Explosives Magazine and Bulk Plant• Ammonium nitrate and emulsion blending• Secondary explosives and accessories storage
Site Roads• Site access road network• Mine haulage roads with restricted access
Drainage• Storm water• Mine drainage segregated
Fuel:Fuel delivery options to the mine site by a third party supplier will be examined in a trade-off study to determine the synergies of combining in-house cargo transport operations with fuel tanker services. Storage facility ownership and operation at all fuel storage locations will also be examined.
Proposed on-site infrastructure includes the following:• Hard Rock offloading and crushing area• Soft Rock offloading and crushing area• Mill building housing the process plant, maintenance areas, supervision offices and laboratory• Mine maintenance shops• Warehouse• Administrative offices and mine dry facilities• Power generation facilities• Emergency response building• Permanent camp accommodation complex• Emergency power generator area• Sewage treatment and waste disposal area• Fuel storage facilities for heavy oil, diesel and other fuels• Water supply and distribution including fire protection system• On-site roads and drainage• General outdoor laydown areas• Explosives magazines• General site vehicles (non-mine)• Airstrip• Tailings Management Area• Waste Rock• Water Management Area• River Dyke• Water Systems (including mill, fresh, potable, fire, sewage and storm)• Fuel Storage and Distribution• Power Plant

39
39
Supply Chain and Procurement
Supply Chain• Construction supply – 24 months
•60,000 tonnes (estimate) for cement, steel, materials, plant equipment and mine fleet• Operating supply – annual
•14,000 tonnes (estimate)• SAG and ball mill media• Lime, cyanide, flocculants, reagents• Ammonium nitrate, explosives and accessories• Maintenance supplies• Operating and camp supplies• Fuel and lubricants
Procurement• Local Sourcing – Guyana
• Limited industrial supply base• Agricultural, food and forest projects
• Foreign Sourcing• North America and Caribbean Region
• Industrial materials and supply• International
• Major process and mining equipment with lead time and pricing options
Supply Chain and Logistics
Construction and operations supply will be substantially sourced from off shore. Guyana has little or no industrial base or manufacturing industries. Materials will be sourced within Guyana as available and as commercially competitive. The logistics strategy and process will be developed based on foreign sourcing, consolidation, marine delivery to the Buckhall in-country port, and road transport from port to mine.
A foreign marine terminal and cargo consolidation point will be located at an international port. The geographical location of Houston offers a reduction in inland freight charges. Containerization of cargo is the preferred method of shipping. Materials and supplies will be expedited and shipped to a consolidation point at the Port of Houston.
Transport equipment based at the Buckhall Port will haul cargo to the Cuyuni River barge crossing where a trailer yard and staging area will be provided. Transport equipment based at the mine site will drop empty trailers at the Cuyuni River barge staging area and transport the loaded trailers to the mine site.
A freight forwarder based in Miami will be engaged to manage air cargo and associated documentation.
Project personnel will provide customs clearance services in Guyana. On arrival in Guyana, marine and air cargo will be inspected and cleared at the port of discharge.

40
40
Power Generation
Description of Load• Years 1 – 3 (Open Pit only):
• Annual Average Load: 19.0 MW - Peak Load: 23.7 MW
• Annual net energy to project: 159 GWh
• Beyond Year 3 (including Underground Mine):
• Annual Average Load: 30.9 MW - Peak Load: 38.6 MW
• Annual net energy to project: 259 GWh
Power Plant• First 3 years - five (5) generators, including stand-by
• Year 3 and beyond - additional two (2) generators of similar size for the U/G ops
Emergency Diesel Generators• To ensure personnel safety and to supply the camp and other critical loads
• Packaged units in separate enclosures suitable for tropical environment
• First 3 years - one (1) generator
• Year 3 and beyond – one (1) additional generator of similar size for the U/G ops
Power needs were determined based on infrastructure and equipment lists.

41
41
TAILINGS AND WATER MANAGEMENT
41

42
42
Site Water Management PlanPreliminary Layout
• River Dyke to mitigate against river flooding
• Water Management Pond for runoff water collection
• Channel and Berm System for water diversion
The site water management plan was developed based on the following concepts:
• A Cuyuni River flood protection dyke (river dyke) will be constructed to protect the open pit from flooding by extreme floods.
• A Water Management Pond (WMP) will be constructed, serving as the central water management facility for the entire site.
• Mitigate the risk of pit flooding due to surface water inflow by diverting runoff away from the open pit.
• Where practical, runoff will be collected in ditches and routed to the diversion channels. Where topography and site layout renders ditching impractical, runoff will be collected in topographic lows, which will serve as water management ponds.
• Where diversion is not practical due to topographical constraints, runoff from these local areas will be allowed to drain into the pit.
43
43
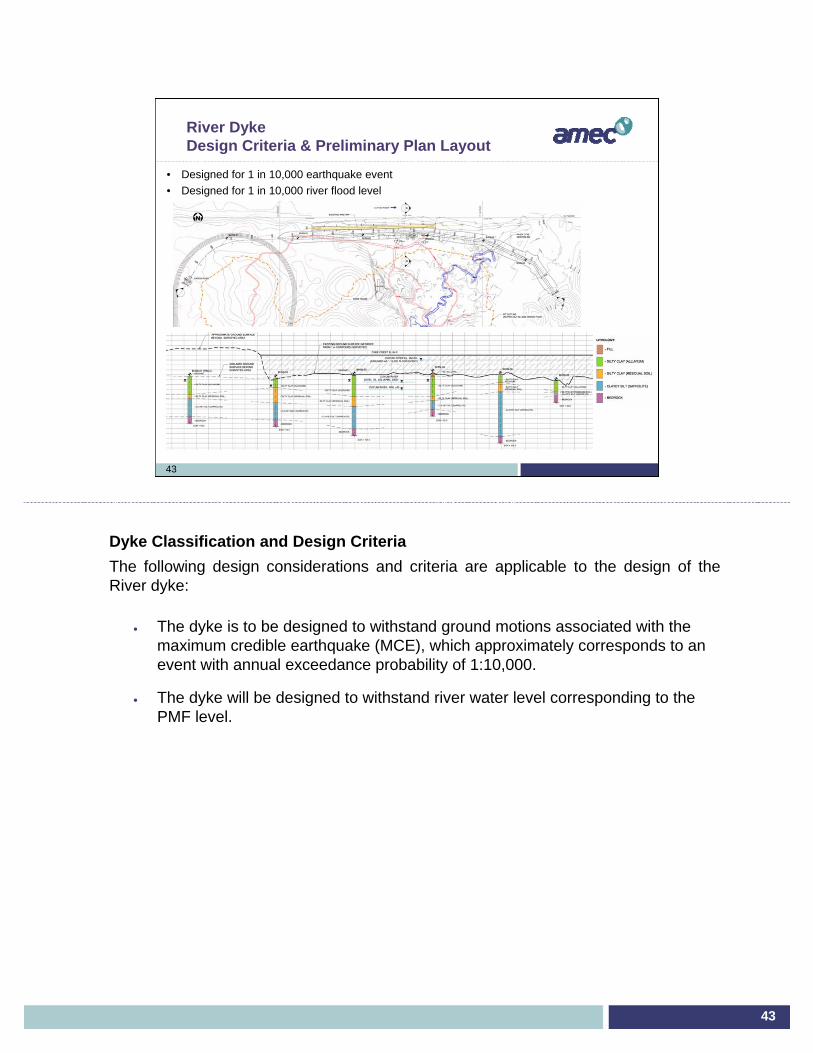
River Dyke Design Criteria & Preliminary Plan Layout
• Designed for 1 in 10,000 earthquake event• Designed for 1 in 10,000 river flood level
Dyke Classification and Design CriteriaThe following design considerations and criteria are applicable to the design of the River dyke:
• The dyke is to be designed to withstand ground motions associated with the maximum credible earthquake (MCE), which approximately corresponds to an event with annual exceedance probability of 1:10,000.
• The dyke will be designed to withstand river water level corresponding to the PMF level.

44
44
River DykePreliminary Design Section
Homogenous earthfill dam:• Low permeability material• Vertical chimney drain• Downstream filter blanket• Grout curtain
Crest elev. = 64 m (2 m freeboard)Length = 1540 mCrest width = 15 mU/S & D/S slopes = 3.0H:1.0V & 2.5H:1.0VFill materials locally available
Design Features of the Cuyuni River DykeSalient design features of the dyke are:
• The dyke is a homogenous earthfill dam with elements of a low permeability core, a cut-off trench, and a vertical chimney together with a downstream filter mat and a grout curtain.
• The crest elevation of the dyke is 64.0 m, providing 2 m freeboard above the design water level of 62.0 m. The proposed dyke will be about 1540 m long, with a 15 m crest width, 3.0H:1.0V slope on the upstream side, and a 2.5H:1.0V slope on the downstream side.
• A 20 m wide overflow emergency spillway is provided at the right end to allow extreme flood events to flow through.
The dams will be constructed of locally available fill materials, including the siltyclay to clayey silt (alluvium and saprolite), clean waste rock, and overburden materials from the open pit excavation.
45
45
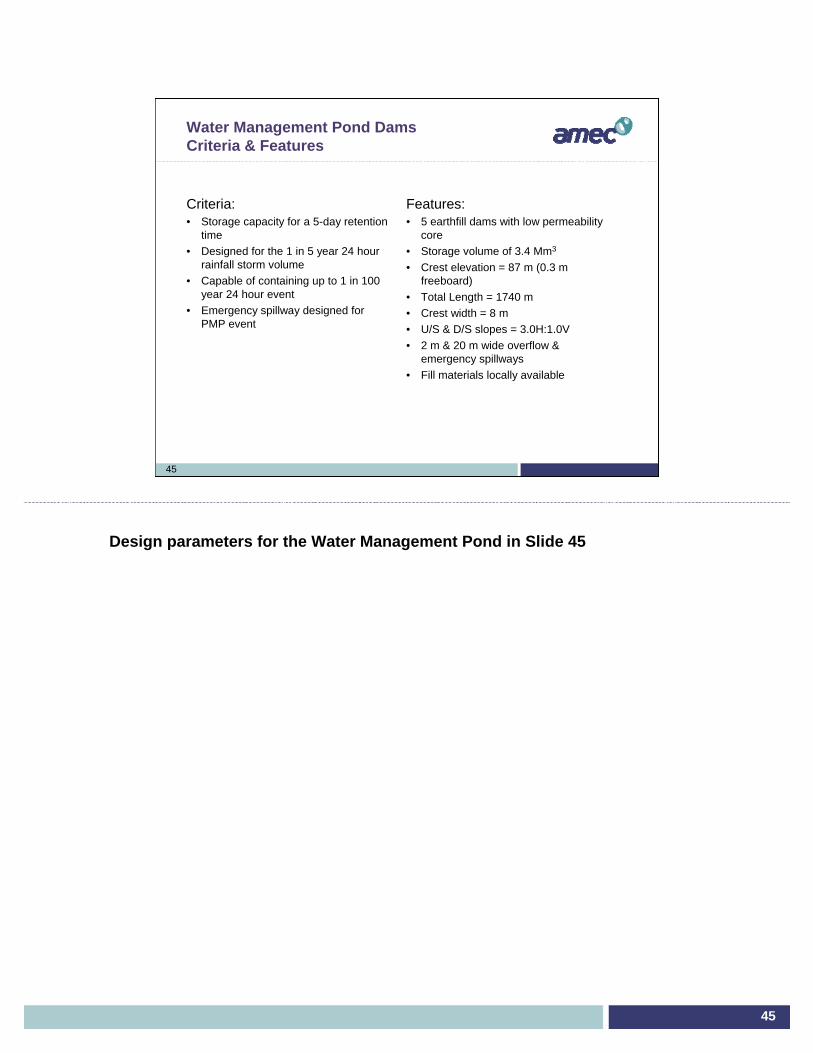
Water Management Pond DamsCriteria & Features
Criteria:• Storage capacity for a 5-day retention
time• Designed for the 1 in 5 year 24 hour
rainfall storm volume• Capable of containing up to 1 in 100
year 24 hour event• Emergency spillway designed for
PMP event
Features:• 5 earthfill dams with low permeability
core• Storage volume of 3.4 Mm3
• Crest elevation = 87 m (0.3 m freeboard)
• Total Length = 1740 m• Crest width = 8 m• U/S & D/S slopes = 3.0H:1.0V• 2 m & 20 m wide overflow &
emergency spillways• Fill materials locally available
Design parameters for the Water Management Pond in Slide 45

46
46
Water Management Pond Preliminary Plan Layout
Design of Water Management Pond Perimeter Dams• A volume of 1,290,000 m3 is assumed for sediment containment, representing
40% of the total volume available up to the overflow structure invert.
• Minimum pond operating level is set at 85.0 m, equal to the overflow structure invert. The normal operating level is 85.2 m representing average annual rainfall and pit dewatering.
• The WMP will be formed by the construction of five dams, with a total length about 1740 m. The typical dam section consists of upstream and downstream shells of local low permeability saprolite, with vertical chimney drain and downstream blanket drain. The WMP dams have a crest elevation of 87.0 m.
• The overflow structure is a 2 m wide and a 20 m wide emergency spillway, and is provided at invert elevation 85.8 m.
The dams will be constructed of locally available fill materials, including the silty clay to clayey silt (alluvium and saprolite), clean waste rock and overburden materials from the open pit excavation.

47
47
Tailings Management AreaPreliminary Layout
25 Mt (dry solids) (22 Mm³) Subaqueous deposition8,000 tonnes/dayRunoff from a 1 in 100 year 24-hr storm storedTwo pond system:• Tailings Pond• Clarification Pond (excess water)
Clarification Pond: provides a 5-day retention timeSpillway: designed for 1 in 100 year event - 0.3 m freeboard
Design Criteria and Considerations
The TMA will be designed to contain mine life tailings production of 25 Mt (dry solids). Due to the uncertainty associated with the tailings geochemistry, the current tailings design is conservative, and assumes that the tailings will be discharged to the TMA under a permanent water cover.
The TMA will consist of two ponds: the Tailings Pond and the Clarification Pond. Excess water will be discharged through an overflow spillway in the Clarification Pond to a local receiving watercourse. The Clarification Pond is designed to provide a 5-day retention time for the 1-in-2 year 24 hr rainfall storm volume. Runoff from events up to a 1-in-100 year 24 hr storm will be stored within the TMA/Clarification Pond system and discharged through the Clarification Pond overflow structure.
A separate emergency spillway will be located in the TMA to release water resulting from hydrologic events exceeding the 1-in-100 year rainfall event.
The TMA is designed to handle the flood resulting from the probable maximum flood (PMF). The emergency spillway will be sized to convey the flood from the PMF with a minimum 0.3 m freeboard.
Design Parameters and Design Outline
The expected tailings production rate is 8,000 t/d dry solids and will be pumped in a slurry at 50% solids content by weight. The specific gravity of tailings solids is expected to be 2.78. The average settled dry density is assumed to be approximately 1.15 t/m3.
48
48
FINANCIALS
48
The Aurora Project has been valued using a discounted cash flow (DCF) approach. This method of valuation requires projecting yearly cash inflows, or revenues, and subtracting yearly cash outflows such as operating costs, capital costs and royalties. Cash flows are taken to occur at the end of each period. The resulting net annual cash flows are discounted back to the date of project start, 2nd QTR of 2010, and totaled to determine net present values (NPVs) at the selected discount rates. The internal rate of return (IRR) is calculated as the discount rate that yields a zero NPV. The payback period is calculated as the time needed to recover the initial capital spent.
The results of the economic analysis represent forward-looking information that are subject to a number of known and unknown risks, uncertainties and other factors that may cause actual results to differ materially from those presented here.
All monetary amounts are presented in US dollars (USD) and are produced on a pre-tax basis.

49
49
CAPEX
Basis of Estimate
Preliminary mine development plan (open pit and underground) for project.
For the capital estimate, it is assumed that:
Underground development costs change from initial capital (Capex) to sustaining capital at the start of underground ore production for the mill
Open pit development costs are not considered a capital cost apart from general site development of the area (clearing and grubbing)
Preliminary equipment lists for mines, mill/site and offsite as applicable.
Self sustained site such as Gensets and Camp that is typical for a remote site
Available budget pricing from vendors on mobile and fixed equipment.
Labour rate model to determine composite crew rates that include a mix of local Guyanese and expatriate labour rates in USD with a 1.38 location productivity factor assumed relative to remote projects in Ontario..
In-house databases that provide data on similar projects to enable costing and detailing estimate for benchmarking and factoring purposes.
AMEC work breakdown structure (WBS) with costs split between underground mine and open pit mine that comprise the balance of the project estimate.
Estimates were prepared by GUY for off-sites and Owner’s portion of indirects
Estimates were adjusted during review to address issues that were identified both internally and by GUY. Adjustments will be reviewed during feasibility.
49
• The initial capital cost (Capex) covers the preproduction cost to design, construct and commission an 8,000 t/d gold mine located in Guyana, South America.
• The sustaining capital estimate covers the postproduction capital to sustain mine operation for underground mine and is included in total capital cost of the project.
• Estimate was prepared for the Client as part of the updated Preliminary Assessment (PA) NI43101 Report.
• The baseline for estimate pricing is 2nd Quarter 2009 United States dollars (US$), based on recent comparable projects in Canada with all rates adjusted to the assumed conditions applicable to the project. Assumed exchange rates are $1.10 Canadian and $205 Guyanese per $1.00 US, respectively.
• The PA estimate has a target accuracy range of +/-30%, based on assumptions recorded in the basis of estimate to be reviewed in the feasibility phase.

50
50
CAPEX
50
Guyana Goldfields Aurora Project Date: 20-Aug-09Initial Capex Resource Details
Open Pit, Process Plant, Ancillary FacilitiesCurrency: 2 Qtr 2009 US$ (1.1 CDN/USD)
Total Capital
Area_1 Area_2 Description Open Pit UndergroundInitial Capital
0000 Project Site General 10,880,000 10,880,0001000 Mining 614,600 105,284,700 105,899,300
2000Primary Ore Handling, Primary Crushing, Stock Pile and Reclaim 15,557,400 15,557,400
3000 Process Plant 53,118,700 53,118,7004000 Utilities 37,102,500 8,375,400 45,477,9005000 Ancillary Buildings 9,579,600 9,579,6006000 Water and Waste Rock Management 26,367,300 26,367,3009000 Indirects 37,194,100 11,105,900 48,300,0009800 Owner's Costs
7000 Off-site Facilities 10,800,000 10,800,000Owner's Costs 26,500,000 26,500,000
9900 Contingency 34,270,000 22,460,000 56,730,000
TOTAL ESTIMATE 261,984,200 147,226,000 409,210,200
Sustaining Capital1000 Mining 80,401,000 80,401,000
1100 Mobile Equipment 21,146,100 9,730,500 included above 30,876,600
Initial Capital Sustaining Capital
Exclusions
The following items were excluded from the capital cost estimate:
• Currency exchange fluctuations from basis rates• All sales taxes import duties and/or other taxes that may apply to Guyana• Financing costs (interest during construction).• Escalation beyond 2rd Quarter-2009.• Costs related to lost production.• Sunk costs such as cost of project studies that have or may occur prior to the
feasibility stage when preferred option is selected.• No credit is included for surplus equipment salvage value• Additional cost if project management is by an EPC rather than EPCM contract• No allowance for cost of crews that significantly differ from the labour rate
model• No allowance for higher equipment pricing if planned adjustments not achieved• No allowance for significantly higher Owner’s Costs • No allowance for scope or schedule changes• No allowance for changes to process facilities unforeseen in equipment lists
51
51
FINANCIALS
INPUTS UNITS VALUESConversion factors
Grams to ounces grams 31.103Days per year days 365Months per year months 12
Economic assumptionsGold price: USD/ounce 750Discount rate % 8.0%
General and administration costsWages and salaries 000 $ 5,000 Insurances 000 $ 1,000 Snr mgmt housing and expenses 000 $ 200 camp supplies 000 $ 1,200 Power (camp, admin) 000 $ 1,000 Personnel transportation 000 $ 750 Site office supplies 000 $ 50 Other (permits, fees, charges) 000 $ 200 Donations 000 $ 100 Contingency (5%) 000 $ 500
Total G&A 000 $ 10,000 Dore specs and transport costs
Dore transport cost US$ / ton of do 15.00 Precious metal portion in dore % 93%
Smelter deductions and costsGold deductibleGold Pay Factor % 99.9%Gold recovery at mill % 95.0%Gold refining charge: $/ounce 3.000Royalty rate 5%
OPERATING COSTS UNITS VALUESOpen Pit Mining
Mining O/P ore $/t mined 2.44Mining O/P waste $/t mined 2.21
Undreground MiningMining U/G Ore yr 1-3 $/t mined 38.23Mining U/G Waste yr 1-3 $/t mined 0.00Mining U/G Ore Yr 4-end $/t mined 27.31Mining U/G Waste yr 4-end $/t mined 0.00
Processing costsBlended Ore
Total Milling Costs $/tonne yr 1-3 Including power $/t milled 8.43Total Milling Costs $/tonne yr 1-3 Excluding power $/t milled 5.14Total Milling Costs $/tonne yr 1-3 power cost $/t milled 3.29
Hard RockTotal Milling Costs $/tonne yr 4-end Including power $/t milled 10.02Total Milling Costs $/tonne yr 4-end Excluding power $/t milled 5.31Total Milling Costs $/tonne yr 4-end power cost $/t milled 4.71
51
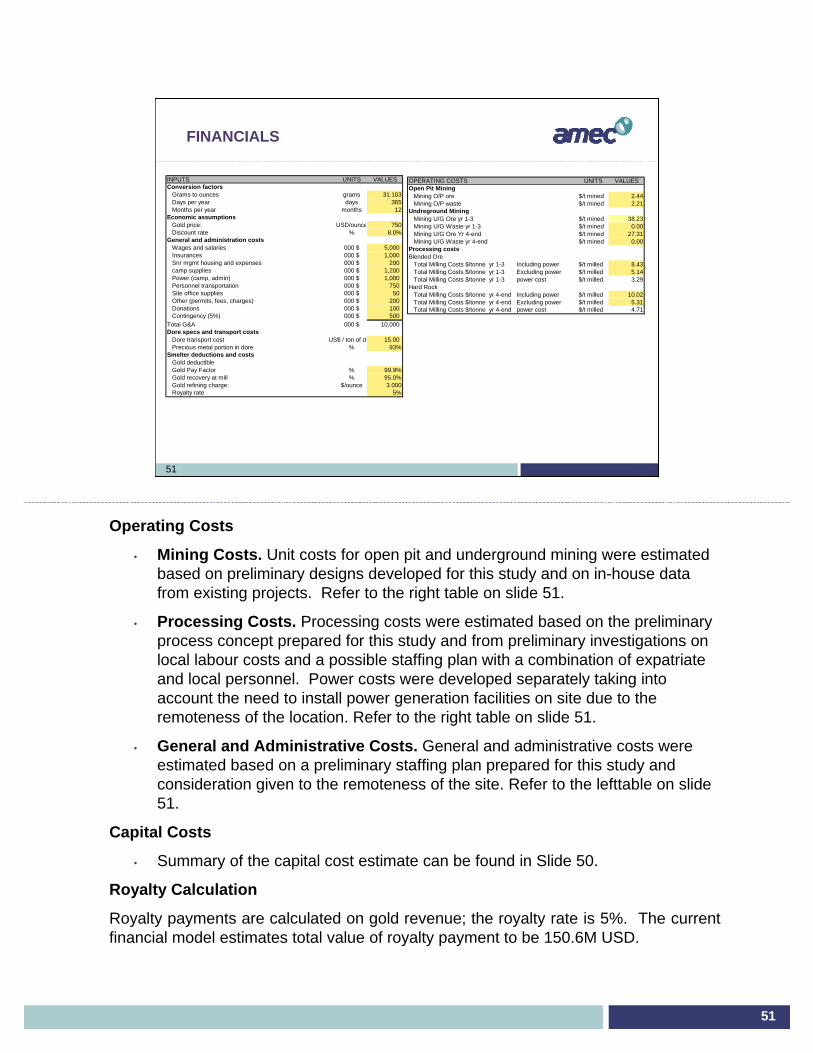
Operating Costs
• Mining Costs. Unit costs for open pit and underground mining were estimated based on preliminary designs developed for this study and on in-house data from existing projects. Refer to the right table on slide 51.
• Processing Costs. Processing costs were estimated based on the preliminary process concept prepared for this study and from preliminary investigations on local labour costs and a possible staffing plan with a combination of expatriate and local personnel. Power costs were developed separately taking into account the need to install power generation facilities on site due to the remoteness of the location. Refer to the right table on slide 51.
• General and Administrative Costs. General and administrative costs were estimated based on a preliminary staffing plan prepared for this study and consideration given to the remoteness of the site. Refer to the lefttable on slide 51.
Capital Costs
• Summary of the capital cost estimate can be found in Slide 50.
Royalty Calculation
Royalty payments are calculated on gold revenue; the royalty rate is 5%. The current financial model estimates total value of royalty payment to be 150.6M USD.

52
52
FINANCIALS
52
Operator: Guyana GoldfieldsProject Name: Aurora Gold
Metal price Units Year 1 Year 2 Year 3 Year 4 Year 5 LOMGold USD/oz 750.00 750.00 750.00 750.00 750.00 750.00
Metal ProductionPayable Gold k oz 143 273 247 280 303 4,016
ProductionWaste mined k t 22,704 15,950 18,588 20,634 20,796 173,269Ore milled k t 2,683 2,800 2,800 2,092 2,658 36,037Grade g/t 2.68 2.98 2.90 3.28 3.55 3.45
UNITS Operating costs Units Year 1 Year 2 Year 3 Year 4 Year 5 LOMM USD Mining cost (Open Pit) USD/t mined 2.24 2.25 2.24 2.23 2.23 2.23M USD Mining cost (U/G) USD/t mined 38.23 38.23 28.02Years Processing cost USD/t milled 8.43 8.43 8.43 10.02 10.02 10.02
G&A USD/t milled 5.71 3.33 3.57 3.57 3.57 3.57% Capital costs Year -2 Year -1 LOM% Pre-Production Capital 000 USD 119,000 109,000 228,000% Capital costs Year 1 Year 2 Year 3 Year 4 Year 5 LOM
Capital Production Phase 000 USD 100,000 74,600 30,100 17,879 9,359 292,401
Cash CostsCash Costs Units Year 1 Year 2 Year 3 Year 4 Year 5 LOM
Direct Cash Cost (C1) USD/oz 571.25 285.42 330.43 353.28 408.40 364.29Production Cost (C2) USD/ozFully Allocated Cost (C3) USD/oz
Production Statistics
Cumulative Cash flow Pre-tax
Production scenarioBase case
Operating cost scenarioBase Case
877,918
Costs Statistics
IRR and Tax RateEffective tax rate*
16.3%
Inputs
Valuation indicatorsLOMPre Tax
Capital cost scenarioAMEC Base Case
IRR after tax N/A
235,8186.0
IRR before taxN/A
NPV 8%Payback period
Using a discount rate of 8%, the project NPV is 235.8M US dollars and the internal rate of return is 16.3%. The cumulative cash flow value for the project pre-tax is 877.9M USD and the undiscounted payback period is 6.0 years over an expected mine life of 17 years.
The project is most sensitive to gold price and least sensitive to operating cost, capital cost and power.

53
53
FINANCIALS
53
Sensitivity of NPV @ 8%
(200,000)
(100,000)
0
100,000
200,000
300,000
400,000
500,000
600,000
700,000
-40% -30% -20% -10% 0% 10% 20% 30% 40%
Change in Factor
NPV
@ 8
% (C
AD
$ m
illio
n)
Capital expenditure Operating expenditure Metal price Pow er
Sensitivity of IRR
0%
5%
10%
15%
20%
25%
30%
-40% -30% -20% -10% 0% 10% 20% 30% 40%
Change in Factor
NPV
@ 5
% (C
AD
$ m
illio
n)
Capital expenditure Operating expenditure Metal price Pow er
Sensitivity analysis was performed on the base case taking into account variations in metal prices, Operating cost, capital cost and power cost. As usual with projects of this type, analysis shows that the Aurora Gold Project is most sensitive to changes in metal price, because it affects directly the entire revenue stream. The sensitivity analysis shows that the project is less sensitive to capital expenditure and operating cost.

54
54
SCHEDULE

55
55
Initial Development & Construction Schedule
Project Execution Schedule parameters:
• Month 1 of project schedule starts after finalizing Feasibility Study
• Execute bridging plan starting 6 months prior to finalizing Feasibility Study
• to prepare logistics requirements for start of construction
• Procure long lead equipment items during the bridging plan
• Construction and commissioning period of 24 months after finalizing Feasibility Study