Gut microbiota composition alterations are associated with ...
18
RESEARCH ARTICLE Gut microbiota composition alterations are associated with the onset of diabetes in kidney transplant recipients Marie Lecronier 1☯ , Parvine Tashk 1☯ , Yanis Tamzali ID 2 , Olivier Tenaillon 1 , Erick Denamur 1,3 , Benoit Barrou 2,4 , Judith Aron-Wisnewsky 4,5,6 , Je ´ro ˆ me Tourret ID 1,2,4 * 1 INSERM, IAME, UMR 1137, Universite ´ Paris Diderot, Sorbonne Paris Cite ´ , Paris, France, 2 AP-HP, De ´ partement d’Urologie, Ne ´ phrologie et Transplantation, GH Pitie ´ -Salpêtrière Charles Foix, Paris, France, 3 AP-HP, Laboratoire de Ge ´ne ´ tique Mole ´ culaire, Ho ˆ pital Bichat, Paris, France, 4 Sorbonne Universite ´ , Paris, France, 5 AP-HP, Institute of Cardiometabolism and Nutrition, ICAN, Service de nutrition, GH Pitie ´- Salpêtrière Charles Foix, Paris, France, 6 INSERM, UMR_S U1166, e ´ quipe NutriOmics, Paris, France ☯ These authors contributed equally to this work. * [email protected] Abstract Background The gut dysbiosis associated with diabetes acquired before or after kidney transplantation (KT) has not been explored. Methods Patients transplanted at our institution provided fecal samples before, and 3–9 months after KT. Fecal bacterial DNA was extracted and 9 bacteria or bacterial groups were quantified by qPCR. Results 50 patients (19 controls without diabetes, 15 who developed New Onset Diabetes After Transplantation, NODAT, and 16 with type 2 diabetes before KT) were included. Before KT, Lactobacillus sp. tended to be less frequently detected in controls than in those who would become diabetic following KT (NODAT) and in initially diabetic patients (60%, 87.5%, and 100%, respectively, p = 0.08). The relative abundance of Faecalibacterium prausnitzii was 30 times lower in initially diabetic patients than in controls (p = 0.002). The relative abun- dance of F. prausnitzii of NODAT patients was statistically indistinguishable from controls and from diabetic patients. The relative abundance of Lactobacillus sp. increased following KT in NODAT and in initially diabetic patients (20-fold, p = 0.06, and 25-fold, p = 0.02, respectively). In contrast, the proportion of Akkermansia muciniphila decreased following KT in NODAT and in initially diabetic patients (2,500-fold, p = 0.04, and 50,000-fold, p<0.0001, respectively). The proportion of Lactobacillus and A. muciniphila did not change in controls between before and after the transplantation. Consequently, after KT the relative abundance of Lactobacillus sp. was 25 times higher (p = 0.07) and the relative abundance of A. muciniphila was 2,000 times lower (p = 0.002) in diabetics than in controls. PLOS ONE | https://doi.org/10.1371/journal.pone.0227373 January 7, 2020 1 / 18 a1111111111 a1111111111 a1111111111 a1111111111 a1111111111 OPEN ACCESS Citation: Lecronier M, Tashk P, Tamzali Y, Tenaillon O, Denamur E, Barrou B, et al. (2020) Gut microbiota composition alterations are associated with the onset of diabetes in kidney transplant recipients. PLoS ONE 15(1): e0227373. https://doi. org/10.1371/journal.pone.0227373 Editor: Mihai Covasa, Western University of Health Sciences, UNITED STATES Received: July 8, 2019 Accepted: December 17, 2019 Published: January 7, 2020 Copyright: © 2020 Lecronier et al. This is an open access article distributed under the terms of the Creative Commons Attribution License, which permits unrestricted use, distribution, and reproduction in any medium, provided the original author and source are credited. Data Availability Statement: All relevant data are within the manuscript and its Supporting Information files. Funding: JT was supported by an award from “la Fondation du Rein” named “Don de soi, don de vie”. The funders had no role in study design, data collection and analysis, decision to publish, or preparation of the manuscript. Competing interests: The authors have declared that no competing interests exist.
Transcript of Gut microbiota composition alterations are associated with ...

RESEARCH ARTICLE
Gut microbiota composition alterations are
associated with the onset of diabetes in
kidney transplant recipients
Marie Lecronier1☯, Parvine Tashk1☯, Yanis TamzaliID2, Olivier Tenaillon1,
Erick Denamur1,3, Benoit Barrou2,4, Judith Aron-Wisnewsky4,5,6, Jerome TourretID1,2,4*
1 INSERM, IAME, UMR 1137, Universite Paris Diderot, Sorbonne Paris Cite, Paris, France, 2 AP-HP,
Departement d’Urologie, Nephrologie et Transplantation, GH Pitie-Salpêtrière Charles Foix, Paris, France,
3 AP-HP, Laboratoire de Genetique Moleculaire, Hopital Bichat, Paris, France, 4 Sorbonne Universite, Paris,
France, 5 AP-HP, Institute of Cardiometabolism and Nutrition, ICAN, Service de nutrition, GH Pitie-
Salpêtrière Charles Foix, Paris, France, 6 INSERM, UMR_S U1166, equipe NutriOmics, Paris, France
☯ These authors contributed equally to this work.
Abstract
Background
The gut dysbiosis associated with diabetes acquired before or after kidney transplantation
(KT) has not been explored.
Methods
Patients transplanted at our institution provided fecal samples before, and 3–9 months after
KT. Fecal bacterial DNA was extracted and 9 bacteria or bacterial groups were quantified by
qPCR.
Results
50 patients (19 controls without diabetes, 15 who developed New Onset Diabetes After
Transplantation, NODAT, and 16 with type 2 diabetes before KT) were included. Before KT,
Lactobacillus sp. tended to be less frequently detected in controls than in those who would
become diabetic following KT (NODAT) and in initially diabetic patients (60%, 87.5%, and
100%, respectively, p = 0.08). The relative abundance of Faecalibacterium prausnitzii was
30 times lower in initially diabetic patients than in controls (p = 0.002). The relative abun-
dance of F. prausnitzii of NODAT patients was statistically indistinguishable from controls
and from diabetic patients. The relative abundance of Lactobacillus sp. increased following
KT in NODAT and in initially diabetic patients (20-fold, p = 0.06, and 25-fold, p = 0.02,
respectively). In contrast, the proportion of Akkermansia muciniphila decreased following
KT in NODAT and in initially diabetic patients (2,500-fold, p = 0.04, and 50,000-fold,
p<0.0001, respectively). The proportion of Lactobacillus and A. muciniphila did not change
in controls between before and after the transplantation. Consequently, after KT the relative
abundance of Lactobacillus sp. was 25 times higher (p = 0.07) and the relative abundance
of A. muciniphila was 2,000 times lower (p = 0.002) in diabetics than in controls.
PLOS ONE | https://doi.org/10.1371/journal.pone.0227373 January 7, 2020 1 / 18
a1111111111
a1111111111
a1111111111
a1111111111
a1111111111
OPEN ACCESS
Citation: Lecronier M, Tashk P, Tamzali Y,
Tenaillon O, Denamur E, Barrou B, et al. (2020) Gut
microbiota composition alterations are associated
with the onset of diabetes in kidney transplant
recipients. PLoS ONE 15(1): e0227373. https://doi.
org/10.1371/journal.pone.0227373
Editor: Mihai Covasa, Western University of Health
Sciences, UNITED STATES
Received: July 8, 2019
Accepted: December 17, 2019
Published: January 7, 2020
Copyright: © 2020 Lecronier et al. This is an open
access article distributed under the terms of the
Creative Commons Attribution License, which
permits unrestricted use, distribution, and
reproduction in any medium, provided the original
author and source are credited.
Data Availability Statement: All relevant data are
within the manuscript and its Supporting
Information files.
Funding: JT was supported by an award from “la
Fondation du Rein” named “Don de soi, don de
vie”. The funders had no role in study design, data
collection and analysis, decision to publish, or
preparation of the manuscript.
Competing interests: The authors have declared
that no competing interests exist.

Conclusion
An alteration of the gut microbiota composition involving Lactobacillus sp., A. muciniphila
and F. prausnitzii is associated with the glycemic status in KT recipients, raising the question
of their role in the genesis of NODAT.
Introduction
Many diseases and disorders, including obesity and diabetes, have been linked to a change in
the composition of the gut microbiota called dysbiosis [1], both in mouse models and in
humans. Microbial diversity is dramatically decreased in obese patients with metabolic disor-
ders compared to obese patients without [2–6]. The Firmicutes to Bacteroidetes phyla ratio is
increased in obese mice and patients [3, 7]. In addition, in obese or diabetic patients, Bifidobac-terium and Faecalibacterium prausnitzii [8] are decreased and Bacteroides and Lactobacilli [9]
are increased [10, 11]. Finally, the lower proportion of F. prausnitzii in diabetic patients is
restored after weight loss and metabolic improvement either with diet intervention [12] or
after bariatric surgery [13]. Akkermansia muciniphila has been associated with insulin sensitiv-
ity. Indeed, obese mice fed with prebiotic carbohydrates show clinical benefit including weight
loss and improved insulin sensitivity [14]. Furthermore, gavage of obese mice with live or pas-
teurized Akkermansia muciniphila recapitulated these beneficial effects [15–17]. Finally, we
also confirmed that among overweight or obese individuals the proportion of Akkermansiamuciniphila was higher in insulin-sensitive patients [18].
Microbiota transfer experiments in germ-free mice suggest that dysbiosis is not only associ-
ated with, but also responsible for these metabolic disorders [19–22]. Importantly, fecal trans-
plantation from lean humans to metabolically affected obese individuals induced a significant
improvement in insulin sensitivity, associated with a modification in gut microbiota composi-
tion with an increase in Akkermansia muciniphila [23, 24].
Metabolic disorders are very common in kidney transplant (KT) recipients (KTRs), both
before and after the transplantation. Diabetes is the first cause for end-stage renal disease and
the requirement for KTR worldwide, with approximately 40% of diabetics on the waiting list
[25]. In addition, normoglycemic patients before KT are at increased risk of new onset diabetes
after transplantation (NODAT; [26]) which develops in approximately 20% of KTRs in the
first year after transplantation [27, 28]. This is mainly due to the immunosuppressive (IS)
treatment, which may include corticosteroids [29], cyclosporin, tacrolimus [30] and sirolimus
[31] which have been shown to induce either insulin resistance or alteration in insulin secre-
tion. In turn, this worsening metabolic syndrome negatively impacts the outcome of KTRs in
terms of cardiovascular and renal events [26].
The possible role of the gut microbiota in the genesis of diabetes before or after KT remains
to be explored. However, the interactions between metabolic disorders, the microbiota, and IS
drugs are highly complex in the context of KT. Indeed, a dysbiosis and a “leaky gut” have been
described in chronic kidney disease patients [32, 33], and IS drugs significantly alter micro-
biota composition [34].
We decided to investigate whether alterations in the gut microbiota composition observed
in diabetic patients in the general population were also associated with diabetes before and/or
after KT. For this purpose, we measured the relative abundance of nine bacteria or bacterial
groups that have been shown to be associated to metabolic disorders in the feces collected
before and after KT in initially diabetic, NODAT and control KTRs.
Gut microbiota and diabetes after kidney transplantation
PLOS ONE | https://doi.org/10.1371/journal.pone.0227373 January 7, 2020 2 / 18

Material and methods
Study population and definitions of diabetes and NODAT
Between September 2013 and December 2014, we prospectively collected feces from all
patients undergoing transplantation at our institution. All patients admitted for a kidney trans-
plantation were required to provide a fecal sample upon arrival in the department, before
administration of any immunosuppressive drug (“D0 sample”), and 3 months after the KT.
Due to organizational reasons (both from the patients’ and the staff’s sides) the second samples
were in reality collected 3 to 9 months after KT and the samples are designated as “M3-9 sam-
ples” in the manuscript.
Patients receiving a combined KT (kidney and liver, or kidney and heart transplantations)
were excluded because they were treated and followed by different medical teams.
The only inclusion criterion for this study was that the D0 sample and/or the M3-9 sample
needed to contain enough material to allow a DNA extraction of at least 500 ng.
Type 2 diabetes and New Onset Diabetes After Transplantation (NODAT) were defined
according to the diagnostic criteria of the American Diabetes Association [35], except that no
oral glucose tolerance test was performed.
Ethical considerations
This study was approved by the local ethic committee (“CPP Ile de France VI”) on 28 March
2013. All patients were orally informed of the research upon arrival in our institution to receive
a kidney transplant. They were free to refuse to provide stool samples if they did not want to
participate. No written consent was required by local authorities, as the present research did
not modify the usual follow-up of transplanted patients in our institution.
Therapeutic protocol for transplanted patients
The proportion of patients who received basiliximab or anti-lymphocyte polyclonal antibody
induction was not different in controls, NODAT and diabetic patients (Table 1).
The initial maintenance immunosuppressive regimen in our institution always consists of a
combination of prednisone (20 mg QD progressively tapered to 5 mg QD between the 4rd and
the 9th month), tacrolimus (target trough level 8±2 ng/ml) and mycophenolate mofetil (dose
adapted in order to obtain an estimated area under the curve around 30 h x mg/l). We had no
clinical indication to change this initial regimen in any of the included patients for the total
duration of this study. All patients received cotrimoxazole for pneumocystis prophylaxis dur-
ing the total duration of this study. Valgancyclovir treatment was prescribed only to patients
who presented a CMV infection (systematic CMV qPCR during follow-up) or disease. The
Table 1. Induction therapy, valganciclovir and antibiotic use after kidney transplantation.
Controls (N = 19), % NODAT (N = 15), % Diabetics (N = 16), % Total (N = 50), % Pa
Induction therapy
Polyclonal Anti-Lymphocyte Ig 77 93 80 83 0.5
Basiliximab 24 7.1 20 11
Valganciclovir for the treatment of CMV infection before M3-9 sample 58 87 73 71 0.2
Antibiotic treatment before M3-9 sample (other than
antibioprophylaxis)
21 36 40 31 0.5
Ig: immunoglobulinaThe P value shown in the table is the result of X2 tests. CMV: cytomegalovirus.
https://doi.org/10.1371/journal.pone.0227373.t001
Gut microbiota and diabetes after kidney transplantation
PLOS ONE | https://doi.org/10.1371/journal.pone.0227373 January 7, 2020 3 / 18
proportion of valgancyclovir and antibiotic treatments initiated between D0 and the time of
collection of the M3-9 sample was not different between the three groups (Table 1).
Fecal swabs
In all cases, we used swabs (modified Cary-Blair medium FecalSwab1, Copan1, Milan, Italy)
either to harvest a sample from spontaneously emitted feces or to perform a rectal swabbing
(when patients could not provide feces before surgery at D0). Samples were stored at 4˚C for a
maximum of 2 days before they were frozen at -30˚C [36].
DNA extraction
Fecal samples were thawed, and 400 μl of the feces and storage medium mix were centrifuged
(8,000 rpm, 8 min). The fecal DNA was extracted from the pellet with the QIAamp DNA Stool
Mini Kit1 (Qiagen1) following the manufacturer’s instructions, with the addition of an initial
1-min bead-beating step on a FastPrep-24 (MP Biomedicals, Solon, OH) on level 5. The quality
and quantity of the DNA collected were assessed on a Nanodrop1 analyzer. All DNA samples
were kept at -80˚C until use.
qPCR quantification of fecal bacterial groups
The fecal microbiota from KTRs was explored at various taxonomic levels through the quanti-
fication of nine bacterial groups or species by qPCR: The Firmicutes/Bacteroidetes ratio,
Bacteroides-Prevotella group, Lactobacilli, Bifidobacteria, Akkermansia muciniphila, Faecali-bacterium prausnitzii, Escherichia coli, Clostridium coccoides, and Clostridium leptum.
All these bacteria or bacterial groups were specifically chosen as they have been shown to be
associated with metabolic disorders in mice and/or the population of non-transplanted
patients.
After extraction, fecal bacterial DNA was quantified using a Nanodrop1 analyzer and
diluted in order to obtain a concentration of 10 ng/μl. qPCRs included the template (50 ng of
DNA per reaction), 5 μL of 2X SYBR Green mix (Absolute blue1 qPCR SYBR Green, Thermo
scientific1, including Taq hot start enzyme) and each primer to a final concentration in the
mix of 300 nM. Water was added to obtain a final reaction volume of 10 μL. The sequence,
and annealing temperature of primer pairs used to quantify each bacterium or bacterial group
is shown in S1 Table. qPCRs were carried out in a LightCycler480 (Roche1) as follows: one
initial activation step of 15 min at 95˚C, 40 cycles of 2-step amplifications (95˚C for 15” for
denaturation, 57–63˚C for 1 min for annealing). A bacterium or a bacterial group was consid-
ered undetectable in a sample if its quantification cycle (Cq) was� 35.
All qPCRs were followed by a dissociation curve to check for the amplification of a unique
DNA fragment.
All bacterial quantifications were performed on two independent qPCRs, each containing a
duplicate of each sample in the same 96 well plate, with the result calculated as the mean of the
4 measures. Template DNA was thawed only twice, once for each repeat of the qPCR.
The relative amount of a bacterium or a bacterial group in a given sample was inferred with
the following formula:
QBac ¼ Log10ð2CqEub� CqBacÞ
where QBac is the (log-) relative abundance of the studied bacterium or bacterial group in the
sample. The formula is based on the qPCR cycle number (Cq) where the SYBR Green signals
exceed the detection threshold: CqEub is the mean Cq obtained with the “Eubacteria” pair of
Gut microbiota and diabetes after kidney transplantation
PLOS ONE | https://doi.org/10.1371/journal.pone.0227373 January 7, 2020 4 / 18

primers (see S1 Table) which quantifies all bacteria in the sample, and CqBac is the mean Cq
obtained with the pair of primers specific of the studied bacterium or bacterial group.
Statistical analysis
Quantitative data are presented as mean ± standard deviation (normally distributed data) or as
median [interquartile range] (variables without a normal distribution). The difference between
the means of more than two groups was tested by one-way ANOVA (normally distributed
data) or Kruskal-Wallis ANOVA (variables without a normal distribution). When these
ANOVA estimates produced a significant difference (p<0.05), Turkey’s test with correction
for multiple comparisons was used to identify which means in the series were different from
one another. If the groups which were compared contained only paired data (measures in the
same patients at two time points), repeated measures ANOVA was used.
The difference between the means of several groups at two time points (D0 and M3-9) was
estimated by two-way ANOVA. When two-way ANOVA showed a significant difference
(p<0.05), Turkey’s test with correction for multiple comparisons was used to identify which
means in the series were different from one another.
The difference between qualitative data was tested by X2 tests.
All statistical tests were performed by GraphPad Prism1 v6.05, San Diego, CA, USA.
Results
Patients’ characteristics
Fifty patients met the inclusion criterion: 19 were non-diabetic and non-obese both before and
after KT (controls), 15 developed New Onset Diabetes After Transplantation (NODAT) and
16 were initially diabetic patients (Fig 1).
All included patients received a kidney transplant (KT) between September 2013 and
December 2014. Over the same period, we performed 122 KT at our institution. Unfortu-
nately, the amount of feces recovered after rectal swabbing was often insufficient and did not
allow a satisfactory extraction of bacterial DNA. For this reason, only 50 patients out of the 122
patients were enrolled.
In the overall cohort, mean age was 54.9±12 years, 66% were males and 28% originated
from Sub Saharan Africa (Table 2).
As expected, HbA1c levels at inclusion were different in the three groups (p<0.0001 for the
metabolic group by two-way ANOVA, Fig 2). At D0, HbA1c was higher in initially diabetic
patients than in controls (7.0±2.1% vs. 5.5±0.5%, p = 0.0005 by two-way ANOVA with Tur-
key’s correction for multiple comparisons) and tended to be higher in diabetics than in
NODAT patients (7.0±2.1% vs. 6.0±0.3%, p = 0.06, same method).
The Body mass index (BMI) was also different in the three groups before KT (p = 0.03 for
the metabolic group by two-way ANOVA). The BMI tended to be higher in diabetic patients
than in controls at inclusion (26.6±3.4 kg/m2 vs. 23.6±3.2 kg/m2, p = 0.06 by two-way
ANOVA with Turkey’s correction).
The sex ratio (66% vs. 87.8%, p = 0.5), and the mean age (60.3±11.4 years vs. 56.4±15.0
years, p = 0.12), BMI (25.3±3.8 kg/m2 vs. 25.1±35 kg/m2, p = 0.8), HbA1c (8.0±11.3% vs. 8.0
±10.4%, p = 1), and dialysis duration (35.8±26.3 months vs. 47.7±55.4 months, p = 0.2) were not
different between the 50 patients included in this study and the 72 other patients transplanted
over the same period in our institution who did not provide enough feces to be included.
Three to nine months after transplantation, HbA1c levels were lower in controls (5.5
±0.6%), than in NODAT patients (6.8±1%, p<0.004 by two-way ANOVA with Turkey’s cor-
rection), and in initially diabetic patients (7.3±1.0% p<0.0001; Table 2 and Fig 2). Consistent
Gut microbiota and diabetes after kidney transplantation
PLOS ONE | https://doi.org/10.1371/journal.pone.0227373 January 7, 2020 5 / 18
with the patients’ selection, HbA1c significantly increased in NODAT patients between before
and after KT (6.0±0.3% vs. 6.8±0.9%, p = 0.01 by t-test with Bonferroni’s correction for multi-
ple comparisons) and reached the level of Hba1c of initially diabetic patients (p = 0.45).
Controls had a lower BMI than diabetic patients (24.2±2.9 kg/m2 vs. 28.0±4.3 kg/m2,
p = 0.01 by repeated measures two-way ANOVA with Turkey’s correction) and tended to have
a lower BMI than NODAT patients (24.2±2.9 kg/m2 vs. 27.0±4.9 kg/m2, p = 0.09, respectively,
same method).
Collected fecal samples
A total of 73 fecal samples were collected from 50 patients, as we were not able to collect a sam-
ple both before and after KT from all patients (Fig 1). The samples collected before KT were all
obtained 24 hours before KT, before any immunosuppressive or antibiotic treatment was
started. Therefore, these samples are referred to as “D0 samples”. Samples collected after trans-
plantation were collected after a median delay of 3.3 [3.1–7.8] months for controls, 3.1 [2.8–
7.7] months for NODAT patients, and 3.3 [3.0–5.5] months for initially diabetic patients
(p = 0.65 by Kruskal-Wallis ANOVA). Because of this delay of approximately 3 to 9 months
after KT, post-KT samples are referred to as “M3-9 samples”.
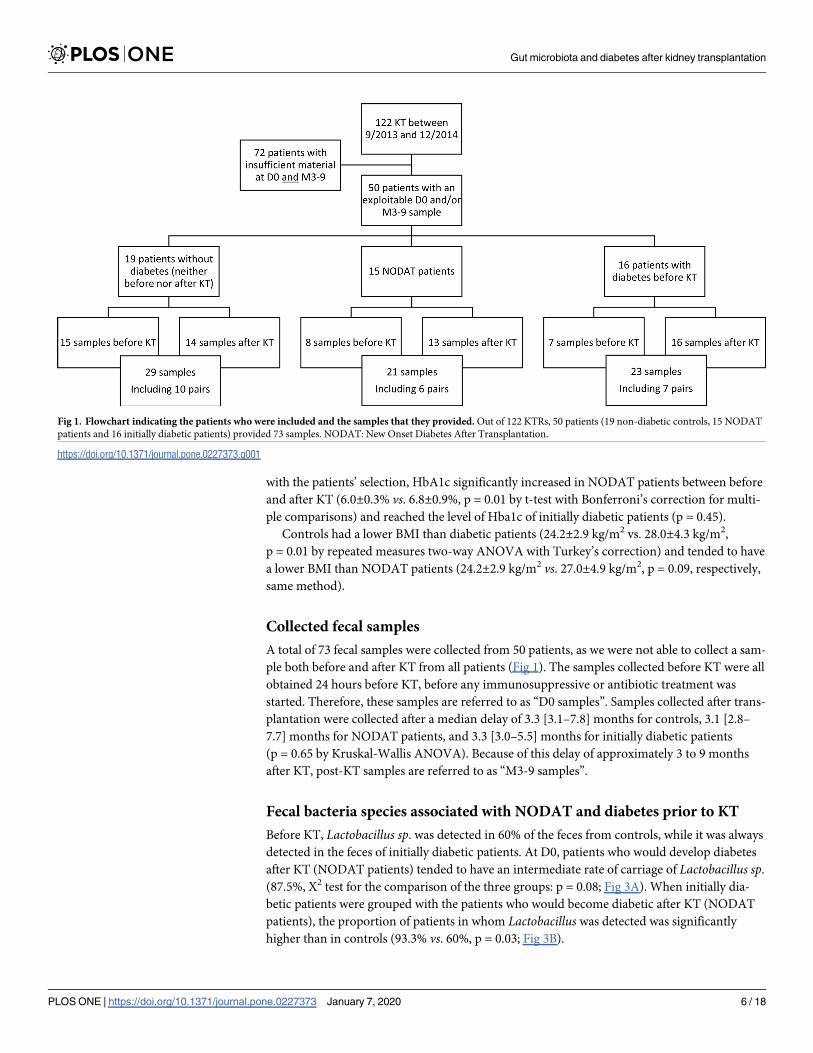
Fecal bacteria species associated with NODAT and diabetes prior to KT
Before KT, Lactobacillus sp. was detected in 60% of the feces from controls, while it was always
detected in the feces of initially diabetic patients. At D0, patients who would develop diabetes
after KT (NODAT patients) tended to have an intermediate rate of carriage of Lactobacillus sp.
(87.5%, X2 test for the comparison of the three groups: p = 0.08; Fig 3A). When initially dia-
betic patients were grouped with the patients who would become diabetic after KT (NODAT
patients), the proportion of patients in whom Lactobacillus was detected was significantly
higher than in controls (93.3% vs. 60%, p = 0.03; Fig 3B).
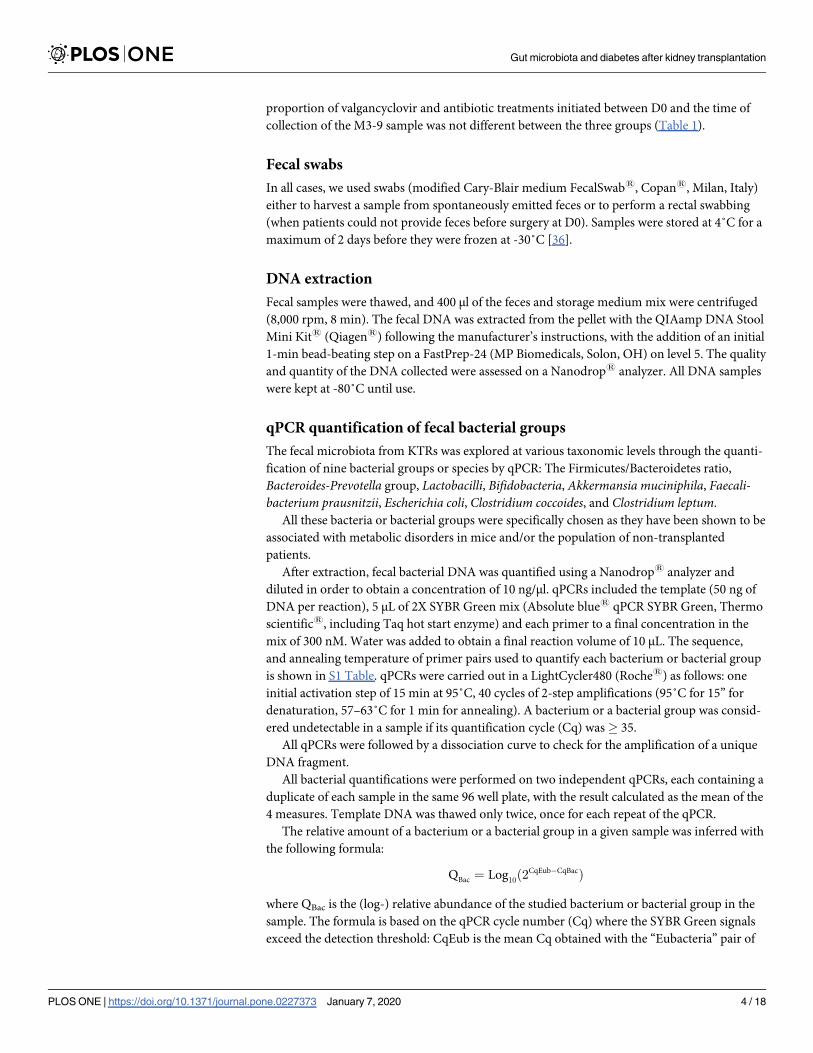
Fig 1. Flowchart indicating the patients who were included and the samples that they provided. Out of 122 KTRs, 50 patients (19 non-diabetic controls, 15 NODAT
patients and 16 initially diabetic patients) provided 73 samples. NODAT: New Onset Diabetes After Transplantation.
https://doi.org/10.1371/journal.pone.0227373.g001
Gut microbiota and diabetes after kidney transplantation
PLOS ONE | https://doi.org/10.1371/journal.pone.0227373 January 7, 2020 6 / 18

At the species level, the relative abundance of Faecalibacterium prausnitzii was significantly
different in the feces of the three groups of patients at D0 (p = 0.002 by one-way ANOVA, Fig
3C). The relative abundance of F. prausnitzii was significantly lower in the feces of patients
who were diabetic before KT compared to controls (difference between the means of Log10(F.
prausnitzii/Eubacteria) = -1.5, i.e. the relative abundance of F. prausnitzii was 30 times lower
in the diabetics than in controls, p = 0.002 by one-way ANOVA with Turkey’s correction for
multiple comparisons).
Clostridium leptum was also unequally distributed in the three groups of patients (p = 0.02
by one-way ANOVA, Fig 3D). The relative abundance of C. leptum in NODAT patients was
one third the proportion in controls (p = 0.05 by one-way ANOVA with Turkey’s correction),
and one fifth the proportion in initially diabetic patients (p = 0.02).
In contrast, we did not observe any significant differences in the Firmicutes/Bacteroidetes
ratio, the presence and the relative abundance of Bifidobacterium sp., Bacteroides-Prevotellagroup, Akkermansia muciniphila, Escherichia coli, and Clostridium coccoides between the three
groups of patients at D0.
To summarize, a higher probability of detectable Lactobacillus sp. in the feces and a lower
relative abundance of F. prausnitzii characterized the gut microbiota alteration associated with
the initial diabetes and (ulterior) NODAT at D0, as compared to the controls.
Table 2. Patient characteristics.
Controls (N = 19) Mean ± SD
or N (%)
NODAT (N = 15) Mean ± SD,
or N (%)
Diabetics (N = 16) Mean ± SD,
or N (%)
Total (N = 50) Mean ± SD,
or N (%)
Pb
Age, years 51.2±13.5 56.3±11.4 58.1±9.4 54.9±11.8 0.20
Sex, males 11 (58) 9 (60) 13 (81.3) 33 (66) 0.29
Ethnicity 0.55
Sub-Saharan Africa 4 (21.0) 4 (26.7) 6 (37.5) 14 (28)
Other 15 (79) 11 (67.3) 10 (62.5) 36 (72)
Initial nephropathy <0.0001
Diabetic nephropathy 0 (0) 0 (0) 14 (87.5) 14 (28)
Hypertensive kidney
disease
2 (10.5) 3 (20) 1 (6.3) 6 (12)
Polycystic kidney
disease
3 (15.7) 7 (46.7) 0 (0) 10 (20)
Undetermined 4 (21.1) 1 (6.7) 0 (0) 5 (10)
Other 10 (52.6) 4 (26.7) 1 (6.3) 15 (30)
History of diabetes
mellitus
0 (0) 0 (0) 16 (100) 16 (32)
Dialysis duration, years 2.2±1.9 3.4±2.6 3.3±2.0 3.0±2.2 0.08
HbA1c before KT, % 5.5±0.5 6.0±0.4 7.0±2.2 6.2±1.5 <0.0001
Obesity before KTa 0 (0) 3 (20) 4 (25) 7 (14) 0.08
BMI at KT, kg/m2 23.6±3.2 26.6±4.7 26.6±3.4 25.2±3.9 0.0004
HbA1c after KT, % 5.5±0.6 6.8±0.9 7.3±1.1 6.5±1.2 <0.0001
BMI max after KT, kg/
m224.2±2.9 27.0±4.9 28.0±4.3 26.2±4.3 <0.05
Nadir of creatinine,
μmol/l
112.0±38 106±67 107±25 108±48 0.82
aObesity is defined as a body mass index�30kg/m2
BMI: Body mass index, KT: kidney transplantationbThe P value shown in the table is the result of two-way ANOVA, or X2 test (qualitative data).
https://doi.org/10.1371/journal.pone.0227373.t002
Gut microbiota and diabetes after kidney transplantation
PLOS ONE | https://doi.org/10.1371/journal.pone.0227373 January 7, 2020 7 / 18

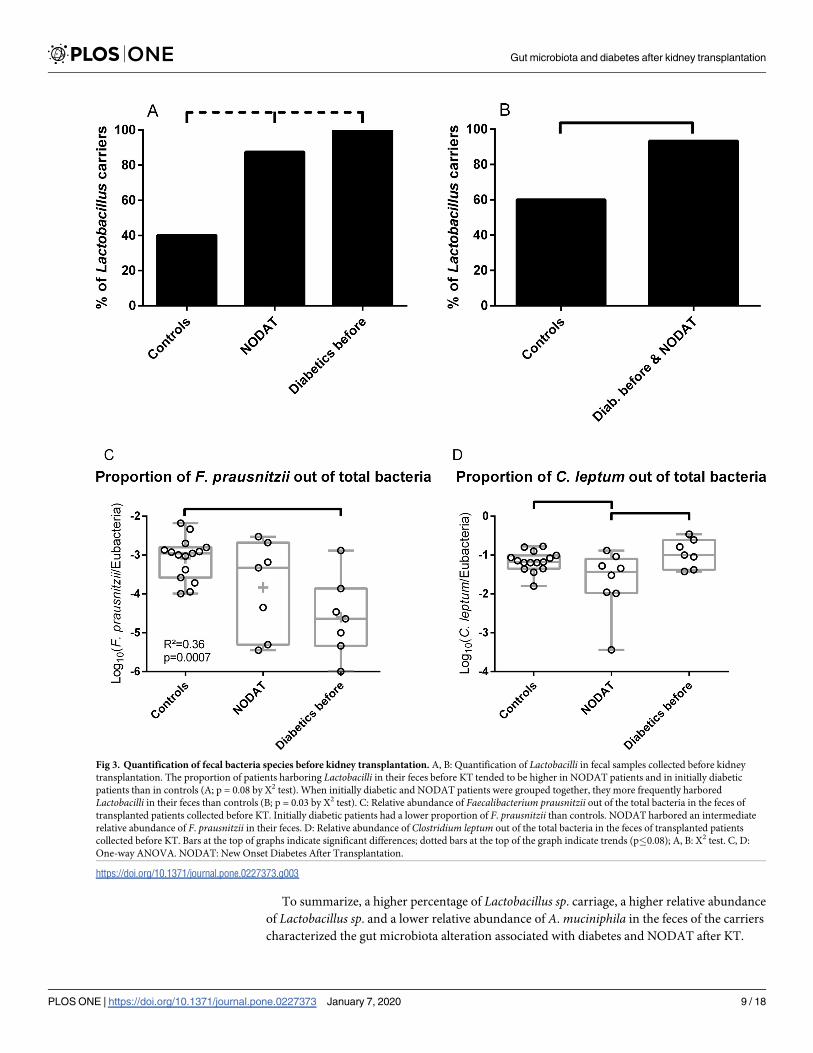
Fecal bacteria species associated with NODAT and diabetes after KT
Three to nine months after KT, at the genus level, Lactobacillus sp. was detected in almost all
diabetics (i.e. initially diabetic patients and NODAT patients, 96.6%), while it was detected in
fewer controls (78.6%, p = 0.05) in M3-9. Furthermore, the relative abundance of Lactobacillussp. in the feces of patients from the three groups tended to be different in M3-9 samples
(p = 0.07 by one-way ANOVA, Fig 4A). This relative abundance tended to be higher in initially
diabetic patients compared to controls (25-fold, p = 0.06 by one-way ANOVA with Turkey’s
correction). NODAT patients had an intermediate proportion of Lactobacillus at M3-9.
When we restricted the analysis to the feces of patients who provided a sample both before
and 3–9 months after the KT (paired samples from the same individual patients, Fig 4B), the
relative abundance of Lactobacilli tended to be higher in diabetic patients than in controls at
M3-9 (80-fold, p = 0.07 by Repeated Measures two-way ANOVA with Turkey’s correction). In
contrast, the relative abundance of Lactobacilli in D0 samples did not statistically change in the
three groups of patients.
A. muciniphila was detected in 50% of the controls, and 31% of all diabetic patients (non-
significantly different) after transplantation. In M3-9 samples the proportion of A. muciniphilawas 2,000 times lower in diabetic patients than in controls (difference of the mean Log10(A.
muciniphila/Eubacteria) = -3.3, p = 0.002 by two-way ANOVA with Turkey’s correction, Fig
4C). The relative abundance of A. muciniphila in NODAT patients was intermediate.
In contrast, the relative abundance of Bifidobacterium, Bacteroides-Prevotella, F. prausnitzii,E. coli, C. leptum and C. coccoides and the Firmicutes/Bacteroidetes ratio were not different
between NODAT patients, diabetics and controls in the M3-9 samples.
Fig 2. Glycated hemoglobin (A) and Body Mass Index (B) of included patients, before and after transplantation according to their diabetic status. Bars indicate
significant differences and dotted bars indicate trends (p<0.1) between groups (standard one-way ANOVA). Number of patients: (A) D0: Controls, n = 17; NODAT,
n = 12; diabetics before transplantation, n = 16. M3-9: Controls, n = 18; NODAT, n = 14; diabetics before transplantation, n = 17. (B): no missing data both at D0 and
M3-9: Controls, n = 19; NODAT, n = 15; diabetics before transplantation, n = 16. NODAT: New Onset Diabetes After Transplantation.
https://doi.org/10.1371/journal.pone.0227373.g002
Gut microbiota and diabetes after kidney transplantation
PLOS ONE | https://doi.org/10.1371/journal.pone.0227373 January 7, 2020 8 / 18
To summarize, a higher percentage of Lactobacillus sp. carriage, a higher relative abundance
of Lactobacillus sp. and a lower relative abundance of A. muciniphila in the feces of the carriers
characterized the gut microbiota alteration associated with diabetes and NODAT after KT.
Fig 3. Quantification of fecal bacteria species before kidney transplantation. A, B: Quantification of Lactobacilli in fecal samples collected before kidney
transplantation. The proportion of patients harboring Lactobacilli in their feces before KT tended to be higher in NODAT patients and in initially diabetic
patients than in controls (A; p = 0.08 by X2 test). When initially diabetic and NODAT patients were grouped together, they more frequently harbored
Lactobacilli in their feces than controls (B; p = 0.03 by X2 test). C: Relative abundance of Faecalibacterium prausnitzii out of the total bacteria in the feces of
transplanted patients collected before KT. Initially diabetic patients had a lower proportion of F. prausnitzii than controls. NODAT harbored an intermediate
relative abundance of F. prausnitzii in their feces. D: Relative abundance of Clostridium leptum out of the total bacteria in the feces of transplanted patients
collected before KT. Bars at the top of graphs indicate significant differences; dotted bars at the top of the graph indicate trends (p�0.08); A, B: X2 test. C, D:
One-way ANOVA. NODAT: New Onset Diabetes After Transplantation.
https://doi.org/10.1371/journal.pone.0227373.g003
Gut microbiota and diabetes after kidney transplantation
PLOS ONE | https://doi.org/10.1371/journal.pone.0227373 January 7, 2020 9 / 18
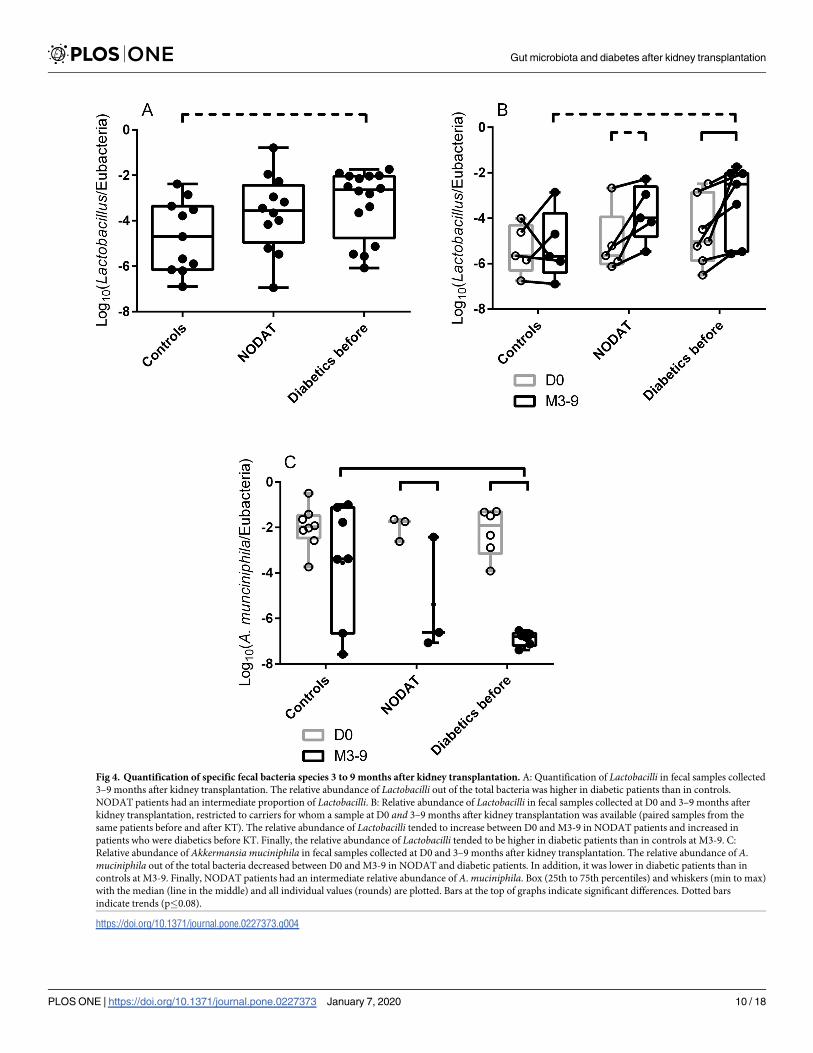
Fig 4. Quantification of specific fecal bacteria species 3 to 9 months after kidney transplantation. A: Quantification of Lactobacilli in fecal samples collected
3–9 months after kidney transplantation. The relative abundance of Lactobacilli out of the total bacteria was higher in diabetic patients than in controls.
NODAT patients had an intermediate proportion of Lactobacilli. B: Relative abundance of Lactobacilli in fecal samples collected at D0 and 3–9 months after
kidney transplantation, restricted to carriers for whom a sample at D0 and 3–9 months after kidney transplantation was available (paired samples from the
same patients before and after KT). The relative abundance of Lactobacilli tended to increase between D0 and M3-9 in NODAT patients and increased in
patients who were diabetics before KT. Finally, the relative abundance of Lactobacilli tended to be higher in diabetic patients than in controls at M3-9. C:
Relative abundance of Akkermansia muciniphila in fecal samples collected at D0 and 3–9 months after kidney transplantation. The relative abundance of A.
muciniphila out of the total bacteria decreased between D0 and M3-9 in NODAT and diabetic patients. In addition, it was lower in diabetic patients than in
controls at M3-9. Finally, NODAT patients had an intermediate relative abundance of A. muciniphila. Box (25th to 75th percentiles) and whiskers (min to max)
with the median (line in the middle) and all individual values (rounds) are plotted. Bars at the top of graphs indicate significant differences. Dotted bars
indicate trends (p�0.08).
https://doi.org/10.1371/journal.pone.0227373.g004
Gut microbiota and diabetes after kidney transplantation
PLOS ONE | https://doi.org/10.1371/journal.pone.0227373 January 7, 2020 10 / 18
Changes in the composition of the gut microbiota between before and after KT
In order to evidence a correlation between a change in gut microbiota and the onset of diabe-
tes, we compared the changes in the relative abundance of each bacterial group between D0
and M3-9 in the three metabolic groups of patients.
When analyses were restricted to paired (before and after KT) fecal samples, the relative
abundance of Lactobacilli increased in NODAT patients and in diabetics while it remained sta-
tistically the same in controls between D0 and M3-9 (difference of the mean Log10(Lactoba-cilli/Eubacteria) = 1.3, i.e. a 20-fold difference in relative abundance, p = 0.06, and 1.4, i.e. a
25-fold difference, p = 0.02, and 0.2 p = 0.99 respectively by repeated measures two-way
ANOVA with Turkey’s correction, Fig 4B).
Similarly, the relative abundance of A. muciniphila decreased in NODAT and in diabetic
patients, while it remained statistically the same in controls between D0 and M3-9 (difference
of the mean Log10(A. muciniphila/Eubacteria) = -3.4, i.e. a 2,500-fold decrease in relative abun-
dance, p = 0.04, -4.7, i.e. a 50,000 decrease, p<0.0001, and -1.5, p = 0.19 respectively by two-
way ANOVA with Turkey’s correction, Fig 4C).
The relative abundance of Lactobacilli (Log10(Lactobacilli/Eubacteria)) in samples from all
patients without diabetes at D0 (controls and NODAT) was lower than the relative abundance
of Lactobacilli of all patients with diabetes at M3-9 (NODAT and diabetics, -5.0±1.2 vs. -3.4
±1.6, p = 0.0009, Fig 5A).
When we restricted the analysis to patients who provided samples at D0 and at M3-9, the
difference in the relative abundance of Lactobacilli (Log10(Lactobacilli/Eubacteria)) between
M3-9 and D0 was close to zero in controls and tended to be higher in all diabetic patients
(NODAT and diabetics) at M3-9 (0.2±1.3 vs. 1.4±1.0, p = 0.06, Fig 5B).
The relative abundance of A. muciniphila (Log10(A. muciniphila/Eubacteria)) in samples
from all patients without diabetes at D0 (controls and NODAT) was 25,000 higher than the rel-
ative abundance of A. muciniphila of all patients with diabetes at M3-9 (NODAT and diabetics,
-2.0±0.8 vs. -6.4±1.5, p<0.0001, Fig 5C).
Global effect of KT on the gut microbiota
We then evaluated whether the global process of KT influenced fecal bacterial relative abun-
dances of included patients independently of the metabolic status at baseline.
The Firmicutes over Bacteroides ratio decreased in all groups. This decrease was significant
in controls and constituted a trend in diabetic patients (difference of the mean Log10(Firmi-
cutes/Bacteroidetes): -0.6, p = 0.05 and -0.7, p = 0.07 by two-ANOVA with Turkey’s correction
for multiple correction, respectively, Fig 6A). Overall, the ratio significantly decreased in all
M3-9 samples compared to D0 samples (difference of the mean Log10(Firmicutes/Bacteroi-
detes): 0.6±0.2, p<0.001, Fig 6B).
Similarly, the relative abundance of Bifidobacterium decreased in all metabolic groups, with
significance reached in controls and a trend observed in diabetic patients (difference of the
mean Log10(Bifidobacterium/Eubacteria): -1.0, p<0.01 and -0.8, p = 0.08 respectively, Fig 6C).
Overall, the relative abundance of Bifidobacterium significantly decreased in all M3-9 samples
compared to D0 samples (difference of the mean Log10(Bifidobacterium/Eubacteria): -0.8±0.2,
p = 0.0002, Fig 6D).
In contrast, the relative abundance of C. coccoides increased in controls and tended to
increase in NODAT and diabetic patients (difference of the mean Log10(C. coccoides/Eubac-
teria): 0.5, p = 0.05, 0.6, p = 0.08, and 0.6, p = 0.06 respectively, Fig 6E). Overall, the relative
abundance of C. coccoides significantly increased in all M3-9 samples compared to D0 samples
(difference of the mean Log10(C. coccoides/Eubacteria): 0.5±0.1, p = 0.0002, Fig 6F).
Gut microbiota and diabetes after kidney transplantation
PLOS ONE | https://doi.org/10.1371/journal.pone.0227373 January 7, 2020 11 / 18

Finally, the relative abundance of Bacteroides increased in all the metabolic groups but the
increase was significant in NODAT patients only and a trend was observed in the other groups
(difference of the mean Log10(Bacteroides/Eubacteria): 0.5, p = 0.05, 0.6, p = 0.08, and 0.6,
p = 0.06 respectively, Fig 6G). Overall, this ratio significantly increased in all M3-9 samples
Fig 5. Comparisons of non-diabetic patients at D0 and diabetic patients at M3-9. A: Relative abundance of Lactobacilli in all non-diabetic patients at D0
(controls and NODAT patients) and all diabetic patients at M3-9 (NODAT and diabetics). B: Difference in the relative abundance of Lactobacilli before and after
KT in the paired samples of patients without (controls) or with diabetes at M3-9 (NODAT and diabetics). While the relative abundance of Lactobacilli remained
stable in controls, it significantly increased in all diabetics at M3-9. C: Relative abundance of A. muciniphila in all non-diabetic patients at D0 (controls and
NODAT patients) and all diabetic patients at M3-9 (NODAT and diabetics). Box (25th to 75th percentiles) and whiskers (min to max) with the median (line in the
middle) and all individual values (rounds) are plotted. Bars at the top of graphs indicate significant differences. Dotted bars indicate trends (p�0.08).
https://doi.org/10.1371/journal.pone.0227373.g005
Gut microbiota and diabetes after kidney transplantation
PLOS ONE | https://doi.org/10.1371/journal.pone.0227373 January 7, 2020 12 / 18

Gut microbiota and diabetes after kidney transplantation
PLOS ONE | https://doi.org/10.1371/journal.pone.0227373 January 7, 2020 13 / 18

compared to D0 samples (difference of the mean Log10(Bacteroides/Eubacteria): 0.5±0.1,
p = 0.0002, Fig 6H).
Discussion
We have assessed the relative abundance of specific bacteria in the feces of end-stage renal dis-
ease patients before and after KT according to their diabetic status. Despite the small number
of patients, we were able to evidence bacteria whose proportions were associated with diabetes
and NODAT, both before and after KT.
The gut microbiota composition alterations that we have observed are consistent with what
has been described in mouse models [14–17] and in non-transplanted diabetic patients [18,
37, 38]: an increase in the relative abundance of Lactobacillus and a decrease in the relative
abundance of F. prausnitzii and A. muciniphila in diabetics compared to controls. Further-
more, the relative abundance of Lactobacillus sp. increased and the relative abundance of A.
muciniphila decreased between D0 and M3-9 in NODAT and in initially diabetic patients but
not in controls (Fig 4). This suggests that changes in the gut microbiota composition occur
with the development of diabetes, independently of whether the disease is primary or induced
by medicinal drugs.
The main strength of this study is the comparison of NODAT patients to controls and ini-
tially diabetic patients as NODAT patients transition from a non-diabetic to a diabetic state
throughout the study. Their diabetes (and therefore possibly their microbiota abnormalities)
appear during the follow-up. Before KT, Lactobacillus sp. was detected at higher frequency in
NODAT and diabetic patients than in controls (Fig 3A and 3B). Also, the relative abundance
of F. prausnitzii was higher in controls than in diabetic patients (Fig 3C). The relative abun-
dance of F. prausnitzii of NODAT patients was statistically indistinguishable from controls
and from diabetic patients. It is therefore possible that the presence of Lactobacillus sp. and a
lack of F. prausnitzii are components of the gut microbiota at risk for developing diabetes after
KT (NODAT). We hypothesize that NODAT patients present a “predysbiosis”, i.e. an abnor-
mal composition of their microbiota, which is associated with the development of diabetes
after KT. The more precise signature (other than Lactobacillus carriage and F. prausnitzii rela-
tive abundance) and the predictive value of “predysbiosis” need to be studied in prospective
cohorts including a larger number of patients and a complete description of the gut microbiota
(using 16S rDNA sequencing or metagenomics). Indeed, we chose to quantify candidate bacte-
ria by qPCR in this work as it was a simple and efficient way of testing the main hypothesis in
a relatively small number of patients.
Overall, NODAT patients gained a significant amount of weight after KT (with BMIs of
25.9±4.6 kg/m2 vs. 27.0±4.9 kg/m2, p = 0.04 by repeated measures two-way ANOVA with Tur-
key’s correction for multiple comparisons, Fig 2), which is not surprising since obesity is a risk
factor for diabetes. Interestingly, BMI also increased in initially diabetic patients after KT (26.6
±3.4 kg/m2 vs. 27.9±4.3 kg/m2, p = 0.01, same method). Even though weight gain is a known
side effect of corticosteroids and calcineurin inhibitors, not all patients undergo the same
Fig 6. Global changes in the gut microbiota after kidney transplantation. Relative abundance of bacteria in the different
metabolic groups and time points (A, C, E, G) and comparison of all D0 samples to all M3-9 samples (B, D, F, H). A, B:
Firmicutes/Bacteroidetes ratio. C, D: Bifidobacterium. E, F: Clostridium coccoides. G, H: Bacteroides. Globally, the Firmicutes
over Bacteroidetes ratio and the relative abundance of Bifidobacterium out of the total bacteria decreased in all metabolic
groups between before and after KT. In the opposite, the relative abundance of Clostridium coccoides and of Bacteroides out of
the total bacteria increased in all metabolic groups between before and after KT. Box (25th to 75th percentiles) and whiskers
(min to max) with the median (line in the middle) and all individual values (rounds) are plotted. Bars at the top of graphs
indicate significant differences. Dotted bars indicate trends (p�0.08).
https://doi.org/10.1371/journal.pone.0227373.g006
Gut microbiota and diabetes after kidney transplantation
PLOS ONE | https://doi.org/10.1371/journal.pone.0227373 January 7, 2020 14 / 18
weight gain after a KT; in our study, the BMI of controls did not significantly increase. It is
possible that an alteration of the gut microbiota observed after KT (Fig 5) might have partici-
pated to this weight gain and that the initial difference in gut microbiota composition could
also have contributed in the difference of weight gain.
Altogether, we hypothesize that immunosuppressive treatment and other factors associated
with KT, might aggravate a “predysbiotic microbiota”, which in turn may contribute to the
development of metabolic disorders in KT patients. For example, a high relative abundance of
Lactobacillus sp. before KT may be worsened by IS treatment and reach a degree where it con-
tributes to the onset of NODAT (Fig 7).
If this is confirmed, it would constitute another example where the gut microbiota is
involved in drug primary and/or side effects [39]. As another illustration, it is now recognized
that part of the glucose-lowering effect of metformin is induced by a gut microbiota modifica-
tion [40].
This study has discovered important biomarkers associated with the metabolic risks follow-
ing KT. It has limits, including its retrospective design, the small number of patients included,
the quantification of candidate bacteria as opposed to the full exploration of the microbiota,
the absence of dietary questionnaire both before and after KT, and a wide range of delays in
post-transplant fecal sample collection. Furthermore, some fecal samples had to be collected
directly from anal swabbing and not by swabbing of a spontaneously emitted stool. This was
due to the short delay between the patients’ arrival at the hospital and the emergency of the
surgical procedure. This could possibly result in a bias in the representation of the mucosal
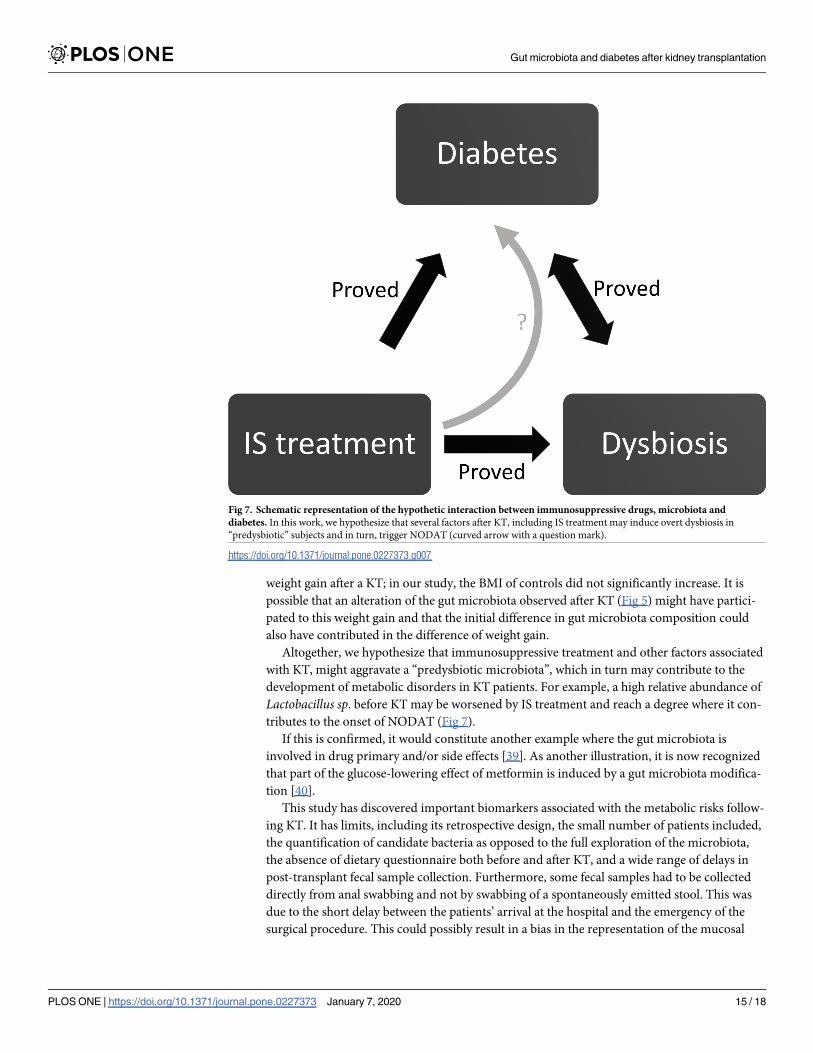
Fig 7. Schematic representation of the hypothetic interaction between immunosuppressive drugs, microbiota and
diabetes. In this work, we hypothesize that several factors after KT, including IS treatment may induce overt dysbiosis in
“predysbiotic” subjects and in turn, trigger NODAT (curved arrow with a question mark).
https://doi.org/10.1371/journal.pone.0227373.g007
Gut microbiota and diabetes after kidney transplantation
PLOS ONE | https://doi.org/10.1371/journal.pone.0227373 January 7, 2020 15 / 18

bacteria. However, our work raises fundamental questions about the possible involvement of
the gut microbiota in the development of NODAT in KTR.
Conclusion
The role of intestinal microbiota in the onset of metabolic disorders in KT recipients needs to
be further explored. The identification of a microbiota at risk for NODAT and its link with IS
treatment could provide guidance towards providing the best treatment, lifestyle coaching and
medical follow-up for these patients.
Supporting information
S1 Table. List of primer pairs and annealing temperatures used in this work.
(DOCX)
Author Contributions
Conceptualization: Marie Lecronier, Judith Aron-Wisnewsky, Jerome Tourret.
Data curation: Marie Lecronier, Parvine Tashk, Yanis Tamzali, Jerome Tourret.
Formal analysis: Marie Lecronier, Parvine Tashk, Jerome Tourret.
Funding acquisition: Erick Denamur, Jerome Tourret.
Investigation: Marie Lecronier, Parvine Tashk, Yanis Tamzali, Jerome Tourret.
Methodology: Marie Lecronier, Olivier Tenaillon, Judith Aron-Wisnewsky, Jerome Tourret.
Resources: Jerome Tourret.
Supervision: Olivier Tenaillon, Erick Denamur, Benoit Barrou, Jerome Tourret.
Validation: Jerome Tourret.
Writing – original draft: Jerome Tourret.
Writing – review & editing: Marie Lecronier, Parvine Tashk, Yanis Tamzali, Olivier Tenail-
lon, Erick Denamur, Benoit Barrou, Judith Aron-Wisnewsky, Jerome Tourret.
References
1. Qin J, Li Y, Cai Z, Li S, Zhu J, Zhang F, et al. A metagenome-wide association study of gut microbiota in
type 2 diabetes. Nature. 2012; 490(7418):55–60. https://doi.org/10.1038/nature11450 PMID:
23023125.
2. Turnbaugh PJ, Hamady M, Yatsunenko T, Cantarel BL, Duncan A, Ley RE, et al. A core gut microbiome
in obese and lean twins. Nature. 2009; 457(7228):480–4. https://doi.org/10.1038/nature07540 PMID:
19043404; PubMed Central PMCID: PMC2677729.
3. Ley RE, Backhed F, Turnbaugh P, Lozupone CA, Knight RD, Gordon JI. Obesity alters gut microbial
ecology. Proc Natl Acad Sci U S A. 2005; 102(31):11070–5. https://doi.org/10.1073/pnas.0504978102
PMID: 16033867; PubMed Central PMCID: PMC1176910.
4. Le Chatelier E, Nielsen T, Qin J, Prifti E, Hildebrand F, Falony G, et al. Richness of human gut micro-
biome correlates with metabolic markers. Nature. 2013; 500(7464):541–6. https://doi.org/10.1038/
nature12506 PMID: 23985870.
5. Cotillard A, Kennedy SP, Kong LC, Prifti E, Pons N, Le Chatelier E, et al. Dietary intervention impact on
gut microbial gene richness. Nature. 2013; 500(7464):585–8. https://doi.org/10.1038/nature12480
PMID: 23985875.
6. Aron-Wisnewsky J, Prifti E, Belda E, Ichou F, Kayser BD, Dao MC, et al. Major microbiota dysbiosis in
severe obesity: fate after bariatric surgery. Gut. 2019; 68(1):70–82. Epub 2018/06/15. https://doi.org/
10.1136/gutjnl-2018-316103 PMID: 29899081.
Gut microbiota and diabetes after kidney transplantation
PLOS ONE | https://doi.org/10.1371/journal.pone.0227373 January 7, 2020 16 / 18
7. Murphy EF, Cotter PD, Healy S, Marques TM, O’Sullivan O, Fouhy F, et al. Composition and energy
harvesting capacity of the gut microbiota: relationship to diet, obesity and time in mouse models. Gut.
2010; 59(12):1635–42. https://doi.org/10.1136/gut.2010.215665 PMID: 20926643.
8. Hippe B, Remely M, Aumueller E, Pointner A, Magnet U, Haslberger AG. Faecalibacterium prausnitzii
phylotypes in type two diabetic, obese, and lean control subjects. Beneficial microbes. 2016; 7(4):511–
7. Epub 2016/04/07. https://doi.org/10.3920/BM2015.0075 PMID: 27048834.
9. Wu GD, Chen J, Hoffmann C, Bittinger K, Chen YY, Keilbaugh SA, et al. Linking long-term dietary pat-
terns with gut microbial enterotypes. Science. 2011; 334(6052):105–8. https://doi.org/10.1126/science.
1208344 PMID: 21885731; PubMed Central PMCID: PMC3368382.
10. Ley RE, Turnbaugh PJ, Klein S, Gordon JI. Microbial ecology: human gut microbes associated with
obesity. Nature. 2006; 444(7122):1022–3. https://doi.org/10.1038/4441022a PMID: 17183309.
11. Wu X, Ma C, Han L, Nawaz M, Gao F, Zhang X, et al. Molecular characterisation of the faecal micro-
biota in patients with type II diabetes. Curr Microbiol. 2010; 61(1):69–78. https://doi.org/10.1007/
s00284-010-9582-9 PMID: 20087741.
12. Remely M, Hippe B, Zanner J, Aumueller E, Brath H, Haslberger AG. Gut microbiota of obese, type 2
diabetic individuals is enriched in Faecalibacterium prausnitzii, Akkermansia muciniphila and Peptos-
treptococcus anaerobius after weight loss. Endocrine, metabolic & immune disorders drug targets.
2016. Epub 2016/09/01. https://doi.org/10.2174/1871530316666160831093813 PMID: 27577947.
13. Furet JP, Kong LC, Tap J, Poitou C, Basdevant A, Bouillot JL, et al. Differential adaptation of human gut
microbiota to bariatric surgery-induced weight loss: links with metabolic and low-grade inflammation
markers. Diabetes. 2010; 59(12):3049–57. https://doi.org/10.2337/db10-0253 PMID: 20876719;
PubMed Central PMCID: PMC2992765.
14. Cani PD, Possemiers S, Van de Wiele T, Guiot Y, Everard A, Rottier O, et al. Changes in gut microbiota
control inflammation in obese mice through a mechanism involving GLP-2-driven improvement of gut
permeability. Gut. 2009; 58(8):1091–103. https://doi.org/10.1136/gut.2008.165886 PMID: 19240062;
PubMed Central PMCID: PMC2702831.
15. Everard A, Lazarevic V, Derrien M, Girard M, Muccioli GG, Neyrinck AM, et al. Responses of gut micro-
biota and glucose and lipid metabolism to prebiotics in genetic obese and diet-induced leptin-resistant
mice. Diabetes. 2011; 60(11):2775–86. https://doi.org/10.2337/db11-0227 PMID: 21933985; PubMed
Central PMCID: PMC3198091.
16. Everard A, Lazarevic V, Gaia N, Johansson M, Stahlman M, Backhed F, et al. Microbiome of prebiotic-
treated mice reveals novel targets involved in host response during obesity. ISME J. 2014; 8(10):2116–
30. https://doi.org/10.1038/ismej.2014.45 PMID: 24694712; PubMed Central PMCID: PMC4163056.
17. Plovier H, Everard A, Druart C, Depommier C, Van Hul M, Geurts L, et al. A purified membrane protein
from Akkermansia muciniphila or the pasteurized bacterium improves metabolism in obese and diabetic
mice. Nat Med. 2017; 23(1):107–13. https://doi.org/10.1038/nm.4236 PMID: 27892954.
18. Dao MC, Everard A, Aron-Wisnewsky J, Sokolovska N, Prifti E, Verger EO, et al. Akkermansia mucini-
phila and improved metabolic health during a dietary intervention in obesity: relationship with gut micro-
biome richness and ecology. Gut. 2016; 65(3):426–36. https://doi.org/10.1136/gutjnl-2014-308778
PMID: 26100928.
19. Backhed F, Ding H, Wang T, Hooper LV, Koh GY, Nagy A, et al. The gut microbiota as an environmental
factor that regulates fat storage. Proc Natl Acad Sci U S A. 2004; 101(44):15718–23. https://doi.org/10.
1073/pnas.0407076101 PMID: 15505215; PubMed Central PMCID: PMC524219.
20. Everard A, Cani PD. Diabetes, obesity and gut microbiota. Best Pract Res Clin Gastroenterol. 2013; 27
(1):73–83. https://doi.org/10.1016/j.bpg.2013.03.007 PMID: 23768554.
21. Tilg H, Moschen AR. Microbiota and diabetes: an evolving relationship. Gut. 2014; 63(9):1513–21.
Epub 2014/05/17. https://doi.org/10.1136/gutjnl-2014-306928 PMID: 24833634.
22. Tremaroli V, Backhed F. Functional interactions between the gut microbiota and host metabolism.
Nature. 2012; 489(7415):242–9. https://doi.org/10.1038/nature11552 PMID: 22972297.
23. Kootte RS, Levin E, Salojarvi J, Smits LP, Hartstra AV, Udayappan SD, et al. Improvement of Insulin
Sensitivity after Lean Donor Feces in Metabolic Syndrome Is Driven by Baseline Intestinal Microbiota
Composition. Cell Metab. 2017; 26(4):611–9 e6. Epub 2017/10/06. https://doi.org/10.1016/j.cmet.2017.
09.008 PMID: 28978426.
24. Vrieze A, Van Nood E, Holleman F, Salojarvi J, Kootte RS, Bartelsman JF, et al. Transfer of intestinal
microbiota from lean donors increases insulin sensitivity in individuals with metabolic syndrome. Gastro-
enterology. 2012; 143(4):913–6 e7. https://doi.org/10.1053/j.gastro.2012.06.031 PMID: 22728514.
25. Luan FL, Samaniego M. Transplantation in diabetic kidney failure patients: modalities, outcomes, and
clinical management. Semin Dial. 2010; 23(2):198–205. https://doi.org/10.1111/j.1525-139X.2010.
00708.x PMID: 20374550.
Gut microbiota and diabetes after kidney transplantation
PLOS ONE | https://doi.org/10.1371/journal.pone.0227373 January 7, 2020 17 / 18

26. Palepu S, Prasad GV. New-onset diabetes mellitus after kidney transplantation: Current status and
future directions. World J Diabetes. 2015; 6(3):445–55. https://doi.org/10.4239/wjd.v6.i3.445 PMID:
25897355; PubMed Central PMCID: PMC4398901.
27. Hecking M, Werzowa J, Haidinger M, Horl WH, Pascual J, Budde K, et al. Novel views on new-onset
diabetes after transplantation: development, prevention and treatment. Nephrol Dial Transplant. 2013;
28(3):550–66. https://doi.org/10.1093/ndt/gfs583 PMID: 23328712; PubMed Central PMCID:
PMC4375396.
28. Wissing KM, Pipeleers L. Obesity, metabolic syndrome and diabetes mellitus after renal transplantation:
prevention and treatment. Transplantation reviews (Orlando, Fla). 2014; 28(2):37–46. Epub 2014/02/
11. https://doi.org/10.1016/j.trre.2013.12.004 PMID: 24507957.
29. Curtis JR, Westfall AO, Allison J, Bijlsma JW, Freeman A, George V, et al. Population-based assess-
ment of adverse events associated with long-term glucocorticoid use. Arthritis and rheumatism. 2006;
55(3):420–6. Epub 2006/06/02. https://doi.org/10.1002/art.21984 PMID: 16739208.
30. Boots JM, van Duijnhoven EM, Christiaans MH, Wolffenbuttel BH, van Hooff JP. Glucose metabolism
in renal transplant recipients on tacrolimus: the effect of steroid withdrawal and tacrolimus trough level
reduction. J Am Soc Nephrol. 2002; 13(1):221–7. Epub 2001/12/26. PMID: 11752041.
31. Johnston O, Rose CL, Webster AC, Gill JS. Sirolimus is associated with new-onset diabetes in kidney
transplant recipients. J Am Soc Nephrol. 2008; 19(7):1411–8. Epub 2008/04/04. https://doi.org/10.
1681/ASN.2007111202 PMID: 18385422; PubMed Central PMCID: PMC2440303.
32. Anders HJ, Andersen K, Stecher B. The intestinal microbiota, a leaky gut, and abnormal immunity in kid-
ney disease. Kidney Int. 2013; 83(6):1010–6. https://doi.org/10.1038/ki.2012.440 PMID: 23325079.
33. Yoshifuji A, Wakino S, Irie J, Tajima T, Hasegawa K, Kanda T, et al. Gut Lactobacillus protects against
the progression of renal damage by modulating the gut environment in rats. Nephrol Dial Transpl. 2016;
31(3):401–12. https://doi.org/10.1093/ndt/gfv353 WOS:000371521400011. PMID: 26487672
34. Tourret J, Willing BP, Dion S, MacPherson J, Denamur E, Finlay BB. Immunosuppressive Treatment
Alters Secretion of Ileal Antimicrobial Peptides and Gut Microbiota, and Favors Subsequent Coloniza-
tion by Uropathogenic Escherichia coli. Transplantation. 2017; 101(1):74–82. https://doi.org/10.1097/
TP.0000000000001492 PMID: 27681266.
35. Classification and Diagnosis of Diabetes: Standards of Medical Care in Diabetes-2018. Diabetes Care.
2018; 41(Suppl 1):S13–s27. Epub 2017/12/10. https://doi.org/10.2337/dc18-S002 PMID: 29222373.
36. Thomas V, Clark J, Dore J. Fecal microbiota analysis: an overview of sample collection methods and
sequencing strategies. Future Microbiol. 2015; 10(9):1485–504. https://doi.org/10.2217/fmb.15.87
PMID: 26347019.
37. Zhang X, Shen D, Fang Z, Jie Z, Qiu X, Zhang C, et al. Human gut microbiota changes reveal the pro-
gression of glucose intolerance. PLoS One. 2013; 8(8):e71108. https://doi.org/10.1371/journal.pone.
0071108 PMID: 24013136; PubMed Central PMCID: PMC3754967.
38. Yassour M, Lim MY, Yun HS, Tickle TL, Sung J, Song YM, et al. Sub-clinical detection of gut microbial
biomarkers of obesity and type 2 diabetes. Genome Med. 2016; 8(1):17. https://doi.org/10.1186/
s13073-016-0271-6 PMID: 26884067; PubMed Central PMCID: PMC4756455.
39. Li H, He J, Jia W. The influence of gut microbiota on drug metabolism and toxicity. Expert opinion on
drug metabolism & toxicology. 2016; 12(1):31–40. Epub 2015/11/17. https://doi.org/10.1517/17425255.
2016.1121234 PMID: 26569070.
40. Wu H, Esteve E, Tremaroli V, Khan MT, Caesar R, Manneras-Holm L, et al. Metformin alters the gut
microbiome of individuals with treatment-naive type 2 diabetes, contributing to the therapeutic effects of
the drug. Nat Med. 2017; 23(7):850–8. Epub 2017/05/23. https://doi.org/10.1038/nm.4345 PMID:
28530702.
Gut microbiota and diabetes after kidney transplantation
PLOS ONE | https://doi.org/10.1371/journal.pone.0227373 January 7, 2020 18 / 18