Gunda Dorothea Albert MARKET ANALYSIS OF THE FINNISH FOOD
86
Gunda Dorothea Albert MARKET ANALYSIS OF THE FINNISH FOOD MARKET FOR FOOD PRODUCTS FROM SCHLESWIG-HOLSTEIN Degree Programme in International Business and Marketing Logistics 2013
Transcript of Gunda Dorothea Albert MARKET ANALYSIS OF THE FINNISH FOOD
Gunda Dorothea Albert
MARKET ANALYSIS OF THE FINNISH FOOD MARKET FOR
FOOD PRODUCTS FROM SCHLESWIG-HOLSTEIN
Degree Programme in International Business
and Marketing Logistics
2013
MARKET ANALYSIS OF THE FINNISH FOOD MARKET FOR FOOD
PRODUCTS FROM SCHLESWIG-HOLSTEIN
Albert, Gunda Dorothea
Satakunnan ammattikorkeakoulu, Satakunta University of Applied Sciences
Degree Programme in International Business and Marketing Logistics
September 2013
Supervisors: Antola, Kati & Lindström, Taina
Number of pages: 82
Appendices: 2
Keywords: market analysis, Finland, food market, food retailing
____________________________________________________________________
The purpose of this thesis was to study market research and the main elements of a
market analysis to apply this knowledge to a market analysis of the Finnish food re-
tail market for companies from Schleswig-Holstein. The client organization for this
thesis was the Chamber of Commerce and Industry in Lübeck (IHK zu Lübeck).
The theoretical background covers the theory of market research and market analy-
sis. In the first part is explained how a research is conducted. The second part defines
what is covered in a market analysis. The conceptual framework illustrates the mar-
ket analysis conducted in this thesis.
Data and background material for the market analysis was gathered from secondary
data which was found in online databases, books, articles and was provided by indus-
try experts who were interviewed for the purpose of this thesis. Primary data was
gathered through interviews with Finpro, the Finnish Grocery Trade Association and
the Finnish Food and Drink Industries’ Federation.
The market analysis examines the Finnish food and food retail market. This includes
Finland as a target market, relations between Finland and Schleswig-Holstein, con-
sumer behaviour, import, legal framework, retail, procurement and distribution. Fur-
thermore, a small database was created for the client and its members. It contains
companies and organizations which are active in the Finnish food market.
The results of this study can be used by the IHK zu Lübeck to support its members in
entering the Finnish market or improving the existing export activities to Finland.
TABLE OF CONTENT
1 INTRODUCTION ........................................................................................................ 5
2 PURPOSE AND BACKGROUND OF THIS STUDY ............................................... 6
2.1 Purpose and objectives .......................................................................................... 6
2.2 IHK zu Lübeck ...................................................................................................... 6
3 THEORETICAL BACKGROUND ............................................................................. 8
3.1 Market research ..................................................................................................... 8
3.1.1 Defining the research problem or opportunity ............................................... 9
3.1.2 Setting the research objectives ....................................................................... 9
3.1.3 Developing a research design ....................................................................... 10
3.1.4 Preparation of the data collection ................................................................. 12
3.1.5 Data collection.............................................................................................. 14
3.1.6 Analysis of the results .................................................................................. 14
3.1.7 Writing and presenting the research report .................................................. 15
3.2 Market analysis ................................................................................................... 16
3.2.1 Macroenvironment ....................................................................................... 18
3.2.2 Microenvironment ........................................................................................ 22
3.3 Database ............................................................................................................ 25
3.4 Conceptual framework ........................................................................................ 26
4 PROJECT IMPLEMENTATION .............................................................................. 28
5 PRODUCTS AND COMPANIES ............................................................................. 30
5.1 Products ............................................................................................................ 30
5.2 Companies present in the Finnish market ........................................................... 31
6 MARKET ANALYSIS .............................................................................................. 35
6.1 Target market ...................................................................................................... 35
6.1.1 Finland as target market ............................................................................... 35
6.1.2 Relations between Finland and Schleswig-Holstein .................................... 39
6.1.3 Food market and food retail in Finland ........................................................ 43
6.2 Consumer behaviour ........................................................................................... 45
6.3 Import of food products ...................................................................................... 48
6.4 Legal framework ................................................................................................. 50
6.5 Sales / distribution .............................................................................................. 51
6.5.1 Retail .......................................................................................................... 51
6.5.2 Purchasing and supplying............................................................................. 54
6.5.3 Distribution and distribution channels ......................................................... 57
6.6 Database ............................................................................................................ 59
6.6.1 Institutions, authorities, etc. ......................................................................... 59

6.6.2 Wholesalers, grocery retail groups, chains etc. ............................................ 63
6.6.3 Trade fairs in Finland ................................................................................... 71
7 PROJECTS RESULTS AND CONCLUSION .......................................................... 73
7.1 Evaluation of results ........................................................................................... 73
7.2 Conclusion .......................................................................................................... 75
8 FINAL WORDS ......................................................................................................... 77
REFERENCES ................................................................................................................ 79
APPENDICES
5
1 INTRODUCTION
From September 2012 to March 2013 I did an internship in the marketing department
of the German-Irish Chamber of Industry and Commerce in Dublin, Ireland. During
those six months I worked on a trade mission from Germany to Ireland. One part of
the trade mission was a market analysis of the Irish wine market which also con-
tained the chances of German wine in Ireland.
I got interested in this kind of task but also in organizations which provide services
for companies to improve their business, especially in an international context. When
thinking of my thesis I wanted to write about a topic which is useful to a company or
organization and provide them with my thesis to improve or extend their business.
Thus, I decided to write a market analysis for the Chamber of Commerce and Indus-
try in Lübeck (Industrie- und Handelskammer zu Lübeck in German; short IHK zu
Lübeck).
The IHK zu Lübeck is a membership organization which offers several services and
products to companies in the region of the old Hanseatic city of Lübeck. The Cham-
ber also helps companies with the internationalization of their business.
The topic of the market analysis is the study of the Finnish food market and the
chances for food from Schleswig-Holstein, the northernmost state of the Federal Re-
public of Germany, in Finland. With this thesis I aim to provide the IHK zu Lübeck
with an analysis which can be used to support companies in extending their business
to Finland.
I am from Lübeck which is the second biggest city in Schleswig-Holstein and have
studied in Rauma, Finland. This personal connection to the topic and my experience
to write a market analysis during my internship in a Chamber of Commerce and In-
dustry Abroad helped me in this thesis project. Altogether, I have lived in Finland for
about four years and have a basic knowledge of the Finnish language. This was an
asset for me when researching the Finnish food market.
6
2 PURPOSE AND BACKGROUND OF THIS STUDY
2.1 Purpose and objectives
The purpose of this thesis is to study the Finnish food market and the chances of im-
ported food products from Schleswig-Holstein, Germany in Finland. This market
analysis was conducted for the Chamber of Industry and Commerce in Lübeck, here-
inafter called IHK zu Lübeck, which can be used by the IHK or by its member com-
panies to enter the Finnish market or to improve their existing exports. The thesis
shall also be usable as a reference in my CV.
In the theoretical part of this thesis the following objectives and questions will be
achieved and answered:
How to conduct a good research.
How to conduct a market analysis.
What are the elements of a good market analysis?
In the practical part the following questions will be answered:
How is the Finnish food market structured?
How is the competition in the Finnish food market?
What characterises the Finnish consumer and their behaviour?
How are the chances for food products from Schleswig-Holstein?
2.2 IHK zu Lübeck
In Germany all companies that are registered in the republic regardless of their size
and business area have to be a member of a Chamber of Commerce and Industry.
However, there are a few exceptions, e.g. for farms. The IHKs represent industry,
commerce and service companies, and act as a mediator between politics and their
member companies. Furthermore, the Chambers offer business related services and
provide objective advices for public decision makers. (IHK Schleswig-Holstein
2013.)
7
The Chambers in Germany were also assigned tasks by the state such as issuing cer-
tificates of origin and carnets or setting vocational training examinations. They also
maintain a database of companies which comply with environmental standards. (IHK
Schleswig-Holstein 2013.)
The Chamber of Commerce and Industry in Lübeck was founded in the year 1853
and represents the industry between the Baltic Sea and the river Elbe. The IHK zu
Lübeck has approximately 70,000 members which are based in Lübeck as well as in
the districts Herzogtum Lauenburg, Ostholstein, Segeberg and Stormarn. (IHK
Schleswig-Holstein 2013.)
The IHK zu Lübeck is part of the Association of German Chambers of Commerce
and Industry (DIHK), the umbrella organization of the 80 Chambers of Commerce
and Industry in Germany and the 120 German Chambers of Commerce Abroad
(AHK) located in 80 countries. Since 2006 the IHK zu Lübeck has also been a part of
the working group IHK Schleswig-Holstein which deals with issues that are of a su-
pra-regional concern. The other members of this working group are the IHK zu
Flensburg and the IHK zu Kiel. (IHK Schleswig-Holstein 2013.)
8
3 THEORETICAL BACKGROUND
The theoretical background of this thesis is divided into two parts: market research
and market analysis. The market research deals with the research process and how it
is conducted. The second part deals with the market analysis which contains what is
researched.
3.1 Market research
Market research is a process which runs through several steps. The steps vary in lit-
erature, depending on what the author wants to emphasize. Mainly they include
around seven steps.
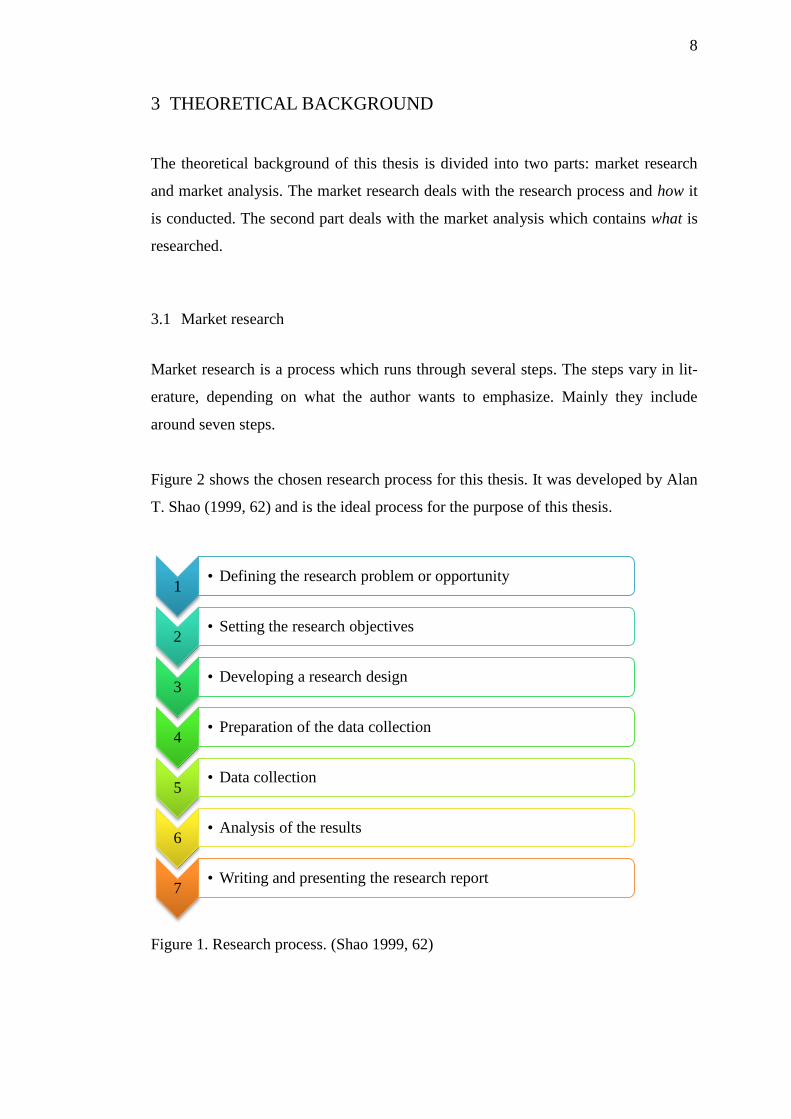
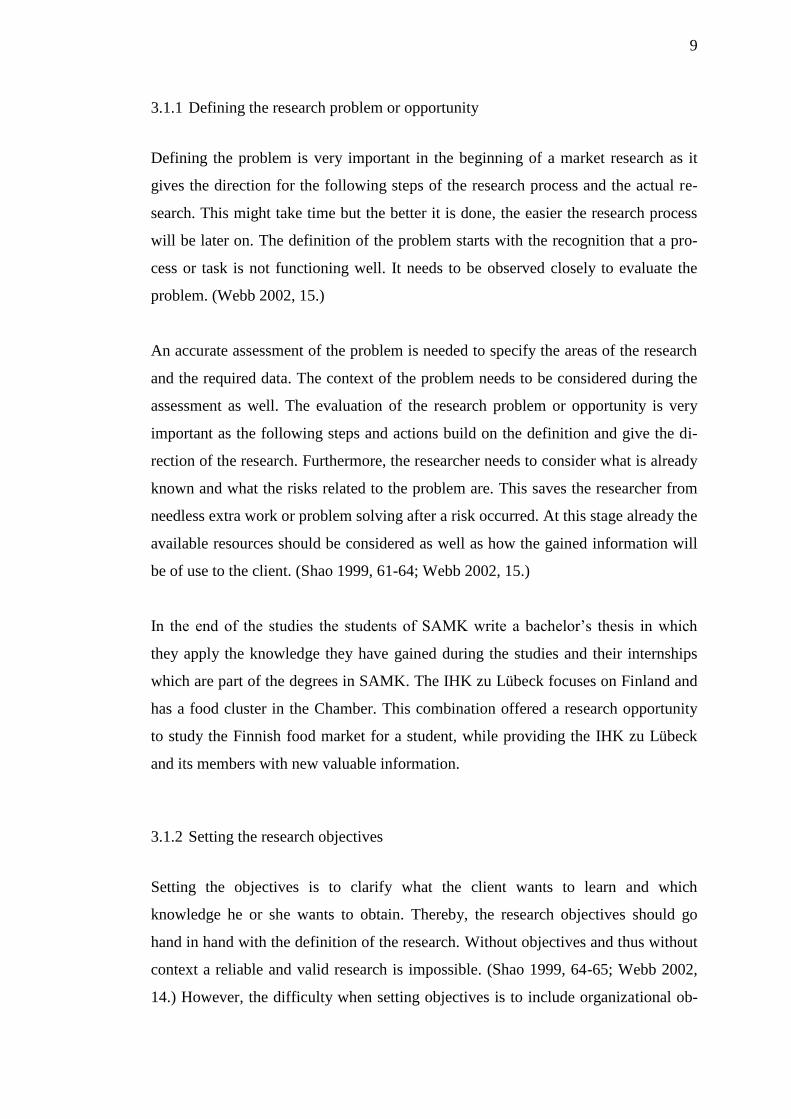
Figure 2 shows the chosen research process for this thesis. It was developed by Alan
T. Shao (1999, 62) and is the ideal process for the purpose of this thesis.
Figure 1. Research process. (Shao 1999, 62)
1 • Defining the research problem or opportunity
2 • Setting the research objectives
3 • Developing a research design
4 • Preparation of the data collection
5 • Data collection
6 • Analysis of the results
7 • Writing and presenting the research report
9
3.1.1 Defining the research problem or opportunity
Defining the problem is very important in the beginning of a market research as it
gives the direction for the following steps of the research process and the actual re-
search. This might take time but the better it is done, the easier the research process
will be later on. The definition of the problem starts with the recognition that a pro-
cess or task is not functioning well. It needs to be observed closely to evaluate the
problem. (Webb 2002, 15.)
An accurate assessment of the problem is needed to specify the areas of the research
and the required data. The context of the problem needs to be considered during the
assessment as well. The evaluation of the research problem or opportunity is very
important as the following steps and actions build on the definition and give the di-
rection of the research. Furthermore, the researcher needs to consider what is already
known and what the risks related to the problem are. This saves the researcher from
needless extra work or problem solving after a risk occurred. At this stage already the
available resources should be considered as well as how the gained information will
be of use to the client. (Shao 1999, 61-64; Webb 2002, 15.)
In the end of the studies the students of SAMK write a bachelor’s thesis in which
they apply the knowledge they have gained during the studies and their internships
which are part of the degrees in SAMK. The IHK zu Lübeck focuses on Finland and
has a food cluster in the Chamber. This combination offered a research opportunity
to study the Finnish food market for a student, while providing the IHK zu Lübeck
and its members with new valuable information.
3.1.2 Setting the research objectives
Setting the objectives is to clarify what the client wants to learn and which
knowledge he or she wants to obtain. Thereby, the research objectives should go
hand in hand with the definition of the research. Without objectives and thus without
context a reliable and valid research is impossible. (Shao 1999, 64-65; Webb 2002,
14.) However, the difficulty when setting objectives is to include organizational ob-
10
jectives as well as decision maker’s objectives. To conduct a successful research the
objectives of the client’s organization and the decision maker have to match. (Mal-
hotra 2012, 76.)
There are two types of objectives in this research. At first, there is a theoretical part
in which the researcher found out the elements of a market analysis and how it is
conducted. Furthermore, the researcher had a look into the set-up of a company data-
base. Secondly, there is the practical part. The general objective is to conduct a mar-
ket analysis of the Finnish food market which contains learning about the food mar-
ket in Finland, who is already in the market, the consumer behaviour and the distri-
bution channels.
3.1.3 Developing a research design
This step already starts in the beginning with the definition because in there the ba-
sics are established and with the research design a few steps later it is ensured that
the objectives are reached. It is the framework of the project but at the same time it
should be flexible. In this step the researcher should already consider the information
he or she will gather, the method he or she wants to use to collect the data as well as
the measurement method for the data and how he or she wants to analyse the data.
The client company or organization is seeking for information which the researcher
will gather in his or her research. There are two categories of research which can be
conducted – exploratory and conclusive. Conclusive research again has two types of
research – descriptive and causal. (Shao 1999, 65; 18Webb 2002, 18-20.)
Exploratory research
As mentioned already above, the exploratory research is highly flexible and there is
no formal structure for the execution of this research. Often it is used to gain prelim-
inary information when no details are needed, so to explore and uncover. This means
also that the costs for exploratory research are relatively low. The researcher learns
from the experience he or she gains during the research and from experiments. The
data can be collected in many different ways which can be primary as well as sec-
ondary data. Exploratory research is often used if no knowledge about the topic is
11
available yet and it is less scientific. The samples are rather small or experiments are
conducted. The main goal is to explore as the title already implies and not to con-
clude. If that is needed, a conclusive research can follow. (Shao 1999, 66-67; Webb
2002, 20.)
Conclusive research
Contrary to the exploratory research is the conclusive research. It is used to get in-
formation which can be used for evaluations and conclusions and thus, they need to
be reliable and are more specific. The topic is often known well and therefore, the
researcher can focus more on the details and new findings. The approach depends on
the purpose and the flexibility of the study as well as on the costs and the data collec-
tion method. Nevertheless, the method is formal and often more statistical. (Shao
1999, 67.)
Descriptive research is probably the most common type of research and is used to
describe a situation, opportunity, problem, behaviour or characteristic of interest. The
research problem and the information needed have to be defined well in the begin-
ning and therefore a structured research plan is needed. The data can be gathered
from several sources. The samples are rather big and the resources need to be suita-
ble because this type of research might be used by managers for important decisions.
Relationships between the research and other variables can be shown but it does not
go further into the details. Descriptive together with exploratory research can be a
good combination for a project to succeed. (Shao 1999, 67-68; Webb 2002, 20-21.)
Causal research is used to explain relationships between one or more situations, op-
portunities, problems, behaviours or characteristics of interest. As descriptive re-
search, it is structured, conclusive, costly and statistically sound. This type of re-
search could be used for instance to explain the relationship between advertisement
and sales. (Shao 1999, 68-70; Webb 2002, 21.)
The chosen research design for this thesis is the conclusive research as most of the
information is already available. The research is mainly descriptive as it can be seen
in Chapter 6; however it also includes some elements of an exploratory research
(conducted by expert interviews to gain more insight into the chances for companies
12
from Schleswig-Holstein). In Chapter 7 the findings are evaluated and conclusions
were drawn. This is descriptive research too.
3.1.4 Preparation of the data collection
In literature several data collection methods can be found. Nonetheless, there are no
set rules which method to use or if it should be a single or mixed method approach.
The researcher has to decide which method(s) suit(s) best to his or her research.
However, all data needs to be valid and reliable. It should be relevant to the research
and it should not be too difficult to acquire in a reasonable time frame and for appro-
priate expenses. (Webb 2002, 21-22, 29.)
There are two types of data for researchers to use – primary and secondary data:
Primary data
When doing research and the data is collected by the researcher him- or herself, it is
called primary data. It is original data which is collected for the purpose of one’s
own on-going research. This data is mainly gathered, if the needed data does not ex-
ist yet, the previous data is out-of-date or otherwise not accessible. However, it can
be time consuming and expensive. (Shao 1999, 72, 151.)
There are four main methods for data collection: Survey research, qualitative re-
search, experimental research and observation. The first, survey research, requires
big samples and it is structured or semi-structured. There are interviews which can
be done face-to-face, by and on the computer, but there are also questionnaires which
can be sent out by email or fax, or they can be handed out and collected afterwards.
(Webb 2002, 22.)
Another research method is the qualitative research in which the interviews are un-
structured and the sample size is small. The aim is to get also the beliefs, feelings and
attitudes of the interviewees. The first method is depths interviews which are done on
a one-to-one basis and thus, they can be free discussions without any pressure. An-
other method is group discussions (approx. 6 to 10 persons) where the participants
13
discuss about a given topic by the researcher. This method is useful if the researcher
is not only interested in the answers to the questions but also in the group dynamics
during the discussion. The third method is the projective technique. This is used
when the researcher cannot acquire the beliefs, feelings and attitudes of the inter-
viewees by asking questions but when the interviewee is projecting his or her feel-
ings onto persons or objects. (Webb 2002, 22-23.)
In experimental research independent variables are tested or manipulated and subse-
quently the effects are measured. This can be done in an artificial setting (laboratory
experiment) or in the office or home of the respondent (field experiment). In obser-
vation the researcher is not questioning the respondent but is observing him or her to
learn about the behaviour. Observation can be expensive and time consuming if the
activity or action is long-lasting or the waiting time until the occurrence takes a long
time. (Webb 2002, 23-24.)
Secondary data
This type of data is the same as primary data and was collected in the same way but
it was collected for a previous other purpose. Companies also save time and money
when using it as they do not need to carry out the research and can use the data in-
stantly. Next to saving time and money also the availability, accessibility and rele-
vance of the data are reasons why secondary date has become more popular over the
years. The secondary data can be internal, meaning it was collected within the com-
pany and can be used for the research. It can also be external and can be published by
the government or colleges, in trade or professional association reports, in newspa-
pers or magazines, in electronic databases or by research institutions. However, the
researcher has to consider that the data was intended for a different purpose and thus
it was interpreted respectively. It is also not known how the data was collected and
therefore the researcher does not know if the data is accurate. (Shao 1999, 74, 124,
136; Webb 2002, 22.)
Already during the planning phase of the bachelor’s thesis, the decision was made to
collect secondary data and conduct interviews with industry experts to gain a deeper
insight. Furthermore, this combination was ideal for the chosen time frame and for
the purpose of a bachelor’s thesis. The secondary data was evaluated well and was
14
collected from reliable sources. The interviews were conducted with industry ex-
perts. Two of them work for organizations which are involved in the food retail in
Finland.
3.1.5 Data collection
The actual conduction of the interview or the completion of the survey form is the
data collection. This is done by the methods or only one of them which are described
in chapter 3.1.5. The collection method the researcher chooses depends on the re-
search he or she wants to conduct but also on the time frame, the demographics of
the respondents, the survey content if one is used, the length and structure of the re-
search or the desired response rate. Furthermore, the researcher has to be prepared
for potential mistakes or errors and needs to react to them and make the adjustments
accordingly. (Shao 1999, 75-76; Webb 2002, 26.)
The chosen data collection for this bachelor’s thesis was on the one hand the collec-
tion and analysis of secondary data from online sources like statistical databases and
Emerald, a database containing articles. On the other hand, depth interviews with ex-
perts from organizations engaged in the Finnish food industry and market were con-
ducted to receive a deeper insight into the Finnish food market.
3.1.6 Analysis of the results
The analysis of the results is the processing of the data which was collected in the
previous step. How the analysis is done depends on the data collection and the re-
search as well as on the measurement method. The researcher has to check first, if
the data he or she has collected is complete, consistent, accurate and legible. This is
especially important when quantitative data has been collected. Then the data is cod-
ed which is assignment of responses to scores or codes, and after that the analysis of
the results can be done and conclusions can be drawn. (Shao 1999, 76; Webb 2002,
26-27.)
15
The moment the researcher decides for sampling and data collection he or she also
must decide at the same step how the result should be analysed. If this is done later, it
takes additional time and effort. (Webb 2002, 26-27.)
The answers of the interviewees will be checked, if they are complete and afterwards
they will be compared with each other, and also with the secondary data that ev-
erthing is consistent. The secondary data was already analysed after it had been col-
lected for a different purpose. Thus, it is important to be cautious because the pur-
pose might have been the complete opposite.
3.1.7 Writing and presenting the research report
This is the last step of the market research. Reports are at least presented in a written
format and in addition they can be presented orally, if the client requests so. Im-
portant is also to remember to meet the requirements which have been set by the cli-
ent together with the researcher in the beginning. (Shao 1999, 76-77; Webb 2002,
27.)
A research report contains an executive summary, and the description of the research
environment. This includes the research design and the context of the research as
well as possible assumptions how the research was conducted in order that the reader
understands what was done and for which reasons. After these parts the results of the
research follows. The requirements set by the client give a guideline whether the re-
sults are simply presented in the report or if they are explained and interpreted with
an evaluation or recommendation. When writing the report the researcher needs to
consider the reader and the audience to which the content will be presented. The re-
port is a tool on which decision will be based. Therefore, it is important that the
reader understands the results and interpretations because he or she was not part in
the process. (Shao 1999, 76-77; Webb 2002, 27.)
The last step of the market research was an on-going process from the beginning.
Nevertheless, it was divided primarily in two parts. At first the researcher concen-
trated on the theoretical background before focusing on the practical part and the ac-
16
tual research. Already from the beginning of the writing process of the thesis, the
project was presented in three seminars to the supervising teacher in SAMK and to
fellow students. At first there was the presentation of the project plan, followed by
the second seminar in which the researcher introduced the theoretical element of the
thesis. Before handing in the final version of the bachelor’s thesis, the researcher pre-
sented her whole work in a third seminar.
3.2 Market analysis
Market analyses are mainly done when a company considers entering a new market.
Thus, all alternatives need to be considered well before making any decisions and the
data collected in the analysis needs to be reliable because it influences the decisions.
It starts with an external analysis and then ends with the internal analysis. In the ex-
ternal analysis there is at first the macroenvironment which includes political, legal,
economic, social and cultural as well as technological aspects, on the other hand
there is the microenvironment which is about the customers, suppliers, intermediar-
ies, stakeholders and competitors. The external analysis is also the more expensive
and time-consuming part which needs to be conducted very thoroughly. (Stevens et
al., 2012, 7-9.)
If the external analysis indicates that a market entry could succeed, the financial
analysis follows the previous external analysis. In the second part of the analysis –
already internal because it is about the company – the financial situation of the com-
pany is examined carefully as well as the profitability and the return on investment.
A thorough analysis can attract investors to support the company in their extension.
(Stevens et al., 2012, 7-9.)
In the last part of a market analysis is the company itself. That seems at first slightly
unusual because it does not have directly to do with the market which shall be en-
tered, but it is important as the resources the company has are analysed as well as
purposes and objectives. An opportunity might be considered profitable after the ex-
ternal and financial analysis but it might not match the purposes and objectives of the
company. Despite a thorough market analysis, it cannot be guaranteed that a market
17
entry will be successful. Nevertheless, the better and detailed an analysis is the
smaller the chances of failures are. (Stevens et al., 2012, 7-9.)
The market analysis in this bachelor’s thesis is of the Finnish market and therefore, it
is a foreign market for companies from Schleswig-Holstein. Although both Finland
and Schleswig-Holstein as a federal state of Germany are members of the European
Union, the Finnish market is still a foreign market with its differences and singulari-
ties for companies from Schleswig-Holstein. Thus, every company from Schleswig-
Holstein that enters the Finnish market should have foreign business knowledge, for-
eign institutional knowledge and internationalisation knowledge (Kuada 2008, 26) to
be successful.
Foreign business knowledge is what a company knows about suppliers, clients or
customers, competitors and the market in another country. This can be gained
through the study of the micro environment of the foreign market. The foreign insti-
tutional knowledge is equal to knowing the macroenvironment which includes the
governmental policies, bureaucratic regulations or culture such as the business cul-
ture, social values and norms as well as rules of behaviour. The last knowledge a
company needs when targeting a foreign market is internationalisation knowledge.
This means that the company has to know how to do business outside of the home
country and the domestic market as well as know about the procedures in interna-
tional operations. (Kuada 2008, 26.) Within the European Union international opera-
tions are much easier as many rules and regulations are set by the EU and thus, they
are valid for the home – in this case Schleswig-Holstein – and the target market –
Finland. This knowledge is all gained through a market analysis of the target coun-
try.
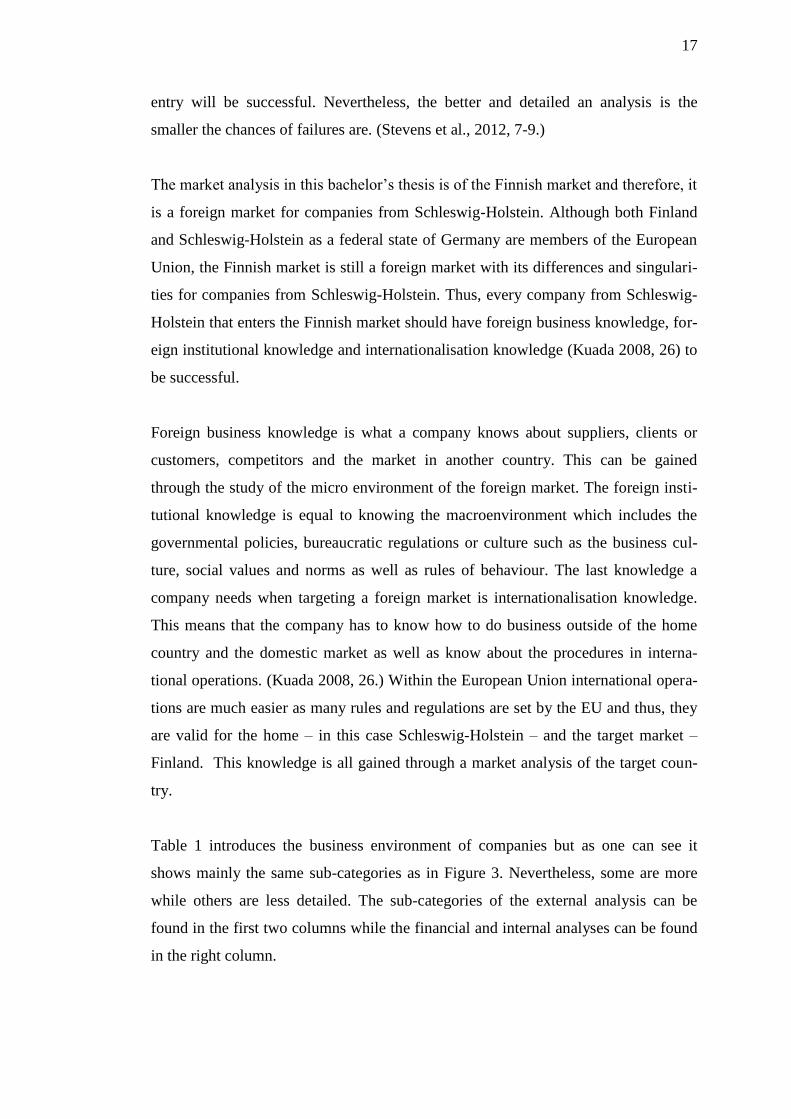
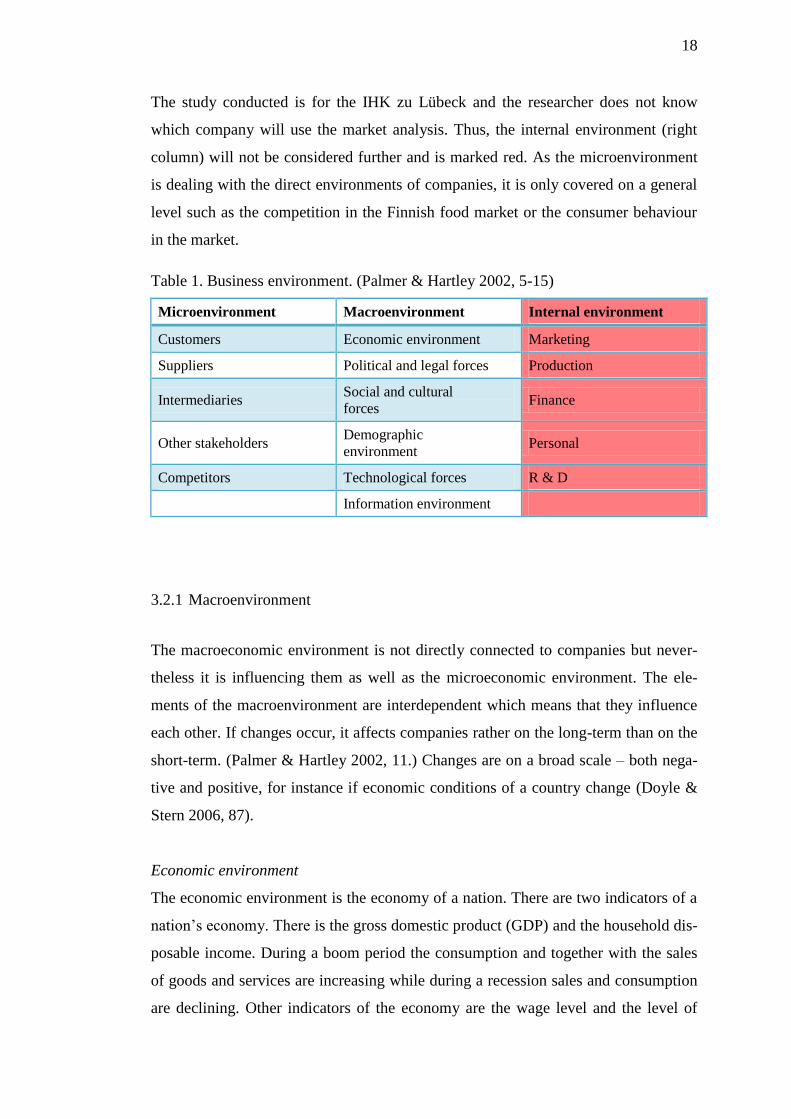
Table 1 introduces the business environment of companies but as one can see it
shows mainly the same sub-categories as in Figure 3. Nevertheless, some are more
while others are less detailed. The sub-categories of the external analysis can be
found in the first two columns while the financial and internal analyses can be found
in the right column.
18
The study conducted is for the IHK zu Lübeck and the researcher does not know
which company will use the market analysis. Thus, the internal environment (right
column) will not be considered further and is marked red. As the microenvironment
is dealing with the direct environments of companies, it is only covered on a general
level such as the competition in the Finnish food market or the consumer behaviour
in the market.
Table 1. Business environment. (Palmer & Hartley 2002, 5-15)
Microenvironment Macroenvironment Internal environment
Customers Economic environment Marketing
Suppliers Political and legal forces Production
Intermediaries Social and cultural
forces Finance
Other stakeholders Demographic
environment Personal
Competitors Technological forces R & D
Information environment
3.2.1 Macroenvironment
The macroeconomic environment is not directly connected to companies but never-
theless it is influencing them as well as the microeconomic environment. The ele-
ments of the macroenvironment are interdependent which means that they influence
each other. If changes occur, it affects companies rather on the long-term than on the
short-term. (Palmer & Hartley 2002, 11.) Changes are on a broad scale – both nega-
tive and positive, for instance if economic conditions of a country change (Doyle &
Stern 2006, 87).
Economic environment
The economic environment is the economy of a nation. There are two indicators of a
nation’s economy. There is the gross domestic product (GDP) and the household dis-
posable income. During a boom period the consumption and together with the sales
of goods and services are increasing while during a recession sales and consumption
are declining. Other indicators of the economy are the wage level and the level of
19
employment as well as the currency. (Morrison 2011, 29; Palmer & Hartley 2002,
11-12.)
Forecasts for companies are based on the situation of the national economy and the
forecasts of that. It is also important to understand the relationship between economic
factors and the state of the current demand. While some products are related to the
income, others have to be bought anyhow. (Palmer & Hartley 2002, 11-12.) Some
goods might not be bought at all anymore, if one’s situation is degrading, whereas
other products are switched against cheaper brands and the sales volume of expen-
sive or luxury brands decrease. On the other hand when more money is available the
sales volume might not necessarily increase because different goods and services are
bought. Furthermore, increasing wealth can also be seen in the purchase of more ex-
pensive goods and services. (Palmer & Hartley 2002, 11-12.)
Many competitors in a market create pressure for companies and the prices for the
products and services for customers go down, while on the other hand competition
evolves and the costs for the resources are going up (Palmer & Hartley 2002, 12).
Political environment
The political environment is forming the macro environment and it is its main influ-
encer through new or altered legislation by politicians, but also supranational organi-
zations such as the WTO can have an impact. The form of government and the polit-
ical stability have a big impact on the economic environment of a country. Further-
more, the political environment influences the market and production of companies
as well as the competitive framework. The fiscal and monetary policy for instance is
affecting the wealth of companies, the public sector and the people. A further indica-
tor what kind of a political environment prevails in a country is the freedom of ex-
pressions for press and individuals. (Morrison 2011, 29-30; Palmer & Hartley 2002,
13.)
Social and cultural environment
The social and cultural environment is about shared attitudes and values as well as
about symbols, rituals and material manifestations such as art and literature in a
country or nation. This environment is living and changes over time. It has to be kept
20
in mind that some values can change faster than others. The life expectancy for in-
stance has increased over the years, the role of women in the society has changed and
also leisure and healthy lifestyles have become more popular. (Palmer & Hartley 13,
382-385.)
For a company it is important to understand the social and cultural environment be-
cause it influences the company within and from the outside, for instance the sales.
Especially, if a company is entering a new market, it needs to learn about customs
and values of this market. The main factors to consider are the consumer behaviour
and the business relationships in the market. In some cultures the relationship be-
tween both parties needs to be established well before a business deal is made. Also
distribution channels need to be considered; for instance wholesaler versus corner
shops. (Palmer & Hartley 13, 382-385.)
Demographic environment
The demographic environment is the structure of the population of a country or na-
tion. The main factors which are considered are the size and the age of the popula-
tion. They can have a big influence on companies which are depending on the struc-
ture of a population. For instance, a company that is selling walking frames has more
sales in a country which has an older population than in a country with a high birth-
rate. (Palmer & Hartley 2002, 13-14.)
In western countries the demographic environment is stable; nevertheless it is slowly
changing because the number of elderly people is increasing. Another demographic
structure which is slowly changing is the household because the number of single
households is increasing. A third factor for companies to consider is the geographical
structure as this influences the distribution of products: rural vs. urban area. (Palmer
& Hartley 2002, 13-14.)
Technological forces and information environment
The technology and the development of it as well as further improvements have a big
impact on companies and organizations all over the world; even in the sense that a
certain technology is not available everywhere. The other macroenvironmental fac-
tors can influence how and if technological know-how will be adopted in a society
21
and the business environment of a country. During the last decades the change in the
technological environment has become faster and faster, especially in IT. Thus, in-
vestments in technology can be a competitive advantage, but it also helps companies
with their daily work. This environment also includes the infrastructure which is es-
sential for the transport of supplies and goods. (Morrison 2011, 29, 334; Worthington
& Britton 1997, 8, 126.)
As mentioned above the microenvironment is not detailed in this bachelor’s thesis
because it focuses on the direct environment of the companies and the researcher
does not know them. Nevertheless, there are a few microenvironmental aspects that
will be covered, even though on a general level. There are two types of competition
in the Finnish food market - between the grocery trade groups on the one hand and
between the products itself on the other hand. Furthermore, there is the consumer be-
haviour and their decision making when purchasing their groceries as well as the dis-
tribution.
Macroenvironment in the Finnish food industry and the food retail market
The economic environment for the companies from Schleswig-Holstein is still the
European market as well as the Finnish economy. The Finnish economy is stable and
the Finnish food market is currently slightly growing. Forecasts are predicting small
growth during the next years. However, those predictions are highly linked to the fur-
ther development of the euro zone and the European markets. Finland also has a sta-
ble political environment. It is a democratic governed country, the corruption is low
and Finland is also a member of a number of supranational organizations and of
course the European Union.
The Finnish culture generally is European but it was also influenced in the past by
Sweden and Russia. Finns are direct and like to go down to business right away. Dur-
ing the summer holiday season (from midsummer to the end of July / beginning of
August) the business life slows down. The main part of the Finnish population lives
in the south of the country while the north is sparsely populated. The three biggest
grocery retail groups are also present in the north of Lapland to supply the Finns that
live up there with food products.
22
The technology and the IT used in Finland are well developed and the country is also
known for the mobile phone manufacturer Nokia which recently was bought by Mi-
crosoft. In Finland there are over 9.5 million mobile phone subscriptions (Suoma-
laisilla jo 9,7 miljoonaa matkapuhelinliittymää 2013), in a country of 5 million in-
habitants.
3.2.2 Microenvironment
The people and organizations that affect – both direct and indirect – a company and
its actions are the so called microenvironment of the company (Palmer & Hartley
2002, 7). If changes occur they are limited to the market in which the company or
organization operates such as the buying behaviour of the customers.
As the changes in the macroenvironment as well as the changes in the microenvi-
ronment are out of the influence area of the company, thus the company has to adapt
as well as possible to possible changes, regardless if they are positive or negative.
(Doyle & Stern 2006, 87.)
Customers and customer behaviour
Customers are the most important part of a company because without them there is
no business. A company has to think about the needs of the customers and what they
want. This should be done by keeping in touch with the customers and by being pro-
active rather than following the wishes and requirements. (Palmer & Hartley 2002, 7-
9.) Meeting the customer needs and wishes is vital for companies for survival and
success (Worthington & Britton 1997, 9).
One part of knowing one’s own customers is to understand their behaviour and hab-
its. Companies have to learn why the customers choose their product and not one
from their competitors. This decision making process differs a lot between products.
Companies also need to know what influences the decision making and how it is
done. Those influencers can be different – like the culture, media or family and
friends; they also have different intentions when doing so. Another influencer is the
knowledge of the people about a product or the lack of knowledge and information.
Often decisions are also made during the shopping process. (Pant 2007, 52.)
23
Suppliers
They are important as well because they have the power to influence the company
and thus, they need to be reliable. Suppliers deliver goods and services which are
sold onwards with more value. Through malfunctioning products or a delay in pro-
duction the suppliers can have a negative impact on the company. (Palmer & Hartley
2002, 9.) Often companies switch to suppliers which are located on the other side of
the globe to save money or receive resources with better quality. However, longer
transportation routes include higher possibilities of delays or exchange rates might
change. But also receiving domestic supplies can be affected, for instance by techno-
logical changes or new laws by the government. (Worthington & Britton 1997, 8.)
Intermediaries
Intermediaries are between companies and their customers; such as wholesalers or
retailers, but they can also be middlemen or agencies. These intermediaries are pro-
moting, selling and distributing the products to the consumers or the final customer.
Especially large-scale producers use intermediaries to sell their products. (Karu-
nakaran, K. 2008, 27-28; Palmer & Hartley 2002, 9.) A good example for this is food
production. The producers sell their products mostly to grocery trade groups, chains
or stores where the products are sold so that the consumers do not need to purchase
every product from a different producer but can get everything they need from one
place.
Competitors
The competitors are as important for a company as the suppliers and the customers
and need to be considered well. The company has to know the status, strengths and
weaknesses of the competitors to be successful and not be kicked out of the market
by them. Having a competitive advantage, regardless what that is, is an important
competence for companies which they should gain to achieve and maintain. The
competitors can be domestic as well as foreign; the competition might be indirect or
direct. (Karunakaran, K. 2008, 28; Worthington & Britton 1997, 9.) Markets as well
as companies can focus their strategies and planning on the competitors, for instance
what the competitors do or do not do (Stevens et al., 2012, 4).
24
Other stakeholders
Next to the above mentioned organizations and individuals companies have also
some stakeholders that are not that close to them but are influencers nonetheless.
These are government agencies, the local community, pressure groups, and the socie-
ty in general. (Palmer & Hartley 2002, 9-10.)
Microenvironment in the Finnish food industry and the food retail market
The microenvironment is directly or indirectly influencing companies. This part is
looking at the case of a company from Schleswig-Holstein that is interested in enter-
ing the Finnish market.
The direct customers for companies from Schleswig-Holstein are of course the im-
porters or the grocery trade groups. However, when looking at the definition above,
the end-consumers that eat the food products are the consumers. Furthermore, the
companies have to listen to them and their needs, if the consumers change their eat-
ing habits. If the consumers do not buy the products anymore, the companies also
lose their business partners as those do not want to purchase products they cannot
sell.
Suppliers can be very different. Some companies only need machines because they
grow and produce the food themselves while others also purchase cereals or fruits
from farmers and other ingredients to produce the end-product. The intermediaries
are the business customers. Those are the Finnish importers and the grocery trade
groups. They are dealing directly with the consumers because the consumers do not
want to buy every product directly from the different producers. Below is also ex-
plained that the Finns prefer buying everything from one store like hypermarkets.
The competitors are the other producers with their brands that produce the same kind
of products and aim with them for the same consumer groups. The names of the pro-
ducers and their brands that are available in the hyper- and supermarkets can be
found in chapter 5.2. Stakeholders are all organizations and individuals that are in-
volved or influenced in some way by companies and their business. The biggest
stakeholders are the Finnish and European authorities with their rules and regulations
concerning food production and retail.
25
3.3 Database
A database is a collection of customer data with all details. These are personal details
and contact data but also the sales history and all communication between the com-
pany and the customer. The data can be collected internally as well as externally.
(Tapp 2000, 21, 48.)
Databases need to be kept up-to-date all the time which means for companies that
they have to invest time and money to do so. Consumer data tends to change more
slowly than the data of business customers. Nevertheless, changes in addresses,
names or circumstances need to be updated. Data of business customers can change
up to 30% within one year because employees change their positions within a com-
pany or leave. It is also possible that a company simply goes out of business. (Tapp
2000, 41.)
Marketers need to consider the Data Protection Acts when using data or contacting
the customers. On an international level they have to be particularly careful as the
laws in countries differ from each other, especially in Europe. (Tapp 2000, 47-48.)
This bachelor’s thesis will not contain a database a company might have of its cus-
tomers. It is a collection of contact data of players in the Finnish food market as well
as of institutions and organizations that are working in the market too. The contact
data in the database (Chapter 6.6) was found on the websites and was publicly acces-
sible when the researcher collected the data. Furthermore, it was updated during the
thesis process and was up-to-date when the final thesis was handed in in the end of
September 2013.
The data in the database includes market players, institutions and organizations that
are currently active in the Finnish food market. Contact persons were deliberately left
out due to changes in companies and often it was not publicly accessible.
The database contains:
Name of company, organization, institution
Address(es)
Contact data (phone, email, website)
26
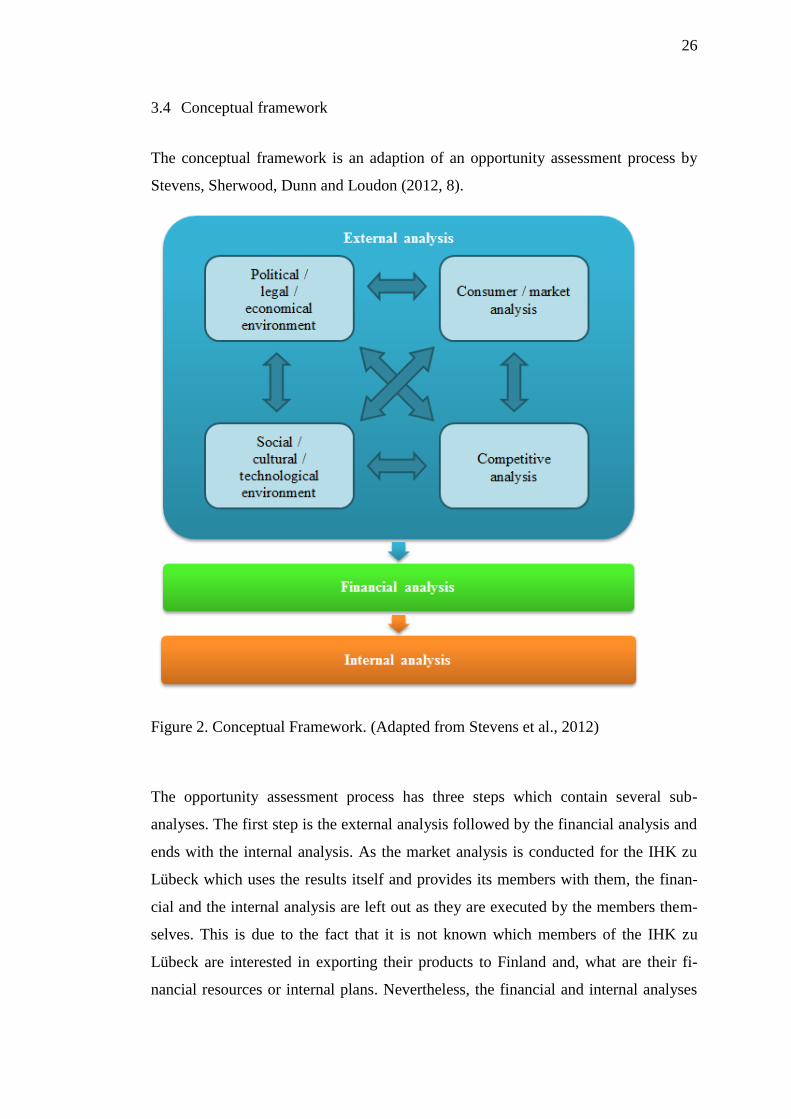
3.4 Conceptual framework
The conceptual framework is an adaption of an opportunity assessment process by
Stevens, Sherwood, Dunn and Loudon (2012, 8).
Figure 2. Conceptual Framework. (Adapted from Stevens et al., 2012)
The opportunity assessment process has three steps which contain several sub-
analyses. The first step is the external analysis followed by the financial analysis and
ends with the internal analysis. As the market analysis is conducted for the IHK zu
Lübeck which uses the results itself and provides its members with them, the finan-
cial and the internal analysis are left out as they are executed by the members them-
selves. This is due to the fact that it is not known which members of the IHK zu
Lübeck are interested in exporting their products to Finland and, what are their fi-
nancial resources or internal plans. Nevertheless, the financial and internal analyses
27
are part of an opportunity assessment process and so they are mentioned in the con-
ceptual framework but do not contain the sub-analyses.
In the external analysis there are four sub-analyses which all influence each other as
indicated by the arrows, e.g. the legal environment in a country or region affects the
competition by law.
Political / legal / economical environment: This analysis includes the political and
legal as well as the economic background of the target market, e.g. political stability,
governmental regulations, law or the economic situation.
Consumer / market analysis: The consumer as well as the market analysis is about
the market and the consumer in it, e.g. market size or buying behaviour.
Social / cultural / technological environment: This analysis includes the social and
cultural as well as the technological background of the target market, e.g. existing
technology or cultural and social aspects which need to be considered when entering
a new market.
Competitive analysis: The competitive analysis deals with the competition in the
market and the potential competitors that are already in the market.
28
4 PROJECT IMPLEMENTATION
This thesis was written between spring and autumn 2013. The consideration of a po-
tential topic by the researcher started in the beginning of the year but became more
concrete after a kick-off meeting with the marketing lecturer Kati Antola in the end
of April 2013. Shortly after, potential organizations were contacted to offer them a
bachelor’s thesis which would contain a market analysis as the main subject. The
chosen organization was the IHK zu Lübeck as already introduced in the introduction
and the background of this thesis.
In May was the first seminar in which the project plan for the thesis was presented.
For the project plan preliminary research was done to define the basics of the project
and to set up a time frame for different phases of the thesis. Right after finishing the
project plan the theory was gathered and research was started for the theoretical part
of the thesis. In the middle of June in the second seminar this part was presented. The
books used for the theoretical part were found in the SAMK library as well as online
from DawsonEra and Ebrary.
After the theoretical part of this bachelor’s thesis followed the application of the
knowledge to the chosen case. The data collection for the market analysis was divid-
ed into two parts. On the one hand there was qualitative research for the primary data
which was done by depth interviews. On the other hand secondary data was used
which was found online for amongst others in statistical databases or in Emerald – a
database for articles – provided by the interviewees and found in books. This type of
data collection was chosen because it is a good combination of the use of previously
collected data and new data focused specially on the topic of this thesis. However,
the holiday season in Finland in July affected the planning of the interviews so that
they were conducted in the end of July and the beginning of August which extended
the writing process for approximately one month.
Interviews for this bachelor’s thesis could be arranged with Kari Luoto who is the
managing director of the Finnish Grocery Trade Association, Heli Tammivuori who
is a director (commercial policy) in the Finnish Food and Drink Industries' Federa-
29
tion as well as with Esa Wrang who works for Finpro and is an expert on the food
industry. The interview questions can be found in Appendix 2. However, they were
slightly adjusted for every interviewee.
After the interviews the answers were analysed and compared. In some parts they
differed while in other parts the experts agreed with each other. Based on the inter-
views and the secondary data the market analysis was done and written. During this
phase, a change of supervisors occurred, howsoever it did not influence the writing
process. However, due to some discrepancy between the theoretical and the practical
part, some of the theory which was not applied in the latter part was deleted and re-
placed by valid theory. In the middle of September the third seminar followed in
which the thesis was presented as a whole with a focus on the practical part. In the
end of September 2013 the final version of the thesis was handed in and afterwards it
was sent to the client, the IHK zu Lübeck.
30
5 PRODUCTS AND COMPANIES
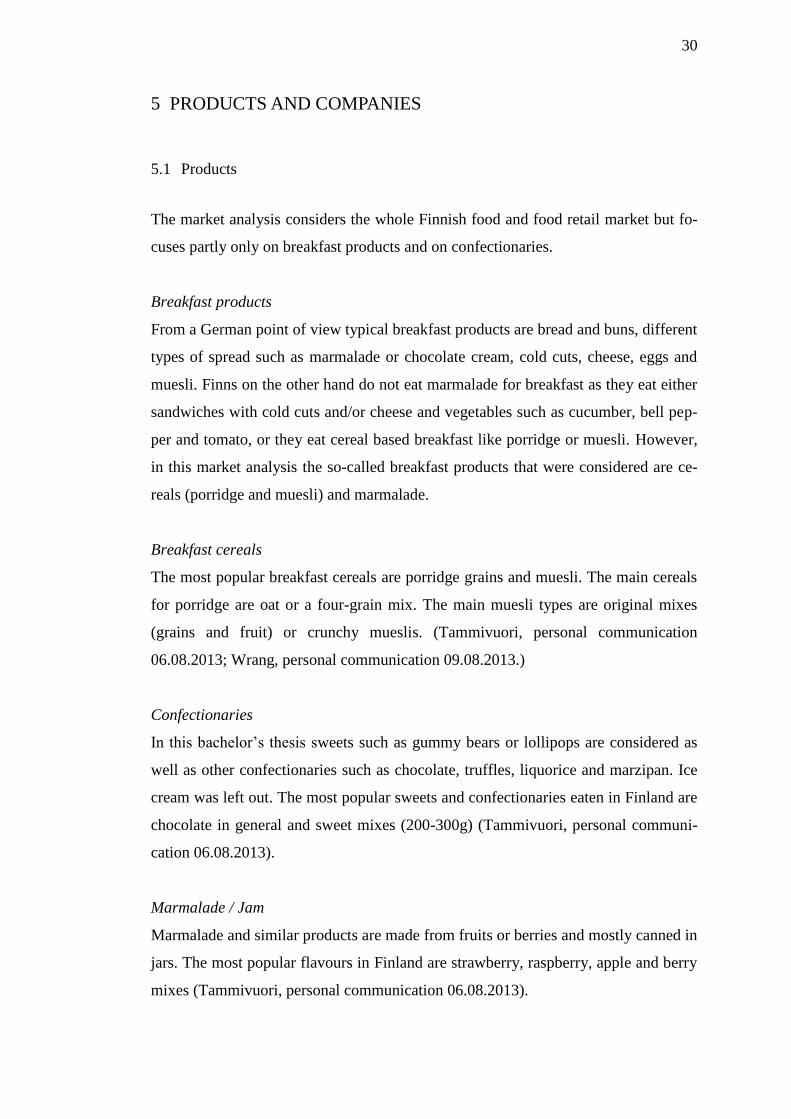
5.1 Products
The market analysis considers the whole Finnish food and food retail market but fo-
cuses partly only on breakfast products and on confectionaries.
Breakfast products
From a German point of view typical breakfast products are bread and buns, different
types of spread such as marmalade or chocolate cream, cold cuts, cheese, eggs and
muesli. Finns on the other hand do not eat marmalade for breakfast as they eat either
sandwiches with cold cuts and/or cheese and vegetables such as cucumber, bell pep-
per and tomato, or they eat cereal based breakfast like porridge or muesli. However,
in this market analysis the so-called breakfast products that were considered are ce-
reals (porridge and muesli) and marmalade.
Breakfast cereals
The most popular breakfast cereals are porridge grains and muesli. The main cereals
for porridge are oat or a four-grain mix. The main muesli types are original mixes
(grains and fruit) or crunchy mueslis. (Tammivuori, personal communication
06.08.2013; Wrang, personal communication 09.08.2013.)
Confectionaries
In this bachelor’s thesis sweets such as gummy bears or lollipops are considered as
well as other confectionaries such as chocolate, truffles, liquorice and marzipan. Ice
cream was left out. The most popular sweets and confectionaries eaten in Finland are
chocolate in general and sweet mixes (200-300g) (Tammivuori, personal communi-
cation 06.08.2013).
Marmalade / Jam
Marmalade and similar products are made from fruits or berries and mostly canned in
jars. The most popular flavours in Finland are strawberry, raspberry, apple and berry
mixes (Tammivuori, personal communication 06.08.2013).
31
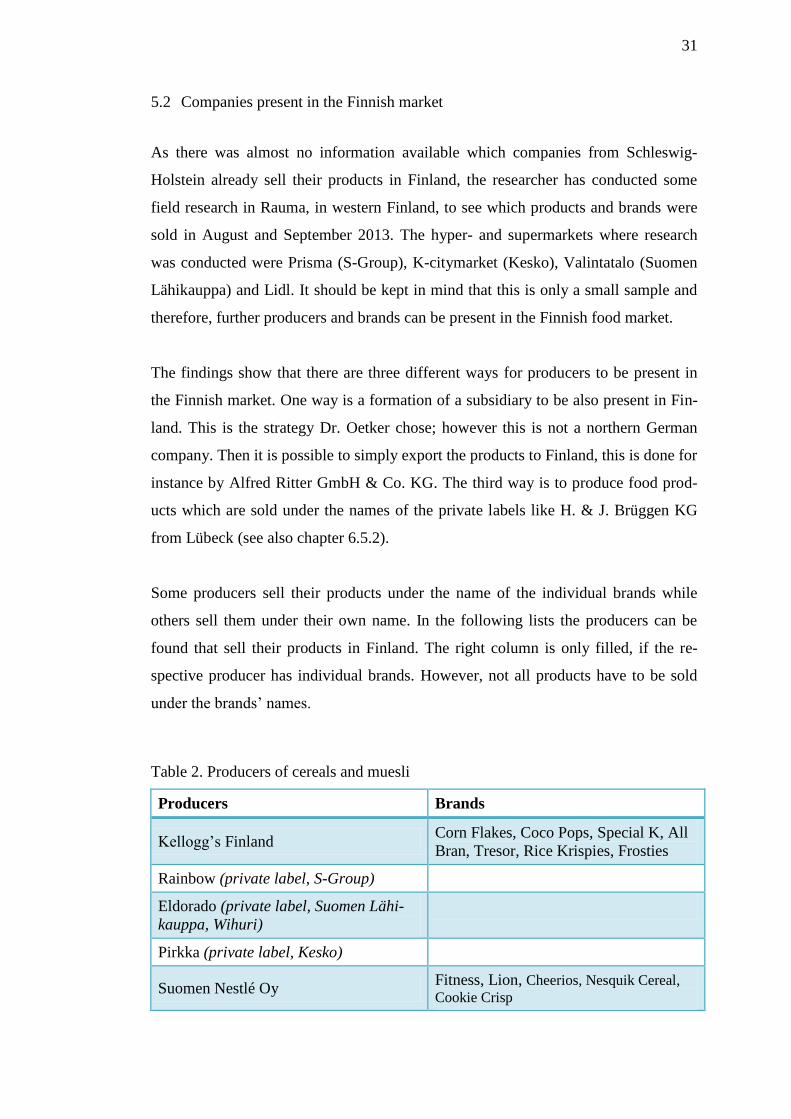
5.2 Companies present in the Finnish market
As there was almost no information available which companies from Schleswig-
Holstein already sell their products in Finland, the researcher has conducted some
field research in Rauma, in western Finland, to see which products and brands were
sold in August and September 2013. The hyper- and supermarkets where research
was conducted were Prisma (S-Group), K-citymarket (Kesko), Valintatalo (Suomen
Lähikauppa) and Lidl. It should be kept in mind that this is only a small sample and
therefore, further producers and brands can be present in the Finnish food market.
The findings show that there are three different ways for producers to be present in
the Finnish market. One way is a formation of a subsidiary to be also present in Fin-
land. This is the strategy Dr. Oetker chose; however this is not a northern German
company. Then it is possible to simply export the products to Finland, this is done for
instance by Alfred Ritter GmbH & Co. KG. The third way is to produce food prod-
ucts which are sold under the names of the private labels like H. & J. Brüggen KG
from Lübeck (see also chapter 6.5.2).
Some producers sell their products under the name of the individual brands while
others sell them under their own name. In the following lists the producers can be
found that sell their products in Finland. The right column is only filled, if the re-
spective producer has individual brands. However, not all products have to be sold
under the brands’ names.
Table 2. Producers of cereals and muesli
Producers Brands
Kellogg’s Finland Corn Flakes, Coco Pops, Special K, All
Bran, Tresor, Rice Krispies, Frosties
Rainbow (private label, S-Group)
Eldorado (private label, Suomen Lähi-
kauppa, Wihuri)
Pirkka (private label, Kesko)
Suomen Nestlé Oy Fitness, Lion, Cheerios, Nesquik Cereal,
Cookie Crisp
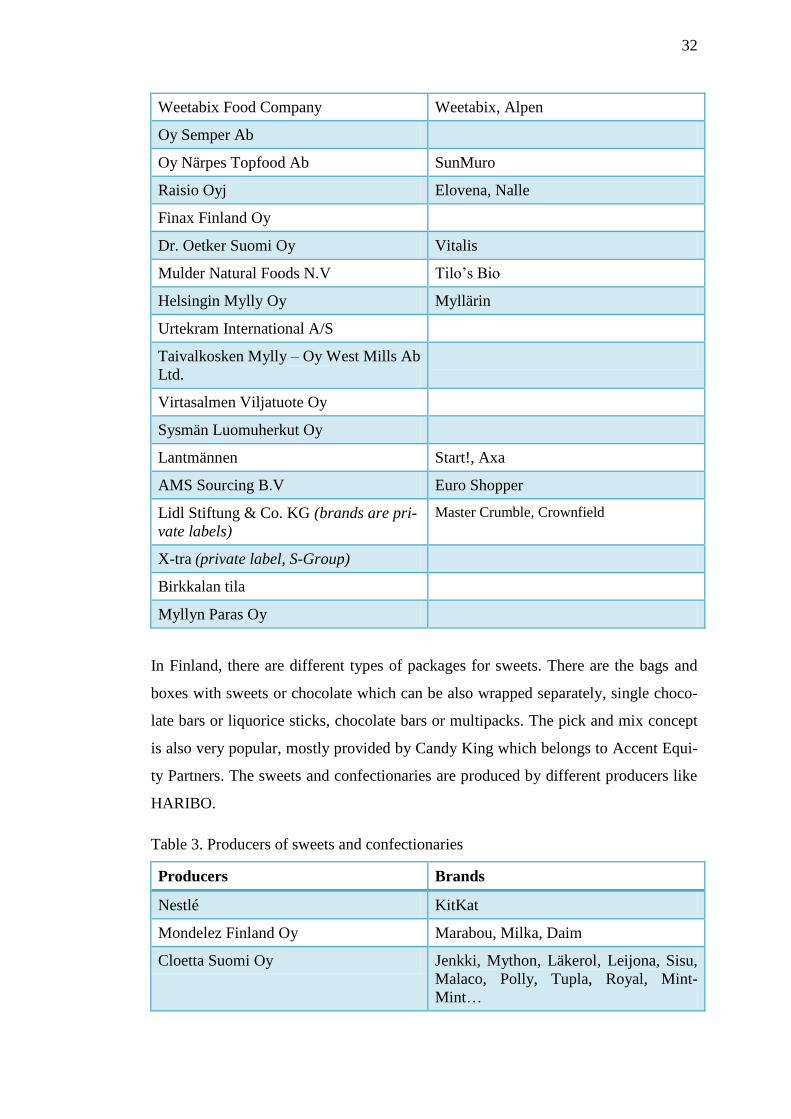
32
Weetabix Food Company Weetabix, Alpen
Oy Semper Ab
Oy Närpes Topfood Ab SunMuro
Raisio Oyj Elovena, Nalle
Finax Finland Oy
Dr. Oetker Suomi Oy Vitalis
Mulder Natural Foods N.V Tilo’s Bio
Helsingin Mylly Oy Myllärin
Urtekram International A/S
Taivalkosken Mylly – Oy West Mills Ab
Ltd.
Virtasalmen Viljatuote Oy
Sysmän Luomuherkut Oy
Lantmännen Start!, Axa
AMS Sourcing B.V Euro Shopper
Lidl Stiftung & Co. KG (brands are pri-
vate labels)
Master Crumble, Crownfield
X-tra (private label, S-Group)
Birkkalan tila
Myllyn Paras Oy
In Finland, there are different types of packages for sweets. There are the bags and
boxes with sweets or chocolate which can be also wrapped separately, single choco-
late bars or liquorice sticks, chocolate bars or multipacks. The pick and mix concept
is also very popular, mostly provided by Candy King which belongs to Accent Equi-
ty Partners. The sweets and confectionaries are produced by different producers like
HARIBO.
Table 3. Producers of sweets and confectionaries
Producers Brands
Nestlé KitKat
Mondelez Finland Oy Marabou, Milka, Daim
Cloetta Suomi Oy Jenkki, Mython, Läkerol, Leijona, Sisu,
Malaco, Polly, Tupla, Royal, Mint-
Mint…
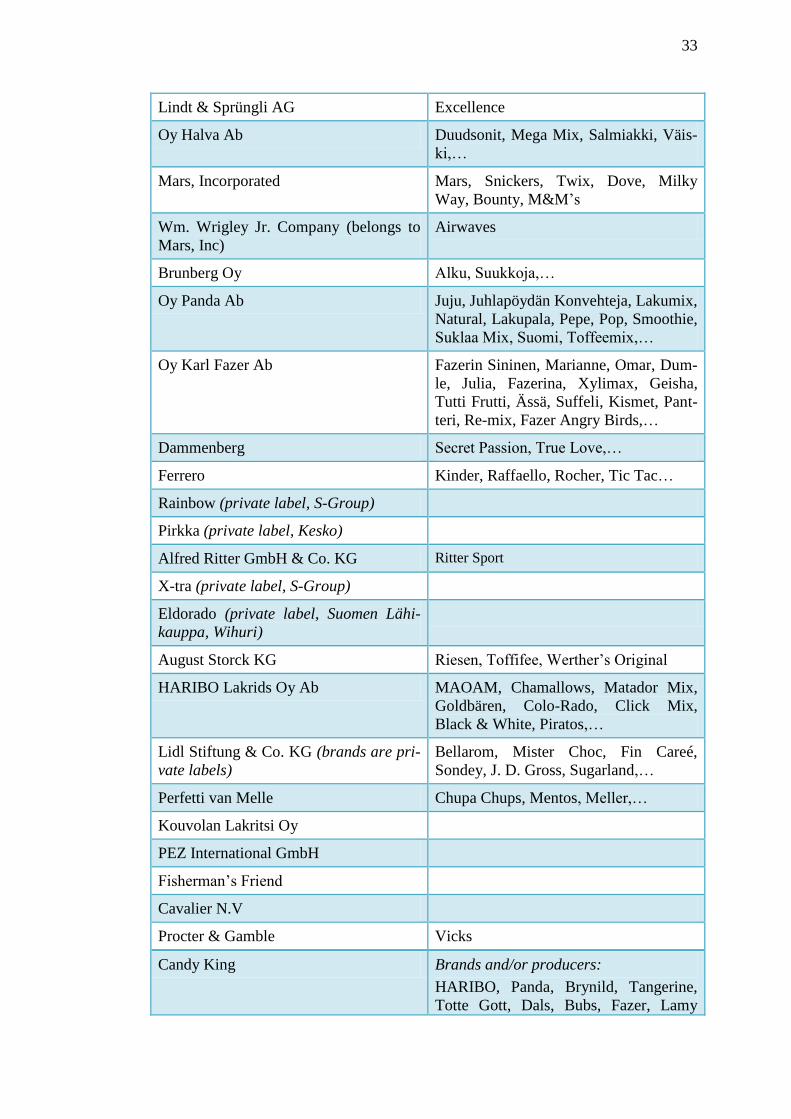
33
Lindt & Sprüngli AG Excellence
Oy Halva Ab Duudsonit, Mega Mix, Salmiakki, Väis-
ki,…
Mars, Incorporated Mars, Snickers, Twix, Dove, Milky
Way, Bounty, M&M’s
Wm. Wrigley Jr. Company (belongs to
Mars, Inc)
Airwaves
Brunberg Oy Alku, Suukkoja,…
Oy Panda Ab Juju, Juhlapöydän Konvehteja, Lakumix,
Natural, Lakupala, Pepe, Pop, Smoothie,
Suklaa Mix, Suomi, Toffeemix,…
Oy Karl Fazer Ab Fazerin Sininen, Marianne, Omar, Dum-
le, Julia, Fazerina, Xylimax, Geisha,
Tutti Frutti, Ässä, Suffeli, Kismet, Pant-
teri, Re-mix, Fazer Angry Birds,…
Dammenberg Secret Passion, True Love,…
Ferrero Kinder, Raffaello, Rocher, Tic Tac…
Rainbow (private label, S-Group)
Pirkka (private label, Kesko)
Alfred Ritter GmbH & Co. KG Ritter Sport
X-tra (private label, S-Group)
Eldorado (private label, Suomen Lähi-
kauppa, Wihuri)
August Storck KG Riesen, Toffifee, Werther’s Original
HARIBO Lakrids Oy Ab MAOAM, Chamallows, Matador Mix,
Goldbären, Colo-Rado, Click Mix,
Black & White, Piratos,…
Lidl Stiftung & Co. KG (brands are pri-
vate labels)
Bellarom, Mister Choc, Fin Careé,
Sondey, J. D. Gross, Sugarland,…
Perfetti van Melle Chupa Chups, Mentos, Meller,…
Kouvolan Lakritsi Oy
PEZ International GmbH
Fisherman’s Friend
Cavalier N.V
Procter & Gamble Vicks
Candy King Brands and/or producers:
HARIBO, Panda, Brynild, Tangerine,
Totte Gott, Dals, Bubs, Fazer, Lamy

34
Lutti, Astra Sweets, Cadbury, Halva,
Malaco, Matthijs, Lonka, Candy Land,
Sila Gum,…
Karkkikatu Oy (belongs to Cloetta)
The marmalades and jams are mainly produced by Finnish companies in Finland.
Due to the natural environment several types of berries grow well from the south to
the north of the country. Thus, there is no need to import berries and also some of the
jams and marmalades for the private labels are produced in Finland.
Table 4. Producers of jam and marmalade
Producers Brands
Saarioinen Oy Dronningholm
Marjajaloste Meritalo Oy
Herkkumaa Oy
Fine Foods Oy Ltd St Dalfour, Mackays, Jam It!
Felix Abba Oy Ab Ekströms
Oy Roberts Ab
AMS Sourcing B.V Euro Shopper
Riitan Herkku Oy
Zentis
Lidl Stiftung & Co. KG (brands are pri-
vate labels)
Maribel
Rainbow (private label, S-Group)
Pirkka (private label, Kesko)
X-tra (private label, S-Group)
Eldorado (private label, Suomen Lähi-
kauppa, Wihuri)
While it is possible for Finnish customers to buy several different brands which are
extended with the private labels in the stores of the three biggest grocery trade
groups, Lidl is selling mainly private labels.
35
6 MARKET ANALYSIS
6.1 Target market
The target market for the food products from Schleswig-Holstein is Finland. This
chapter 6.1 will introduce Finland briefly as well as its food market and the economic
relationship between Finland and Schleswig-Holstein.
6.1.1 Finland as target market
Political background
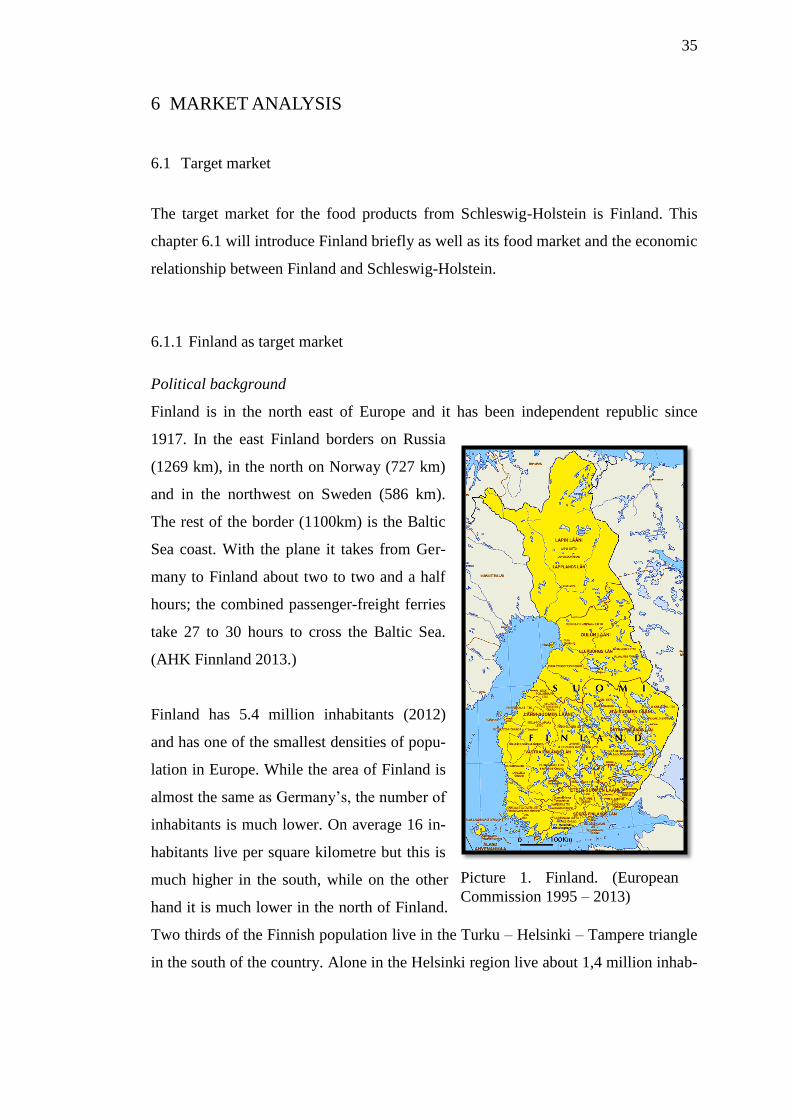
Finland is in the north east of Europe and it has been independent republic since
1917. In the east Finland borders on Russia
(1269 km), in the north on Norway (727 km)
and in the northwest on Sweden (586 km).
The rest of the border (1100km) is the Baltic
Sea coast. With the plane it takes from Ger-
many to Finland about two to two and a half
hours; the combined passenger-freight ferries
take 27 to 30 hours to cross the Baltic Sea.
(AHK Finnland 2013.)
Finland has 5.4 million inhabitants (2012)
and has one of the smallest densities of popu-
lation in Europe. While the area of Finland is
almost the same as Germany’s, the number of
inhabitants is much lower. On average 16 in-
habitants live per square kilometre but this is
much higher in the south, while on the other
hand it is much lower in the north of Finland.
Two thirds of the Finnish population live in the Turku – Helsinki – Tampere triangle
in the south of the country. Alone in the Helsinki region live about 1,4 million inhab-
Picture 1. Finland. (European
Commission 1995 – 2013)
36
itants. (AHK Finland 2013; GTAI 2013; Population and population changes by ma-
jor region, region and sub-regional unit, 2011 2012, 74.)
Finland is a parliamentary republic which is governed by a six party coalition under
the prime minister (pääministeri) Jyrki Katainen from the National Coalition Party
(Kokoomus) since 2011. The other parties of the coalition are the Finnish Social
Democratic Party (SDP), the Left-Wing Alliance (Vasemmistoliito), the Green
League (Vihreäliitto), the Christian Democrats (Kristillisdemokraatit) and the Swe-
dish People's Party in Finland (RKP). (AHK Finnland 2013.)
The president of Finland is Sauli Niinistö (presidentti) who is in his first term in of-
fice since the beginning of 2012.
Finland has been a member of the European Union (EU) since 1995. Furthermore,
the republic is a member of the WTO, OECD, WTO, Council of the Baltic Sea States
and the UN. As in Germany, the currency in Finland is the euro. (GTAI 2013.)
Finland is bilingual and has two official languages – Finnish and Swedish. Six per
cent of the Finnish population speak Swedish as their mother tongue. Nevertheless,
in business life also English is used. (AHK Finnland 2013; GTAI 2013.)
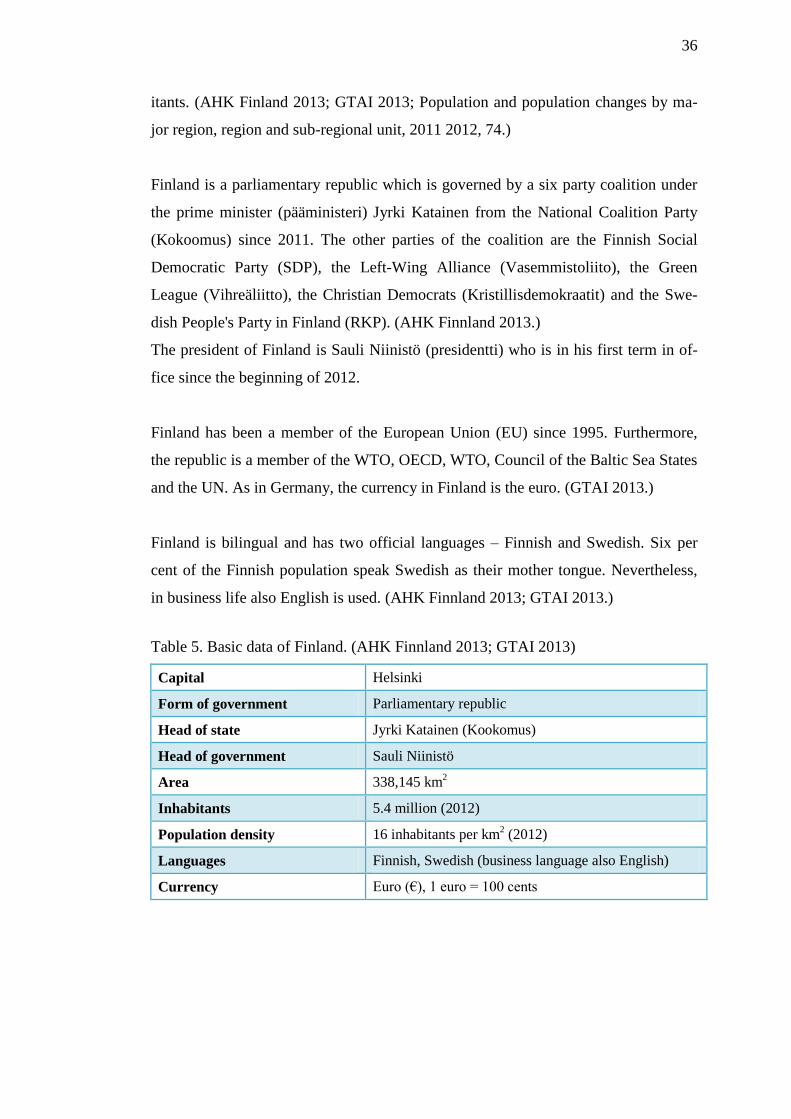
Table 5. Basic data of Finland. (AHK Finnland 2013; GTAI 2013)
Capital Helsinki
Form of government Parliamentary republic
Head of state Jyrki Katainen (Kookomus)
Head of government Sauli Niinistö
Area 338,145 km2
Inhabitants 5.4 million (2012)
Population density 16 inhabitants per km2 (2012)
Languages Finnish, Swedish (business language also English)
Currency Euro (€), 1 euro = 100 cents
37
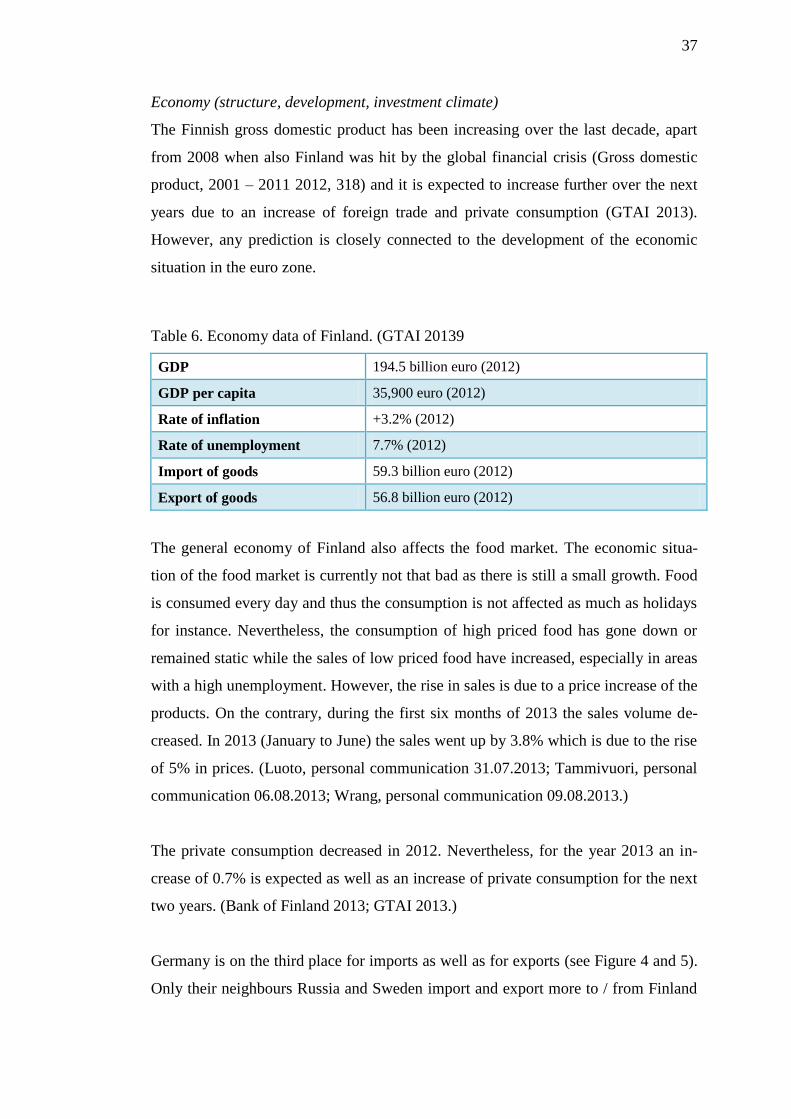
Economy (structure, development, investment climate)
The Finnish gross domestic product has been increasing over the last decade, apart
from 2008 when also Finland was hit by the global financial crisis (Gross domestic
product, 2001 – 2011 2012, 318) and it is expected to increase further over the next
years due to an increase of foreign trade and private consumption (GTAI 2013).
However, any prediction is closely connected to the development of the economic
situation in the euro zone.
Table 6. Economy data of Finland. (GTAI 20139
GDP 194.5 billion euro (2012)
GDP per capita 35,900 euro (2012)
Rate of inflation +3.2% (2012)
Rate of unemployment 7.7% (2012)
Import of goods 59.3 billion euro (2012)
Export of goods 56.8 billion euro (2012)
The general economy of Finland also affects the food market. The economic situa-
tion of the food market is currently not that bad as there is still a small growth. Food
is consumed every day and thus the consumption is not affected as much as holidays
for instance. Nevertheless, the consumption of high priced food has gone down or
remained static while the sales of low priced food have increased, especially in areas
with a high unemployment. However, the rise in sales is due to a price increase of the
products. On the contrary, during the first six months of 2013 the sales volume de-
creased. In 2013 (January to June) the sales went up by 3.8% which is due to the rise
of 5% in prices. (Luoto, personal communication 31.07.2013; Tammivuori, personal
communication 06.08.2013; Wrang, personal communication 09.08.2013.)
The private consumption decreased in 2012. Nevertheless, for the year 2013 an in-
crease of 0.7% is expected as well as an increase of private consumption for the next
two years. (Bank of Finland 2013; GTAI 2013.)
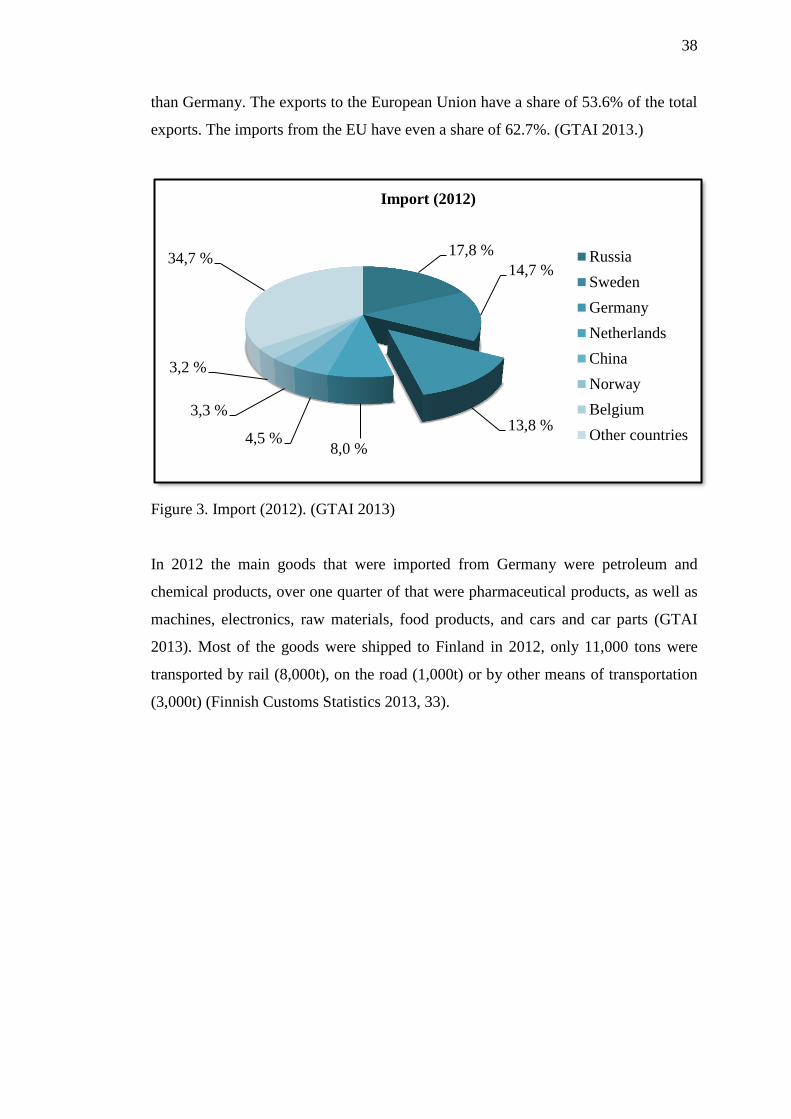
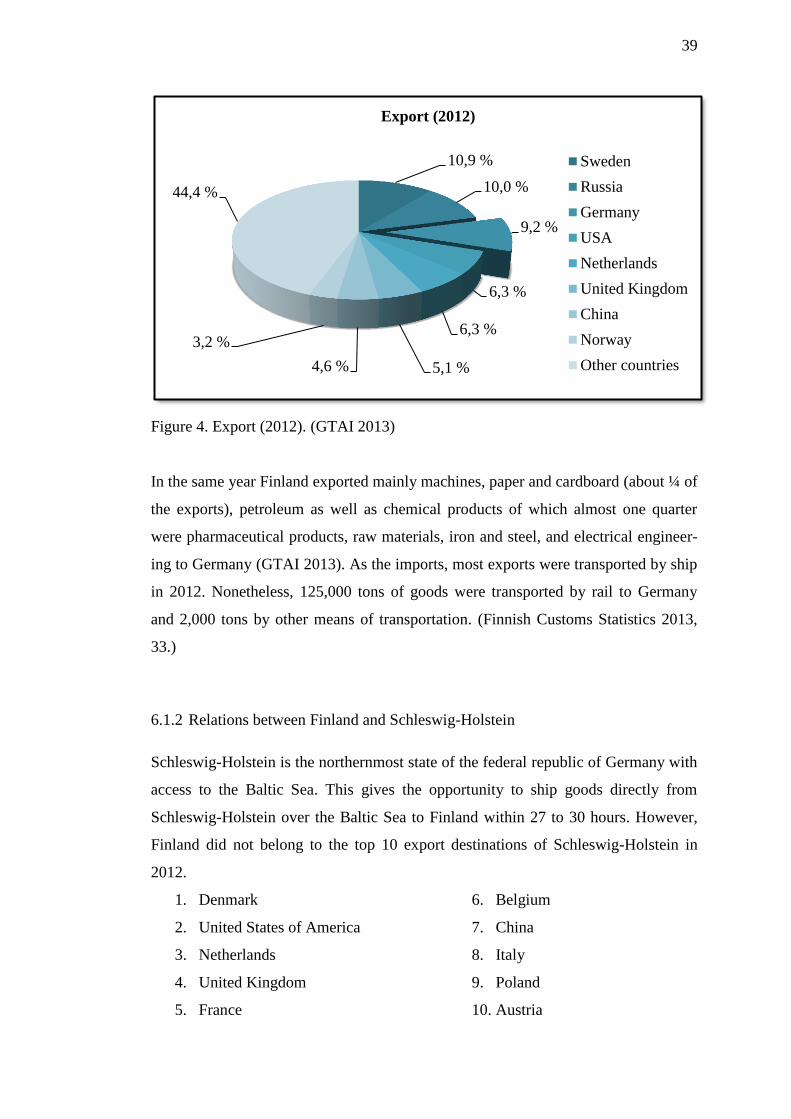
Germany is on the third place for imports as well as for exports (see Figure 4 and 5).
Only their neighbours Russia and Sweden import and export more to / from Finland
38
than Germany. The exports to the European Union have a share of 53.6% of the total
exports. The imports from the EU have even a share of 62.7%. (GTAI 2013.)
Figure 3. Import (2012). (GTAI 2013)
In 2012 the main goods that were imported from Germany were petroleum and
chemical products, over one quarter of that were pharmaceutical products, as well as
machines, electronics, raw materials, food products, and cars and car parts (GTAI
2013). Most of the goods were shipped to Finland in 2012, only 11,000 tons were
transported by rail (8,000t), on the road (1,000t) or by other means of transportation
(3,000t) (Finnish Customs Statistics 2013, 33).
17,8 %
14,7 %
13,8 %
8,0 % 4,5 %
3,3 %
3,2 %
34,7 %
Import (2012)
Russia
Sweden
Germany
Netherlands
China
Norway
Belgium
Other countries
39
Figure 4. Export (2012). (GTAI 2013)
In the same year Finland exported mainly machines, paper and cardboard (about ¼ of
the exports), petroleum as well as chemical products of which almost one quarter
were pharmaceutical products, raw materials, iron and steel, and electrical engineer-
ing to Germany (GTAI 2013). As the imports, most exports were transported by ship
in 2012. Nonetheless, 125,000 tons of goods were transported by rail to Germany
and 2,000 tons by other means of transportation. (Finnish Customs Statistics 2013,
33.)
6.1.2 Relations between Finland and Schleswig-Holstein
Schleswig-Holstein is the northernmost state of the federal republic of Germany with
access to the Baltic Sea. This gives the opportunity to ship goods directly from
Schleswig-Holstein over the Baltic Sea to Finland within 27 to 30 hours. However,
Finland did not belong to the top 10 export destinations of Schleswig-Holstein in
2012.
1. Denmark
2. United States of America
3. Netherlands
4. United Kingdom
5. France
6. Belgium
7. China
8. Italy
9. Poland
10. Austria
10,9 %
10,0 %
9,2 %
6,3 %
6,3 %
5,1 % 4,6 %
3,2 %
44,4 %
Export (2012)
Sweden
Russia
Germany
USA
Netherlands
United Kingdom
China
Norway
Other countries
40
(Statistisches Amt für Hamburg und Schleswig-Holstein 2013.)
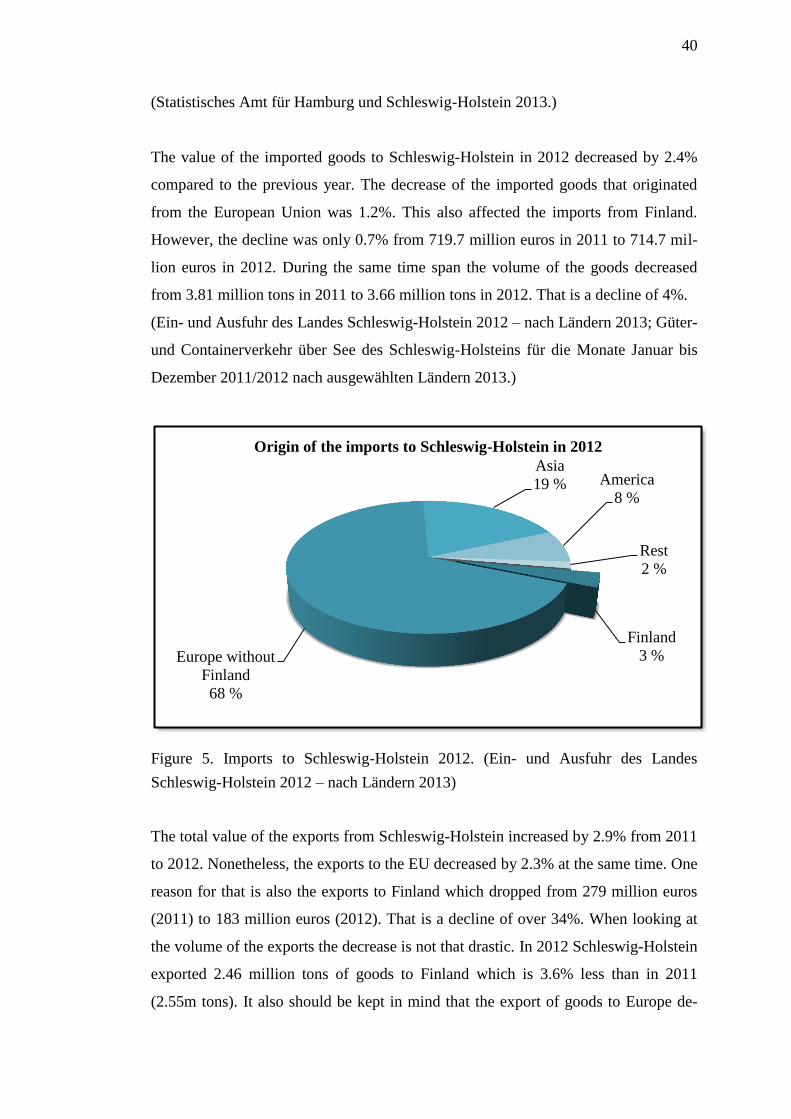
The value of the imported goods to Schleswig-Holstein in 2012 decreased by 2.4%
compared to the previous year. The decrease of the imported goods that originated
from the European Union was 1.2%. This also affected the imports from Finland.
However, the decline was only 0.7% from 719.7 million euros in 2011 to 714.7 mil-
lion euros in 2012. During the same time span the volume of the goods decreased
from 3.81 million tons in 2011 to 3.66 million tons in 2012. That is a decline of 4%.
(Ein- und Ausfuhr des Landes Schleswig-Holstein 2012 – nach Ländern 2013; Güter-
und Containerverkehr über See des Schleswig-Holsteins für die Monate Januar bis
Dezember 2011/2012 nach ausgewählten Ländern 2013.)
Figure 5. Imports to Schleswig-Holstein 2012. (Ein- und Ausfuhr des Landes
Schleswig-Holstein 2012 – nach Ländern 2013)
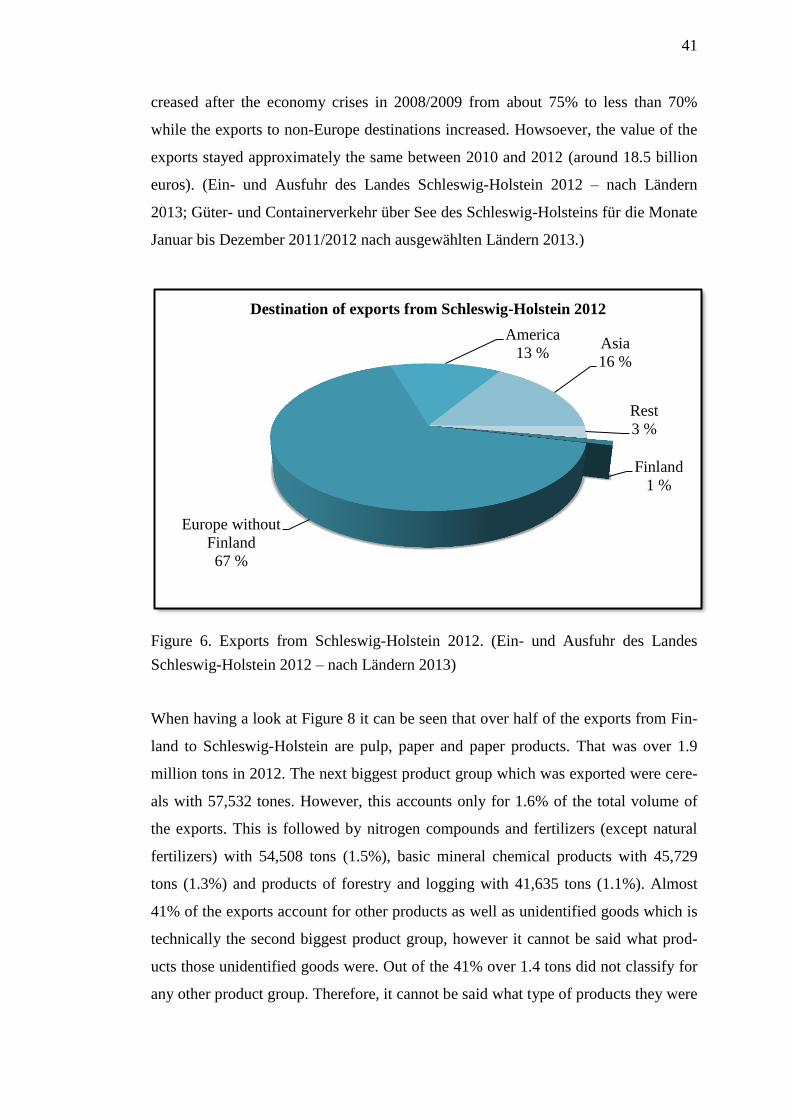
The total value of the exports from Schleswig-Holstein increased by 2.9% from 2011
to 2012. Nonetheless, the exports to the EU decreased by 2.3% at the same time. One
reason for that is also the exports to Finland which dropped from 279 million euros
(2011) to 183 million euros (2012). That is a decline of over 34%. When looking at
the volume of the exports the decrease is not that drastic. In 2012 Schleswig-Holstein
exported 2.46 million tons of goods to Finland which is 3.6% less than in 2011
(2.55m tons). It also should be kept in mind that the export of goods to Europe de-
Finland
3 % Europe without
Finland
68 %
Asia
19 % America
8 %
Rest
2 %
Origin of the imports to Schleswig-Holstein in 2012
41
creased after the economy crises in 2008/2009 from about 75% to less than 70%
while the exports to non-Europe destinations increased. Howsoever, the value of the
exports stayed approximately the same between 2010 and 2012 (around 18.5 billion
euros). (Ein- und Ausfuhr des Landes Schleswig-Holstein 2012 – nach Ländern
2013; Güter- und Containerverkehr über See des Schleswig-Holsteins für die Monate
Januar bis Dezember 2011/2012 nach ausgewählten Ländern 2013.)
Figure 6. Exports from Schleswig-Holstein 2012. (Ein- und Ausfuhr des Landes
Schleswig-Holstein 2012 – nach Ländern 2013)
When having a look at Figure 8 it can be seen that over half of the exports from Fin-
land to Schleswig-Holstein are pulp, paper and paper products. That was over 1.9
million tons in 2012. The next biggest product group which was exported were cere-
als with 57,532 tones. However, this accounts only for 1.6% of the total volume of
the exports. This is followed by nitrogen compounds and fertilizers (except natural
fertilizers) with 54,508 tons (1.5%), basic mineral chemical products with 45,729
tons (1.3%) and products of forestry and logging with 41,635 tons (1.1%). Almost
41% of the exports account for other products as well as unidentified goods which is
technically the second biggest product group, however it cannot be said what prod-
ucts those unidentified goods were. Out of the 41% over 1.4 tons did not classify for
any other product group. Therefore, it cannot be said what type of products they were
Finland
1 %
Europe without
Finland
67 %
America
13 % Asia
16 %
Rest
3 %
Destination of exports from Schleswig-Holstein 2012
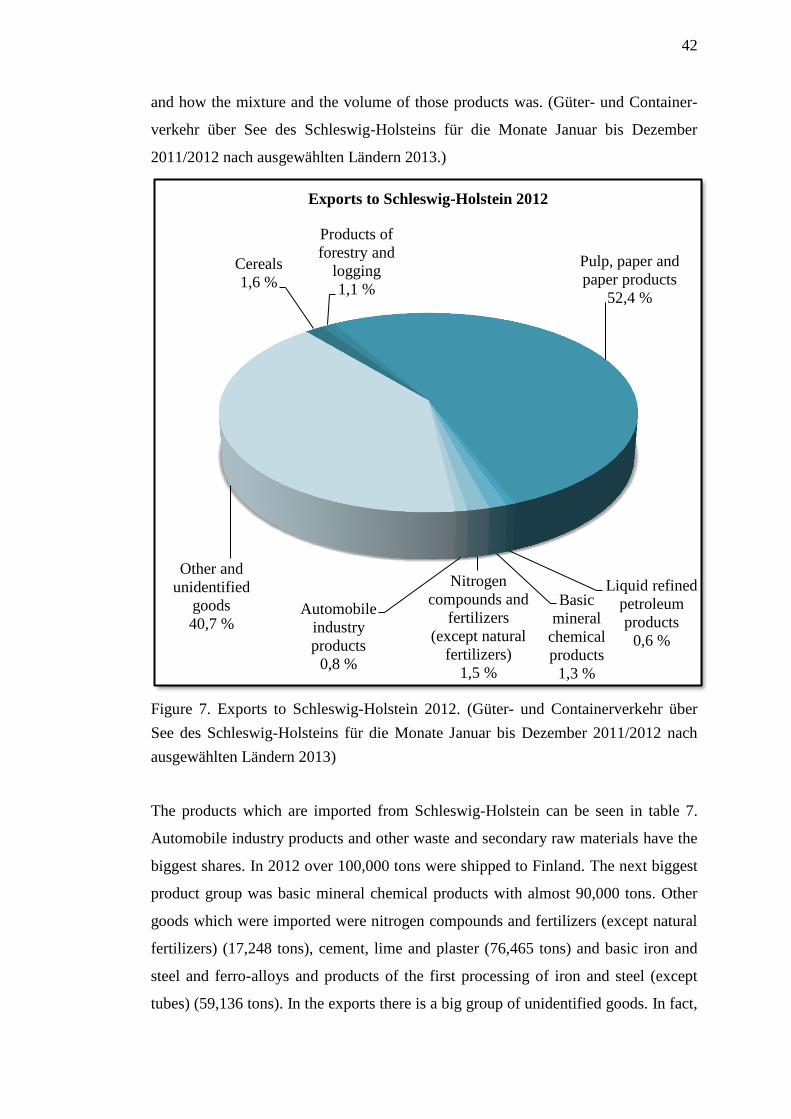
42
and how the mixture and the volume of those products was. (Güter- und Container-
verkehr über See des Schleswig-Holsteins für die Monate Januar bis Dezember
2011/2012 nach ausgewählten Ländern 2013.)
Figure 7. Exports to Schleswig-Holstein 2012. (Güter- und Containerverkehr über
See des Schleswig-Holsteins für die Monate Januar bis Dezember 2011/2012 nach
ausgewählten Ländern 2013)
The products which are imported from Schleswig-Holstein can be seen in table 7.
Automobile industry products and other waste and secondary raw materials have the
biggest shares. In 2012 over 100,000 tons were shipped to Finland. The next biggest
product group was basic mineral chemical products with almost 90,000 tons. Other
goods which were imported were nitrogen compounds and fertilizers (except natural
fertilizers) (17,248 tons), cement, lime and plaster (76,465 tons) and basic iron and
steel and ferro-alloys and products of the first processing of iron and steel (except
tubes) (59,136 tons). In the exports there is a big group of unidentified goods. In fact,
Cereals
1,6 %
Products of
forestry and
logging
1,1 %
Pulp, paper and
paper products
52,4 %
Liquid refined
petroleum
products
0,6 %
Basic
mineral
chemical
products
1,3 %
Nitrogen
compounds and
fertilizers
(except natural
fertilizers)
1,5 %
Automobile
industry
products
0,8 %
Other and
unidentified
goods
40,7 %
Exports to Schleswig-Holstein 2012
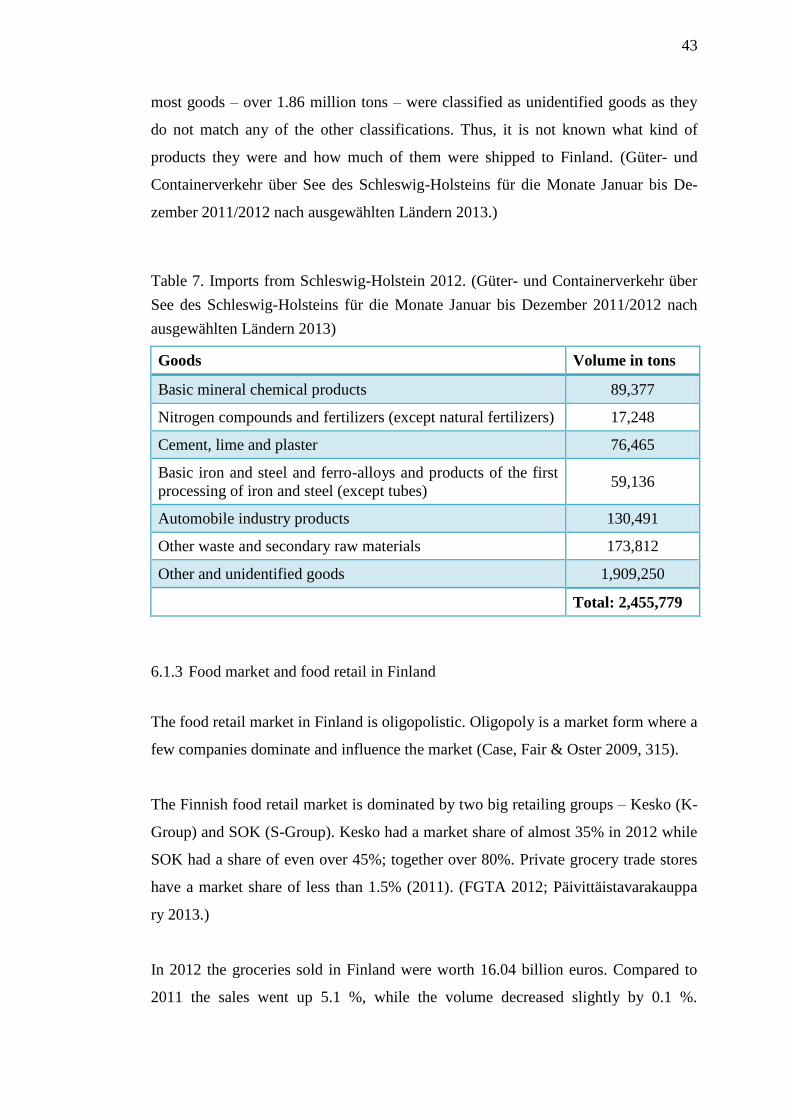
43
most goods – over 1.86 million tons – were classified as unidentified goods as they
do not match any of the other classifications. Thus, it is not known what kind of
products they were and how much of them were shipped to Finland. (Güter- und
Containerverkehr über See des Schleswig-Holsteins für die Monate Januar bis De-
zember 2011/2012 nach ausgewählten Ländern 2013.)
Table 7. Imports from Schleswig-Holstein 2012. (Güter- und Containerverkehr über
See des Schleswig-Holsteins für die Monate Januar bis Dezember 2011/2012 nach
ausgewählten Ländern 2013)
Goods Volume in tons
Basic mineral chemical products 89,377
Nitrogen compounds and fertilizers (except natural fertilizers) 17,248
Cement, lime and plaster 76,465
Basic iron and steel and ferro-alloys and products of the first
processing of iron and steel (except tubes) 59,136
Automobile industry products 130,491
Other waste and secondary raw materials 173,812
Other and unidentified goods 1,909,250
Total: 2,455,779
6.1.3 Food market and food retail in Finland
The food retail market in Finland is oligopolistic. Oligopoly is a market form where a
few companies dominate and influence the market (Case, Fair & Oster 2009, 315).
The Finnish food retail market is dominated by two big retailing groups – Kesko (K-
Group) and SOK (S-Group). Kesko had a market share of almost 35% in 2012 while
SOK had a share of even over 45%; together over 80%. Private grocery trade stores
have a market share of less than 1.5% (2011). (FGTA 2012; Päivittäistavarakauppa
ry 2013.)
In 2012 the groceries sold in Finland were worth 16.04 billion euros. Compared to
2011 the sales went up 5.1 %, while the volume decreased slightly by 0.1 %.
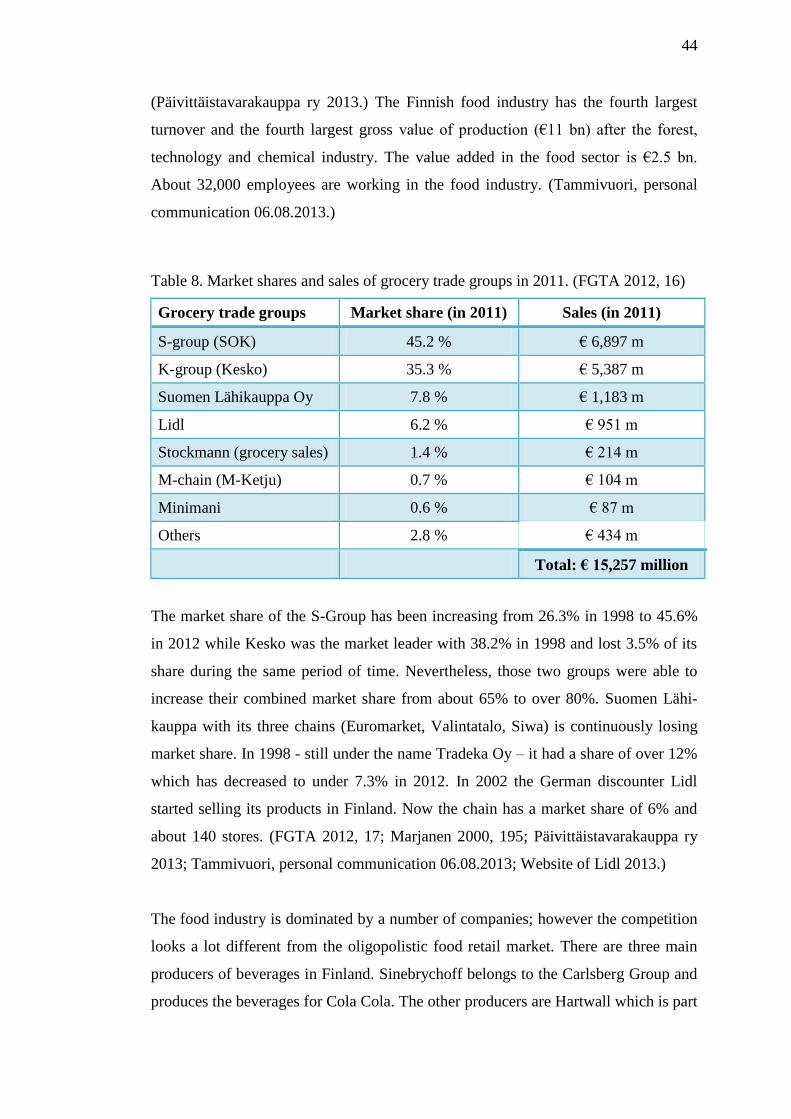
44
(Päivittäistavarakauppa ry 2013.) The Finnish food industry has the fourth largest
turnover and the fourth largest gross value of production (€11 bn) after the forest,
technology and chemical industry. The value added in the food sector is €2.5 bn.
About 32,000 employees are working in the food industry. (Tammivuori, personal
communication 06.08.2013.)
Table 8. Market shares and sales of grocery trade groups in 2011. (FGTA 2012, 16)
Grocery trade groups Market share (in 2011) Sales (in 2011)
S-group (SOK) 45.2 % € 6,897 m
K-group (Kesko) 35.3 % € 5,387 m
Suomen Lähikauppa Oy 7.8 % € 1,183 m
Lidl 6.2 % € 951 m
Stockmann (grocery sales) 1.4 % € 214 m
M-chain (M-Ketju) 0.7 % € 104 m
Minimani 0.6 % € 87 m
Others 2.8 % € 434 m
Total: € 15,257 million
The market share of the S-Group has been increasing from 26.3% in 1998 to 45.6%
in 2012 while Kesko was the market leader with 38.2% in 1998 and lost 3.5% of its
share during the same period of time. Nevertheless, those two groups were able to
increase their combined market share from about 65% to over 80%. Suomen Lähi-
kauppa with its three chains (Euromarket, Valintatalo, Siwa) is continuously losing
market share. In 1998 - still under the name Tradeka Oy – it had a share of over 12%
which has decreased to under 7.3% in 2012. In 2002 the German discounter Lidl
started selling its products in Finland. Now the chain has a market share of 6% and
about 140 stores. (FGTA 2012, 17; Marjanen 2000, 195; Päivittäistavarakauppa ry
2013; Tammivuori, personal communication 06.08.2013; Website of Lidl 2013.)
The food industry is dominated by a number of companies; however the competition
looks a lot different from the oligopolistic food retail market. There are three main
producers of beverages in Finland. Sinebrychoff belongs to the Carlsberg Group and
produces the beverages for Cola Cola. The other producers are Hartwall which is part
45
of the Heineken Group and Olvi. The two main bakeries in Finland are Vaasan &
Vaasan Oy and Fazer Leipomot Oy. Next to bread and other bakery products Fazer
also produces chocolate and sweets. The three main producers of meat products are
Atria, HK and Saarioinen. The latter one also produces jams and marmalade. The
dairy industry is dominated by Valio, especially in the milk production. However,
also Arla Ingman is a big player in the Finnish dairy production. (Luoto, personal
communication 31.07.2013) Raisio is a further big Finnish producer focusing on
snacks and cereal based products.
During the phase of contacting organizations and companies, and then later during
the interviews it became clear that Finns do not really know much about the different
regions or states of Germany, especially when thinking about food. For them it is all
the same, if the products originate from Schleswig-Holstein or Thuringia, Finns only
see that the food comes from Germany. Most important is however that Finns have a
positive or at least a neutral perception of German food products, and no fears to try
them (Luoto, personal communication 31.07.2013, Wrang, personal communication
09.08.2013). This definitely is an advantage compared to products from other coun-
tries.
6.2 Consumer behaviour
The majority of the Finns buy their groceries in super- and hypermarkets where they
can get everything at once. The offered product ranges are large and the products are
cheaper than in small stores. Super- and hypermarkets are often outside of the city
centres and easy to reach by car which the majority uses when going shopping. These
two types of stores account for approximately 70% of the grocery sales. (Luoto, per-
sonal communication 31.07.2013; Tammivuori, personal communication 06.08.2013;
Wrang, personal communication 09.08.2013.) More detailed information on sales
and distribution can be found below in Chapter 6.5.
As this thesis focuses partly on products such as jam and cereals which are common-
ly eaten in Germany for breakfast, in the interviews the experts were asked to de-
scribe what Finns eat in the morning when they start into their days.
46
The Finnish breakfast differs slightly from the German breakfast and is eaten early in
the morning. It is rather heavy and mostly more salty than sweet. Some Finns eat
sandwiches which consist of mainly dark bread, cheese and/or ham and vegetables
such as cucumber and tomato and others eat porridge which is served hot with either
butter and salt or berries. Especially the older generations eat this type of breakfast.
The younger generations often eat muesli instead which is becoming more and more
popular. Sweet breakfast cereals such as cornflakes are mainly eaten by children and
teenagers. Sometimes also a combination of sandwiches and cereals is eaten. The
beverages drunk at breakfast are generally coffee and tea. (Luoto, personal commu-
nication 31.07.2013; Tammivuori, personal communication 06.08.2013; Wrang, per-
sonal communication 09.08.2013.)
The most popular cereal for porridge is oat as well as 4-grain porridge which consists
of rye, oat, wheat and barley. The product range for muesli in Finland is large. Nev-
ertheless, the most popular types are the crunchy ones and the original which consists
of cereals and fruits as well as in some cases nuts. (Tammivuori, personal communi-
cation 06.08.2013; Wrang, personal communication 09.08.2013.)
As Finns do not eat sweet breakfast, jam or marmalade are not seen as breakfast
products as in Germany. The most eaten flavours are strawberry, raspberry, apple
and berry mixes. (Tammivuori, personal communication 06.08.2013.)
The most popular confectionaries are chocolate as well as bags of mixed sweets with
a weight between 200g and 300g (Tammivuori, personal communication
06.08.2013).
The Finns value highly their local food products and they are important to them.
Nevertheless, the importance of origin differs largely between the products. While
Finnish origin is very important for dairy and meat products, the origin of confec-
tionaries, cereals and beer does not matter that much. Despite valuing highly Finnish
products, Finns are also eager to try new food products from other countries. The
perception of the interviewed experts was that the importance of local products is
decreasing and that the amount of foreign products is increasing. For instance beer is
more and more imported. There is also a difference between younger and older gen-
47
erations as the latter ones value the Finnish products higher than the younger genera-
tions. (Luoto, personal communication 31.07.2013; Tammivuori, personal communi-
cation 06.08.2013; Wrang, personal communication 09.08.2013.)
According to Kari Luoto from PTY Lidl has a good concept of selling food products
centring on foreign themes such as Spain, German, UK or USA.
About 12% of the consumption expenditure of households in Finland is spent on
food and non-alcoholic beverages (Structure of household expenditure, 1980-2011
2012, 454). In 2006 the average consumption expenditure per household in Finland
was € 30,247 of which € 3,817 (12.6%) were spent on food and non-alcoholic bever-
ages (Average final consumption expenditure per household by socio-economic
group, 2006 2012, 457).
In the Household Budget Survey 2006 the Finnish statistics office could determine
that 92% of the expenditure on food and non-alcoholic beverages was spent on food.
That is € 3,518 per household on average. 17% (€ 654) of the expenditure of food
and non-alcoholic beverages was spent on bread and cereal products such as porridge
grains and muesli, and 8% (€ 296) on sugar, honey, jam, chocolate and sweets. (Offi-
cial Statistics of Finland (OSF): Household consumption expenditure per household
by type of household 1985-2006 2008.)
Looking closer at the expenditure, it can be seen that only €30 are spent on cereals,
muesli and porridge which is less than 1% of the expenditure on food and non-
alcoholic beverages. Approximately one half of the money Finns spent on bread and
cereals was used to buy bread and biscuits. Around €230 was spent on pasta prod-
ucts, pizza, hamburgers, pies, cakes and pastries. (Statistics Finland 2008.) However,
it should be kept in mind that a 1kg bag of porridge or muesli cereals contains ap-
proximately 25 servings while a package of bread contains less.
As mentioned above 8% of the expenditure on food and non-alcoholic beverage was
spent on sugar, jam, honey, chocolates and sweets. The major part of that accounts
for chocolate and confectionary products such as sweets (approx. 2/3). Jams, marma-
lades and purees account only for a very small part. Merely € 8 was spent on them.
(Statistics Finland 2008.)
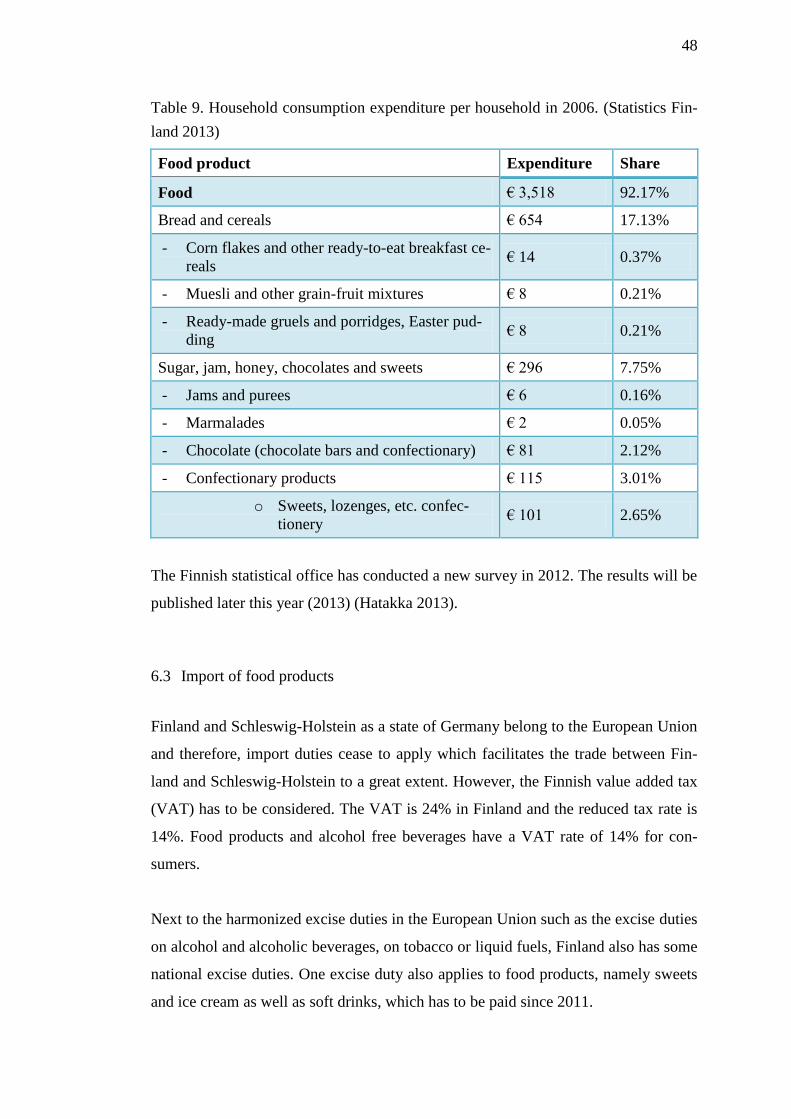
48
Table 9. Household consumption expenditure per household in 2006. (Statistics Fin-
land 2013)
Food product Expenditure Share
Food € 3,518 92.17%
Bread and cereals € 654 17.13%
- Corn flakes and other ready-to-eat breakfast ce-
reals € 14 0.37%
- Muesli and other grain-fruit mixtures € 8 0.21%
- Ready-made gruels and porridges, Easter pud-
ding € 8 0.21%
Sugar, jam, honey, chocolates and sweets € 296 7.75%
- Jams and purees € 6 0.16%
- Marmalades € 2 0.05%
- Chocolate (chocolate bars and confectionary) € 81 2.12%
- Confectionary products € 115 3.01%
o Sweets, lozenges, etc. confec-
tionery € 101 2.65%
The Finnish statistical office has conducted a new survey in 2012. The results will be
published later this year (2013) (Hatakka 2013).
6.3 Import of food products
Finland and Schleswig-Holstein as a state of Germany belong to the European Union
and therefore, import duties cease to apply which facilitates the trade between Fin-
land and Schleswig-Holstein to a great extent. However, the Finnish value added tax
(VAT) has to be considered. The VAT is 24% in Finland and the reduced tax rate is
14%. Food products and alcohol free beverages have a VAT rate of 14% for con-
sumers.
Next to the harmonized excise duties in the European Union such as the excise duties
on alcohol and alcoholic beverages, on tobacco or liquid fuels, Finland also has some
national excise duties. One excise duty also applies to food products, namely sweets
and ice cream as well as soft drinks, which has to be paid since 2011.
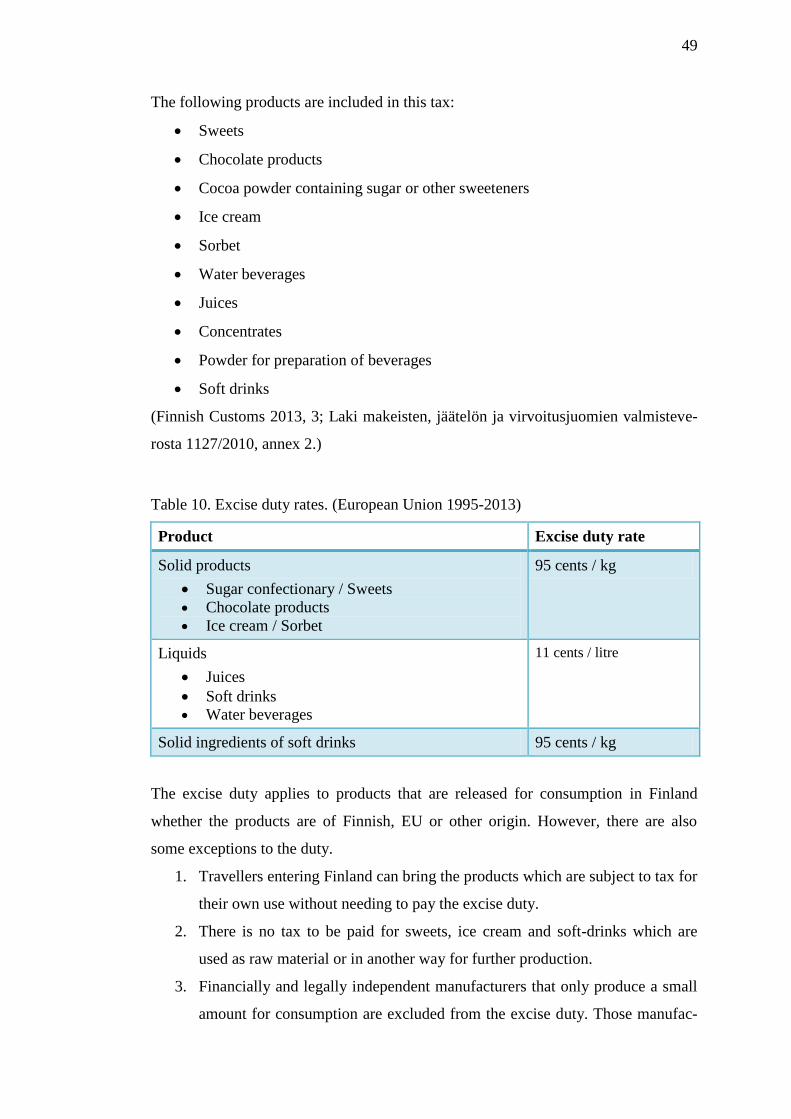
49
The following products are included in this tax:
Sweets
Chocolate products
Cocoa powder containing sugar or other sweeteners
Ice cream
Sorbet
Water beverages
Juices
Concentrates
Powder for preparation of beverages
Soft drinks
(Finnish Customs 2013, 3; Laki makeisten, jäätelön ja virvoitusjuomien valmisteve-
rosta 1127/2010, annex 2.)
Table 10. Excise duty rates. (European Union 1995-2013)
Product Excise duty rate
Solid products
Sugar confectionary / Sweets
Chocolate products
Ice cream / Sorbet
95 cents / kg
Liquids
Juices
Soft drinks
Water beverages
11 cents / litre
Solid ingredients of soft drinks 95 cents / kg
The excise duty applies to products that are released for consumption in Finland
whether the products are of Finnish, EU or other origin. However, there are also
some exceptions to the duty.
1. Travellers entering Finland can bring the products which are subject to tax for
their own use without needing to pay the excise duty.
2. There is no tax to be paid for sweets, ice cream and soft-drinks which are
used as raw material or in another way for further production.
3. Financially and legally independent manufacturers that only produce a small
amount for consumption are excluded from the excise duty. Those manufac-
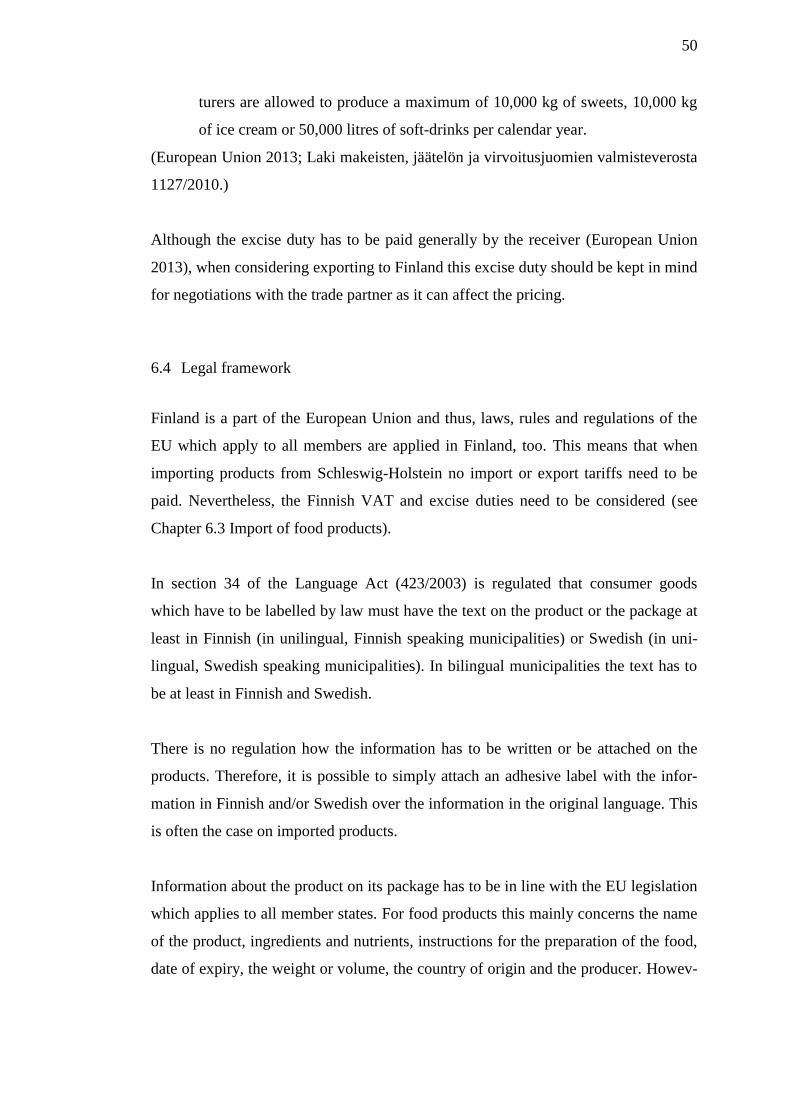
50
turers are allowed to produce a maximum of 10,000 kg of sweets, 10,000 kg
of ice cream or 50,000 litres of soft-drinks per calendar year.
(European Union 2013; Laki makeisten, jäätelön ja virvoitusjuomien valmisteverosta
1127/2010.)
Although the excise duty has to be paid generally by the receiver (European Union
2013), when considering exporting to Finland this excise duty should be kept in mind
for negotiations with the trade partner as it can affect the pricing.
6.4 Legal framework
Finland is a part of the European Union and thus, laws, rules and regulations of the
EU which apply to all members are applied in Finland, too. This means that when
importing products from Schleswig-Holstein no import or export tariffs need to be
paid. Nevertheless, the Finnish VAT and excise duties need to be considered (see
Chapter 6.3 Import of food products).
In section 34 of the Language Act (423/2003) is regulated that consumer goods
which have to be labelled by law must have the text on the product or the package at
least in Finnish (in unilingual, Finnish speaking municipalities) or Swedish (in uni-
lingual, Swedish speaking municipalities). In bilingual municipalities the text has to
be at least in Finnish and Swedish.
There is no regulation how the information has to be written or be attached on the
products. Therefore, it is possible to simply attach an adhesive label with the infor-
mation in Finnish and/or Swedish over the information in the original language. This
is often the case on imported products.
Information about the product on its package has to be in line with the EU legislation
which applies to all member states. For food products this mainly concerns the name
of the product, ingredients and nutrients, instructions for the preparation of the food,
date of expiry, the weight or volume, the country of origin and the producer. Howev-
51
er, as it is not known which products exactly might be exported from Schleswig-
Holstein to Finland there are no further details given.
From 01 January 2014 onwards the Regulation (EU) No 1169/2011 of the European
Parliament and of the Council of 25 October 2011 will partly enter into force. It
amends a number of current regulations and directives. Therefore, it is advisable to
be informed in good time to be prepared for the amendments.
The Regulation (EU) No 1169/2011 can be found under the link: http://new.eur-
lex.europa.eu/legal-content/EN/TXT/PDF/?uri=CELEX:32011R1169&from=EN
For more detailed information concerning directives and regulations of the European
Union it is recommended to have a closer look at the EUR-Lex website of the EU:
http://eur-lex.europa.eu/en/index.htm
Also the Finlex data base provides information concerning legislative and other judi-
cial information of Finland: http://finlex.fi/en/ The acts and decrees are mainly avail-
able in Finnish and Swedish. Nonetheless, some of the acts and decrees are also
available in English.
6.5 Sales / distribution
6.5.1 Retail
The experts mentioned in the interviews that super- and hypermarkets were the plac-
es where the Finns mainly buy their groceries.
Large grocery stores with an area of over 1,000 m2 have a market share of almost
65%. They offer a big range of products and are often cheaper because they can pur-
chase larger amounts of the products they sell. In urban areas these types of stores
are responsible for the supply of food to the population. On the other hand, there are
small stores which supply the population in less inhabited areas which are the local
food providers and very important to these areas although it often cannot be seen in
the sales. (FGTA 2012, 28.)
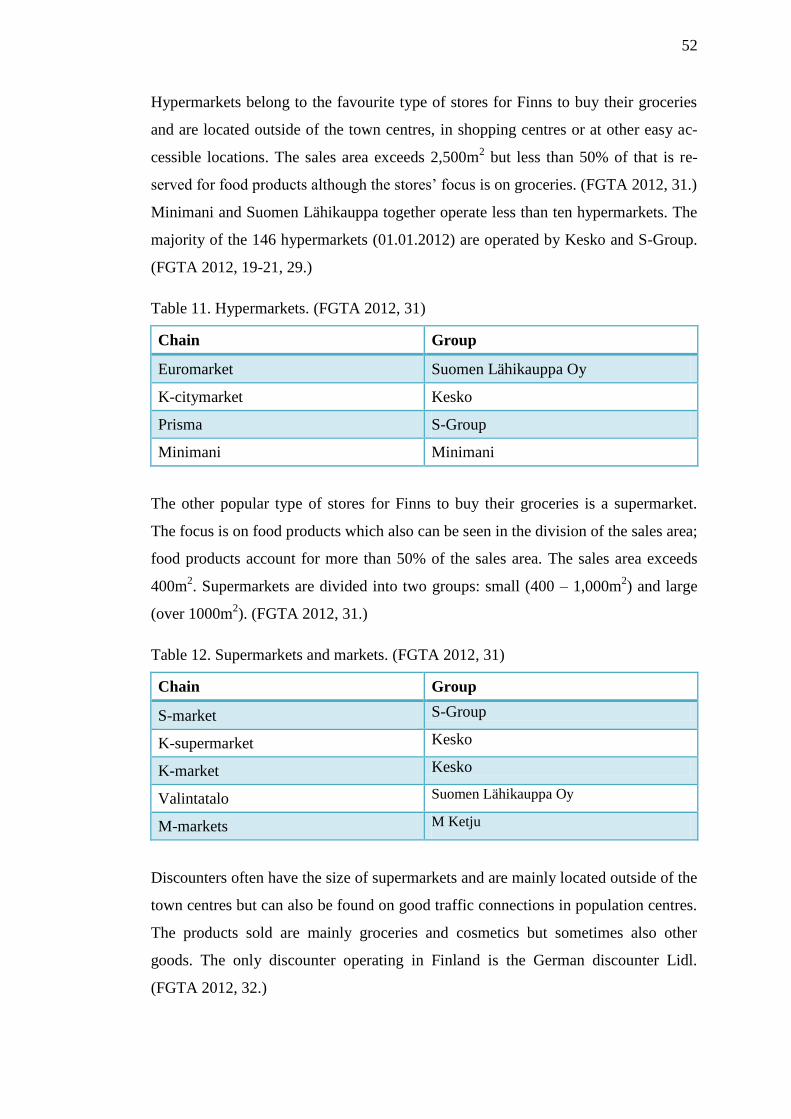
52
Hypermarkets belong to the favourite type of stores for Finns to buy their groceries
and are located outside of the town centres, in shopping centres or at other easy ac-
cessible locations. The sales area exceeds 2,500m2 but less than 50% of that is re-
served for food products although the stores’ focus is on groceries. (FGTA 2012, 31.)
Minimani and Suomen Lähikauppa together operate less than ten hypermarkets. The
majority of the 146 hypermarkets (01.01.2012) are operated by Kesko and S-Group.
(FGTA 2012, 19-21, 29.)
Table 11. Hypermarkets. (FGTA 2012, 31)
Chain Group
Euromarket Suomen Lähikauppa Oy
K-citymarket Kesko
Prisma S-Group
Minimani Minimani
The other popular type of stores for Finns to buy their groceries is a supermarket.
The focus is on food products which also can be seen in the division of the sales area;
food products account for more than 50% of the sales area. The sales area exceeds
400m2. Supermarkets are divided into two groups: small (400 – 1,000m
2) and large
(over 1000m2). (FGTA 2012, 31.)
Table 12. Supermarkets and markets. (FGTA 2012, 31)
Chain Group
S-market S-Group
K-supermarket Kesko
K-market Kesko
Valintatalo Suomen Lähikauppa Oy
M-markets M Ketju
Discounters often have the size of supermarkets and are mainly located outside of the
town centres but can also be found on good traffic connections in population centres.
The products sold are mainly groceries and cosmetics but sometimes also other
goods. The only discounter operating in Finland is the German discounter Lidl.
(FGTA 2012, 32.)
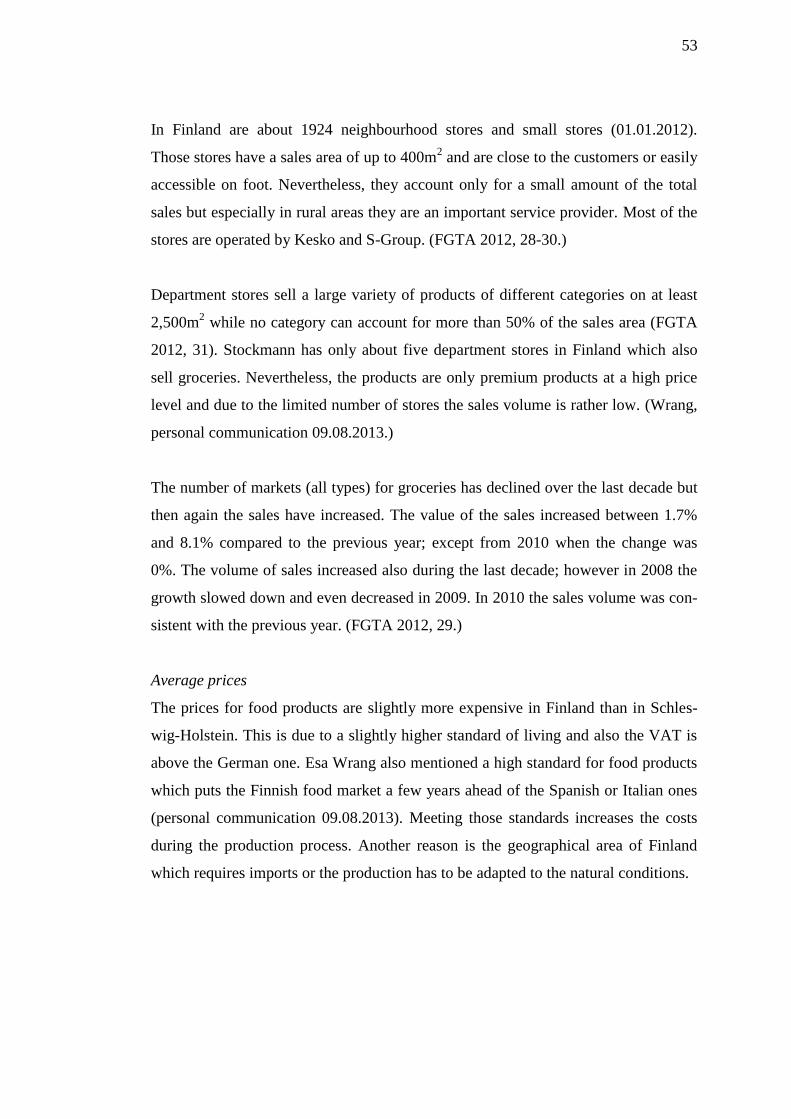
53
In Finland are about 1924 neighbourhood stores and small stores (01.01.2012).
Those stores have a sales area of up to 400m2 and are close to the customers or easily
accessible on foot. Nevertheless, they account only for a small amount of the total
sales but especially in rural areas they are an important service provider. Most of the
stores are operated by Kesko and S-Group. (FGTA 2012, 28-30.)
Department stores sell a large variety of products of different categories on at least
2,500m2 while no category can account for more than 50% of the sales area (FGTA
2012, 31). Stockmann has only about five department stores in Finland which also
sell groceries. Nevertheless, the products are only premium products at a high price
level and due to the limited number of stores the sales volume is rather low. (Wrang,
personal communication 09.08.2013.)
The number of markets (all types) for groceries has declined over the last decade but
then again the sales have increased. The value of the sales increased between 1.7%
and 8.1% compared to the previous year; except from 2010 when the change was
0%. The volume of sales increased also during the last decade; however in 2008 the
growth slowed down and even decreased in 2009. In 2010 the sales volume was con-
sistent with the previous year. (FGTA 2012, 29.)
Average prices
The prices for food products are slightly more expensive in Finland than in Schles-
wig-Holstein. This is due to a slightly higher standard of living and also the VAT is
above the German one. Esa Wrang also mentioned a high standard for food products
which puts the Finnish food market a few years ahead of the Spanish or Italian ones
(personal communication 09.08.2013). Meeting those standards increases the costs
during the production process. Another reason is the geographical area of Finland
which requires imports or the production has to be adapted to the natural conditions.

54
Table 13. Average prices for food products in 2012. (Official Statistics of Finland
(OSF): Average prices of commodities 2013)
Food product Average price in 2012
Mixed grain bread, 1 kg €4.50
Cereal muesli, 500 g €2.85
Strawberry jam, 1 kg €5.34
Block of chocolate, 200 g €2.12
Chocolate bar, 44 g €0.61
Sweets in bulk, 1 kg €8.75
Bag of sweets, 220 g €2.32
Liquorice, 500 g €3.91
Product presentation
Apart from the legal regulations by the European Union concerning the information
about the product on the package and by the Finnish law concerning the language
there are no further regulations and it is up to the companies to design the package of
their products. Esa Wrang from Finpro (personal communication 09.08.2013) men-
tioned during the interview that in general the package design in Finland was more
Scandinavian and the colours tended to be brighter. Thus, the design differs a lot
from products sold in central and southern Europe. For companies from Schleswig-
Holstein it is therefore recommended to study the market and the design well to be
successful in the long run. This is especially a point to consider as only one of five
products that enter the shelves of the supermarkets makes it through the first year
(Luoto, personal communication 31.07.2013).
6.5.2 Purchasing and supplying
There are two possible ways to get the products into the shelves of the Finnish gro-
cery stores. The first option is to market the products under one’s own brand, the
other option is to produce the products which are then sold under the name of the
private labels. According to Heli Tammivuori (personal communication 06.08.2013)
and Esa Wrang (personal communication 09.08.2013) the process to introduce a new
product to the market takes a long time, regardless if it is sold under the own brand
55
or under the name of a private label. Suppliers should expect about half a year until
they see their products in the shelves of the Finnish supermarkets but it could take
even longer. To enter the stores in the beginning of 2014, the products would have
had to be introduced to the retail groups or importers in summer, latest in the begin-
ning of August.
Own brand
The big groups mainly purchase the food products themselves. Therefore, the best
way is to contact the grocery trade groups or their procurement partners directly.
Nevertheless, if they look for specific products to add to their assortment of goods,
they also contact the manufacturers or producers themselves. If the companies from
Schleswig-Holstein were contacted or if they want to sell their products to Finland,
they have to fill in an application form for the database of the grocery retail groups.
The main purchasing decisions are made in the headquarters of the groups or smaller
chains and therefore, the products have to be introduced directly to the decision mak-
ers and not to the single stores. However, some of them have a small authority to add
products. This is mainly done with fresh local food products that are directly bought
from the producers. (Wrang, personal communication 09.08.2013.)
Usually there are small time periods when the big grocery trade groups accept intro-
duction of new suppliers and their products, and if those windows are closed, com-
panies have to wait until the next window opens. Therefore, it is recommended to
contact the grocery trade groups and request for the details and times to introduce
them to a new product. The introduction also includes sending samples as the groups
make their own tests in a laboratory and cook or prepare the meals in their kitchens
to get to know the food product. Only then, if the product makes it through the previ-
ous phases, there are meetings between the grocery trade chains and the potential
supplier from Schleswig-Holstein. This whole process takes about six months, if the
product gets accepted and makes it onto the shelves of the supermarkets. (Wrang,
personal communication 09.08.2013.) Small chains can be less strict about their pur-
chasing procedure. Thus, it is advisable to contact every grocery retail group and the
different chains to ask for the details to introduce a new product to them.
56
The procurement partner of the S-Group, Inex, has good instructions on its website
how to become a supplier. The contact data of Inex Partners Oy can be found in
chapter 6.6.2.
Private labels
The importance of private labels has been growing and it is expected to increase fur-
ther during the next years. In 2011 approximately 20% of the purchases were private
labels and they accounted for 11% (€1.7 billion) of the total sales. Often consumers
use the switch from known brands to private labels to save money during recessions
and stick with the private label afterwards too. (FGTA 2012, 25.) The private labels
have a high share amongst cereals, jam and canned fruits and vegetables (Tam-
mivuori, personal communication 06.08.2013).
The two main private labels in Finland are Rainbow (S-Group) and Pirkka (Kesko)
which can be found in the hyper- and supermarkets of the respective grocery trade
group as well as in their smaller stores or convenience stores as part of a petrol sta-
tion.
Furthermore, the S-Group also sells the label X-tra and Kesko sells Euro Shopper
products which are available in other European countries such as the United King-
dom too. X-tra can be found also in the stores which are supplied with products from
Coop Trading in the three Scandinavian countries Denmark, Sweden and Norway
(Website of Coop Trading 2013). Lidl has a number of private labels which are also
available in their stores across Europe. The private labels Eldorado and First price
are sold in the stores of the M Chain as well as in Valintatalo, Siwa and Euromarket
which belong to Suomen Lähikauppa. Stockmann has its own private label named
after the store (FGTA 2012, 25).
The cereals, jams and sweets of the private labels Rainbow and Pirkka are mainly
produced in countries of the European Union such as Germany. The manufacturers
of the products are not always revealed. Nevertheless, on the website of Rainbow
three German producers were mentioned of which one has its registered office in
Schleswig-Holstein. Pirkka reveals only the names of the Finnish producers. (Web-
site of Pirkka 2013; Website of Rainbow 2013.)
57
H. & J. Brüggen KG, located in Lübeck, produces multi-grain loops (Rainbow
Moniviljarinkula 375 g) for Rainbow as well as fruit muesli (X-tra Hedelmämysli 1
kg) for X-tra. (Website of Rainbow 2013.) Both private labels belong to Coop Trad-
ing which is partly owned by S-Group.
Piasten GmbH & Co. KG which has its registered office in Forchheim produces
chocolate (Rainbow Hasselpähkinätäytesuklaa 100 g) and Johannes Lühders KG
from Stelle produces wine gum (Rainbow Hedelmäviinikumi 150 g) for Rainbow
(Website of Rainbow 2013).
The grocery trade groups organize auctions where the potential suppliers offer their
products and bid to produce their goods which will be sold under the private labels.
Before participating the companies have to send the information about the product or
fill them into a database. The price is the most important factor during these auctions
and also the volume can influence the decision making of the grocery trade groups.
The profit in this segment is rather low due to the high pricing pressure. (Wrang, per-
sonal communication 09.08.2013.)
6.5.3 Distribution and distribution channels
As the retail also the procurement is concentrated on a handful of companies; domi-
nated by S-Group and Kesko. The procurement companies are the same as the
wholesalers or they work closely with them.
There are five big procurement companies which are distributing the goods to the
grocery retail groups. Inex Partners Oy belongs to S-Group and sources products for
the group and takes care of the logistics. Kesko and Lidl are sourcing themselves and
handle the logistics in Finland. The fourth procurement company is Tuko logistics
which is owned by Stockmann, Suomen Lähikauppa, Wihuri and Heino and it pro-
vides those groups with the products. The last procurement company is Tokmanni.
(Luoto, personal communication 31.07.2013.) Tokmanni Group has eight chains with
almost 150 stores which sell amongst a variety of other goods nonperishable food.
(Website of Tokmanni Group 2013.)
58
Fresh products such as vegetables can be also sold directly to the different stores;
especially in Kesko fresh food from local producers can be added to the selection of
the stores. Otherwise, the grocery retail groups make the decisions and purchase the
goods through the sourcing companies. (Luoto, personal communication
31.07.2013.)
The two main retail groups S-Group and Kesko, which have a market share of about
80%, import the products themselves or receive their products through their purchas-
ing partner. Thus, there is only a limited space for individual or independent import-
ers. (Wrang, personal communication 09.08.2013.)
The main distribution channel for food products is the retail in Finland, however
there is also the HoReCa sector which purchases and distributes food products. The
four HoReCa wholesalers which are members of the FGTA had a turnover of 1.8 bil-
lion euros in 2011 which was an increase of 7.8% from the previous year. The big-
gest customer for HoReCa wholesalers are public institutions such as schools which
provide free meals for the pupils. The private customers on the other hand account
only for a small share. The main wholesalers in the HoReCa sector are Kespro Oy
which belongs to Kesko, Meira Nova Oy which belongs to the S-Group, Metro
which belongs to Wihuri and Heinon Tukko Oy. (FGTA 2012, 23; Tammivuori, per-
sonal communication 06.08.2013.)
The retail logistics is highly efficient as Finland is a wide country with only a few
inhabitants and only a few grocery retail groups (Tammivuori, personal communica-
tion 06.08.2013). Finland has approximately the same size as Germany but it is
sparsely inhabited in the north. Two thirds of the inhabitants live in the Tampere –
Turku – Helsinki triangle with the main harbour in Helsinki in the south of the coun-
try. Nevertheless, also up in the north at the Norwegian border food is needed and
when the products arrive at the harbour of the capital they still have to travel over
1000km to make it to the shelves of the stores in Utsjoki.
59
6.6 Database
This database contains various information. In the first subchapter institutions, au-
thorities and other organizations that are involved in the food business are intro-
duced. In the second chapter the Finnish grocery trade groups, wholesalers and
chains can be found. The third chapter gives an overview of the current brands for
breakfast products and sweets in the stores, and the last chapter introduces trade fairs
which might be of an interest to companies from Schleswig-Holstein.
During the creation of the database it became clear that many websites are only
available in Finnish. Some websites offer information in Swedish too. If information
is available in English, the content is very limited. However, it is always possible to
contact the respective organization in English. Many Finns can speak English well as
it is also a business language in Finland.
The data has been updated last 07 September 2013.
6.6.1 Institutions, authorities, etc.
Saksalais-Suomenlainen Kauppakamari (AHK Finnland)
Address Visiting address:
Mikonkatu 25
00100 Helsinki
Finland
Postal address:
Post office box 83
00101 Helsinki
Finland
Phone +358 (0)9 612 2120
Fax +358 (0)9 642 859
Email [email protected]
Website http://www.dfhk.fi
Information The German-Finnish Chamber of Commerce is offering several
services concerning the Finnish-German trade for over 30 years.
60
Päivittäistavarakauppary (PTY) (Finnish Grocery Trade Association (FGTA))
Address Visiting address:
Eteläranta 10
00130 Helsinki
Finland
Postal address:
PL 340
00131 Helsinki
Finland
Phone +358 (0)9 172 860
Fax +358 (0)9 1728 6120
Email [email protected]
Website http://www.pty.fi
Contact Kari Luoto (Managing Director)
Phone: +358 (0)9 1728 6111
Mobile: +358 (0)400 688 708
Email: [email protected]
Information The Finnish Grocery Trade Association has organizations and
companies that are active in the grocery trade as its members. A
share of 95% of the Finnish grocery retail market is member of
the FGTA.
RuokatietoYhdistysry (Finfood - Finnish Food Information)
Address Työpajankatu 2a C 1
00580 Helsinki
Finland
Phone +358 (0)40 710 4170
Email [email protected]
Website http://www.ruokatieto.fi
61
Information Finfood focuses on the promotion of Finnish food and the Finn-
ish food production chain.
Kuluttajaliitto - Konsumentförbundet ry (The Consumers' Association of Finland)
Address Malminrinne 1 B
00180 Helsinki
Finland
Phone +358 (0)9 454 2210
Fax +358 (0)9454 22120
Email [email protected]
Website http://www.kuluttajaliitto.fi
Information The Consumers’ Association of Finland is an independent or-
ganization which promotes the interests and rights of the Finn-
ish consumers.
Elintarviketeollisuusliitto ry (Finnish Food and Drink Industries’ Federation)
Address Visiting address:
Pasilankatu 2
00241 Helsinki
Finland
Postal address:
PL 115
00241 Helsinki
Finland
Phone +358 (0)9 148 871
Fax +358 (0)9 1488 7201
Email [email protected]
Website http://www.etl.fi
62
Contact Heli Tammivuori (Director, Commercial Policy)
Phone: +358 (0)9 1488 7240
Mobile: +358 (0)40 557 5667
Email: [email protected]
Information The Finnish Food and Drink Industries’ Federation represents
the interests of the Finnish food and drink industry. The federa-
tion has 270 member companies as well as two member asso-
ciations.
Kilpailu- ja kuluttajavirasto (Finnish Competition and Consumer Authority)
Address Visiting address:
Haapaniemenkatu 4A
00241 Helsinki
Finland
Postal address:
PL 5
00531 Helsinki
Finland
Phone +358 (0)29 505 3000
Email [email protected]
Website http://www.kkv.fi
Information The Finnish Competition and Consumer Authority is responsi-
ble for the implementation of competition and consumer poli-
cies, the ensuring of good market performances, the implemen-
tation of competition legislations and the EU competition rules,
as well as securing the financial and legal position of the con-
sumers.
63
6.6.2 Wholesalers, grocery retail groups, chains etc.
Suomen Osuuskauppojen Keskuskunta (SOK) (S-ryhmä / S-Group)
Address Visiting address:
Fleminginkatu 34
00510 Helsinki
Finland
Postal address:
PL 1
00088 S-Ryhmä
Finland
Phone +358 (0)10 76 8011
Email [email protected]
Website http://www.s-kanava.fi
Information The S-Group is currently the biggest grocery trade group with a
market share close to 50%. The group has several chains which
sell food products (Prisma, Sale, Alepa, S-Market) but also a lot
of other chains.
Lidl Suomi Ky
Address Vanha Kaarelantie 33
PL 115
01611 Vantaa
Finland
Phone +358 (0)9 234561
Fax +358 (0)9 23456777
Website http://www.lidl.fi
Information Lidl is operating Europe-wide and opened its stores in Finland
in 2002. They offer mainly the same products and brands as in
Germany but add also local products and brands.
64
Kesko Oyj / Ruokakesko Oy
Address Satamakatu 3
00016 Kesko
Finland
Phone +358 (0)10 5311
Fax +358 (0)9 174 398
Email [email protected]
Website http://www.kesko.fi
Information The Kesko is the second biggest grocery trade group with a
market share of almost 35%. The group has several chains
which sell food products (K-citymarket, K-supermarket, K-
market, K-extra) but also a lot of other chains.
The chains that sell food have some authority to add local food
products.
Suomen Lähikauppa Oy
Address Visiting address:
Sörnäistenkatu 2
00580 Helsinki
Finland
Postal address:
PL 1
00581 Helsinki
Finland
Phone +358 (0)20 700 300
Email [email protected]
Website http://www.lahikauppa.fi
Information Suomen Lähikauppa is the third biggest grocery trade group
with a market share of 7.2%. The group operates three hyper-
markets (Euromarket) as well as supermarkets (Valintatalo) and
65
small stores (Siwa).
M Itsenäiset Kauppiat Oy
Address Uudenmaankatu 106
05840 Hyvinkää
Finland
Phone +358 (0)19 4603300
Email [email protected]
Website http://www.m-ketju.fi
Information The over 60 neighbourhood stores and supermarkets of the M
Group are independently owned. The group takes care of mar-
keting and supports purchasing products.
Inex Partners Oy
Address Visiting address:
Fleminginkatu 34
00510 Helsinki
Finland
Postal address:
PL 30
00088 S-Ryhmä
Finland
Phone +358 (0)10 7687000
Fax +358 (0)10 7687190
Email [email protected]
Website http://www.inex.fi
Information Inex Partners Oy is the sourcing and logistics partner of the S-
Group.
66
Tuko Logistics Cooperative
Address Visiting address:
Postlarinkatu 4
04200 Kerava
Finland
Postal address:
PL 115
04201 Kerava
Finland
Phone +358 (0)20 77111
Fax +358 (0)20 7712060
Email [email protected]
Website http://www.tuko.fi
Information Tuko Logistics Cooperative is a sourcing and logistics company
which also supports the customers with their sales and business
activities. The owners of Tuko Logistics are Wihuri Oy, Su-
omen Lähikauppa Oy, Stockmann Plc and Heinon Tukku Oy.
Tokmanni Group
Address Isolammintie 1
04600 Mäntsälä
Finland
Phone +358 (0)20 778 2000
Website http://www.tokmanni-konserni.fi
Information The Tokmanni Group operates about 150 discount stores in Fin-
land. The products are sold in the stores Tokmanni, Tarjoustalo,
Vapaa Valinta, Robinhood, Säästöpörssi, Maxi-Makasiini and
Maxi-Kodintukku as well as online (TokNet.fi).

67
Wihuri Oy Aarnio
Address Atomitie 5 A
00370 Helsinki
Finland
Phone +358 (0)20 510 10
Fax +358 (0)20 510 4031
Email [email protected]
Website www.metrotukku.com
Information Wihuri Oy Aarnio is a wholesaler and belongs to the Wihuri
Group. Wihuri Oy Aarnio operates as Metro and has also about
30 cash-and-carry outlets in Finland.
Heinon Tukku Oy
Address Orionintie 18-22
02200 Espoo
Finland
Phone +358 (0)20 717000
Email [email protected]
Website www.heinontukku.fi
Information Heinon Tukko Oy is an importer and wholesaler which operates
through its three subsidiaries Heinon Tukko Oy (groceries)
Heinon Juomat Oy (alcoholic beverages) and Heinon Toimisto-
palvelu Oy (office supplies). Heino owns a small number of
cash-and-carry outlets.
68
Stockmann plc
Address Aleksanterinkatu 52
00100 Helsinki
Finland
Phone +358 (0)20 510 10
Fax +358 (0)20 510 4031
Email [email protected]
Website http://www.stockmanngroup.fi
Information The Stockmann Group operates a small number of Stockmann
department stores. The grocery department is called Stockmann
Delicatessen and sells mainly high quality food products. The
procurement is done by Stockmann itself or through Tuko Lo-
gistics.
Kokkolan Halpa-Halli Oy
Address Visiting address:
Kaarlelankatu 7
67101 Kokkola
Finland
Postal address:
PL 94
67101 Kokkola
Finland
Phone +358 (0)20 718 2000
Fax +358 (0)20 718 2100
Email [email protected]
Website http://www.hhnet.fi
Information Halpa-Halli operates over 35 department stores in Finland and
focuses on less expensive prices. The southernmost stores a are
located in the northern part of the populous Helsinki – Tampere
69
– Turku triangle.
Veljekset Keskinen Oy
Address OnnenTie 7
63610 Tuuri
Finland
Phone +358 (0)10 770 7000.
Email [email protected]
Website http://www.tuuri.fi
Information Veljekset Keskinen is a large department store in western Fin-
land. The food store with over 7,000m2 is the biggest grocery
store in Finland.
Minimani Yhtiöt Oy
Address Yrittäjäntie 12
60100 Seinäjoki
Finland
Phone +358 (0)29 080 1580
Fax +358 (0)6 214 0281
Email [email protected]
Website http://www.minimani.fi
Information Minimani is a small chain with five hypermarkets in Seinäjoki,
Kokkola, Vaasa, Jyväskylä and Lempäälä.
70
Palotron Oy
Address Leipäläntie 71
20300 Turku
Finland
Phone +358 (0)20 275 5454
Fax +358 (0)20 275 5464
Email [email protected]
Website http://www.palotron.fi
Information Palotron Oy is an importer and wholesaler from Turku. The fo-
cus is on chocolate products, bakery products and desserts,
dried fruits and presents.
Arvid Nordquist Finland
Address Visiting address:
Valimotie 1B
6. Kerros
00380 Helsinki
Finland
Postal address:
PL 153
00381 Helsinki
Finland
Phone +358 (0)10 8325 600
Fax +358 (0)9 6820 366
Email [email protected]
Website http://www.arvidnordquist.fi
Information Arvid Nordquist is an importing company which operates in
northern Europe. They already import for instance products
from Piasten or Storck to Finland.
71
6.6.3 Trade fairs in Finland
There are two trade fairs in Finland which can be interesting for companies from
Schleswig-Holstein. They are held in Helsinki and are listed chronologically.
Wine, food & good living 2013
Date Thu, 24.10. – Sun, 27.10.2013
Location Helsinki Exhibition & Convention Centre
Website http://www.finnexpo.fi/Sites1/Viiniruokahyvaelama/en/Pages/defaul
t.aspx
Information The trade fair is open to consumers. At the same time the Helsinki
Book Fair, Helsinki Music Fair and ArtForum are held.
Local & Organic food fair 2014
Date Fri, 11.04. – Sun, 13.04.2014
Location Helsinki Exhibition & Convention Centre
Website http://www.finnexpo.fi/Sites2/Lahiruokaluomu/en/Pages/default.asp
x
Information The trade fair is open to consumers. At the same time Child fair,
ModelExpo, OutletExpo, Arts & Crafts fair and PetExpoare held.
Wine, food & good living 2014
Date Thu, 23.10. – Sun, 26.10.2014
Location Helsinki Exhibition & Convention Centre
Website http://www.finnexpo.fi/Sites1/Viiniruokahyvaelama/en/Pages/defaul
t.aspx

72
Information The trade fair is open to consumers. At the same time the Helsinki
Book Fair, Helsinki Music Fair and ArtForum are held.
73
7 PROJECTS RESULTS AND CONCLUSION
7.1 Evaluation of results
Strengths and weakness of the Finnish food market
The probably biggest weakness of the Finnish food market is the retail market which
is dominated by the S-Group and Kesko. If a company does not make it into the
shelves for instance of S-Group, already a market share of 45% is lost. On the other
hand this can be a big advantage because when supplying one of the big grocery
trade groups, it is possible to reach a big number of consumers.
As the big grocery trade groups purchase most of their goods themselves the best
way is to contact one of these groups and fill out the registration forms. If they look
for certain products they also might contact the suppliers but due to an oligopolistic
structure of the grocery retail market there are a lot of suppliers compared to the gro-
cery retail groups which reduces the chances.
Finland is inhabitant-wise a small country with only 5 million people of which two
thirds live in the southern part of the country. Thus, also the market is much smaller
than for instance Germany where 82 million inhabitants live. Then again, compared
to only Schleswig-Holstein the market is twice as big.
The holiday season is much more distinctive in Finland as it is in Germany as the
business life slows very much down. Many employees are on holiday for several
weeks and unimportant tasks can be put aside until the office is back in full strength.
The summer holiday season usually starts with the midsummer weekend around the
21 June and lasts until the end of July or the beginning of August. Some small shops
also reduce their opening hours during this time.
Opportunities and threats for products from Schleswig-Holstein
The three experts mentioned that it is possible for companies to enter the Finnish
market and that the grocery trade groups are willing to try to sell new products. Heli
74
Tammivuori had a more reserved view and pointed out that due to the small amount
of retail groups in Finland and the big number of suppliers it is difficult to get listed.
This strong competition requires from the companies from Schleswig-Holstein good
products which have distinctive features, a strong brand behind them or have a good
story. This makes the tough competition somewhat easier and it is possible to beat
competitors for a spot in the shelves. According to Kari Luoto and Esa Wrang also
uniqueness is very important when introducing the product to the grocery trade
groups. Furthermore, the product has to add value to them.
The pick and mix concept for sweets is very popular and can be found in many su-
per- and hypermarkets. The main brand Candy King offering this concept. However,
the sweets and confectionaries are produced by companies which distribute their
products also in bags, for instance Panda or HARIBO, but some of the confectionar-
ies are produced exclusively for Candy King (Website of Candy King 2013). Thus,
this concept could be used to test the market with only one type of sweets or confec-
tionaries.
The economic situation of Finland and the food retail market needs to be considered
when entering the market. The economy has an effect on the customers and the mon-
ey they have available to spend. Food will always be purchased and thus recessions
and crises do not have such big effects as on luxury goods or alcoholic beverages,
nevertheless it influences the customer to buy a cheaper private label than a more
expensive international brand. Currently the situation of the food market is not very
positive and the growth is based on the price increase, however predictions are posi-
tive, even though only moderate. Nevertheless, predictions are unsure and can
change which can happen rather fast nowadays. Finland is also a member of the Eu-
ropean Union and the Finnish economy does not only depend on the further devel-
opment of the country but also on the further developments in the EU.
Although Finland does not belong to Scandinavia, it belongs to the Nordic countries
and has many similarities with Scandinavia. This can be an advantage too, if the ex-
pansion shall not end after entering the Finnish market. Also, the design of the pack-
ages is similar to the other Nordic countries and therefore, only one design needs to
be developed. Therefore, Finland could be used to test the market and learn from it.
75
Furthermore, Kesko, S-Group and Stockmann are already present in the Russian
market and/or in the Baltic States. This gives the opportunity to enter those markets
via Finland and via those above mentioned grocery trade groups. The Baltic States
are members of the European Union and Estonia belongs to the euro area. All four
countries have also access to the Baltic Sea which makes it easy to ship the product
to the target countries. However, it should be kept in mind that Russia is not a mem-
ber of the EU and therefore other rules and regulations apply.
Chances for products from Schleswig-Holstein
The experts mentioned in the interviews that there are chances for companies from
Schleswig-Holstein to enter the Finnish market. However, it is rather difficult and the
products must have distinctive features – no matter if that is a good brand, a good
story or some other special feature – to increase the chance and to be even consid-
ered. According to Esa Wrang (personal communication 09.08.2013) many organic
products which are sold in Finland are originating from Germany. This can be a
chance for companies from Schleswig-Holstein that are producing organic food
products to focus on this aspect. He also mentioned that gluten free products were
currently an interesting topic. Thus, also these kinds of products could have good
chances to make it on the shelves of the supermarkets. Also, if a product is currently
or in near future needed, the chances are higher to get listed.
7.2 Conclusion
As mentioned above, it is not easy to enter the Finnish market but definitely manage-
able. With a good strategy and a special product it is possible to convince the grocery
trade groups to get the products listed. Companies from Schleswig-Holstein need to
expect a time span of over half a year until their products could be found from the
shelves and prepare themselves well for a different market to survive the first year. A
study of product design is needed to make the products more appealing to the Finnish
consumers and the company needs to consider the different type of breakfast Finns
eat when marketing for instance marmalade.
76
If an expansion abroad suits a company from Schleswig-Holstein and the company’s
strategy, it is definitely worth to inform themselves about the Finnish market, their
own potential and contact the grocery trade groups. The Finns are eager to try new
products, if they are available on the shelves and the younger generations are also
buying a lot of products with a foreign origin. Furthermore, the Finnish food and
food retail market can be also used to go either west, for instance through the private
brand Rainbow from the S-Group which belongs also to Coop Trading, or to go east
from Finland via Stockmann, Kesko and S-Group which are present in the Russian
and partly also in the Baltic market.

77
8 FINAL WORDS
This thesis was the final work of my studies in which I could apply my knowledge
which I gained during my studies and my internship in Ireland, but also learn more
about a market analysis. Thinking of writing a thesis with quite a number of pages
was rather scary during the studies but since I wrote a market analysis of about 100
pages during my internship I realized that it is not that scary and learned that such a
long document requires a good planning as well as consistency. Coming to the li-
brary of Kanali Campus before and after the summer break definitely helped me to
work on my thesis as well as seeing the thesis as a summer job. So, I had five days a
week a few hours when I worked on my bachelor’s thesis. Nevertheless, the process
had positive phases when I wrote a lot, while on other days it was hard to write even
a few words.
My goal was to graduate in September 2013 but due to the holiday season in July I
was not able to conduct the interviews which I had planned as a source of vital in-
formation earlier. Since I knew it already before the summer break at SAMK, I was
able to adjust my plan and work towards a graduation in October. During the summer
I unfortunately did not work as much on my thesis as I wanted but I was still able to
stay within my adjusted goal to finish my studies in October.
The so called “thesis library” in the library once a month was a big support during
the writing process of my thesis. It was a nice motivating atmosphere on those Satur-
days when there were other students in the same situation as I and they were also
writing on their theses. A big help during the writing process were also my opponent
to whom I could always turn for questions and a close family member who checked
the grammar of my thesis.
I really liked the topic and it was interesting to deepen the knowledge about the Finn-
ish culture I already had. Also writing the market analysis for the IHK zu Lübeck and
companies from Schleswig-Holstein motivated me since it is a good feeling to be
able to help them to improve and expand their businesses. The thesis also confirmed
my resolution to look for a job after graduation in which I can support companies to
succeed with their international activities. Altogether I am satisfied with my thesis

78
and happy to finish my studies with a thesis I most of the time really liked to work
on.
79
REFERENCES
Average final consumption expenditure per household by socio-economic group,
2006. 2012. In: Statistics Finland. 2012. Statistical Yearbook of Finland 2012. Hel-
sinki: Statistics Finland, 457.
Bank of Finland. 2013. Consumption in Finland. Referred 15.08.2013.
http://www.suomenpankki.fi/en/tilastot/kuviopankki/Pages/kulutus.aspx
Case, K. E., Fair, R. C. & Oster, S. M. 2009.Principle of Economics – 9th Edi-
tion.Upper Saddle River, New Jersey: Pearson Education, Inc.
Doyle, P. & Stern, P. 2006. Marketing Management and Strategy – 4th Edition. Har-
low, Essex: Pearson Education Ltd.
European Commission 1995 – 2013. Finland. Referred 05.06.2013.
http://europa.eu/abc/maps/images/members/finland.gif
European Union 1995 – 2013. "Taxes in Europe" database. Referred 21.08.2013.
http://ec.europa.eu/taxation_customs/tedb/taxSearch.html
Finnish Customs. 2013. Customer Bulletin No. 16, January 2013. Referred
20.08.2013.
http://www.tulli.fi/en/finnish_customs/publications/excise_tax/excise_taxation/016.p
df
Finnish Customs Statistics. 2013. Foreign Trade 2012: Finnish Trade in Figures. Re-
ferred 06.09.2013.
http://www.tulli.fi/en/finnish_customs/statistics/publications/pocket_statistics/liitteet/
pocket2012.pdf
Finnish Grocery Trade Association. 2012. Finnish Grocery Trade 2012-2013. Re-
ferred 11.06.2013.
http://www.pty.fi/fileadmin/pty_tiedostot/Julkaisut/PTY_vuosijulkaisu_2012_engl_
web.pdf
Germany Trade and Invest. 2013. Wirtschaftstrendskompakt Jahresmitte 2013: Finn-
land. Referred 05.06.2013.
http://www.gtai.de/GTAI/Content/DE/Trade/Fachdaten/PUB/2013/05/pub20130529
8018_18057.pdf
Germany Trade and Invest. 2013. Wirtschaftsdatenkompakt: Finnland. Referred
05.06.2013.
http://www.gtai.de/GTAI/Content/DE/Trade/Fachdaten/PUB/2012/11/pub20121121
8004_159050.pdf
Gross domestic product, 2001 – 2011. 2012. In: Statistics Finland. 2012. Statistical
Yearbook of Finland 2012. Helsinki: Statistics Finland, 318.
Hatakka, T. 2013. Statistics on expenditure on food. Receiver: gun-
[email protected] Sent 15.08.2013 15:09. Referred 16.08.2013.
80
Karunakaran, K. 2008. Marketing Management. Mumbai, India: Global Media. Re-
ferred 10.09.2013. http://site.ebrary.com/lib/samk/home.action
Kuada, J. 2008. International Market Analysi: Theories and Methods. London: Ado-
nis & Abbey Publishers Ltd. Referred 06.09.2012.
http://site.ebrary.com/lib/samk/home.action
Laki makeisten, jäätelön ja virvoitusjuomien valmisteverosta. 2010. A 1127/2010.
Language Act. 2003. A 423/2003.
Luoto, K. 2013. Managing Director, Finnish Grocery Trade Association (FGTA).
Helsinki. Telephone interview 31.07.2013. Interviewer Gunda Dorothea Albert.
Malhotra, N.K. 2012. Basic Marketing Reseach: Integration of Social Media – 4th
Edition. Upper Saddle River, New Jersey: Pearson Education, Inc.
Marjanen, H. 2000. Retailing in rural Finland and the challenge of nearby cities. In-
ternational Journal of Retail & Distribution Management 4/5, 194-206. Referred
24.05.2013. http://dx.doi.org/10.1108/09590550010319940
Morrison, J. 2011. The Global Business Environment: Meeting the Challenges – 3rd
Edition. Bastingstoke, Hampshire: Palgrave Macmillan.
Official Statistics of Finland (OSF): Average prices of commodities. 2013. Helsinki:
Statistics Finland. Referred 10.08.2013.
http://pxweb2.stat.fi/Dialog/varval.asp?ma=070_khi_tau_107_en&ti=Average+price
s+of+commodities&path=../Database/StatFin/hin/khi/&lang=1&multilang=en
Official Statistics of Finland (OSF): Household consumption expenditure per house-
hold by type of household 1985-2006. 2008. Helsinki: Statistics Finland. Referred
14.08.2013.
http://193.166.171.75/Dialog/varval.asp?ma=120_ktutk_tau_102_en&ti=Household+
consumption+expenditure+per+household+by+type+of+household+1985-
2006&path=../Database/StatFin/tul/ktutk/&lang=1&multilang=en
Official Statistics of Finland (OSF): Household consumption expenditure per house-
hold by type of household by Price, Consumption expenditure per household, Year
and Type of household. 2008. Helsinki: Statistics Finland. Receiver: gun-
[email protected] Sent 15.08.2013 15:09. Referred 16.08.2013.
Official Statistics of Finland (OSF): Parliamentary elections. 2011. Helsinki: Statis-
tics Finland. Referred 07.06.2013.
http://tilastokeskus.fi/til/evaa/2011/evaa_2011_2011-04-29_tie_001_en.html
Palmer, A. & Hartley, B. 2002.The Business Environment – 4th Edition. Maiden-
head, Berkshire: McGraw-Hill Education.
Pant, H. 2007. Advertising and Consumer Behaviour. Jaipur, India: Global Media.
Referred 10.09.2013. http://site.ebrary.com/lib/samk/home.action
81
Population and population changes by major region, region and sub-regional unit,
2011. 2012. In: Statistics Finland. 2012. Statistical Yearbook of Finland 2012. Hel-
sinki: Statistics Finland, 75.
Päivittäistavatakauppa ry 2013. Nielsen julkisti päivittäistavarakaupan myyntitiedot
ja markkinaosuudet 2012. Referred 27.05.2013. http://www.pty.fi/1475.html
Ruokatieto 2012. Forkful of Facts – Finnish Food Industry 2012. [online] Referred
28.06.2013. http://www.proagria.fi/ruokatieto/Tietohaarukka2012_ENGLANTI/
Shao, A.T. 1999. Marketing Research: An Aid to Decision Making. Cincinnati,
Ohio: South-Western College Publishing.
Statistisches Amt für Hamburg und Schleswig-Holstein. 2013. Statistik informiert ...
Nr. 71/2013. [online] Referred 19.08.2013. http://www.statistik-
nord.de/uploads/tx_standocuments/SI13_071.pdf
Statistisches Amt für Hamburg und Schleswig-Holstein: Ein- und Ausfuhr des Lan-
des Schleswig-Holstein 2012 – nach Ländern. 2013. Hamburg: Statistikamt Nord.
Referred 03.09.2013. http://www.statistik-nord.de/uploads/tx_standocuments/GIII1-
GIII3-j12S_Laendern.pdf
Statistisches Amt für Hamburg und Schleswig-Holstein: Ein- und Ausfuhr des Lan-
des Schleswig-Holstein 2012 – nach Waren. 2013. Hamburg: Statistikamt Nord. Re-
ferred 03.09.2013. http://www.statistik-nord.de/uploads/tx_standocuments/GIII1-
GIII3-j12S_Waren.pdf
Statistisches Amt für Hamburg und Schleswig-Holstein: Güter- und Containerver-
kehr über See des Schleswig-Holsteins für die Monate Januar bis Dezember
2011/2012 nach ausgewählten Ländern. Hamburg: Statistikamt Nord. Receiver: gun-
[email protected] Sent 08.07.2013 12:23. Referred 09.07.2013.
Stevens, R.E., Sheerwood, P.K., Dunn, J.P. & Loudon, D.L. 2012. Market Oppor-
tunity Analysis: Text and Cases. Abingdon, Oxfordshire: Routledge Ltd. Referred
14.05.2013. https://www.dawsonera.com
Structure of household expenditure, 1980-2011. 2012. In: Statistics Finland. 2012.
Statistical Yearbook of Finland 2012. Helsinki: Statistics Finland, 454.
Suomalaisilla jo 9,7 miljoonaa matkapuhelinliittymää. 2013. Kauppalehti
26.07.2013. Referred 09.09.2013. http://www.kauppalehti.fi
Tammivuori, H. 2013. Director, Finnish Food and Drink Industries’ Federation. Hel-
sinki. Telephone interview 06.08.2013. Interviewer Gunda Dorothea Albert.
Tapp, A. 2000. Principles of Direct and Database Marketing – 2nd Edition. Harlow,
Essex: Pearson Education Ltd.
Tulli. 2013. Foreign Trade 2012: Finnish Trade in Figures. [online] (14.05.2013)
Helsinki, Finland: Finnish Customs Statistics. Referred 17.07.2013.
http://www.tulli.fi/en/finnish_customs/statistics/publications/pocket_statistics/liitteet/
pocket2012.pdf
82
Uusitalo, O. 2004. Competitive reactions to market entry: The case of Finnish gro-
cery retailing industry. British food Journal 9, 663-672. Referred 24.05.2013.
http://dx.doi.org/10.1108/00070700410558193
Webb, J.R. 2002. Understanding and Designing Marketing Research – 2nd Edition.
London: Thompson Learning.
Website of AHK Finnland. Referred 05.06.2013. http://www.dfhk.fi
Website of Candy King. Referred 13.09.2013. http://www.candyking.com
Website of Coop Trading. Referred 26.08.2013. http://www.cooptrading.com
Website of IHK Schleswig-Holstein. Referred 14.05.2013. http://www.ihk-
schleswig-holstein.de
Website of Lidl. Referred 13.08.2013. http://www.lidl.fi
Website of Pirkka. Referred 27.08.2013. http://www.pirkka.fi
Website of Rainbow. Referred 16.07.2013. http://www.rainbow.fi
Website of Tokmanni Group. Referred 27.08.2013. http://www.tokmanni-konserni.fi
Worthington, I. & Britton, C. 1997.The Business Environment – 2nd Edition. Lon-
don: Pitman Publishing.
Wrang, E. 2013. Head of Industry Food Sector, Finpro ry. Helsinki. Telephone inter-
view 09.08.2013. Interviewer Gunda Dorothea Albert.

APPENDIX 1
LIST OF FIGURES
Figure 1. Research process. (Shao 1999, 62) ............................................................... 8
Figure 3. Conceptual Framework. (Adapted from Stevens et al., 2012) ................... 26
Figure 4. Import (2012). (GTAI 2013)....................................................................... 38
Figure 5. Export (2012). (GTAI 2013)....................................................................... 39
Figure 6. Imports to Schleswig-Holstein 2012. (Ein- und Ausfuhr des Landes
Schleswig-Holstein 2012 – nach Ländern 2013) ................................ 40
Figure 7. Exports from Schleswig-Holstein 2012. (Ein- und Ausfuhr des Landes
Schleswig-Holstein 2012 – nach Ländern 2013) ................................ 41
Figure 8. Exports to Schleswig-Holstein 2012. (Güter- und Containerverkehr über
See des Schleswig-Holsteins für die Monate Januar bis Dezember
2011/2012 nach ausgewählten Ländern 2013) ................................... 42
LIST OF PICTURES
Picture 1. Finland. (European Commission 1995 – 2013) ......................................... 35
LIST OF TABLES
Table 1. Business environment. (Palmer & Hartley 2002, 5-15) ............................... 18
Table 2. Producers of cereals and muesli ................................................................... 31
Table 3. Producers of sweets and confectionaries ..................................................... 32
Table 4. Producers of jam and marmalade ................................................................. 34
Table 5. Basic data of Finland. (AHK Finnland 2013; GTAI 2013) ......................... 36
Table 6. Economy data of Finland. (GTAI 20139 ..................................................... 37
Table 7. Imports from Schleswig-Holstein 2012. (Güter- und Containerverkehr
über See des Schleswig-Holsteins für die Monate Januar bis
Dezember 2011/2012 nach ausgewählten Ländern 2013) .................. 43
Table 8. Market shares and sales of grocery trade groups in 2011. (FGTA 2012,
16) ................................................................................................... 44
Table 9. Household consumption expenditure per household in 2006. (Statistics
Finland 2013)...................................................................................... 48
Table 10. Excise duty rates. (European Union 1995-2013) ....................................... 49
Table 11. Hypermarkets. (FGTA 2012, 31) ............................................................... 52
Table 12. Supermarkets and markets. (FGTA 2012, 31) ........................................... 52
Table 13. Average prices for food products in 2012. (Official Statistics of Finland
(OSF): Average prices of commodities 2013).................................... 54
LIST OF ABBREVIATIONS
AHK Außenhandelskammer (German Chambers of Commerce Abroad)
DGP Gross Domestic Product
DIHK Deutscher Industrie- und Handelskammertag (Association of German
Chambers of Industry and Commerce)
ETL Elintarviketeollisuusliitto (Finnish Food and Drink Industries' Federa-
tion)
EU European Union
FGTA Finnish Grocery Trade Association
GDP Gross Domestic Product
GTAI Germany Trade and Invest
HoReCa Hotel / Restaurant / Catering
IHK Industrie- und Handelskammer (Chamber of Commerce and Industry)
PTY Päivittäistavarakauppa ry (Finnish Grocery Trade Association)
SAMK Satakunnan ammattikorkeakoulu (Satakunta University of Applied
Sciences)
SOK Suomen Osuuskauppojen Keskuskunta (S-ryhmä / G-Group)
VAT Value added tax
WTO World Trade Organization
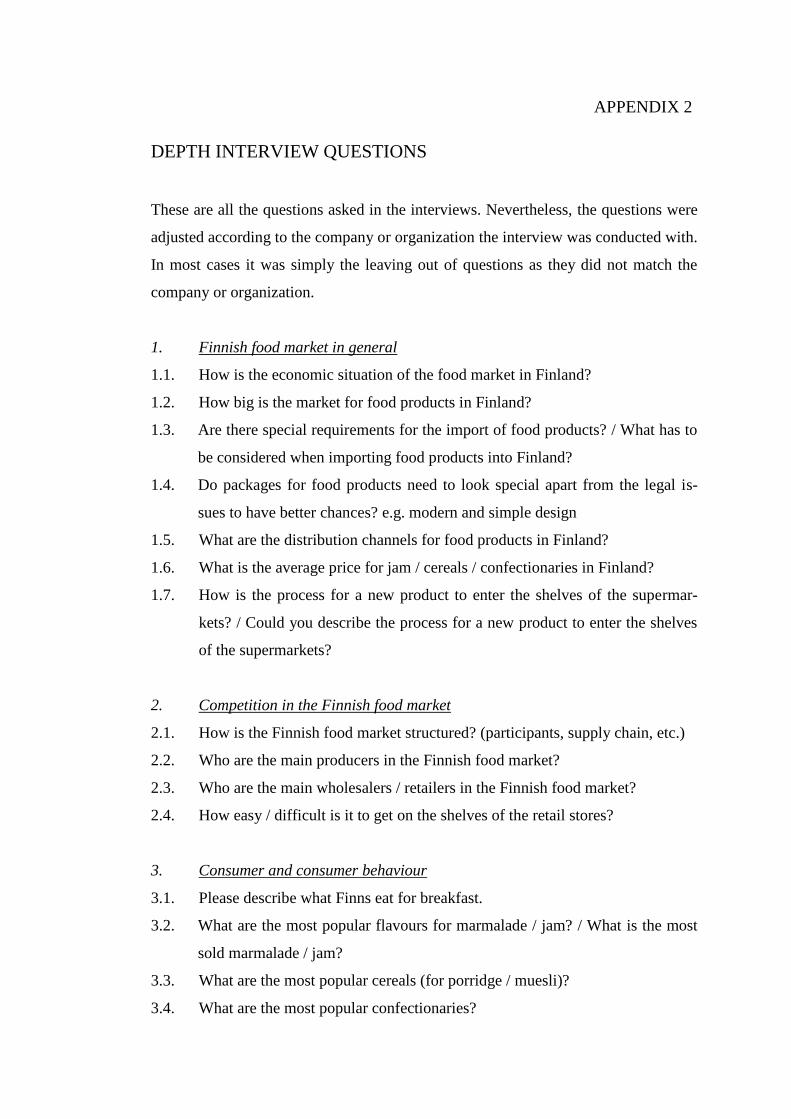
APPENDIX 2
DEPTH INTERVIEW QUESTIONS
These are all the questions asked in the interviews. Nevertheless, the questions were
adjusted according to the company or organization the interview was conducted with.
In most cases it was simply the leaving out of questions as they did not match the
company or organization.
1. Finnish food market in general
1.1. How is the economic situation of the food market in Finland?
1.2. How big is the market for food products in Finland?
1.3. Are there special requirements for the import of food products? / What has to
be considered when importing food products into Finland?
1.4. Do packages for food products need to look special apart from the legal is-
sues to have better chances? e.g. modern and simple design
1.5. What are the distribution channels for food products in Finland?
1.6. What is the average price for jam / cereals / confectionaries in Finland?
1.7. How is the process for a new product to enter the shelves of the supermar-
kets? / Could you describe the process for a new product to enter the shelves
of the supermarkets?
2. Competition in the Finnish food market
2.1. How is the Finnish food market structured? (participants, supply chain, etc.)
2.2. Who are the main producers in the Finnish food market?
2.3. Who are the main wholesalers / retailers in the Finnish food market?
2.4. How easy / difficult is it to get on the shelves of the retail stores?
3. Consumer and consumer behaviour
3.1. Please describe what Finns eat for breakfast.
3.2. What are the most popular flavours for marmalade / jam? / What is the most
sold marmalade / jam?
3.3. What are the most popular cereals (for porridge / muesli)?
3.4. What are the most popular confectionaries?
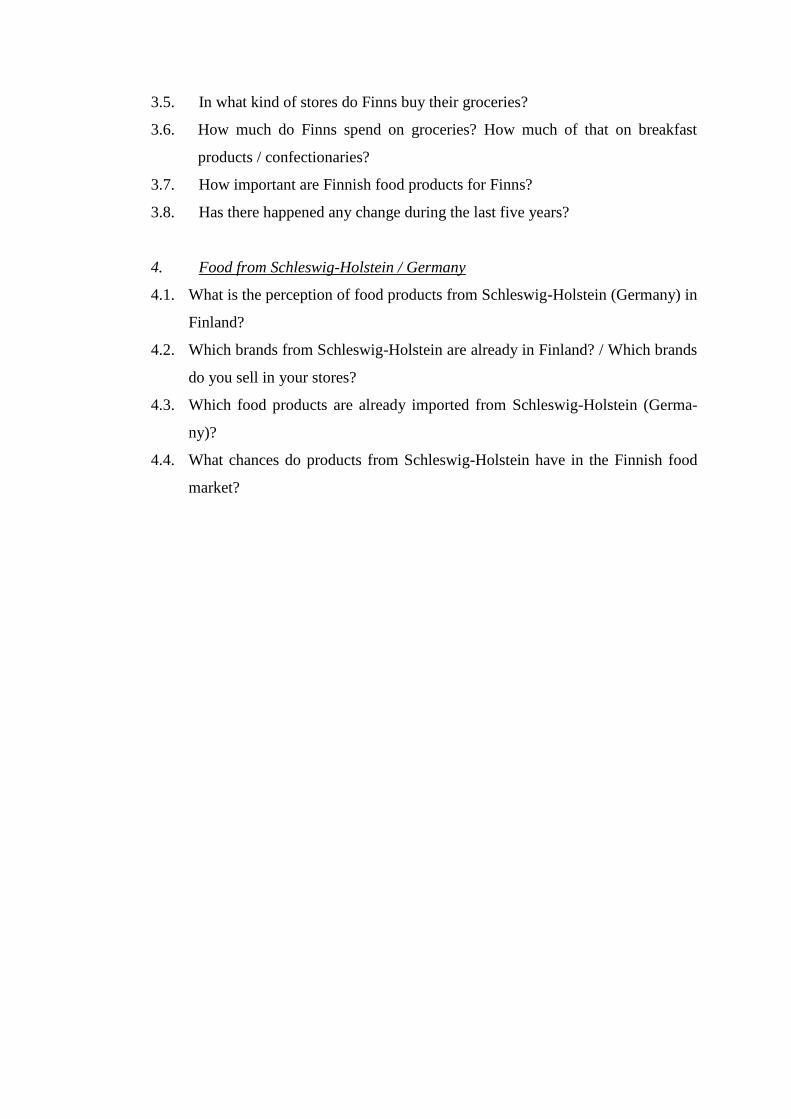
3.5. In what kind of stores do Finns buy their groceries?
3.6. How much do Finns spend on groceries? How much of that on breakfast
products / confectionaries?
3.7. How important are Finnish food products for Finns?
3.8. Has there happened any change during the last five years?
4. Food from Schleswig-Holstein / Germany
4.1. What is the perception of food products from Schleswig-Holstein (Germany) in
Finland?
4.2. Which brands from Schleswig-Holstein are already in Finland? / Which brands
do you sell in your stores?
4.3. Which food products are already imported from Schleswig-Holstein (Germa-
ny)?
4.4. What chances do products from Schleswig-Holstein have in the Finnish food
market?