Gulf of Carpentaria Inshore Fin Fish Fishery Scoping Study
40
Gulf of Carpentaria Inshore Fin Fish Fishery Scoping Study
Transcript of Gulf of Carpentaria Inshore Fin Fish Fishery Scoping Study

Gulf of Carpentaria Inshore Fin Fish Fishery
Scoping Study

ii
This publication has been compiled by Fisheries Queensland, Department of Agriculture and Fisheries.
© State of Queensland, 2019
The Queensland Government supports and encourages the dissemination and exchange of its information. The copyright in this publication is licensed under a Creative Commons Attribution 4.0 International (CC BY 4.0) licence.
Under this licence you are free, without having to seek our permission, to use this publication in accordance with the licence terms.
You must keep intact the copyright notice and attribute the State of Queensland as the source of the publication.
Note: Some content in this publication may have different licence terms as indicated.
For more information on this licence, visit https://creativecommons.org/licenses/by/4.0/.
The information contained herein is subject to change without notice. The Queensland Government shall not be liable for technical or other errors or omissions contained herein. The reader/user accepts all risks and responsibility for losses, damages, costs and other consequences resulting directly or indirectly from using this information.

iii
Table of contents
Summary ............................................................................................................................................... iv
1 Overview .........................................................................................................................................1
1.1 Commercial Fishery .........................................................................................................................1
1.2 Non-commercial Fishing ..................................................................................................................1
2 Legislation & Advisory Bodies .....................................................................................................2
3 Key Management Controls ...........................................................................................................2
4 Assessment History ......................................................................................................................3
5 Licence & Symbol Summary ........................................................................................................4
5.1 Commercial fishing authorities / fishery symbols .............................................................................4
5.2 Trends in commercial fishing authorities .........................................................................................4
6 Commercial Catch & Effort ...........................................................................................................7
6.1 Effort ................................................................................................................................................7
6.2 Effort distribution ..............................................................................................................................7
6.3 Catch ................................................................................................................................................7
6.4 Species Composition .................................................................................................................... 10
6.5 Bycatch ......................................................................................................................................... 10
6.6 Species of Conservation Interest .................................................................................................. 10
7 References ................................................................................................................................... 11
8 Appendix ...................................................................................................................................... 13

iv
Summary
Feature Details
Species targeted Commercial—Barramundi, king threadfin, blue threadfin, tropical shark and grey
mackerel.
Fisheries symbols Net fishing
N3—Set mesh net
N11—Small mesh netting
N12—Set mesh net
N13—Set mesh net
Fisheries Legislation Fisheries Act 1994; Fisheries (General) Regulation 2019; Fisheries (Commercial
Fisheries) Regulation 2019; Fisheries Declaration 2019
Working Group No
Harvest Strategy No
Gear The following apparatus are currently permitted for use within the Gulf of
Carpentaria Inshore Fin Fish Fishery:
Large mesh set gillnets
Small mesh gillnets
Cast nets
Scoop net
For a full description of the types of apparatus prescribed for each fishery symbol
refer to the Fisheries (Commercial Fisheries) Regulation 2019.
Main management
methods
Commercial only
Permanent and seasonal spatial closures
Minimum and maximum size limits
No-take species
Gear restrictions
Limited Access
Vessel & tender restrictions
Quota 50t TACC applies to the hammerhead shark complex.
Fishing Season 1 January to 31 December
Barramundi closures apply to all fishers from midday on 7 October to midday on 1
February every year
Commercial Fishery
Symbols
Number of Net symbols—N3 = 85; N12 = 3; N13 = 1; N11 = 281.*
Number of charter operations—351 state-wide.
*N11 can be used on both the Queensland east coast and in the Gulf of
Carpentaria. Symbol numbers correct as of 1 July 2017

v
Total annual harvest Commercial: 1939t
GVP $15.6 Million
Stock Status Appendix C
Approvals under the
EPBC Act (Part 13 &
13A)
Part 13: Accredited
Part 13A: Declared Wildlife Trade Operation (expires 18 March 2022)

Gulf of Carpentaria Inshore Fin Fish Fishery, Scoping Study, Department of Agriculture and Fisheries 2019 1
1 Overview
1.1 Commercial Fishery
The Gulf of Carpentaria Inshore Fin Fish Fishery (GOCIFFF) extends from Slade Point near the tip of
Cape York Peninsula westward to the Queensland – Northern Territory border and operates in all tidal
waterways. A net-only fishery, operators target a wide range of species including barramundi, grey
mackerel, king threadfin, blue threadfin, and tropical sharks (primarily whaler sharks) at varying depths.
Due to the similarities in fishing methods and target species, the GOCIFFF is frequently compared to
the net sector of the East Coast Inshore Fin Fish Fishery (ECIFFF). The GOCIFFF though is much
smaller in terms of licence numbers and annual catch and effort levels. The licencing system used in
the GOCIFFF is also simpler; consisting of just four fishery symbols (N3, N11, N12 and N13) compared
to 17 in the ECIFFF (Department of Agriculture and Fisheries, 2019). Of the GOCIFFF symbols in
operation, the majority of catch and effort is reported against the N3 fishery symbol. This symbol
operates in estuarine and foreshore waters out to a 7nm limit. The fishing area of the N12 fishery symbol
is based further offshore and is restricted to waters between the 7nm limit and the boundary of the
Australian Fishing Zone (AFZ). The fishing area of the N13 fishery symbol is more restrictive with
operators not permitted to fish within 25nm of the Queensland coastline (Appendix A).
In addition to the fishing area, there are key nuances between the gear permitted for use under each
symbol (Appendix B) and the primary target species. N3, N12 and N13 operations are all permitted to
target barred javelin, black jewfish, blue threadfin, king threadfin, queenfish and scaly jewfish. However,
only N3 operators can actively fish for or target barramundi. Similarly only N12 and N13 operators are
permitted to target shark, other than white shark, sand tiger / grey nurse shark or speartooth shark.
Outside of these species, GOCIFFF operations are permitted to retain a wide range of fin fish species
except for barramundi in the N12/N13 fishery and any regulated coral reef fin fish species (Appendix B).
The fourth fishery symbol, the N11 or small mesh net fishery, differs from the other net symbols in that
it can be used on both the Queensland east coast and in the Gulf of Carpentaria. While the N11 is the
most numerous net symbol, it makes only a minor contribution to annual GOCIFFF catch and effort
levels. N11 operations are limited to the use of cast, mesh scoop or seine nets and the symbol is subject
to more stringent restrictions on mesh size and net length (Appendix B). Species permitted to be retained
for sale under the N11 symbol include garfish, mullet and other fin fish, excluding barramundi and
regulated coral reef fin fish (Appendix B).
1.2 Non-commercial Fishing
As the GOCIFFF is a net-only fishery, it does not have a corresponding recreational or charter fishing
sector. However, both recreational and charter fishing occurs in the Gulf of Carpentaria with the
Statewide Recreational Fishing Survey 2013–14 (Webley et al., 2015) identifying mullet, javelin,
barramundi, threadfins and tropical snappers as some of the more abundantly harvested species. A
number of these species are susceptible to capture in the GOCIFFF; particularly the N3 fishery that
operates in estuarine and nearshore environments.
In addition to the commercial fishing sector, GOCIFFF species will be harvested by Aboriginal peoples
and Torres Strait Islander peoples. Data on catch and effort levels for Aboriginal peoples and Torres
Strait Islander peoples in the Gulf of Carpentaria is limited and the sector is considered the least
Gulf of Carpentaria Inshore Fin Fish Fishery, Scoping Study, Department of Agriculture and Fisheries 2019 2
understood. However, DAF anticipates that this sector has comparatively low levels of effort with teleost
catch compositions aligning closely with the recreational fishing sector.
Additional information on the Queensland Statewide Recreational Fishing Survey is available at:
https://www.daf.qld.gov.au/business-priorities/fisheries/monitoring-our-fisheries/recreational-
fisheries/statewide-and-regional-recreational-fishing-survey.
2 Legislation & Advisory Bodies
The GOCIFFF is managed in accordance with the broader objectives of the Fisheries Act 1994 and its
subordinate legislation. The harvest of some species including grey mackerel, sharks and rays are also
managed through the Queensland Fisheries Joint Authority (QFJA). The QFJA includes representatives
from the Commonwealth and Queensland Governments and the body is responsible for the
management of the GOCIFFF, the Gulf of Carpentaria Line Fishery and the Gulf of Carpentaria
Developmental Fin Fish Trawl Fishery in the areas fished adjacent to Queensland state waters
(Australian Fisheries Management Authority, 2017).
Prior to 2011, the GOCIFFF was managed through the Fisheries (Gulf of Carpentaria Inshore Fin Fish)
Management Plan 2009. In November 2011, the Management Plan was repealed and the management
strategy consolidated into the broader Fisheries Regulation 2008. Since this has been repealed, the
GOCIFFF is now managed under subordinate legislation of the Fisheries Act 1994 including Fisheries
(Commercial Fisheries) Regulation 2019, Fisheries (General) Regulation 2019, and Fisheries
Declaration 2019. While the fishery does not operate under a management plan, the Queensland
Sustainable Fisheries Strategies (the Strategy) identifies the development of harvest strategies as one
of the major areas of reform (Department of Agriculture and Fisheries, 2017; 2018). The development
of harvest strategies will be largely driven through Fisheries Working Groups (FWG) established under
the Strategy. These groups include a wide range of stakeholders from the scientific community,
management agencies, conservation groups and the commercial and recreational fishing sectors.
3 Key Management Controls
The management regime for GOCIFFF relies heavily on input controls to restrict catch and effort with a
limited licencing policy, gear restrictions, spatial closures and seasonal closures all used in the fishery.
A 14m maximum boat length restriction applies to the N3 fishery symbol with this length increasing to
20m and 25m for the N11 and N12/13 fishery symbols respectively. While gear restrictions apply to all
net operations, rules governing the use of the N3 fishery symbol are more complex (Appendix B). This
increase in regulation is primarily due to a) N3 fishers operating in a wider array of environments (e.g.
creeks, rivers and nearshore waters) and b) the need to manage effort targeted at key species or species
complexes (Appendix A). For example, provisions relating to the use of an N3 fishery symbol in offshore
waters (i.e. >2m depth and <7nm from shore) are specifically designed to reduce the impact of the
fishery on regional shark and grey mackerel stocks (pers. comm. B. Zeller). Evidently, this was one of
the reasons why the fishery was subdivided into two separate regions i.e. N3 and N12/N13 symbol areas
(formally the N9 symbol area) (Appendix A).
With the exception of hammerhead sharks, Total Allowable Commercial Catch (TACC) limits are not
used to manage the harvest of target and byproduct species in the GOCIFFF. Given this, output controls
used in the GOCIFFF are limited to no-take species, size restrictions (minimum and maximum legal size
Gulf of Carpentaria Inshore Fin Fish Fishery, Scoping Study, Department of Agriculture and Fisheries 2019 3
limits) and in possession limits for key species or species groupings (e.g. mangrove jack, a combined
in possession limit of five guitarfish and/or shovelnose rays).
When compared to the Queensland east coast, the system of spatial closures used in the Gulf of
Carpentaria is less expansive. The main reason for this is that the Queensland east coast has a more
developed system of State and Commonwealth marine parks. This situation changed somewhat on 1
July 2018 when the North Marine Parks Network came into effect through Commonwealth legislation
and commercial net fishing was prohibited in key sections of the Gulf of Carpentaria (Director of National
Parks, 2018). In addition to spatial closures, a seasonal closure applies to the take and targeting of
barramundi from midday 7 October to midday 1 February (but possession on boats is allowed until
midday 17 October). This closure includes waters throughout the Gulf of Carpentaria and adjoining
waterways west and south of the intersection of longitude 142°09'E with the shore at high tide and is
applicable to both commercial and recreational fishers.
Refer to the Fisheries Act 1994 and its subordinate legislation for a full account of the rules governing
the use of the N3, N11, N12, and N13 fishery symbols (available at: https://www.legislation.qld.gov.au/).
The indigenous sector is also managed in consideration of the Native Title Act 1993.
4 Assessment History
A comprehensive ERA was completed for all Queensland-managed fisheries in the Gulf of Carpentaria
(Zeller & Snape, 2006). This report was based on the Fisheries-Ecological Sustainable Development
Reporting Framework (Fletcher et al., 2005) and provides relative risk levels for 47 retained species, 45
non-retained species and 44 general ecosystem components (Zeller & Snape, 2006). This report found
that at least two target species were considered to have a high sustainability risk––grey mackerel and
guitarfish. A further 16 target (e.g. Spanish mackerel, red snappers, barramundi, threadfins, sharks and
mud crabs) and non-target (bottlenose dolphins, speartooth sharks and sawfish) species were
considered to have a moderate sustainability risk.
Barramundi has been the subject of a two detailed stock assessments, one in 2008 (Campbell et al.,
2008) and a more recent assessment focusing specifically on the southern Gulf of Carpentaria stock
(Campbell et al., 2017). The southern Gulf of Carpentaria stock is one of two that occur in the region
and it produces (on average) over half of Queensland’s commercial barramundi harvest. This
assessment indicates that while the stock is above critical biomass levels it was below that required to
meet Maximum Economic Yield (MEY) and/or the long-term targets outlined in the Queensland
Sustainable Fisheries Strategy 2017–2027 (Campbell et al., 2017).
Outside of barramundi, a detailed stock assessment was undertaken for a number of whaler and
hammerhead shark species (Leigh, 2015). The Gulf of Carpentaria was included in the study area and
it provided biomass estimates for a number of the species retained for sale in the GOCIFFF. This report
generally found that harvest rates for key species were lower than the Maximum Sustainable Yield
(MSY) i.e. they were being fished sustainably. However, the study also noted concerns about data
quality and the availability of data on shark discard rates (Leigh, 2015).
In addition to the stock assessments, a number of the target species including barramundi, grey
mackerel, king threadfin, and several shark species have been assigned an indicative sustainability
status through the Queensland stock status and National Status of Australian Fish Stocks (SAFS)
processes (www.fish.gov.au). A full list of the species assessed as part of SAFS or the Queensland
Stock Status process has been provided in Appendix C. This list is likely to expand through time as one
Gulf of Carpentaria Inshore Fin Fish Fishery, Scoping Study, Department of Agriculture and Fisheries 2019 4
of the broader SAFS objectives is to increase the number of species that are subject to stock status
assessments.
As the GOCIFFF is export approved, the fishery undergoes broad-scale sustainability assessments as
part of the Wildlife Trade Operation (WTO) approvals process. A WTO approval is issued under the
Environment Protection and Biodiversity Conservation Act 1999 (EPBC Act) and is required for all
fisheries that export product derived from native species caught and retained in Australian waters. The
WTO approval effectively signifies that a fisheries as a whole is being managed sustainably.
Stock assessments undertaken by DAF are publically available through the Departments Fish Stock
Assessment Reports page (https://www.daf.qld.gov.au/business-priorities/fisheries/monitoring-
compliance/data/sustainability-reporting/fish-stock-status-reports). Additional information on the stock
status assessments of each species can be obtained through the SAFS website (http://fish.gov.au/).
5 Licence & Symbol Summary
5.1 Commercial fishing authorities / fishery symbols
Access to Queensland’s commercial fisheries is managed using fishery symbols. These symbols, in
effect, define what gear can be used in each fishery (e.g. N = Net, L = line, T = trawl) and the area of
operation. While operators can have multiple fishery symbols (e.g. N1, N2 and L1 or a L1 and T1)
attached to their commercial fishing boat licence, they can only use one fishery symbol at a time. The
notable exceptions to this are a) the crab (C1) fishery symbol that can be used in conjunction with a line
(L) and net (N) fishery symbol; and b) fishing symbols related to quota such as those used in the Coral
Reef Fin Fish Fishery and the East Coast Spanish Mackerel Fishery. In each fishery, the total number
of symbols represents the number of fishers that could potentially access the fishery at any given time.
This differs from data on the number of ‘active’ licences which represents the number of operators that
have used their symbol to access the fishery at some point over a 12 month period.
While operators can access the GOCIFFF using all four net symbols, the majority of the catch and effort
is reported from large mesh net fisheries (N3, N12, N13). As these fisheries account for the majority of
the reported catch and effort and they are viewed as the primary net endorsements (Table 1; Fig. 1).
The remainder of the net symbols belong to the small mesh net fishery (N11) which operates on both
the Queensland east coast and in the Gulf of Carpentaria. While the small mesh net fishery has more
symbols than the N3, N12 and N13 combined (Table 1), it has a vastly different risk profile. This fishery
tends to have smaller catches, is more localised and targets smaller species with a strong capacity to
rebound after potential decline. This sub-fishery also makes a smaller contribution to the overall
GOCIFFF catch and effort. Given these factors, the N11 is viewed as secondary net endorsements
and it should not be given equal status to the N3, N12 or N13 fisheries.
5.2 Trends in commercial fishing authorities
The total number of fishing symbols able to access the GOCIFFF has declined through time. These
declines are driven largely by the number of N11 (small mesh net) symbols that reduced from a state-
wide peak of 1832 (2000) to less than 400 (Table 1, Fig, 1a). In contrast, the number of primary net
symbols (N3, N12, N13) have declined by around 20% since the pre-2000 period (Table 1, Fig.1b). Part
of this decline can be attributed to a number of historical management initiatives that enabled fishers to
amalgamate fishery symbols. For example, in order to access the now superseded N9 fishery operators
were required to surrender two N3 fishery symbols (Department of Primary Industries, 2004).

Gulf of Carpentaria Inshore Fin Fish Fishery, Scoping Study, Department of Agriculture and Fisheries 2019 5
Table 1. An overview of the total number of net (N) fishery symbols that can potentially access the
GOCIFFF, and the number of active licences. Total active licences are non-cumulative over the five
symbols as operators may report catch from multiple categories e.g. the N3 and N11.
Year
No. Symbols
Total Active
licences Primary Secondary
N3 N9** N12 N13 N11*
1995 57 - - - 1035 1092 92
1996 65 - - - 1227 1292 96
1997 76 - - - 1515 1591 97
1998 97 - - - 1748 1845 100
1999 105 - - - 1844 1949 96
2000 95 5 - - 1832 1932 88
2001 95 5 - - 1735 1835 99
2002 93 5 - - 1724 1822 97
2003 90 5 - - 1717 1812 94
2004 90 5 - - 1709 1804 96
2005 87 5 - - 1694 1786 88
2006 87 5 - - 1588 1670 93
2007 87 5 - - 1571 1663 96
2008 87 5 - - 1571 1663 91
2009 87 5 - - 1454 1546 91
2010 87 5 - - 323 415 87
2011 87 5 - - 323 415 81
2012 87 5 - - 323 415 87
2013 87 - 3 - 319 409 83
2014 87 - 3 - 318 408 74
2015 86 - 3 1 305 395 71
2016 85 - 3 1 292 381 77
2017 85 - 3 1 281 370 79
* Data includes N6 and N7 fishery symbols which were superseded by the N11 fishery symbol as part of a broader
management reform process targeted at net fishing operations on Queensland east coast. ** The N9 was phased
out subsequent to the 2009–11 GOCIFFF review.

Gulf of Carpentaria Inshore Fin Fish Fishery, Scoping Study, Department of Agriculture and Fisheries 2019 6
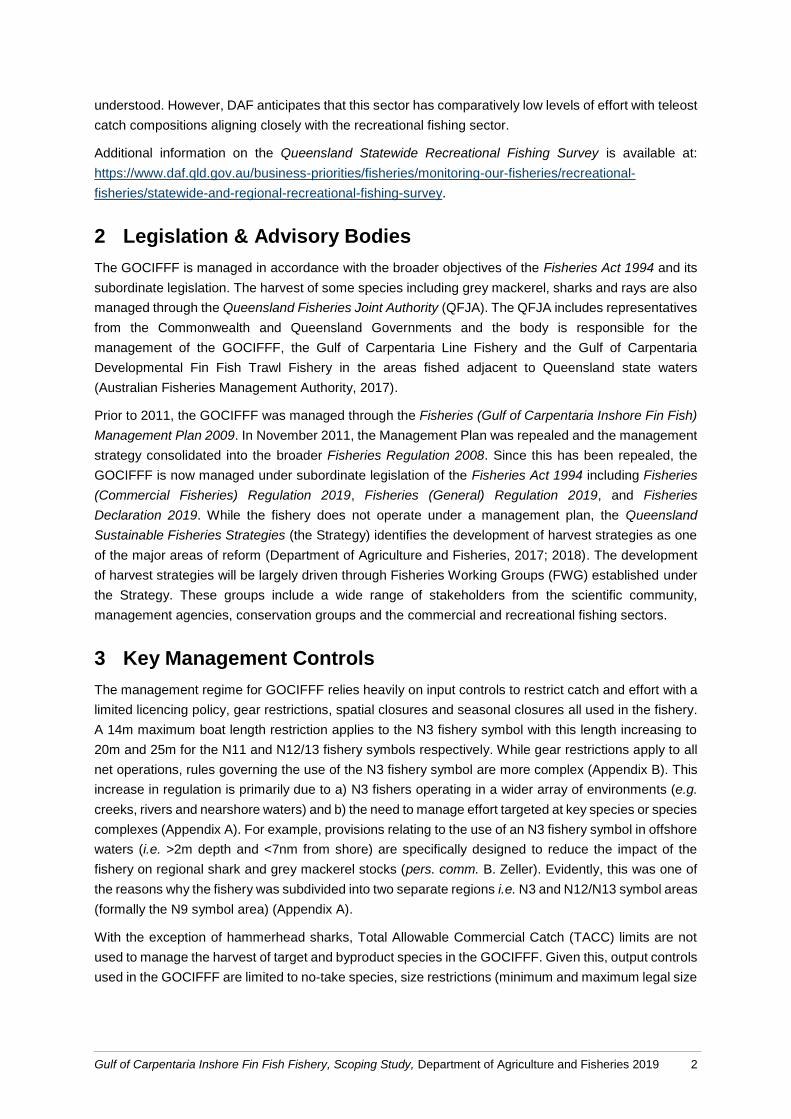
Figure 1. Comparisons between the total number of net symbols able to access the GOCIFFF and the
numer of active licences: (a) including data on the number of N11 fishery symbol and (b) excluding data
on the number of N11 symbols (Table 1).
The number of licences accessing the fishery (i.e. the number of active licences) has declined by
approximately 20% since the pre-2000 period (Table 1). As catch is assigned to method and not fishery
symbol it is difficult to ascertain what proportion of this decline can be attributed to the reduced number
of N11 symbols (Fig. 1a). However, the relative closeness between the number of primary (N3, N12 and
N13) symbols and the number of active licences suggests that a high percentage of these symbols are
used in the fishery. It is noted though that the monitoring systems used by DAF classifies any licence
as ‘active’ if the operator has reported catch from that fishery in a given year; irrespective of the size of
the catch or the fishing frequency.
Without management intervention, the number of fishing symbols available for use in the GOCIFFF is
expected to remain at or around 2017 levels (Table 1, Fig. 1a). This is primarily because Queensland
0
250
500
750
1000
1250
1500
1750
20001
99
5
19
96
19
97
19
98
19
99
20
00
20
01
20
02
20
03
20
04
20
05
20
06
20
07
20
08
20
09
20
10
20
11
20
12
20
13
20
14
20
15
20
16
20
17
No
. Sym
bo
ls
(a) N3 N9, N12, N13 N11 (bait) Active
0
10
20
30
40
50
60
70
80
90
100
110
120
19
95
19
96
19
97
19
98
19
99
20
00
20
01
20
02
20
03
20
04
20
05
20
06
20
07
20
08
20
09
20
10
20
11
20
12
20
13
20
14
20
15
20
16
20
17
No
. Sym
bo
ls
(b)N3 N9, N12, N13 Active

Gulf of Carpentaria Inshore Fin Fish Fishery, Scoping Study, Department of Agriculture and Fisheries 2019 7
operates under a limited entry policy that prevents new licences being issued for the fishery. While this
does not prevent the re-activation of underutilised licences, it will prevent licence numbers expanding
into the future. DAF anticipates that the total number of GOCIFFF symbols will continue to decline
through time due to natural attrition (i.e. surrenders).
6 Commercial Catch & Effort
6.1 Effort
The number of days fished in the GOCIFFF peaked in 2001 before the fishery experienced a period of
progressive declines that resulted in effort reducing by over 30% (Table 2). Given the timing of the
declines, particularly in 2011, it is likely that management reform processes contributed to this reduction.
These declines stabilised in 2013 and effort has trended upwards since 2015 (Table 2; Fig. 2a). This
increase can be partly attributed to a corresponding increase in the number of licences that are operating
in the fishery (Table 1).
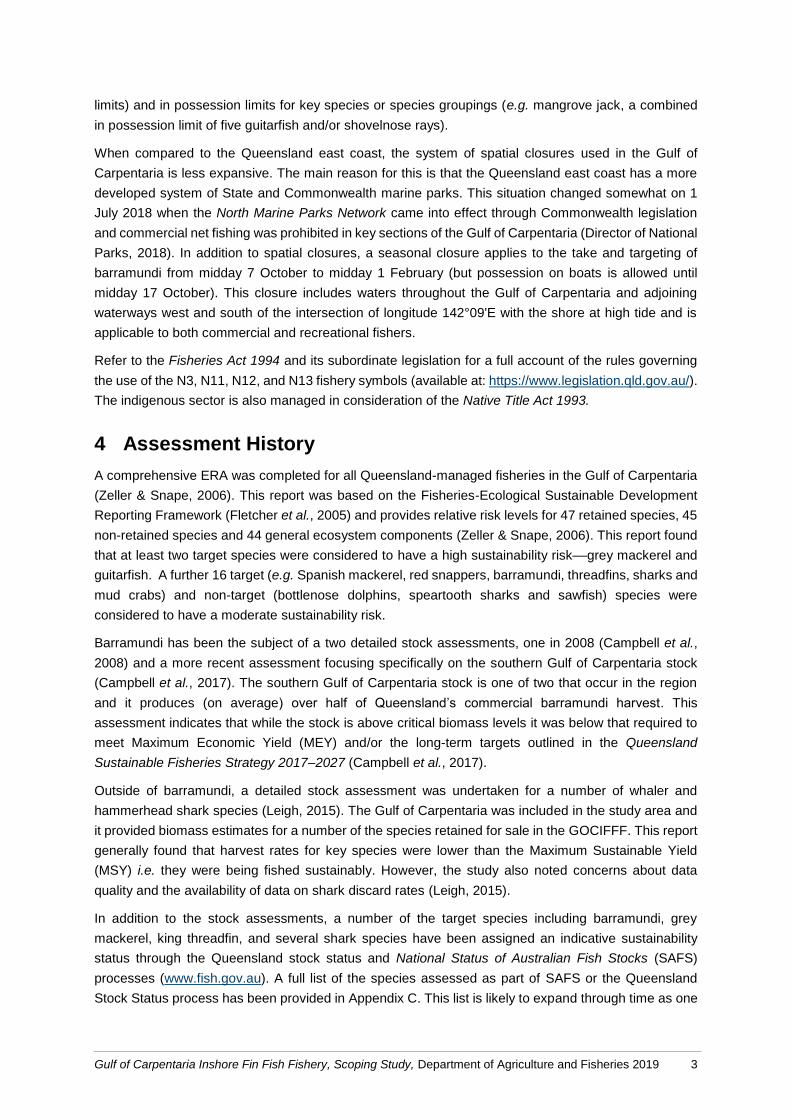
Over the last 10 years, effort levels in the GOCIFFF have fluctuated at and around 9,000 days fished
(range = 6901–10,173 days fished). This is well below that reported in the net sector of the ECIFFF
where the annual effort ranges from 16,000 to 27,000 days fished (2008–2017 data). This discrepancy
largely relates to the GOCIFFF having fewer fishing symbols and a smaller number of active net licences
(2017 data: GOCIFFF = 79 active net licences; ECIFFF = 273 active net licences) (Fig, 2b).
6.2 Effort distribution
Effort in the GOCIFFF is dispersed across the southern and eastern coastlines of the Gulf of
Carpentaria. The majority of effort is concentrated in the south eastern region of the Gulf of Carpentaria
and along the northern coastline i.e. waters adjacent to Weipa (Appendix D). Effort maps for 2015, 2016
and 2017 indicate that all of the effort is utilised in areas managed under N3 and N12 fishery symbols
(Appendix D).
6.3 Catch
Data for the GOCIFFF shows that total catch increased gradually from around 1500t in 1991 to 2600t
2011 (Table 2, Fig. 2a) before stabilising at around 2000–2300t per year. After which, there is a notable
decline in the amount of product being retained in this fishery. This decline mirrors trends observed in
the effort data and will be influenced by a range of factors including the aforementioned changes to
management, economic or operational constraints (e.g. increased overheads, declining services and
infrastructure) and environmental factors. For example, research has shown that annual rainfall and
water flows exert considerable influence on the recruitment rates of barramundi (Halliday et al., 2007;
Campbell et al., 2017) and on the health of habitats used as nursery areas for a number of the
commercial species.
As with the effort data, the total annual catch in the GOCIFFF was lower than the ECIFFF (Fig. 2c). This
differential can be largely attributed to the elevated catches of mullet, bream, flathead and whiting on
the Queensland east coast. In the case of mullet, the overwhelming majority of this product (1613t in
2017) is retained in the ocean beach fishery that operates in south east Queensland (Department of
Agriculture and Fisheries, 2019). A fishing sector analogous to the ocean beach fishery does not exist
in the GOCIFFF.

Gulf of Carpentaria Inshore Fin Fish Fishery, Scoping Study, Department of Agriculture and Fisheries 2019 8
Table 2. An overview of annual catch and effort statistics for species comprising the bulk of the historical catch in GOCIFFF.
Year
Whole Fishery Catch (t) of Key Species
Effort Catch CPUE
(kg/day)
Ma
cke
rel
- g
rey
Barr
am
un
di
Th
rea
dfi
n -
kin
g
Sh
ark
- A
us
tralia
n
bla
ck
tip
Bla
ck
tip
wh
ale
r
sh
ark
Th
rea
dfi
n -
blu
e
Ma
cke
rel
-
Sp
an
ish
Fis
h -
un
sp
ec
ifie
d
Je
we
l
Sh
ark
-
C.
so
rrah
Ham
me
rhea
d
sh
ark
Qu
ee
nfi
sh
-
un
sp
ecif
ied
Gru
nte
r -
un
sp
ecif
ied
Sh
ark
-
un
sp
ecif
ied
1996 11929 1697 142.3 241 556 295 - - 92 16 34 23 - - 15 22 346
1997 11435 1575 137.7 376 452 245 - - 54 11 27 12 - - 15 16 319
1998 12174 1817 149.3 370 572 336 - - 71 15 25 19 - - 16 13 344
1999 12527 2071 165.3 308 723 428 - - 123 21 24 16 - - 13 26 360
2000 11656 1909 163.8 419 611 318 - - 40 25 27 22 - - 9 16 390
2001 12576 2301 183.0 471 723 473 - - 67 21 52 33 - - 15 25 373
2002 12355 2217 179.5 345 744 445 - - 83 24 32 48 - - 26 34 391
2003 11895 2038 171.3 379 551 296 - - 106 18 53 51 - - 23 31 474
2004 12123 2211 182.4 468 615 310 3 - 126 29 30 52 1 - 35 51 366
2005 9995 1876 187.7 394 500 283 1 - 81 33 33 33 0 - 17 26 396
2006 11263 2054 182.3 490 735 305 74 - 66 33 35 39 - - 14 19 159
2007 10173 2039 200.5 640 631 248 70 42 59 54 41 38 35 6 22 21 91
2008 9917 2185 220.3 622 726 295 73 103 76 36 38 26 21 10 39 29 47
2009 9464 2137 225.8 482 793 309 118 87 71 32 42 26 18 20 35 19 29
2010 9987 2613 261.7 897 763 378 97 119 63 51 39 30 21 19 53 13 29
2011 9444 2602 275.6 853 966 325 130 60 49 55 43 32 15 9 11 12 12
2012 8961 2365 263.9 767 929 313 95 38 39 50 37 39 16 2 8 11 4
2013 7528 1624 215.8 486 505 176 97 59 40 57 23 38 28 40 7 14 4
2014 7985 1624 203.3 562 457 142 54 69 49 55 25 46 32 45 5 13 3
2015 6901 1560 226.0 718 367 138 59 41 41 40 20 23 22 15 9 11 13
2016 7146 1759 246.1 645 468 169 160 50 54 40 39 20 24 17 20 12 13
2017 8256 1939 234.8 552 668 236 116 75 74 42 41 23 9 5 36 21 15

Gulf of Carpentaria Inshore Fin Fish Fishery, Scoping Study, Department of Agriculture and Fisheries 2019 9
Figure 2. Catch and effort summaries for the GOCIFFF (a) catch and effort trends, (b) effort
comparisons with the ECIFFF and (c) catch comparisons with the ECIFFF.
0
500
1000
1500
2000
2500
3000
19
88
19
89
19
90
19
91
19
92
19
93
19
94
19
95
19
96
19
97
19
98
19
99
20
00
20
01
20
02
20
03
20
04
20
05
20
06
20
07
20
08
20
09
20
10
20
11
20
12
20
13
20
14
20
15
20
16
20
17
0
2000
4000
6000
8000
10000
12000
14000C
atch
(t)
Day
s fi
shed
(a) Catch (t)
Days Fished
0
5,000
10,000
15,000
20,000
25,000
30,000
35,000
40,000
19
88
19
89
19
90
19
91
19
92
19
93
19
94
19
95
19
96
19
97
19
98
19
99
20
00
20
01
20
02
20
03
20
04
20
05
20
06
20
07
20
08
20
09
20
10
20
11
20
12
20
13
20
14
20
15
20
16
20
17
Day
s fi
she
d
(b) ECIFFF
GOCIFFF
0
1,000
2,000
3,000
4,000
5,000
6,000
7,000
19
88
19
89
19
90
19
91
19
92
19
93
19
94
19
95
19
96
19
97
19
98
19
99
20
00
20
01
20
02
20
03
20
04
20
05
20
06
20
07
20
08
20
09
20
10
20
11
20
12
20
13
20
14
20
15
20
16
20
17
Cat
ch (
t)
(c) ECIFFF
GOCIFFF

Gulf of Carpentaria Inshore Fin Fish Fishery, Scoping Study, Department of Agriculture and Fisheries 2019 10
6.4 Species Composition
Management arrangements for the GOCIFFF allows operators to retain a diverse array of species
providing they are not defined as no-take species for that symbol (Appendix B) or a regulated coral reef
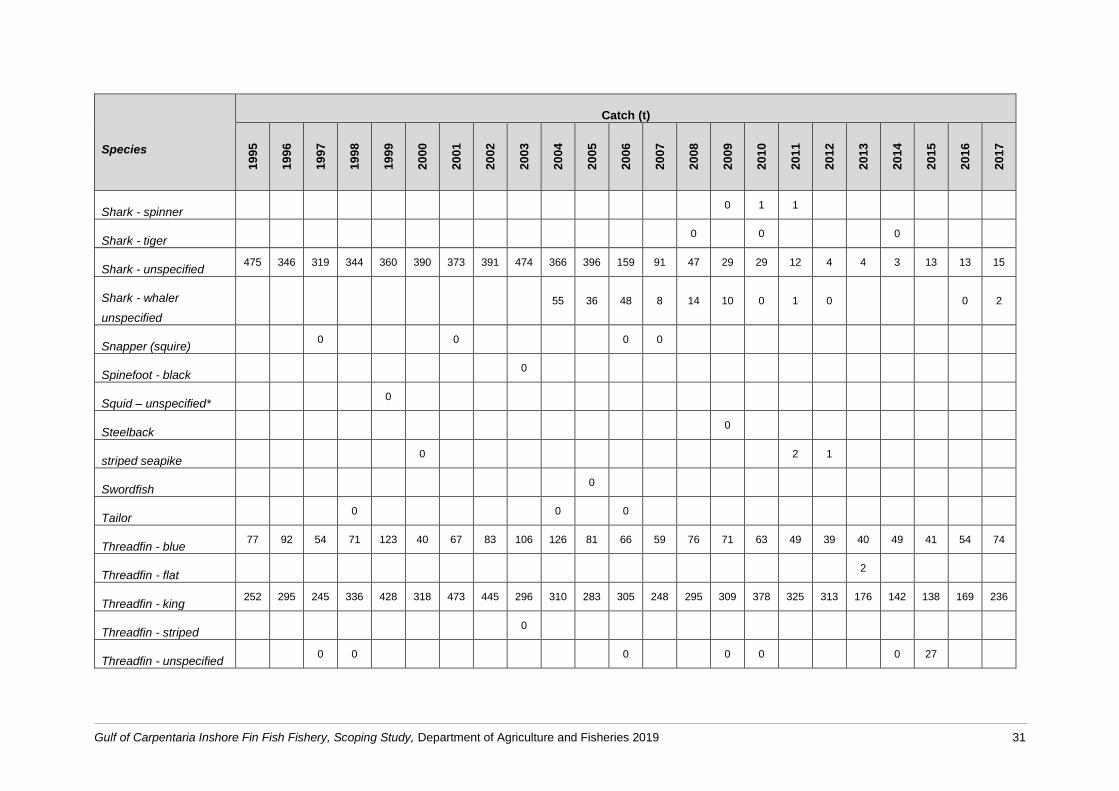
fin fish species. This is reflected in the catch composition data with the fishery reporting retained catch
from over 100 different species or species complexes (Appendix E). However, the bulk of the catch is
made up of a handful of fin fish and shark species. For example, over 90% of the reported catch in 2017
comprised barramundi, grey mackerel, king threadfin, blue threadfin and unspecified shark (Table 2;
Fig. 3). Given this, the majority of the remaining species could be classified as byproduct.
Figure 3. Catch summary for the GOCIFFF. Cumulative species curve representing the retained catch
for 2015, 2016 and 2017.
6.5 Bycatch
As GOCIFFF operators retain a wide range of species it can be difficult to draw a distinction between
those defined as byproduct and bycatch. This situation is compounded by the fact that the definition of
bycatch and byproduct will vary between operators. In most instances, the majority of the bycatch will
consist of small teleosts, benthic elasmobranchs and undersized or poor quality target and byproduct
species (Halliday et al., 2001). While there is limited data on invertebrate interactions, some species are
likely to become entangled within a net as part of the fishing event. This will include crab and squid
species that could be retained for sale under previous management regimes (Appendix E).
6.6 Species of Conservation Interest
Logbook data reveal few interactions with species of conversation interest (SOCI). Interactions are
defined as any physical contact with a protected species, including interactions with fishing gear and
vessel collisions. The logged interactions since 2003 include cetaceans, turtles, crocodiles, sawfish and
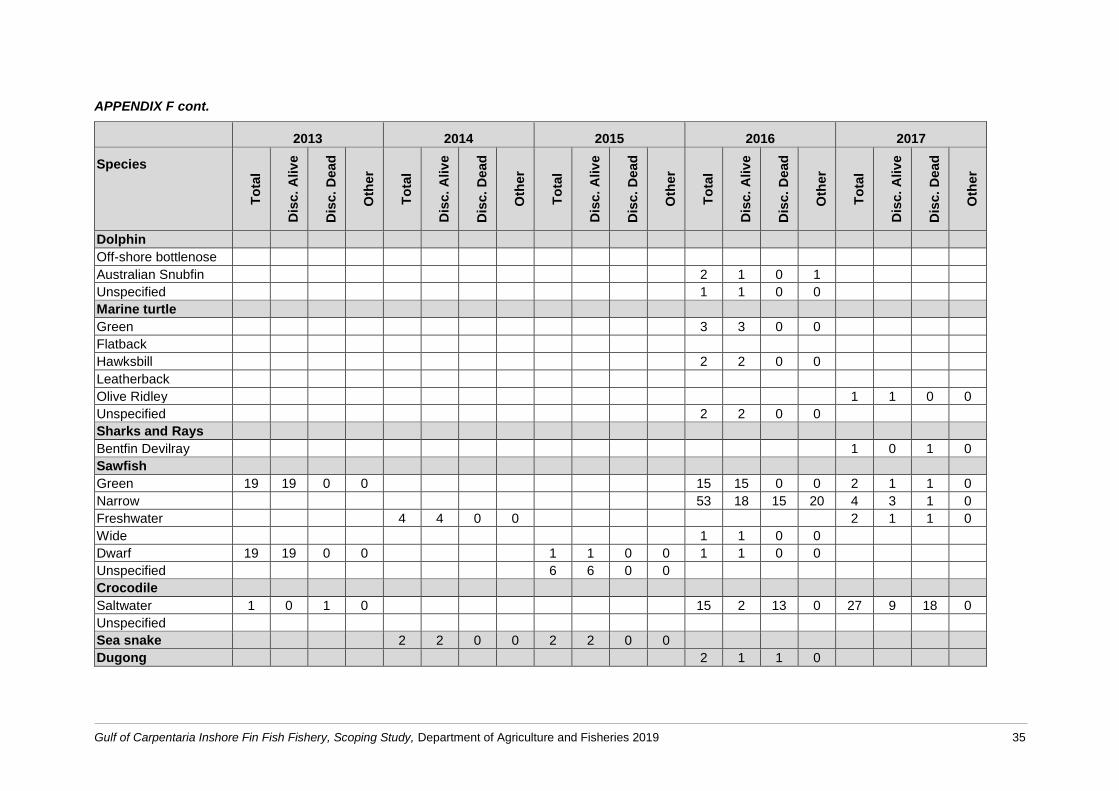
rays, dugongs and sea snakes (Table 3). Appendix F gives the full break down of logged SOCI
interactions by species. Sawfish make up the bulk of interactions, with crocodiles and marine turtles
also making notable contributions to the total number of interactions in the GOCIFFF. When compared
to non-anchored gillnetting, anchored gillnets have a higher proportion of interactions where animals
are released dead; 9% vs. 42%.
30
40
50
60
70
80
90
100
1 4 7 10 13 16 19 22 25 28 31 34 37 40 43 46 49 52 55 58 61 64 67 70 73 76 79 82 85 88 91 94 97
Cat
ch C
om
po
stio
n (
%)
No. Species
2015
2016
2017

Gulf of Carpentaria Inshore Fin Fish Fishery, Scoping Study, Department of Agriculture and Fisheries 2019 11
Table 3. Summary of interactions reported in the Species of Conservation Interest (SOCI) logbook by
fishers operating in the Gulf of Carpentaria Inshore Fin Fish Fishery (GOCIFFF). Data includes all
records encompassing Gillnetting and Anchored Gillnetting fishing operations. *Relates to species that
are subject to additional reporting requirements.
Species
Year
To
tal
20
03
20
04
20
05
20
06
20
07
20
08
20
09
20
10
20
11
20
12
20
13
20
14
20
15
20
16
20
17
Whales 0 0 0 0 0 0 0 0 0 0 0 0 0 0 0 0
Dolphins 0 0 0 0 1 1 0 0 0 0 0 0 0 3 0 5
Marine turtles
2 1 5 2 10 0 0 9 2 1 0 0 0 7 1 40
Sharks* 0 0 0 0 0 0 0 0 0 0 0 0 0 0 0 0
Sawfishes & Rays*
4 40 24 0 21 12 15 129 20 2 38 4 7 70 9 395
Crocodiles 7 1 0 0 1 10 8 0 3 5 1 0 0 15 27 78
Seabirds 0 0 0 0 0 0 0 0 0 0 0 0 0 0 0 0
Sea snakes 0 0 0 0 0 0 0 0 0 0 0 2 2 0 0 4
Teleosts 0 0 0 0 0 0 0 0 0 0 0 0 0 0 0 0
Dugongs 0 0 0 0 0 0 0 0 0 0 0 0 0 2 0 2
Syngnathids 0 0 0 0 0 0 0 0 0 0 0 0 0 0 0 0
Non-SOCI reports
0 0 0 0 0 0 0 0 0 0 0 0 0 0 0 0
7 References
Australian Fisheries Management Authority (2017). Queensland Fisheries Joint Authority: report for the period 1 July 2016 to 30 June 2017. Available at http://www.afma.gov.au/fisheries/joint-authority-fisheries/ (Accessed 23 May 2018).
Campbell, A. B., O'Neill, M. F. & Officer, R. (2008). Assessment of the barramundi fishery in Queensland, 1989-2007. Department of Primary Industries and Fisheries, Queensland Government. Brisbane, Queensland.
Campbell, A. B., Robins, J. & O'Neill, M. F. (2017). Assessment of the barramundi (Lates calcarifer) fishery in the Southern Gulf of Carpentaria, Queensland, Australia. Department of Agriculture and Fisheries, Queensland Government. Brisbane, Queensland.
Department of Agriculture and Fisheries (2017). Queensland Sustainable Fisheries Strategy 2017–2027. Available at https://www.daf.qld.gov.au/business-priorities/fisheries/sustainable/sustainable-fisheries-strategy (Accessed 11 April 2019).

Gulf of Carpentaria Inshore Fin Fish Fishery, Scoping Study, Department of Agriculture and Fisheries 2019 12
Department of Agriculture and Fisheries (2018). Queensland Fisheries Harvest Strategy. Available at https://www.daf.qld.gov.au/business-priorities/fisheries/sustainable/sustainable-fisheries-strategy (Accessed 2018).
Department of Agriculture and Fisheries (2019). Scoping Study - East Coast Inshore Fin Fish Fishery (ECIFFF). Department of Agriculture and Fisheries, Queensland Government. Brisbane, Australia.
Department of Primary Industries (2004). By-catch Action Plan 2004 for the Gulf of Carpentaria Indienous, Recreational and Commercial Fisheries.: State of Queensland, Department of Primary Industries.
Director of National Parks (2018). Australian Marine Parks, North Marine Parks Network Management Plan 2018. Director of National Parks, Australian Government. Canberra, ACT.
Fletcher, W. J., Chesson, J., Sainsbury, K. J., Hundloe, T. J. & Fisher, M. (2005). A flexible and practical framework for reporting on ecologically sustainable development for wild capture fisheries. Fisheries Research 71, 175-183.
Halliday, I., Ley, J., Tobin, A., Garrett, R., Gribble, N. & Mayer, D. (2001). The effects of net fishing : addressing biodiversity and bycatch issues in Queensland inshore waters. Deception Bay, Qld: Dept. of Primary Industries, Southern Fisheries Centre.
Halliday, I. A., Saunders, T., Sellin, M. J., Allsop, Q., Robins, J. B., McLennan, M. & Kurnoth, P. (2007). Flow impacts on estuarine finfish fisheries of the Gulf of Carpentaria. Department of Agriculture, Fisheries and Forestry, Queensland Government. Brisbane, Queensland.
Leigh, G. M. (2015). Stock assessment of whaler and hammerhead sharks (Carcharhinidae and Sphyrnidae) in Queensland. Department of Agriculture and Fisheries, Queensland Government. Brisbane, Queensland. http://era.daf.qld.gov.au/id/eprint/5146/
Webley, J., McInnes, K., Teixeira, D., Lawson, A. & Quinn, R. (2015). Statewide Recreational Fishing Survey 2013-14. Queensland Government. Brisbane, Australia.
Zeller, B. & Snape, N. (2006). Ecological Risk Assessment of Queensland-Managed Fisheries in the Gulf of Carpentaria. Department of Primary Industries and Fisheries, Queensland Government. Brisbane, Australia. https://www.daf.qld.gov.au/__data/assets/pdf_file/0003/61671/EcolRiskAssess-GOC-ERA.pdf
Gulf of Carpentaria Inshore Fin Fish Fishery, Scoping Study, Department of Agriculture and Fisheries 2019 13
8 Appendix
Appendix A—Fishing area boundaries for key net fishing symbols used in the GOCIFFF.
Appendix B—Summary of key provisions used to govern net fishing symbols in the GOCIFFF.
Appendix C—Summary of the species assessed as part of the QLD stock status and SAFS
processes.
Appendix D—Effort distribution maps for the 2015, 2016 and 2017.
Appendix E—Complete overview of the GOCIFFF catch from 1990–2017 inclusive.
Appendix F—Detailed overview of the SOCI interactions reported from the GOCIFFF.

Gulf of Carpentaria Inshore Fin Fish Fishery, Scoping Study, Department of Agriculture and Fisheries 2019 14
APPENDIX A—Fishing area boundaries for the fishery symbols (N3, N11, N12, N13) permitted for use
in the Gulf of Carpentaria Inshore Fin Fish Fishery (GOCIFFF).

Gulf of Carpentaria Inshore Fin Fish Fishery, Scoping Study, Department of Agriculture and Fisheries 2019 15
APPENDIX A cont.—Fishing area boundaries for the fishery symbols (N3, N11, N12, N13) permitted
for use in the Gulf of Carpentaria Inshore Fin Fish Fishery (GOCIFFF).

Gulf of Carpentaria Inshore Fin Fish Fishery, Scoping Study, Department of Agriculture and Fisheries 2019 16
APPENDIX A cont.—Fishing area boundaries for the fishery symbols (N3, N11, N12, N13) permitted
for use in the Gulf of Carpentaria Inshore Fin Fish Fishery (GOCIFFF).

Gulf of Carpentaria Inshore Fin Fish Fishery, Scoping Study, Department of Agriculture and Fisheries 2019 17
APPENDIX A cont.—Fishing area boundaries for the fishery symbols (N3, N11, N12, N13) permitted
for use in the Gulf of Carpentaria Inshore Fin Fish Fishery (GOCIFFF).
Gulf of Carpentaria Inshore Fin Fish Fishery, Scoping Study, Department of Agriculture and Fisheries 2019 18
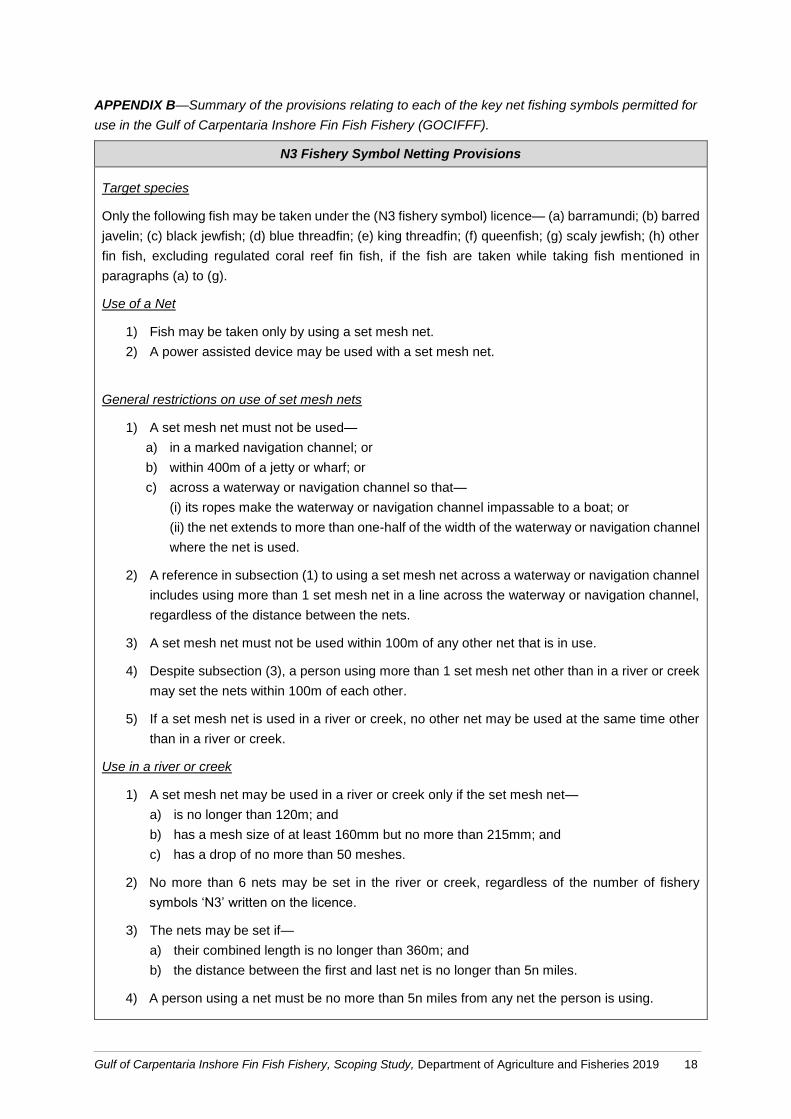
APPENDIX B—Summary of the provisions relating to each of the key net fishing symbols permitted for
use in the Gulf of Carpentaria Inshore Fin Fish Fishery (GOCIFFF).
N3 Fishery Symbol Netting Provisions
Target species
Only the following fish may be taken under the (N3 fishery symbol) licence— (a) barramundi; (b) barred
javelin; (c) black jewfish; (d) blue threadfin; (e) king threadfin; (f) queenfish; (g) scaly jewfish; (h) other
fin fish, excluding regulated coral reef fin fish, if the fish are taken while taking fish mentioned in
paragraphs (a) to (g).
Use of a Net
1) Fish may be taken only by using a set mesh net.
2) A power assisted device may be used with a set mesh net.
General restrictions on use of set mesh nets
1) A set mesh net must not be used—
a) in a marked navigation channel; or
b) within 400m of a jetty or wharf; or
c) across a waterway or navigation channel so that—
(i) its ropes make the waterway or navigation channel impassable to a boat; or
(ii) the net extends to more than one-half of the width of the waterway or navigation channel
where the net is used.
2) A reference in subsection (1) to using a set mesh net across a waterway or navigation channel
includes using more than 1 set mesh net in a line across the waterway or navigation channel,
regardless of the distance between the nets.
3) A set mesh net must not be used within 100m of any other net that is in use.
4) Despite subsection (3), a person using more than 1 set mesh net other than in a river or creek
may set the nets within 100m of each other.
5) If a set mesh net is used in a river or creek, no other net may be used at the same time other
than in a river or creek.
Use in a river or creek
1) A set mesh net may be used in a river or creek only if the set mesh net—
a) is no longer than 120m; and
b) has a mesh size of at least 160mm but no more than 215mm; and
c) has a drop of no more than 50 meshes.
2) No more than 6 nets may be set in the river or creek, regardless of the number of fishery
symbols ‘N3’ written on the licence.
3) The nets may be set if—
a) their combined length is no longer than 360m; and
b) the distance between the first and last net is no longer than 5n miles.
4) A person using a net must be no more than 5n miles from any net the person is using.

Gulf of Carpentaria Inshore Fin Fish Fishery, Scoping Study, Department of Agriculture and Fisheries 2019 19
N3 Fishery Symbol Netting Provisions
5) If a power assisted device is on a boat, no more than 360m of the net may be attached to the
device.
6) If a power assisted device is used, all nets on the boat, other than the net on the device, must
be stowed and secured.
Use in nearshore waters
1) This section applies to the use of a set mesh net in nearshore waters.
2) A set mesh net may be used only if—
a) it is no longer than 600m; and
b) has a mesh size of at least 160mm but no more than 215mm.
3) No more than 6 nets may be set in nearshore waters, regardless of the number of fishery
symbols ‘N3’ written on the licence.
4) The nets may be set if—
a) their combined length is no longer than 600m; and
b) the distance between the first and last net is no longer than 6n miles.
5) A person using a net must be no more than 6n miles from any net the person is using.
6) If a power assisted device is on a boat, no more than 600m of the net may be attached to the
device.
7) If a power assisted device is used, all nets on the boat, other than the net on the device, must
be stowed and secured.
Use in offshore waters if ‘N3’ written on licence only once
1) This section applies if the licence has the fishery symbol ‘N3’ written on it only once.
2) A set mesh net may be used in offshore waters only if—
a) the net is no longer than 300m, whether or not a power assisted device is used; and
b) the net has a mesh size of at least 160mm but no more than 165mm; and
c) the net’s drop is not more than 50 meshes; and
d) there are no other nets on the boat; and
e) the person using the net remains on a boat floating on the water and within 100m of the
net while the net is being used; and
f) the net is not used as a bottom set net.
Use in offshore waters if ‘N3’ written on licence more than once
1) This section applies if the licence has the fishery symbol ‘N3’ written on it more than once.
2) A set mesh net may be used in offshore waters only if—
a) the net is no longer than 600m, whether or not a power assisted device is used; and
b) the net has a mesh size of at least 160mm but no more than 165mm; and
c) the net’s drop is not more than 50 meshes; and
d) all other nets on the boat are stowed and secured; and
e) the person using the net remains on a boat floating on the water and within 100m of the
net while the net is being used; and
f) the net is not used as a bottom set net

Gulf of Carpentaria Inshore Fin Fish Fishery, Scoping Study, Department of Agriculture and Fisheries 2019 20
N11 Fishery Symbol Netting Provisions
Target species
Only the following fish may be taken in the Gulf ‘N11’ area— (a) garfish; (b) mullet; (c) other fin fish,
excluding barramundi and regulated coral reef fin fish, but only if the fish are taken while taking garfish
or mullet.
Permitted ways of taking fish
1) Fish may only be taken in the Gulf ‘N11’ area—by using cast, mesh, scoop or seine nets.
2) However, for taking fish in the Gulf ‘N11’ area, a power assisted device must not be used with
a net.
3) (3) A person using a net must be within 100m of it.
Net Configuration (cast nets)
Use of cast nets A cast net may be used in the fishery area only if the net— (a) is no longer than 3.7m;
and (b) has a mesh size of no more than 28mm.
Net Configuration (scoop nets)
A scoop net may be used in the fishery area only if the net— (a) is no more than 2m in each of its
dimensions; and (b) has a mesh size of at least 25mm and a handle or shaft no longer than 2.5m.
Net Configuration (use of mesh nets in offshore and nearshore waters)
Use of mesh nets in offshore and nearshore waters in the Gulf ‘N11’ area
1) This section applies to using a mesh net in the Gulf ‘N11’ area.
2) A mesh net may be used—
(a) in offshore waters, only if it—
I. is no longer than 400m; and
II. has a mesh size of at least 25mm but no more than 45mm; and
(b) in nearshore waters, only if it—
I. is no longer than 200m; and
II. has a mesh size of at least 25mm but no more than 45mm.
Net Configuration (use of mesh nets in rivers and creeks)
A mesh net may be used in a river or creek only if the net is— (a) no longer than 200m; and (b) has a
mesh size of at least 25mm but no more than 45mm.

Gulf of Carpentaria Inshore Fin Fish Fishery, Scoping Study, Department of Agriculture and Fisheries 2019 21
N12 Fishery Symbol Netting Provisions
Target species
Only the following fish may be taken under the (N12 fishery symbol) licence— (a) barred javelin; (b)
black jewfish; (c) blue threadfin; (d) grey mackerel; (e) king threadfin; (f) queenfish; (g) scaly jewfish;
(h) shark, other than white shark, sandtiger shark or speartooth shark; (i) other fin fish, excluding
barramundi and regulated coral reef fin fish, if the fish are taken while taking fish mentioned in
paragraphs (a) to (h).
Use of a Net
4) Fish may be taken only by using a set mesh net.
5) A power assisted device may be used with the net only if—
a) the net is no longer than 1,800m; and
b) all other nets on board the boat from which the net is being used are stowed and secured.
Net Configuration
1) A net may be used (under the N12 fishery symbol) only if—
a) it is no longer than 1,800m; and
b) has a mesh size of at least 160mm but no more than 165mm; and
c) its drop is no more than 85 meshes; and
d) one end of the net is anchored or fixed to a place;
e) the other end of the net is fixed to a boat; and
f) it is not used as a bottom set net.
2) The line thickness of a net must be at least 0.9mm.
A person using a net must be within 100m of it
N13 Fishery Symbol Netting Provisions
Target species
Only the following fish may be taken under the (N12 fishery symbol) licence— (a) barred javelin; (b)
black jewfish; (c) blue threadfin; (d) grey mackerel; (e) king threadfin; (f) queenfish; (g) scaly jewfish;
(h) shark, other than white shark, sandtiger shark or speartooth shark; (i) other fin fish, excluding
barramundi and regulated coral reef fin fish, if the fish are taken while taking fish mentioned in
paragraphs (a) to (h).
Use of a Net
6) Fish may be taken only by using a set mesh net.
7) A power assisted device may be used with the net only if—
(a) the net is no longer than 1,800m; and
(b) all other nets on board the boat from which the net is being used are stowed and secured.
Net Configuration
3) A net may be used (under the N13 fishery symbol) only if—

Gulf of Carpentaria Inshore Fin Fish Fishery, Scoping Study, Department of Agriculture and Fisheries 2019 22
N13 Fishery Symbol Netting Provisions
a) it is no longer than 1,800m; and
b) has a mesh size of at least 160mm but no more than 165mm; and
c) its drop is no more than 85 meshes; and
d) one end of the net is anchored or fixed to a place;
e) the other end of the net is fixed to a boat; and
f) it is not used as a bottom set net.
4) The line thickness of a net must be at least 0.9mm.
5) A person using a net must be within 100m of it

Gulf of Carpentaria Inshore Fin Fish Fishery, Scoping Study, Department of Agriculture and Fisheries 2019 23
APPENDIX C—Summary of the species retained in the Gulf of Carpentaria Inshore Fin Fish Fishery
(GOCIFFF) that were assessed as part of the National Status of Australian Fish Stocks (SAFS) and
Queensland Stock Status processes. An overview of the stock status assessments is available at:
https://www.daf.qld.gov.au/business-priorities/fisheries/monitoring-compliance/data/sustainability-
reporting/stock-status-assessment
Species SAFS Stock name 2015 QLD
status
2016 SAFS
status
2017 QLD
status
2018 SAFS
Status
Barramundi
Northern Gulf of
Carpentaria Not Assessed Sustainable
Not Assessed
Sustainable
Southern Gulf of
Carpentaria Not Assessed
Transitional-
depleting
Transitional-
depleting Depleting
King threadfin Gulf of Carpentaria Qld Transitional-
depleting
Transitional-
depleting
Transitional-
depleting Depleting
Blue threadfin Gulf of Carpentaria Qld Undefined Not Assessed Sustainable Sustainable
Grey mackerel Gulf of Carpentaria Qld Not Assessed Sustainable Not Assessed Sustainable
Black jewfish Gulf of Carpentaria Qld Not Assessed Undefined Not Assessed Undefined
Blacktip sharks Gulf of Carpentaria Qld Not Assessed Undefined Not Assessed Undefined
Cobia Gulf of Carpentaria Qld Undefined Not Assessed Sustainable Not Assessed
Dart Gulf of Carpentaria Qld Negligible Not Assessed Negligible Not Assessed
Golden snapper Gulf of Carpentaria Qld Not Assessed Sustainable Not Assessed Sustainable
Hammerhead shark
(Sphyrna spp. &
Eusphyra sp.)
Gulf of Carpentaria Qld Not Assessed Not Assessed Undefined Not Assessed

Gulf of Carpentaria Inshore Fin Fish Fishery, Scoping Study, Department of Agriculture and Fisheries 2019 24
Species SAFS Stock name 2015 QLD
status
2016 SAFS
status
2017 QLD
status
2018 SAFS
Status
Mangrove jack Gulf of Carpentaria Qld Undefined Overfished Transitional-
recovering Recovering
Javelin Gulf of Carpentaria Undefined Not Assessed Undefined Not Assessed
Queenfish Gulf of Carpentaria Qld Undefined Not Assessed Undefined Not Assessed
School mackerel Gulf of Carpentaria Negligible Not Assessed Negligible Negligible
Tuskfish Gulf of Carpentaria Qld Negligible Not Assessed Negligible Not Assessed
Spotted mackerel Northern Australia Not Assessed Sustainable Not Assessed Negligible

Gulf of Carpentaria Inshore Fin Fish Fishery, Scoping Study, Department of Agriculture and Fisheries 2019 25
APPENDIX D—Effort distribution for the GOCIFFF for the 2015, 2016 and 2017 fishing seasons. Grey grids represent areas where effort has been reported but
information is protected by commercial in confidence provisions i.e. grid contains <5 boats.

Gulf of Carpentaria Inshore Fin Fish Fishery, Scoping Study, Department of Agriculture and Fisheries 2019 26
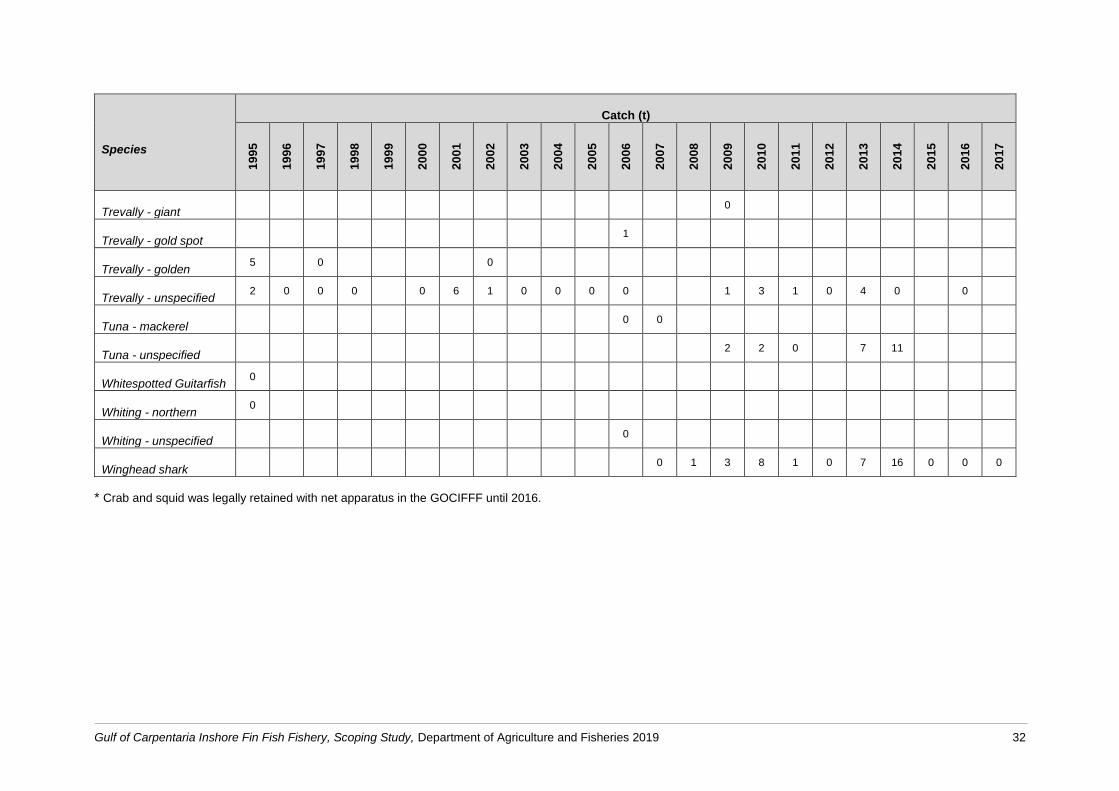
APPENDIX E—The yearly total catch (t) for the GOCIFFF 1995–20171. Historical catch includes the species taken under the RL licence, which existed from
1993–2000.
Species
Catch (t)
19
95
19
96
19
97
19
98
19
99
20
00
20
01
20
02
20
03
20
04
20
05
20
06
20
07
20
08
20
09
20
10
20
11
20
12
20
13
20
14
20
15
20
16
20
17
Amberjack 1 0 1
Bait fish 0 0 0 0 0 0 1 2 2 1 0 1 2 4 0 5 3 3 2 0 1 1
Barramundi 449 556 452 572 723 611 723 744 551 615 500 735 631 726 793 763 966 929 505 457 367 468 668
Blacktip whaler shark 42 103 87 119 60 38 59 69 41 50 75
Bream - black (luderick) 0 0 0 0 2 0 0 0 0
Bream - bony (herring) 0
Bream - butter 0
Bream - unspecified 0 0 0 0 0 1 0 0 0 1 0 0
Catfish - blue 0 0 11
Catfish - golden 1 2 2 3 0 0 0 2 2 3 2 2 1 1 2 0 0 0 1 0
Catfishes 9 8 7 8 4 4 4 4 4 10 6 6 3 1 4 1 1 0 1 0 0 0
catsharks 0 0 0 0
Cod - estuary 0
Cod - jumping (tripletail) 1 2 2 4 1 1 1 2 2 2 1 1 0 0 0 0 0 0 0 0 0
1 Some species are recorded under synonymous names e.g. the accepted name for small mouth nannygai is crimson snapper.

Gulf of Carpentaria Inshore Fin Fish Fishery, Scoping Study, Department of Agriculture and Fisheries 2019 27
Species
Catch (t)
19
95
19
96
19
97
19
98
19
99
20
00
20
01
20
02
20
03
20
04
20
05
20
06
20
07
20
08
20
09
20
10
20
11
20
12
20
13
20
14
20
15
20
16
20
17
Crab - blue swimmer* 0 0
Crab - Mud* 1 1 3 1 1 0 1 0 0 1 1 1 0 0 1 1
Crab - unspecified* 0 0
Creek whaler 3 0 0 2 0
Dart - unspecified 0 1 1 0 1 1 0 1 0 0 0
Fish - unspecified 33 34 27 25 24 27 52 32 53 30 33 35 41 38 42 39 43 37 23 25 20 39 41
Flathead - unspecified 0 0 0 0
Flounder - unspecified 0 0
Garfish - unspecified 1 1 0 1 0 1 4 4 1 0 0 1 2 2 2 0 1 1 3 1 0 2
Golden Snapper 2 5 6 2 4 2 8 2 1 0 0 1 3 0 2 2 0 0 2 2 1 0 0
Groper - eastern blue 0
Grunter - unspecified 20 22 16 13 26 16 25 34 31 51 26 19 21 29 19 13 12 11 14 13 11 12 21
Guitarfishes -
shovelnose unsp
0 1 0 2 5 2 0 0 1 2 14 3 3 2
Hammerhead shark 6 10 20 19 9 2 40 45 15 17 5
Herring -
koningsberger's
0 0 0
Herring - wolf 0

Gulf of Carpentaria Inshore Fin Fish Fishery, Scoping Study, Department of Agriculture and Fisheries 2019 28
Species
Catch (t)
19
95
19
96
19
97
19
98
19
99
20
00
20
01
20
02
20
03
20
04
20
05
20
06
20
07
20
08
20
09
20
10
20
11
20
12
20
13
20
14
20
15
20
16
20
17
Jew fish - black 2 3 2 2 1 5 1 2 3 5 2 1 0 0 0 0 0 0 0 0
Jew fish - mulloway 7 7 1 0 0 0 0 0 0
Jew fish - silver 1 1 1 0 3 0 0 0 0 1 0
Jew fish - unspecified 0 3 2 2 1 1 2 2 3 2 2 7 5 9 8 5 3 4 6 3 14 10
Jewel 26 23 12 19 16 22 33 48 51 52 33 39 38 26 26 30 32 39 38 46 23 20 23
John dory 0 0
Kingfish - black 2 3 2 1 1 1 3 3 2 2 3 2 3 2 2 7 7 3 3 6 3 4 2
Kingfish - unspecified 0 0
Kingfish - yellowtail 0
Leather
jacket/triggerfish
0
longtoms 0
Mackerel - grey 122 241 376 370 308 419 471 345 379 468 394 490 640 622 482 897 853 767 486 562 718 645 552
Mackerel - school 1 0 9 0 0 0
Mackerel - spanish 12 16 11 15 21 25 21 24 18 29 33 33 54 36 32 51 55 50 57 55 40 40 42
Mackerel - spotted 0 0 0 0 0 0 0 0
Mackerel - unspecified 3 12 8 3 4 9 6 10 0 1 0 0 0 0 0

Gulf of Carpentaria Inshore Fin Fish Fishery, Scoping Study, Department of Agriculture and Fisheries 2019 29
Species
Catch (t)
19
95
19
96
19
97
19
98
19
99
20
00
20
01
20
02
20
03
20
04
20
05
20
06
20
07
20
08
20
09
20
10
20
11
20
12
20
13
20
14
20
15
20
16
20
17
Mangrove jack 0 0 1 0 0 0 0 1 0 0 0
Milk, Sharpnose &
Hardnose Sharks
0
Milkfish 1 4 1 1 0
morwongs 0 0 0
Mullet - diamond scale 0 0 0 0 0 0 0 0 0 0 0 0 0
Mullet - fantail/silver 0 0
Mullet - sea/flathead 0 0
Mullet - unspecified 1 4 3 1 0 2 5 1 8 6 2 2 1 3 4 0 0 1 1 0 0 1
Pilchard/sardine -
unspecified
0 1
Pomfret - unspecified 4 3 6 8 6 5 3 5 10 16 12 6 7 4 7 4 3 1 2 2 1 3 4
Queenfish - unspecified 18 15 15 16 13 9 15 26 23 35 17 14 22 39 35 53 11 8 7 5 9 20 36
Queensland halibut 0 0 0 0
Rainbow runner 0
Ray - blue spotted sting 9
Ray - eastern fiddler 1 2 0
Ray - spotted eagle 0 0 0

Gulf of Carpentaria Inshore Fin Fish Fishery, Scoping Study, Department of Agriculture and Fisheries 2019 30
Species
Catch (t)
19
95
19
96
19
97
19
98
19
99
20
00
20
01
20
02
20
03
20
04
20
05
20
06
20
07
20
08
20
09
20
10
20
11
20
12
20
13
20
14
20
15
20
16
20
17
Ray - sting unspecified 1 0 0 0 2 5 6 2 1 1 0
Redfish 0
Samson fish 0
Scad - unspecified 0
Shark - australian
blacktip
0 3 1 74 70 73 118 97 130 95 97 54 59 160 116
Shark - blue whaler 0 0 0
Shark - bull 1 1 0
Shark - eastern shovel
nose
1
Shark - fins unspecified 0 0 0 0 0
Shark - fossil 1 0 0 0 0 0 0 0 0 0
Shark - lemon 0 0
Shark - milk 0 1 0 0 0 1 0 0 1 1
Shark - pigeye 0 0 0 0 0
Shark - scalloped
hammerhead
0 9 2 6 1 0
Shark - sorrah 1 0 35 21 18 21 15 16 28 32 22 24 9
Gulf of Carpentaria Inshore Fin Fish Fishery, Scoping Study, Department of Agriculture and Fisheries 2019 31
Species
Catch (t)
19
95
19
96
19
97
19
98
19
99
20
00
20
01
20
02
20
03
20
04
20
05
20
06
20
07
20
08
20
09
20
10
20
11
20
12
20
13
20
14
20
15
20
16
20
17
Shark - spinner 0 1 1
Shark - tiger 0 0 0
Shark - unspecified 475 346 319 344 360 390 373 391 474 366 396 159 91 47 29 29 12 4 4 3 13 13 15
Shark - whaler
unspecified
55 36 48 8 14 10 0 1 0 0 2
Snapper (squire) 0 0 0 0
Spinefoot - black 0
Squid – unspecified* 0
Steelback 0
striped seapike 0 2 1
Swordfish 0
Tailor 0 0 0
Threadfin - blue 77 92 54 71 123 40 67 83 106 126 81 66 59 76 71 63 49 39 40 49 41 54 74
Threadfin - flat 2
Threadfin - king 252 295 245 336 428 318 473 445 296 310 283 305 248 295 309 378 325 313 176 142 138 169 236
Threadfin - striped 0
Threadfin - unspecified 0 0 0 0 0 0 27
Gulf of Carpentaria Inshore Fin Fish Fishery, Scoping Study, Department of Agriculture and Fisheries 2019 32
Species
Catch (t)
19
95
19
96
19
97
19
98
19
99
20
00
20
01
20
02
20
03
20
04
20
05
20
06
20
07
20
08
20
09
20
10
20
11
20
12
20
13
20
14
20
15
20
16
20
17
Trevally - giant 0
Trevally - gold spot 1
Trevally - golden 5 0 0
Trevally - unspecified 2 0 0 0 0 6 1 0 0 0 0 1 3 1 0 4 0 0
Tuna - mackerel 0 0
Tuna - unspecified 2 2 0 7 11
Whitespotted Guitarfish 0
Whiting - northern 0
Whiting - unspecified 0
Winghead shark 0 1 3 8 1 0 7 16 0 0 0
* Crab and squid was legally retained with net apparatus in the GOCIFFF until 2016.

Gulf of Carpentaria Inshore Fin Fish Fishery, Scoping Study, Department of Agriculture and Fisheries 2019 33
APPENDIX F—Interactions reported in the Species of Conservation Interest (SOCI) logbook by fishers operating in the Gulf of Carpentaria Inshore Fin Fish
Fishery. Data includes all reports and encompasses Gillnetting and Anchored Gillnetting fishing operations.
2003 2004 2005 2006 2007
Species
To
tal
Dis
c.
Aliv
e
Dis
c.
Dead
Oth
er
To
tal
Dis
c.
Aliv
e
Dis
c.
Dead
Oth
er
To
tal
Dis
c.
Aliv
e
Dis
c.
Dead
Oth
er
To
tal
Dis
c.
Aliv
e
Dis
c.
Dead
Oth
er
To
tal
Dis
c.
Aliv
e
Dis
c.
Dead
Oth
er
Dolphin
Off-shore bottlenose 1 1 0 0
Australian Snubfin
Unspecified
Marine turtle
Green 1 1 0 0 1 1 0 0 2 2 0 0 6 6 0 0
Flatback 1 1 0 0
Hawksbill 1 1 0 0 2 2 0 0 2 2 0 0
Leatherback 2 2 0 0 2 2 0 0
Olive Ridley
Unspecified
Sharks and Rays
Bentfin Devilray
Sawfish
Green 4 3 1 0 2 2 0 0
Narrow 35 31 3 1 23 18 4 1
Freshwater 3 3 0 0 21 19 2 0
Wide 1 0 1 0
Dwarf
Unspecified
Crocodile
Saltwater 1 1 0 0 1 0 1 0
Unspecified 7 7 0 0
Sea snake
Dugong

Gulf of Carpentaria Inshore Fin Fish Fishery, Scoping Study, Department of Agriculture and Fisheries 2019 34
APPENDIX F cont.
2008 2009 2010 2011 2012
Species
To
tal
Dis
c.
Aliv
e
Dis
c.
Dead
Oth
er
To
tal
Dis
c.
Aliv
e
Dis
c.
Dead
Oth
er
To
tal
Dis
c.
Aliv
e
Dis
c.
Dead
Oth
er
To
tal
Dis
c.
Aliv
e
Dis
c.
Dead
Oth
er
To
tal
Dis
c.
Aliv
e
Dis
c.
Dead
Oth
er
Dolphin
Off-shore bottlenose 1 0 1 0
Australian Snubfin
Unspecified
Marine turtle
Green
Flatback 1 1 0 0
Hawksbill 5 5 0 0 1 1 0 0
Leatherback 3 3 0 0
Olive Ridley
Unspecified 1 1 0 0 1 1 0 0
Sharks and Rays
Bentfin Devilray
Sawfish
Green 2 2 0 0
Narrow 1 1 0 0 2 2 0 0 5 5 0 0
Freshwater 1 1 0 0 12 11 1 0 11 11 0 0 12 11 1 0 2 2 0 0
Wide 10 9 1 0 3 3 0 0
Dwarf 3 3 0 0 5 5 0 0 3 3 0 0
Unspecified 106 106 0 0
Crocodile
Saltwater 9 3 6 0 7 2 5 0 3 1 2 0 5 1 4 0
Unspecified 1 0 1 0 1 0 1 0
Sea snake
Dugong
Gulf of Carpentaria Inshore Fin Fish Fishery, Scoping Study, Department of Agriculture and Fisheries 2019 35
APPENDIX F cont.
2013 2014 2015 2016 2017
Species
To
tal
Dis
c.
Aliv
e
Dis
c.
Dead
Oth
er
To
tal
Dis
c.
Aliv
e
Dis
c.
Dead
Oth
er
To
tal
Dis
c.
Aliv
e
Dis
c.
Dead
Oth
er
To
tal
Dis
c.
Aliv
e
Dis
c.
Dead
Oth
er
To
tal
Dis
c.
Aliv
e
Dis
c.
Dead
Oth
er
Dolphin
Off-shore bottlenose
Australian Snubfin 2 1 0 1
Unspecified 1 1 0 0
Marine turtle
Green 3 3 0 0
Flatback
Hawksbill 2 2 0 0
Leatherback
Olive Ridley 1 1 0 0
Unspecified 2 2 0 0
Sharks and Rays
Bentfin Devilray 1 0 1 0
Sawfish
Green 19 19 0 0 15 15 0 0 2 1 1 0
Narrow 53 18 15 20 4 3 1 0
Freshwater 4 4 0 0 2 1 1 0
Wide 1 1 0 0
Dwarf 19 19 0 0 1 1 0 0 1 1 0 0
Unspecified 6 6 0 0
Crocodile
Saltwater 1 0 1 0 15 2 13 0 27 9 18 0
Unspecified
Sea snake 2 2 0 0 2 2 0 0
Dugong 2 1 1 0