Gulf Coast Energy Outlook 2019 - Louisiana State …1 | Introduction Last year, the inaugural Gulf...
28
Gulf Coast Energy Outlook This report prepared by the E. J. Ourso College of Business Economics & Policy Research Group and the Center for Energy Studies 2019 David E. Dismukes | Dek Terrell | Gregory B. Upton, Jr. * *Corresponding author
Transcript of Gulf Coast Energy Outlook 2019 - Louisiana State …1 | Introduction Last year, the inaugural Gulf...

Gulf CoastEnergy Outlook
This report prepared by the E. J. Ourso College of Business Economics & Policy Research Group and theCenter for Energy Studies
2019
David E. Dismukes | Dek Terrell | Gregory B. Upton, Jr.**Corresponding author


2019 Gulf Coast Energy OutlookDavid E. Dismukes – LSU Center for Energy StudiesDek Terrell – LSU Economics & Policy Research GroupGregory B. Upton, Jr. – LSU Center for Energy Studies
Release Date: Fall 2018
Acknowledgment This report would not have been possible without the help of many who contributed both time and financial resources over the past year. First, we would like to thank the more than one dozen industry, governmental and trade organizations that invited us to present last year’s GCEO to more than 1,000 local industry and government leaders across our state. At these meetings, we have received feedback across the industry from up-stream production, pipeline operations, down-stream refining and chemicals, energy export, as well as utilities. We also met individually with dozens of companies and listened to thoughts about opportunities and challenges facing the industry in coming years. Simply put, while “crunching the numbers” is a critical part of any synopsis report such as this one, equally as important is input from stakeholders who have an “on-the-ground” view of what is occurring in real time. We are forever grateful for this input.
We also thank Marybeth Pinsonneault (Center for Energy Studies) and Stephen Radcli�e (E. J. Ourso College of Business), for their editorial and formatting expertise. Numerous graduate and undergraduate students across academic disciplines also contributed to data collection and analysis included in this report.¹
And last, but certainly not least, we thank all of our sponsors; Gold Sponsors: Chevron, Phillips 66, and Kinetica; Silver Sponsors: DrillingInfo and LLOG Exploration; and Bronze Sponsor: Entergy. Thank you!
¹A special thanks to our students including Johnathon Angers (environmental sciences), Jenna Cheramie (wildlife ecology), Andrew Smith (economics), and Preston Watts (economics).
1Louisiana State University

1 | Introduction
Last year, the inaugural Gulf Coast Energy Outlook (GCEO) was launched seeking to provide Gulf Coast stakeholders with a broad overview of the current status and trends impacting the region’s energy industries. This research initiative is a collaborative e�ort of Louisiana State University’s Center for Energy Studies and the E. J. Ourso College of Business and has been sponsored, in large part, by a number of corporations and institutions looking to assist LSU in disseminating timely and important information impacting the region’s economy and citizenry.
This outlook includes Gulf Coast-specific analyses for the upstream oil and gas production and downstream refining and petrochemicals sectors. Special attention will be paid to the growing global reach of the region’s petroleum refiners as well as the growing potential for significant natural gas exports through the burgeoning liquefied natural gas (LNG) capacity that has been, and continues to be, developed throughout the region. The outlook includes an analysis of the energy sector’s contribution to the broader Gulf Coast economy including how changes in each major energy sector will impact the region’s employment outlooks. The outlook concludes with a forecast on the anticipated activity in each of the region’s major energy sectors.
Unless stated otherwise, the “Gulf Coast” region specifically refers to the states of Texas, Louisiana, Mississippi, and Alabama. In some instances, U.S. Department of Energy reporting conventions will require references to data collected at the Petroleum Administration for Defense District 3 (PADD 3) level, which includes Arkansas and New Mexico, in addition to the Gulf Coast states.
Additional, more-detailed information about this GCEO can be found at lsu.edu/ces/research/2019gceo.php.
2 | Oil and Gas Prices and Production
2.1: Historical TrendsThe past two decades have seen a dramatic change in the energy landscape along the Gulf Coast. The changes started initially with the development of unconventional natural gas resources and quickly progressed into crude oil resource development. The “revolution” created by this unconventional development reversed what appeared to be an irreversible decline in one of the globe’s most prolific hydrocarbon-producing regions. The entire story of the U.S. unconventional energy revolution can be summarized by Figure 1, showing recent trends that many around the world would have thought impossible just a few short years ago.
While unconventional oil and natural gas development have changed the outlook for U.S. reserves development and production, it has not, unfortunately, decoupled the relationship between drilling activity and prices. Figure 2 shows that U.S. drilling activity continues to be highly correlated to prices, making the industry as cyclical today as in years past. Fortunately, prices have continued on their upward trend, as was anticipated in last year’s GCEO, with those increases being a little more pronounced than what was originally anticipated in the GCEO’s base forecast, but not its “high price” case scenario. Most of the new drilling activity continues to be concentrated in unconventional basins, with the Permian leading that charge. As of this writing, rig counts are 60 percent of the peak in October of 2014, but continuing to climb.
2 Gulf Coast Energy Outlook 2019
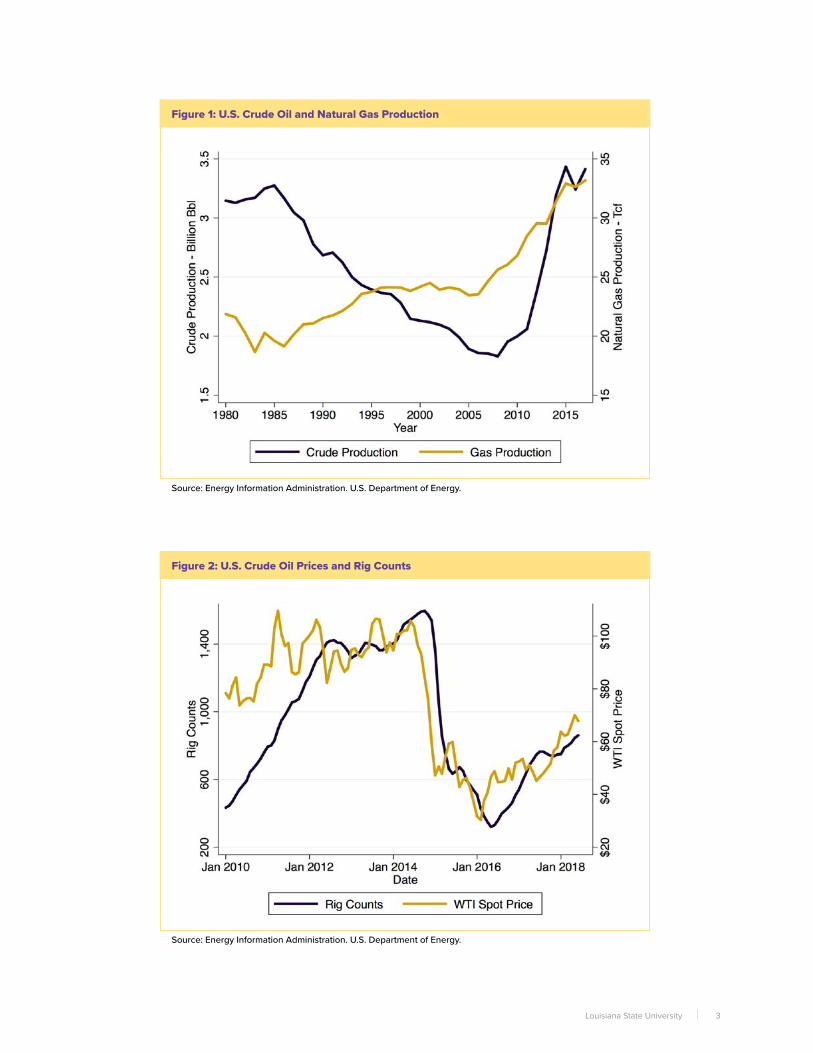
Figure 1: U.S. Crude Oil and Natural Gas Production
Source: Energy Information Administration. U.S. Department of Energy.
Figure 2: U.S. Crude Oil Prices and Rig Counts
Source: Energy Information Administration. U.S. Department of Energy.
3Louisiana State University

Figure 3 illustrates the rig activity in the seven major U.S. shale plays. Prior to 2012, most of the rig activity was allocated across the Permian, Anadarko, and Haynesville shale plays. Starting in 2012, Haynesville began to lose its position as a predominant shale play, ceding that preeminence to more liquids-oriented areas such as the Permian and the Eagle Ford. Since 2016, the Permian has been the predominant shale play in the U.S. accounting for more than 33 percent of all drilling activity in the first half of 2018. This dominance, however, may soon be challenged since this high concentration of Permian-oriented drilling activity has come at a cost: constrained pipeline capacity moving crude oil out of the area and exceptionally low net-backs for producers in the region. The impacts this transportation constraint may have on relative drilling activity and production will be discussed in further detail later in this outlook.
The trends highlighted in Figure 4 underscore the fact that the unconventional revolution has fundamentally shifted the U.S.’s contribution to world energy supply. Prior to the unconventional revolution, U.S. production accounted for a little under eight percent of world oil production. Figure 4 shows just how quickly the unconventional revolution changed America’s energy fortunes and highlights why OPEC has begrudgingly begun to pay attention to the implications this unconventional production has for world market share. Today, the U.S. accounts for over 12 percent of all world crude oil production and has the possibility of improving that market share if prices are sustained at current or even higher levels.
Figure 3: Rig Counts in Major Shale Basins
Source: Energy Information Administration. U.S. Department of Energy. Drilling Productivity Reports.
4 Gulf Coast Energy Outlook 2019

2.2: Oil and Gas Production TrendsFigure 5 shows how the drilling activity presented in Figure 2 has been translated into production gains and the increase in world market share highlighted in Figure 4. This chart, more importantly, also shows the resiliency of U.S. unconventional production and how it continues to march forward, through continued operator innovation and e¤ciency, even in the face of decreased world prices. Consider, for instance, that by early 2015, crude oil prices had fallen by over 50 percent yet total PADD 3 crude oil production continued to mount its ascent to a 5 MMBbls/d production rate. Amazingly, the Gulf Coast region (PADD 3) was able to maintain this high degree of well productivity even in the face of low prices throughout the entire term of the 2015 to 2017 time period.
Starting in 2017, the Gulf Coast’s collective well productivity surged, in large part due to the increased productivity in the Permian and Eagle Ford basins, not to mention the continued high productivity levels for individual wells in the deepwater Outer Continental Shelf (OCS). Today, the region’s crude oil production has surged to almost 7 MMBBls/d, making the Gulf Coast the single largest contributor to total U.S. crude oil production (over 50 percent) and re-establishing the region’s prestige as one of the premier crude oil producing basins in the world.
Figure 6 provides comparable trends in natural gas production and Henry Hub prices. Natural gas prices went into free-fall following the 2008-2009 recession. The surge of shale-related production, coupled with weak post-recession natural gas demand, kept natural gas prices low. More importantly, the fall in natural gas prices has generally not been met with a large corresponding fall in natural gas production. This continued growth in natural gas production, primarily “associated” natural gas production from the region’s crude oil production, has not only continued to keep natural gas prices at a�ordable levels, but has stripped out a large degree of the price volatility that has existed in the industry for decades.
Figure 4: Global and U.S. Crude Oil Production
Source: Energy Information Administration. U.S. Department of Energy.
5Louisiana State University

Figure 5: PADD 3 Oil Production and Prices
Source: Energy Information Administration. U.S. Department of Energy.
Figure 6: PADD 3 Natural Gas Production and Henry Hub Prices
Source: Energy Information Administration. U.S. Department of Energy.
6 Gulf Coast Energy Outlook 2019
While PADD 3 natural gas production is down somewhat from its 2011 peak of more than 43 Bcf/day, production trends over the past six years show a resilient resource base that continues to produce. At the time of this writing, the Gulf Coast is producing more than 38 Bcf/day despite a three-fold drop in natural gas prices (relative to 2006 peaks). Low-cost, less volatile, widely-available natural gas is the primary motivator for the billions in Gulf Coast industrial capital expenditures that will be discussed later in this outlook.
2.3: Outlook — Commodity PricingThe challenging first step of any research initiative in the oil and gas sector is forecasting prices. Not surprisingly, commodity prices are the primary driver of short-term fluctuations in oil and gas production. And over this past decade, the underlying relationships between prices, drilling activities, and production have been fundamentally altered due to the advent of shale. Therefore, instead of attempting an “econometric” price forecast, that is by its nature a function of historical data, we instead present futures prices for both oil and natural gas.
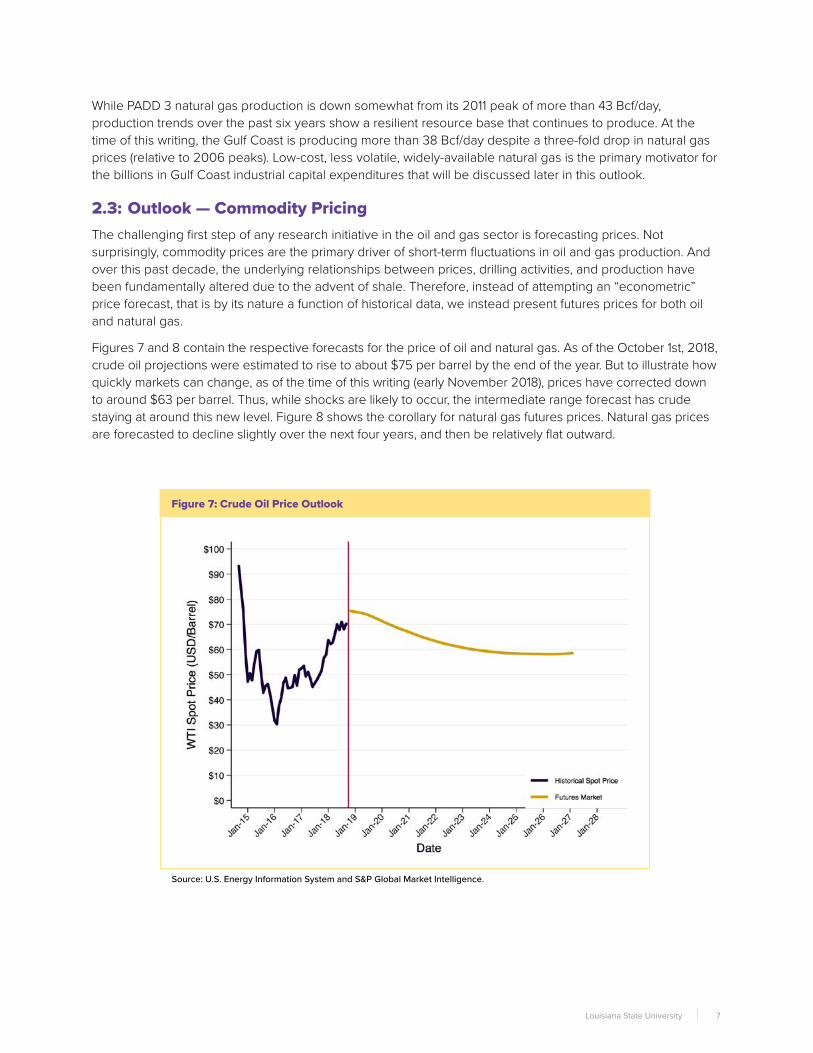
Figures 7 and 8 contain the respective forecasts for the price of oil and natural gas. As of the October 1st, 2018, crude oil projections were estimated to rise to about $75 per barrel by the end of the year. But to illustrate how quickly markets can change, as of the time of this writing (early November 2018), prices have corrected down to around $63 per barrel. Thus, while shocks are likely to occur, the intermediate range forecast has crude staying at around this new level. Figure 8 shows the corollary for natural gas futures prices. Natural gas prices are forecasted to decline slightly over the next four years, and then be relatively flat outward.
Figure 7: Crude Oil Price Outlook
Source: U.S. Energy Information System and S&P Global Market Intelligence.
7Louisiana State University

2.4: Outlook – Upstream ProductionAn important issue arising in the development of the production forecasts for last year’s GCEO was the extent to which the region’s unconventional crude oil basins would continue to expand production. At the time, there was a considerable debate, particularly among various industry analysts, as to whether the region could maintain its unparalleled productivity improvements with some analysts going so far as to suggest that the region had topped out in terms of well productivity and would start to see flat-to-declining daily crude oil production rates over the next several years.
The 2018 GCEO did not take this position and, as shown in the earlier section of this outlook, the past year’s crude oil production trends underscore the sagacity of this forecast. It is simply too early in the unconventional revolution to discount the ingenuity of U.S. producers and their ability to extract copious levels of hydrocarbons from these reserves. Ultimately, the law of diminishing returns will kick-in, but the GCEO takes the position that this is not in the very immediate future (to 2020). Last year’s crude oil productivity, and the continued increase in associated natural gas production, which also increased on a Bcf/d per MMBBLs/d basis, showed a tandem productivity trend that continues to keep U.S. natural gas markets well supplied.
There are, however, a number of challenges to PADD 3 production, and those have less to do with geology than they do the physical transportation constraints of moving crude oil out of the Permian basin and to the Gulf Coast. Recent estimates have continued to emphasize that the Permian region is quickly running out of spare crude oil transportation capacity. Some reports have the region’s crude oil transportation pipeline capacity utilization as high as 96 percent.²
²Tagle, R. 2018. Permian oil and gas takeaway capacity improvements on horizon. Available at: https://info.drillinginfo.com/permian-oil-and-gas-takeaway-capacity-improvements-on-horizon/.
Figure 8: Natural Gas Price Outlook
Source: U.S. Energy Information System and S&P Global Market Intelligence.
8 Gulf Coast Energy Outlook 2019

These pipeline capacity constraints are real and have the ability slow the region’s (and the U.S.’s) ability to meet the anticipated global production shortfalls that could arise from the geo-political situations in Iran and Venezuela. In fact, pipeline constraints have been associated with more than $20/barrel price di�erentials during the peak of the shale boom.³ The GCEO, however, takes the position that while these constraints are problematic, and could result in some disruptions under certain scenarios, the market has better-than-average odds of hitting a “goldilocks” outcome where there is just enough transportation capacity to meet the rising production from the region, but no more. This shorter-term optimism arises from two observations.
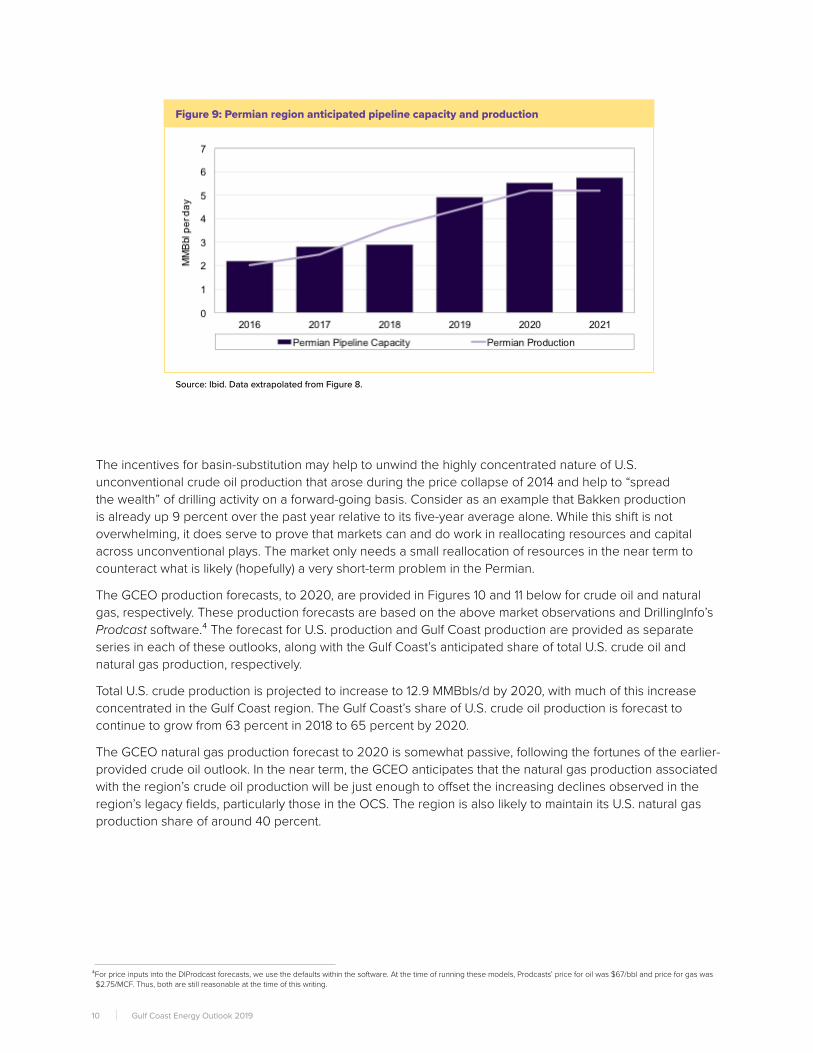
First, there has been a considerable number of major crude oil transportation project announcements that are planned to move production from the Permian to the Gulf Coast. Table 1 highlights these announcements. In total, almost three million barrels per day of crude oil transportation capacity is expected to come online in the Permian region in the next two years. Second, as shown in Figure 9, there is a relatively good chance that the incremental transportation capacity increase will be enough to meet the 2020 production increase from the Permian basin, and that some crude oil transportation capacity headroom may even start to arise.
Second, the increasing pipeline capacity constraint has had noticeable impacts on producer net-backs in the Permian basin with industry partners reporting significant price discounts at the wellhead. These pricing discounts relative to Cushing have become problematic for some producers. These high discounts/low net-backs are already creating new incentives for basin-substitution particularly to those basins that have fewer transportation capacity constraints than the Permian.
3Agerton M. and G.B. Upton. Decomposing Crude Price Di�erentials: Domestic Shipping Constraints or the Crude Oil Export Ban.
Table 1: Recent Permian region pipeline capacity announcements.
Note: ¹Came into service in 2017 with 300 Mb/d. This current expansion is 35 Mb/d and will eventually total 575 Mb/d; ²This represents the remaining available capacity (final phase) for the 140 Mb/d Permian Express III pipeline; ³Initial capacity of up to 600 Mb/d and expandable to 1 MMb/d; ⁴This system will be expandable to 670 Mb/d with additional incremental pumping capacity; ⁵Can be expanded to 1 MMb/d.Source: U.S. Energy Information Administration; Drilling info. 2018. Permian oil and gas takeaway capacity improvements on horizon. Available at: https://info.drillinginfo.com/permian-oil-and-gas-takeaway-capacity-improvements-on-horizon; Oil Price. 2018. The Permian banks on these key pipelines. Available at: https://oilprice.com/Energy/Energy-General/The-Permian-Banks-On-These-Key-Pipelines.html; Natural Gas Intelligence. 2018. ETP, partners pull trigger on Permian Gulf Coast Oil Pipeline. Available at: https://www.naturalgasintel.com/articles/115650-etp-partners-pull-trigger-on-permian-gulf-coast-oil-pipeline; Seeking Alpha. 2018. Permian Basin: these oil and gas pipeline projects will narrow the oil and gas discounts in 2020. Available at: https://seekingalpha.com/article/4186260-permian-basin-oil-gas-pipeline-projects-will-narrow-oil-gas-discounts-2020.
9Louisiana State University
The incentives for basin-substitution may help to unwind the highly concentrated nature of U.S. unconventional crude oil production that arose during the price collapse of 2014 and help to “spread the wealth” of drilling activity on a forward-going basis. Consider as an example that Bakken production is already up 9 percent over the past year relative to its five-year average alone. While this shift is not overwhelming, it does serve to prove that markets can and do work in reallocating resources and capital across unconventional plays. The market only needs a small reallocation of resources in the near term to counteract what is likely (hopefully) a very short-term problem in the Permian.
The GCEO production forecasts, to 2020, are provided in Figures 10 and 11 below for crude oil and natural gas, respectively. These production forecasts are based on the above market observations and DrillingInfo’s Prodcast software.⁴ The forecast for U.S. production and Gulf Coast production are provided as separate series in each of these outlooks, along with the Gulf Coast’s anticipated share of total U.S. crude oil and natural gas production, respectively.
Total U.S. crude production is projected to increase to 12.9 MMBbls/d by 2020, with much of this increase concentrated in the Gulf Coast region. The Gulf Coast’s share of U.S. crude oil production is forecast to continue to grow from 63 percent in 2018 to 65 percent by 2020.
The GCEO natural gas production forecast to 2020 is somewhat passive, following the fortunes of the earlier-provided crude oil outlook. In the near term, the GCEO anticipates that the natural gas production associated with the region’s crude oil production will be just enough to o�set the increasing declines observed in the region’s legacy fields, particularly those in the OCS. The region is also likely to maintain its U.S. natural gas production share of around 40 percent.
⁴For price inputs into the DIProdcast forecasts, we use the defaults within the software. At the time of running these models, Prodcasts’ price for oil was $67/bbl and price for gas was $2.75/MCF. Thus, both are still reasonable at the time of this writing.
Figure 9: Permian region anticipated pipeline capacity and production
Source: Ibid. Data extrapolated from Figure 8.
10 Gulf Coast Energy Outlook 2019

Figure 10: Crude Oil Production Forecast and Gulf Coast Share of U.S. Production
Source: DrillingInfo ProdCast
Figure 11: Forecast for Natural Gas Production and Gulf Coast Share of U.S. Production
Source: DrillingInfo ProdCast
11Louisiana State University

3 | Industrial Outlook: Refining and Petrochemicals
The U.S. Gulf Coast has the highest collective concentration of petroleum refining and petrochemical production capacity of just about anywhere in the world. These two industries have arisen along the Gulf Coast in order to take advantage of lower-cost, widely-available hydrocarbons. Over time, the hydrocarbon inputs for these industries had to be supplemented by foreign inputs, particularly in the refining sector. However, today, that has all changed with the advent of large-scale domestic unconventional oil and natural gas production.
The “revolution” in upstream unconventional oil and natural gas production has led to a “renaissance” for U.S. refining and petrochemical production, particularly along the Gulf Coast. The economic importance of this change cannot be emphasized enough given the collective importance that refining and petrochemicals have for the Louisiana and Texas manufacturing economies. Both sectors have seen, and will continue to see, dramatic changes with significant increases in capital investment over the past decade. Both sectors continue to see ongoing capital investment announcements for not only capacity expansions, but other e¤ciency-related investments that will expand the region’s production capabilities. Lastly, and more importantly, both sectors are re-tooling to serve not just North American chemical and refined product markets, but those spanning the entire globe. Both sectors (refining, chemicals) are, in e�ect, becoming important components of the U.S. energy export economy that is reforming and creating value-added to domestically-produced hydrocarbons and will be discussed in greater detail later in this outlook.
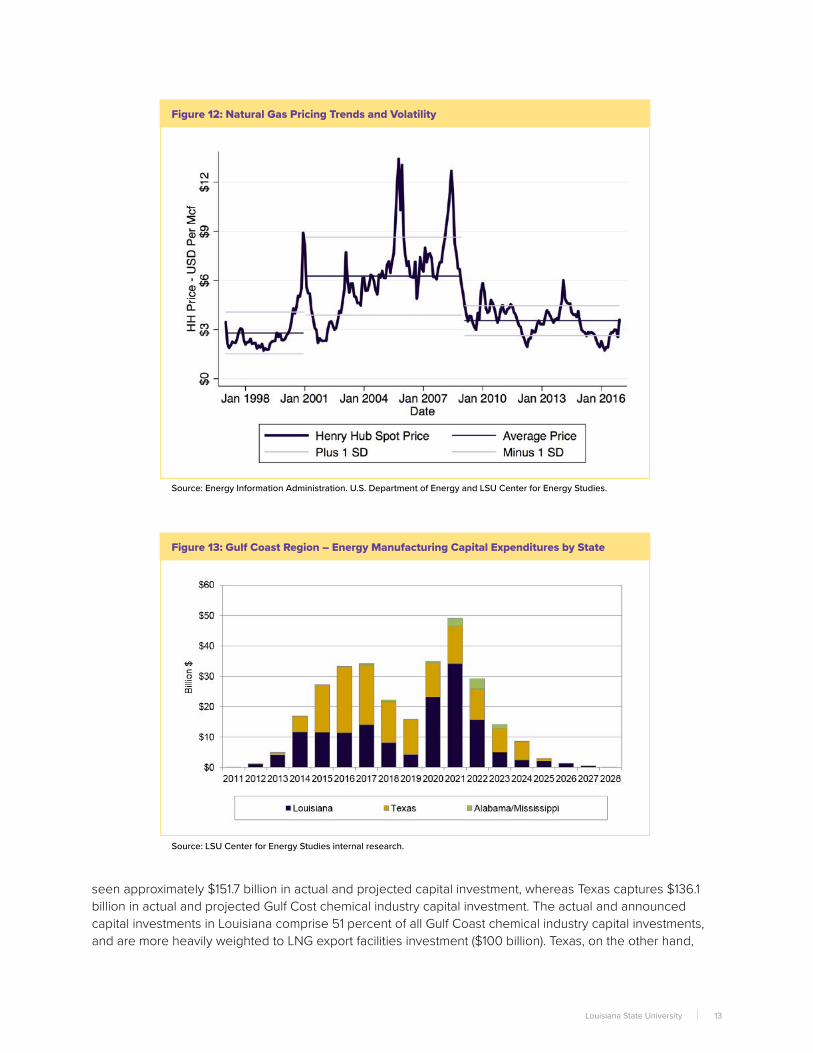
3.1: Gulf Coast Chemical IndustryThe single most important economic change across the Gulf Coast over the past two decades has been the introduction of low-cost, widely available natural gas. Even prior to the challenging 2000-2001 time period, and the tropical activity-induced turmoil of 2004-2005, natural gas was a relatively volatile-priced commodity, second only to crude oil. Today, that has all changed: natural gas is priced at consistently low and less-volatile levels than what has been observed in the past, even compared with the “golden age” of natural gas in the 1990s. This is important for the chemical industry since energy costs can comprise as much as 75 percent of the overall variable operating costs along the Gulf Coast. Lower cost and less-volatile natural gas prices are the foundation of today’s petrochemical industry renaissance.
Figure 12 underscores epochal changes in natural gas prices over the past three decades and underscores how chemical industry fortunes can change with these important input prices. Three natural gas pricing epochs are clearly discernable: (1) the price shock created by the winter of 2000-2001 that was the harbinger of serious structural problems in natural gas markets; (2) the turbulence of the 2004-2005 tropical seasons and continued volatility to 2008; and (3) the post-recession/post-shale revolution period running from 2009 to the current period.
The key take-aways from these natural gas pricing trends is that (a) natural gas prices have returned to levels that are more reasonable for chemical industry capital formation and (b) the decrease in volatility for the chemical industry’s primary input (natural gas) is orders of magnitude lower than anything reported in history; another positive catalyst for chemical industry capital formation.
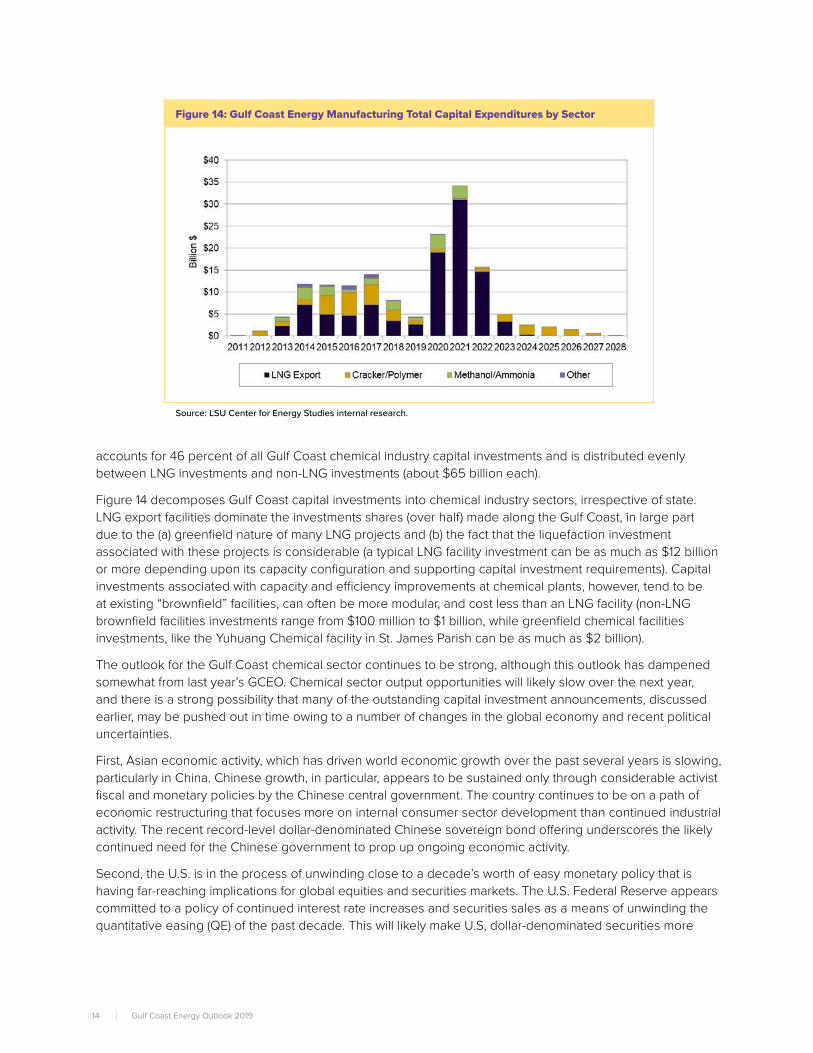
Figures 13 and 14 provide two di�erent views on chemical industry capital investment announcements over the past decade with the first chart (Figure 13) identifying current and projected capital investments between Texas and Louisiana, and the second chart (Figure 14), breaking these investments down by chemical industry sector that includes LNG export investments.
Figure 13 shows that chemical industry capital investment announcements have been relatively balanced between Louisiana and Texas over the course of the recent industrial renaissance. To date, Louisiana has
12 Gulf Coast Energy Outlook 2019
seen approximately $151.7 billion in actual and projected capital investment, whereas Texas captures $136.1 billion in actual and projected Gulf Cost chemical industry capital investment. The actual and announced capital investments in Louisiana comprise 51 percent of all Gulf Coast chemical industry capital investments, and are more heavily weighted to LNG export facilities investment ($100 billion). Texas, on the other hand,
Figure 12: Natural Gas Pricing Trends and Volatility
Source: Energy Information Administration. U.S. Department of Energy and LSU Center for Energy Studies.
Figure 13: Gulf Coast Region – Energy Manufacturing Capital Expenditures by State
Source: LSU Center for Energy Studies internal research.
13Louisiana State University
accounts for 46 percent of all Gulf Coast chemical industry capital investments and is distributed evenly between LNG investments and non-LNG investments (about $65 billion each).
Figure 14 decomposes Gulf Coast capital investments into chemical industry sectors, irrespective of state. LNG export facilities dominate the investments shares (over half) made along the Gulf Coast, in large part due to the (a) greenfield nature of many LNG projects and (b) the fact that the liquefaction investment associated with these projects is considerable (a typical LNG facility investment can be as much as $12 billion or more depending upon its capacity configuration and supporting capital investment requirements). Capital investments associated with capacity and e¤ciency improvements at chemical plants, however, tend to be at existing “brownfield” facilities, can often be more modular, and cost less than an LNG facility (non-LNG brownfield facilities investments range from $100 million to $1 billion, while greenfield chemical facilities investments, like the Yuhuang Chemical facility in St. James Parish can be as much as $2 billion).
The outlook for the Gulf Coast chemical sector continues to be strong, although this outlook has dampened somewhat from last year’s GCEO. Chemical sector output opportunities will likely slow over the next year, and there is a strong possibility that many of the outstanding capital investment announcements, discussed earlier, may be pushed out in time owing to a number of changes in the global economy and recent political uncertainties.
First, Asian economic activity, which has driven world economic growth over the past several years is slowing, particularly in China. Chinese growth, in particular, appears to be sustained only through considerable activist fiscal and monetary policies by the Chinese central government. The country continues to be on a path of economic restructuring that focuses more on internal consumer sector development than continued industrial activity. The recent record-level dollar-denominated Chinese sovereign bond o�ering underscores the likely continued need for the Chinese government to prop up ongoing economic activity.
Second, the U.S. is in the process of unwinding close to a decade’s worth of easy monetary policy that is having far-reaching implications for global equities and securities markets. The U.S. Federal Reserve appears committed to a policy of continued interest rate increases and securities sales as a means of unwinding the quantitative easing (QE) of the past decade. This will likely make U.S, dollar-denominated securities more
Figure 14: Gulf Coast Energy Manufacturing Total Capital Expenditures by Sector
Source: LSU Center for Energy Studies internal research.
14 Gulf Coast Energy Outlook 2019
attractive, thereby increasing dollar valuations. Increased dollar valuations, in turn, make Gulf Coast chemical industry exports more expensive and will likely serve as an additional drag (in addition to slowing global economic performance) for chemical exports.
Third, current U.S. trade policies create considerable uncertainties for U.S. firms making capital investment decisions at their existing Gulf Coast facilities, and international firms looking to make their own investments in the region. While some of the pressure associated European and North American (Mexico, Canada) trade policies have eased, the same cannot be said for U.S. trade policies directed at China. The GCEO anticipates that it is likely that many capital projects that have been announced, or are on the drawing boards, will be stalled until these uncertainties are removed.
3.2: An Emerging Export EconomyThe Gulf Coast has always had an extremely integrated energy economy as reflected in the complicated interactions between production and refineries, gas processing and fractionation, pipelines and storage facilities, refineries and petrochemical facilities, and among petrochemical facilities themselves. The disruptions associated with Hurricane Katrina underscored this complex web of forward and backward linkages among the region’s industries and infrastructure.
Throughout the 1970s and into the 1980s, the region’s energy economy started the process of transformation, primarily through the development of an expansive set of pipeline- and marine-based import facilities, most of which were bringing in various crude oil and other natural gas liquids (NGLs) from other parts of the world. These import facilities became more important as U.S. domestic production started to decrease and substitute hydrocarbon inputs were required. With these imports came a number of additional regional capital investments that were necessary to modify existing refineries and storage facilities to handle the qualitative di�erences in these imported feedstocks, which were often heavier and had higher sulfur contents.
By the middle part of the last decade, the Gulf Coast had become the major energy import region for the U.S. Over 55 percent of all U.S. crude oil imports landed at a Gulf Coast import facility. The Louisiana O�shore Oil Port (LOOP), originally developed in 1972, at its peak, handled as much 13 percent of all U.S. crude oil imports alone around this time period. These imports were distributed along the Gulf Coast, as well as transported by an expansive set of pipelines into the second largest refining area of the U.S., the upper Midwest (PADD 2).
The energy crisis of the last decade led to an additional transformation of the Gulf Coast energy economy through the construction of a number of LNG import facilities that would take foreign-sourced natural gas cooled to a temperature of -260 F, heat and treat that natural gas, compress it, and deliver it into growing U.S. natural gas markets, which, at the time, were thought to be running short of domestic supplies. The shale revolution quickly unwound this growing energy investment opportunity since, by the end of the decade, the unconventional natural gas resource base was large enough to change the conventional wisdom about the need for future natural gas imports.
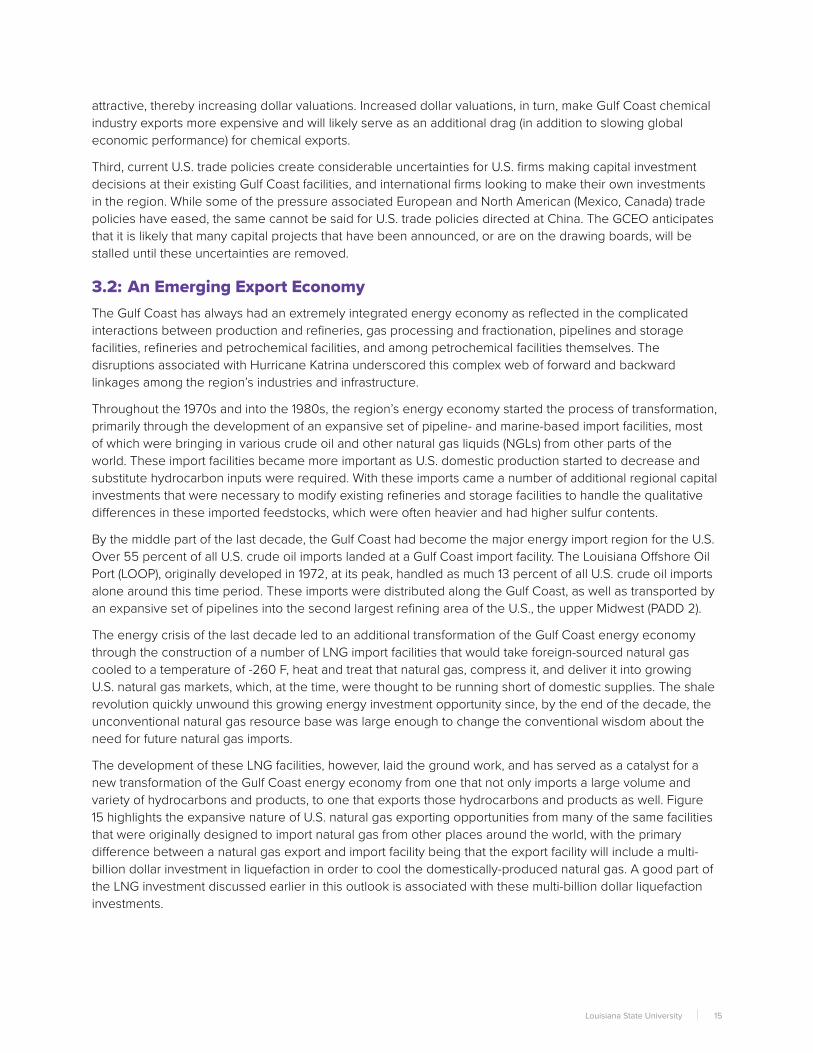
The development of these LNG facilities, however, laid the ground work, and has served as a catalyst for a new transformation of the Gulf Coast energy economy from one that not only imports a large volume and variety of hydrocarbons and products, to one that exports those hydrocarbons and products as well. Figure 15 highlights the expansive nature of U.S. natural gas exporting opportunities from many of the same facilities that were originally designed to import natural gas from other places around the world, with the primary di�erence between a natural gas export and import facility being that the export facility will include a multi-billion dollar investment in liquefaction in order to cool the domestically-produced natural gas. A good part of the LNG investment discussed earlier in this outlook is associated with these multi-billion dollar liquefaction investments.
15Louisiana State University
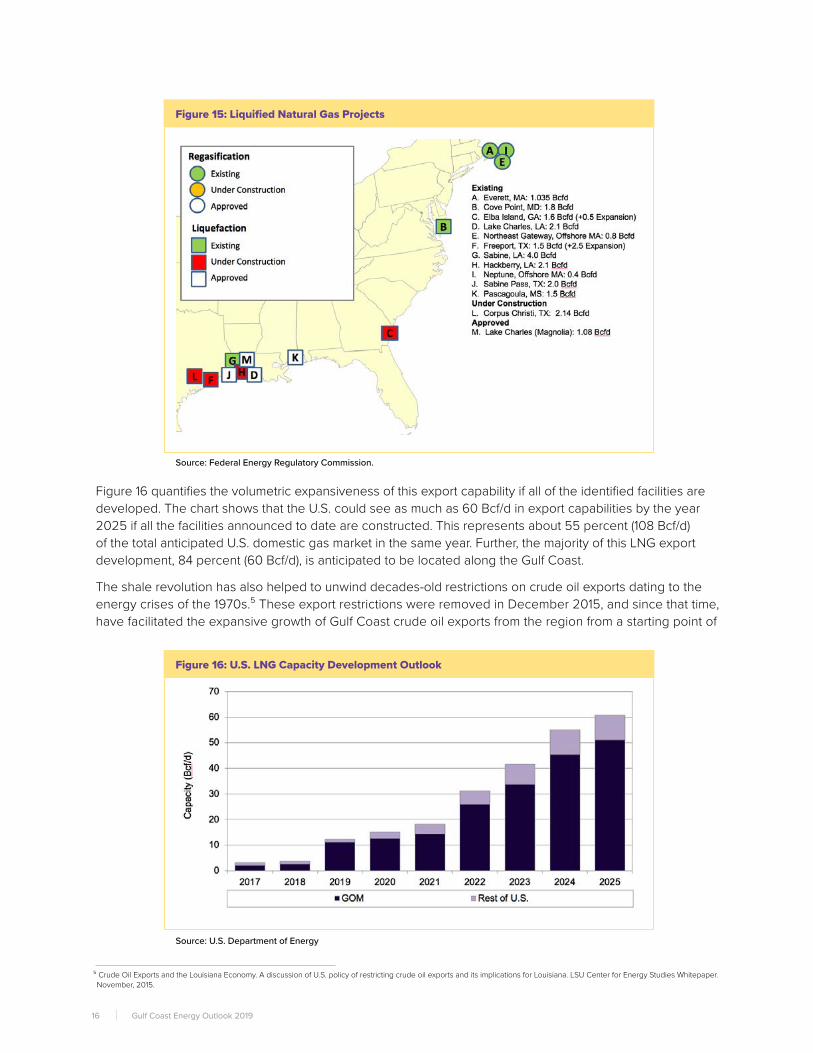
Figure 16 quantifies the volumetric expansiveness of this export capability if all of the identified facilities are developed. The chart shows that the U.S. could see as much as 60 Bcf/d in export capabilities by the year 2025 if all the facilities announced to date are constructed. This represents about 55 percent (108 Bcf/d) of the total anticipated U.S. domestic gas market in the same year. Further, the majority of this LNG export development, 84 percent (60 Bcf/d), is anticipated to be located along the Gulf Coast.
The shale revolution has also helped to unwind decades-old restrictions on crude oil exports dating to the energy crises of the 1970s.⁵ These export restrictions were removed in December 2015, and since that time, have facilitated the expansive growth of Gulf Coast crude oil exports from the region from a starting point of
⁵ Crude Oil Exports and the Louisiana Economy. A discussion of U.S. policy of restricting crude oil exports and its implications for Louisiana. LSU Center for Energy Studies Whitepaper. November, 2015.
Figure 15: Liquified Natural Gas Projects
Source: Federal Energy Regulatory Commission.
Figure 16: U.S. LNG Capacity Development Outlook
Source: U.S. Department of Energy
16 Gulf Coast Energy Outlook 2019
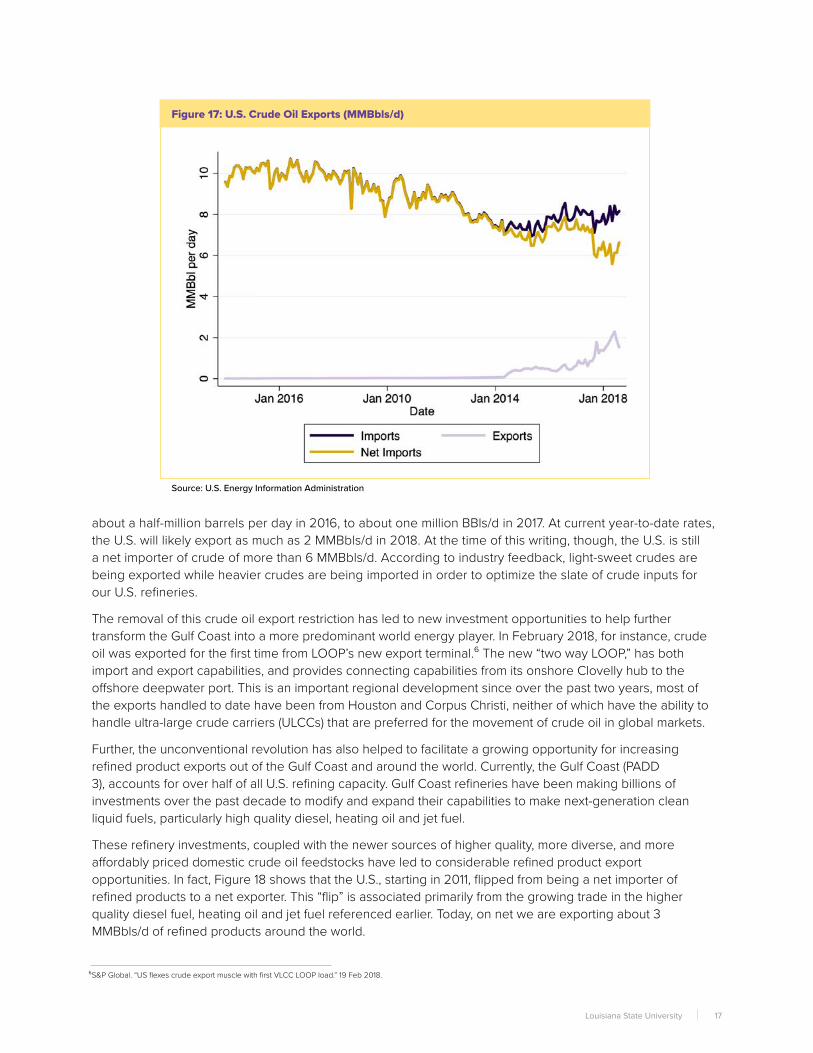
about a half-million barrels per day in 2016, to about one million BBls/d in 2017. At current year-to-date rates, the U.S. will likely export as much as 2 MMBbls/d in 2018. At the time of this writing, though, the U.S. is still a net importer of crude of more than 6 MMBbls/d. According to industry feedback, light-sweet crudes are being exported while heavier crudes are being imported in order to optimize the slate of crude inputs for our U.S. refineries.
The removal of this crude oil export restriction has led to new investment opportunities to help further transform the Gulf Coast into a more predominant world energy player. In February 2018, for instance, crude oil was exported for the first time from LOOP’s new export terminal.⁶ The new “two way LOOP,” has both import and export capabilities, and provides connecting capabilities from its onshore Clovelly hub to the o�shore deepwater port. This is an important regional development since over the past two years, most of the exports handled to date have been from Houston and Corpus Christi, neither of which have the ability to handle ultra-large crude carriers (ULCCs) that are preferred for the movement of crude oil in global markets.
Further, the unconventional revolution has also helped to facilitate a growing opportunity for increasing refined product exports out of the Gulf Coast and around the world. Currently, the Gulf Coast (PADD 3), accounts for over half of all U.S. refining capacity. Gulf Coast refineries have been making billions of investments over the past decade to modify and expand their capabilities to make next-generation clean liquid fuels, particularly high quality diesel, heating oil and jet fuel.
These refinery investments, coupled with the newer sources of higher quality, more diverse, and more a�ordably priced domestic crude oil feedstocks have led to considerable refined product export opportunities. In fact, Figure 18 shows that the U.S., starting in 2011, flipped from being a net importer of refined products to a net exporter. This “flip” is associated primarily from the growing trade in the higher quality diesel fuel, heating oil and jet fuel referenced earlier. Today, on net we are exporting about 3 MMBbls/d of refined products around the world.
⁶S&P Global. “US flexes crude export muscle with first VLCC LOOP load.” 19 Feb 2018.
Figure 17: U.S. Crude Oil Exports (MMBbls/d)
Source: U.S. Energy Information Administration
17Louisiana State University

Lastly, and perhaps more importantly, the industrial renaissance along the Gulf Coast has led to some of the most expansive opportunities for transforming the region into a global energy export powerhouse. These facilities, collectively, process U.S. hydrocarbons into value-added chemicals designed for world markets, particularly Asia where Louisiana alone has a trade surplus, not deficit, of almost $7 billion with China. Thus the Gulf Coast’s energy future does not rest in supplying domestic requirements, as it has in the decades past, but in supplying the energy and commodity chemical requirements of the world.
Consider, for instance, the growth in U.S. ammonia demand is around 0.5 percent per year, whereas ammonia demand in Asia is almost two percent per year. U.S. methanol demand, while up in recent years, has a growth rate that averages around 2.5 percent per year while that demand in Asia is about five percent per year. In fact, it is projected that by 2021, Asian methanol demand will account for 70 percent of worldwide demand, while North America and Europe will account for nine percent and eight percent, respectively.⁷
Thus, the billions in recent Gulf Coast industrial investments have not been made to serve the relatively mature, slow-growing U.S. market, but its faster growing counterparts in Asia. Recent numbers show the success of these billions invested in Louisiana. Chemical and energy industry exports from the state have increased by almost 350 percent since the beginning of the “industrial renaissance.” Currently, Louisiana alone exports over $28 billion in chemical and energy products. This represents 50 percent of all exports leaving the state, compared to just 27 percent in the early 2000s -- a number that underscores the transformation of the region into an energy export powerhouse.
⁷IHS Markit. Global methanol demand growth driven by methanol to olefins as Chinese thirst for chemical supply grows, IHS Markit says. June 12, 2017.
Figure 18: U.S. Refined Product Trade (MMBbls/d)
Source: U.S. Energy Information Administration
18 Gulf Coast Energy Outlook 2019
4 | Employment Forecasts and Broader Economic Implications
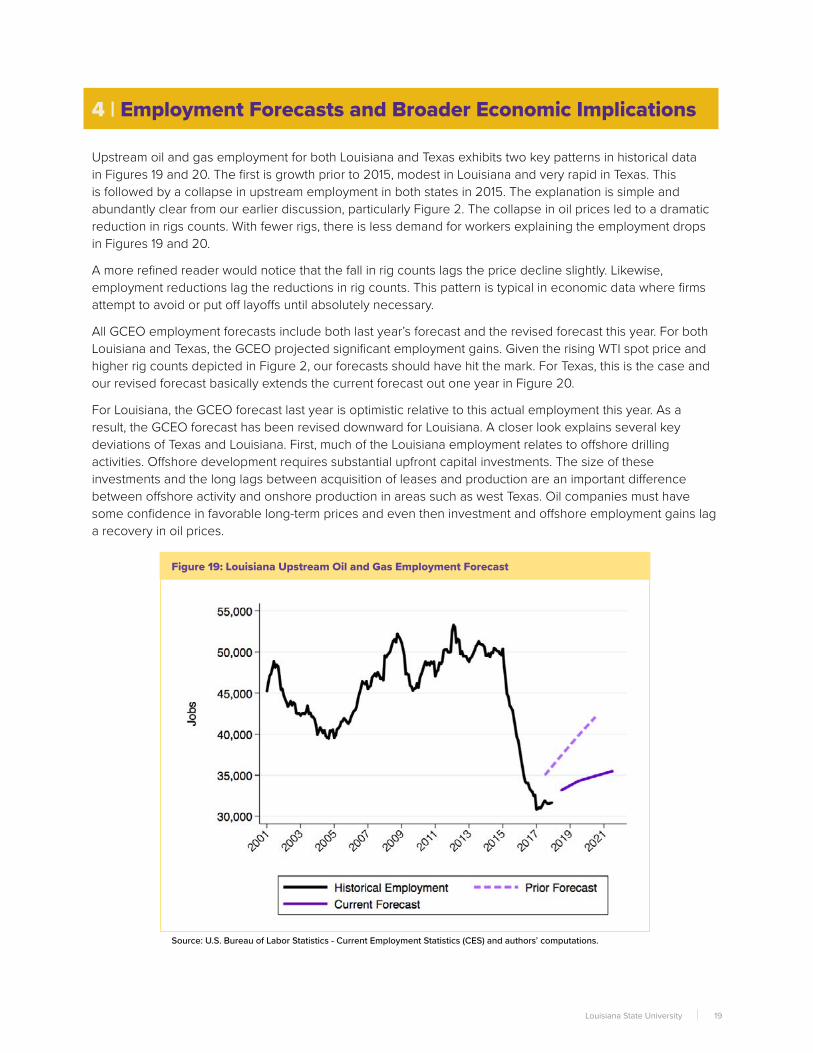
Upstream oil and gas employment for both Louisiana and Texas exhibits two key patterns in historical data in Figures 19 and 20. The first is growth prior to 2015, modest in Louisiana and very rapid in Texas. This is followed by a collapse in upstream employment in both states in 2015. The explanation is simple and abundantly clear from our earlier discussion, particularly Figure 2. The collapse in oil prices led to a dramatic reduction in rigs counts. With fewer rigs, there is less demand for workers explaining the employment drops in Figures 19 and 20.
A more refined reader would notice that the fall in rig counts lags the price decline slightly. Likewise, employment reductions lag the reductions in rig counts. This pattern is typical in economic data where firms attempt to avoid or put o� layo�s until absolutely necessary.
All GCEO employment forecasts include both last year’s forecast and the revised forecast this year. For both Louisiana and Texas, the GCEO projected significant employment gains. Given the rising WTI spot price and higher rig counts depicted in Figure 2, our forecasts should have hit the mark. For Texas, this is the case and our revised forecast basically extends the current forecast out one year in Figure 20.
For Louisiana, the GCEO forecast last year is optimistic relative to this actual employment this year. As a result, the GCEO forecast has been revised downward for Louisiana. A closer look explains several key deviations of Texas and Louisiana. First, much of the Louisiana employment relates to o�shore drilling activities. O�shore development requires substantial upfront capital investments. The size of these investments and the long lags between acquisition of leases and production are an important di�erence between o�shore activity and onshore production in areas such as west Texas. Oil companies must have some confidence in favorable long-term prices and even then investment and o�shore employment gains lag a recovery in oil prices.
Figure 19: Louisiana Upstream Oil and Gas Employment Forecast
Source: U.S. Bureau of Labor Statistics - Current Employment Statistics (CES) and authors’ computations.
19Louisiana State University

Another good news/bad news item for o�shore employment in the Gulf of Mexico is productivity gains. There have been substantial gains in productivity such as standardization of platforms and the use of tie-backs to avoid the need for heavy surface infrastructure. This is great news in terms of making the Gulf of Mexico more competitive for future production by lowering costs per barrel of production. However, these productivity gains also that fewer workers are needed for a given level of production. The slight uptick in LA 1 tra¤c counts generally conforms to the recent employment data and our current more modest forecast for short-term growth.
In terms of land production, the GCEO does not anticipate any significant uptick in upstream activity. The completion of additional pipelines linking the Haynesville field to natural gas users should be a favorable development on that side and suggests that our forecast may be a bit conservative, particularly in 2021.
The forecasts of refining and chemical employment generally matched data for the most recent year quite well in both Louisiana and Texas as seen in Figures 21 and 22. For Louisiana, the GCEO forecast is based on simply updating our model to reflect more recent data and developments which essentially extends the current forecast out one additional year. Texas refining and chemical employment was slightly higher for the year than anticipated. This fact and significant new announcements previously discussed led to a modest increase in the GCEO employment forecast in Texas.
Figure 20: Texas Upstream Oil and Gas Employment Forecast
Source: U.S. Bureau of Labor Statistics - Current Employment Statistics (CES) and authors’ computations.
20 Gulf Coast Energy Outlook 2019

Figure 21: Louisiana Refining and Chemical Manufacturing Employment Forecast
Source: U.S. Bureau of Labor Statistics - Current Employment Statistics (CES) and authors’ computations.
Figure 22: Texas Refining and Chemical Manufacturing Employment Forecast
Source: U.S. Bureau of Labor Statistics - Current Employment Statistics (CES) and authors’ computations.
21Louisiana State University

5 | Conclusions
Overall, the 2019 outlook for the Gulf Coast’s energy industries is a mixed bag: the potential outcomes being a function of the individual energy sector.
U.S. and Gulf Coast domestic crude oil and natural gas production should continue to be strong. The nation and region will build upon existing productivity gains and higher overall prices will continue to facilitate more drilling activity. This drilling activity may start to diversify, in terms of location, over the upcoming few years, but not enough to knock the Permian basin o� its perch as being the premier U.S. unconventional basin. OCS production should also be strong; however, drilling activity will likely stay in the 20 or so active rig count range for the immediate future. Overall, the Gulf Coast will continue to account for over half of U.S. crude oil supplies and make an important contribution to overall global energy supplies.
U.S. crude oil production is anticipated to continue to rise to 12.9 MMBBls/d by 2020. Gulf Coast production is forecast to rise to 8.4 MMBBls/d by 2020. Near-term pipeline constraints are anticipated to limit the degree to which Permian production will exceed forecast levels, and if the region does exceed the anticipated GCEO baseline outlook, it will likely be due to increased production in other basins within the region, particularly the o�shore OCS.
U.S. natural gas production is anticipated to rise to 97.8 Bcf/d whereas Gulf Coast production will increase to 38.0 BCF/d, both by 2020. Regional natural gas output will be heavily skewed towards associated gas production, and continued crude oil production growth should facilitate a well-supplied natural gas market for both domestic use and LNG exports.
The outlook for prices (crude oil, natural gas) is a little more complicated than last year given what are considerable and growing geopolitical risks and uncertainties that some industry analysts say could push prices in the near term, to levels are conceivably over $90/Bbl. The GCEO sees such an outcome as unlikely given a number of factors that include (a) a slow-down in Asian demand; (b) continued lackluster energy demand growth in Europe; (c) a potential economic slowing in the U.S.; (d) increased dollar valuations; (e) the potential for additional U.S. supplies to hit the world markets; (f) potential near-term sanction exemptions on Iranian supplies; and (f) supply coordination between Saudi Arabia and Russia to fill in missing barrels that may arise from the continued uncertainty in Iran and Venezuela. Futures market anticipate crude prices to converge to around $60-$65/Bbl over the next few years. Natural gas prices are anticipated to drop over the next two years and then stabilize at between $2.50 to $3 /MCF. This is likely due to the growth in associated gas coming out of oil plays, like the Permian basin.
The 2019 GCEO petrochemical industry outlook is flat. The capacity utilization outlook for existing and recent investments will likely not increase in any measurable fashion given a number of global headwinds that include: (a) a slow-down in Asian demand; (b) increased dollar valuations; and (c) continued trade policy uncertainties. The GCEO does not anticipate any chemical industry or LNG project cancellations, but it is not implausible to see that many currently announced projects move out their anticipated project commercial operation dates in order to account for the current global market and geopolitical uncertainties.
The 2019 GCEO sees a continued positive, yet limited growth outlook for U.S. refining. Refineries will benefit from continued growth of U.S. crude oil supplies and the geographic diversity of those supplies. The sector will also benefit from continued pipeline infrastructure moving into and within the region. E¤ciency investments and other capital improvements made over the past several years should also increase refinery profitability. However, refined product export growth in middle distillates (jet fuel, diesel) could slow due to an anticipated global economic slow-down and higher dollar valuations.
22 Gulf Coast Energy Outlook 2019

Thus, on an overall basis, the GCEO anticipates, on average, that the region will build upon its economic gains of the last year, although those gains will likely be much slower due to concerns about economic growth and several geopolitical tensions that create uncertainties that are not conducive for capital formation and growth in this industry. The region will continue to become a more integrated part of the overall world energy market and will likely place itself in a favorable position for future growth once some of these uncertainties start to evaporate.
Finally, the GCEO sees regional employment continuing to grow over the next year in both the upstream and downstream sectors for both Louisiana and Texas. For the Louisiana upstream employment, while we still do anticipate employment growth over the next three years, we have tempered the rate of increase significantly. For Louisiana, the refining and chemical manufacturing industries now employ more workers than the upstream sector, and we anticipate this to continue in coming years. Even after the last oil price crash, Texas still employs approximately two workers in the upstream sector for every downstream employee. Thus, the relative composition of these two sides of this industry is increasingly di�erent between Texas and Louisiana. This highlights the growing importance of international trade issues, especially for Louisiana.
23Louisiana State University

The Center for Energy StudiesThe Center for Energy Studies conducts, encourages, and facilitates research and analysis to address energy-related problems or issues a�ecting Louisiana’s economy, environment, and citizenry. The Center’s goal is to provide a balanced, objective, and timely treatment of issues with potentially important consequences for Louisiana.
The Center for Energy Studies was created by the Louisiana Legislature in 1982 as the embodiment of recommendations made by an independent group of experts and at the urging of Louisiana business and public interest groups, as well as the University.
ces.lsu.edu
The Energy ProgramThe Energy Program at the LSU E. J. Ourso College of Business is designed to provide the skills and knowledge needed by the next generation of energy professionals. Not only do students take classes that are specific to the energy sector, but they are also provided a wide range of learning opportunities, including site visits, access to speakers in the industry, case competitions, energy conferences and expos, and industry-related internships.
business.lsu.edu/energy
24 Gulf Coast Energy Outlook 2019

E. J. Ourso College of Businesslsu.edu/business
Center for Energy Studiesces.lsu.edu
Sponsors