Guiding Data-Driven Transportation Decisions
24
Portland State University Portland State University PDXScholar PDXScholar Computer Science Faculty Publications and Presentations Computer Science 2014 Guiding Data-Driven Transportation Decisions Guiding Data-Driven Transportation Decisions Kristin A. Tufte Portland State University Basem Elazzabi Portland State University Nathan Hall Portland State University Morgan Harvey Portland State University Kath Knobe Intel See next page for additional authors Follow this and additional works at: https://pdxscholar.library.pdx.edu/compsci_fac Part of the Computer Sciences Commons, and the Urban Studies and Planning Commons Let us know how access to this document benefits you. Citation Details Citation Details Tufte, Kristin A.; Elazzabi, Basem; Hall, Nathan; Harvey, Morgan; Knobe, Kath; Maier, David; and Megler, Veronika Margaret, "Guiding Data-Driven Transportation Decisions" (2014). Computer Science Faculty Publications and Presentations. 128. https://pdxscholar.library.pdx.edu/compsci_fac/128 This Technical Report is brought to you for free and open access. It has been accepted for inclusion in Computer Science Faculty Publications and Presentations by an authorized administrator of PDXScholar. Please contact us if we can make this document more accessible: [email protected].
Transcript of Guiding Data-Driven Transportation Decisions

Portland State University Portland State University
PDXScholar PDXScholar
Computer Science Faculty Publications and Presentations Computer Science
2014
Guiding Data-Driven Transportation Decisions Guiding Data-Driven Transportation Decisions
Kristin A. Tufte Portland State University
Basem Elazzabi Portland State University
Nathan Hall Portland State University
Morgan Harvey Portland State University
Kath Knobe Intel
See next page for additional authors
Follow this and additional works at: https://pdxscholar.library.pdx.edu/compsci_fac
Part of the Computer Sciences Commons, and the Urban Studies and Planning Commons
Let us know how access to this document benefits you.
Citation Details Citation Details Tufte, Kristin A.; Elazzabi, Basem; Hall, Nathan; Harvey, Morgan; Knobe, Kath; Maier, David; and Megler, Veronika Margaret, "Guiding Data-Driven Transportation Decisions" (2014). Computer Science Faculty Publications and Presentations. 128. https://pdxscholar.library.pdx.edu/compsci_fac/128
This Technical Report is brought to you for free and open access. It has been accepted for inclusion in Computer Science Faculty Publications and Presentations by an authorized administrator of PDXScholar. Please contact us if we can make this document more accessible: [email protected].

Authors Authors Kristin A. Tufte, Basem Elazzabi, Nathan Hall, Morgan Harvey, Kath Knobe, David Maier, and Veronika Margaret Megler
This technical report is available at PDXScholar: https://pdxscholar.library.pdx.edu/compsci_fac/128

Guiding Data-Driven Transportation Decisions
Kristin A. Tufte Departments of Computer Science and Civil and Environmental Engineering Portland State University P.O. Box 751 Portland, OR 97207-0751 Email: [email protected] Basem Elazzabi Department of Computer Science Portland State University Email: [email protected] Nathan Hall Department of Computer Science Portland State University Email: [email protected] Morgan Harvey Department of Civil and Environmental Engineering Portland State University Email: [email protected] Kath Knobe Intel Corporation Email: [email protected] David Maier Department of Computer Science Portland State University Email: [email protected] Veronika Megler Department of Computer Science Portland State University Email: [email protected]

Guiding Data-Driven Transportation Decisions 2
Guiding Data-driven Transportation Decisions
ABSTRACT
Urban transportation professionals are under increasing pressure to perform data-driven decision
making and to provide data-driven performance metrics. This pressure comes from sources
including the federal government and is driven, in part, by the increased volume and variety of
transportation data available. This sudden increase of data is partially a result of improved
technology for sensors and mobile devices as well as reduced device and storage costs. However,
using this proliferation of data for decisions and performance metrics is proving to be difficult. In
this paper, we describe a proposed structure for a system to support data-driven decision making.
A primary goal of this system is improving the use of human time, effort and attention with side
benefits of improved consistency and documentation.
INTRODUCTION
Data-driven decision making and data-driven performance metrics are a high priority in the
transportation world today and are the focus of much attention and effort. An influx of new
sensors and data from those sensors along with pressure from the federal government and new
federal regulations, such as MAP-21 (FHWA, 2102) is driving the focus on data-driven decisions
and metrics. However, turning this explosion of new data into actionable information is difficult.
The current state of support in data-driven performance reporting is limited by several factors
including data stored across disparate locations and systems, insufficient documentation of how
data was chosen and assembled, and manual manipulation of the data. These factors limit the
ability of urban transportation professionals to produce and reuse the work done to create data-
driven performance metrics.
In this paper, we present a proposed system structure that begins to address these issues. Our
system aims to support integration across diverse-distribution data sources and to increase re-use
of the data and processing mechanisms. We aim to improve productivity by improving the
effective use of human time. Our system contains three key parts: The Portland Observatory,
Guides and Concurrent Collections (CnC) (Burke, Knobe, et al. 2010). The Portland Observatory
collects urban transportation-related data in a single location (or common portal), Guides

Guiding Data-Driven Transportation Decisions 3
represent decisions made in selecting and assembling data related to a decision or performance
metric and CnC helps automate Guide instantiation.
As a simple example of the motivation for our system, consider creating a mobility performance
report. A mobility report is a common type of report generated by transportation professionals;
such a report describes the ability of the population to move around an urban area and uses
metrics such as travel time, travel speed and reliability of travel time. Creating such a report
requires first tracking down and selecting data sources followed by data cleaning and analysis
and generation of graphics. We observe that decision-making tasks are recurrent - similar
decisions may need to be made for reports created for different locations and time periods (i.e.
annual reports).
The first step in creation of this report is tracking down data sources. In the current state these
data sources may be on local hard drives, on central storage servers at possibly different agencies
or in other disparate places. The Portland Observatory collects data in one location or portal
simplifying the process of tracking down data sources. A second step in creating the report is to
perform analysis to produce mobility performance metrics; this step may include data cleaning,
analysis and generation of graphics. We observe that decisions, such as excluding a set of
sensors due to construction, are typically made along the way. A Guide is like a template for a
decision-making task; Guides capture the input data criteria, data cleaning and analysis processes
and decisions. By capturing the cleaning, analysis and decision process, Guides enable
retrospective review of the performance metric-generation process. In addition, Guides enable
reuse of the work done generating performance metrics and help ensure that analysis is
consistent across decisions and reports. The CnC parallel programming environment is used to
automate Guide instantiation to improve re-use and productivity.
We begin this paper by presenting three example reports produced in the Portland, OR-
Vancouver, WA metropolitan region. We discuss each report and then summarize the
connections and similarities between the reports and how those similarities might be leveraged.
We next present Guides - our technique for encapsulating the report-creation process and context
- we discuss guide motivation, content and structure. We proceed to discuss data collection and

Guiding Data-Driven Transportation Decisions 4
opportunities for leverage therein. Finally, we describe a proposed system architecture and
conclude with a description of our prototype guide implementation.
EXAMPLE REPORTS
We begin by describing three reports that are currently generated in the Portland, OR-
Vancouver, WA metropolitan region: The Metro Performance Measures Report, the RTC
Congestion Management Process Monitoring Report and the Metro Portal Annual Report. For
each report, we identify a key product in the report that we will discuss in the comparison section
below and use in our guide prototype implementation.
Metro Performance Measures Report (Portland, OR)
The Metro Performance Measures Report is a performance report that is generated every two
years by Metro, the regional government for the Portland, OR region. The report is generated in
response to Oregon State Statues and consists of 12 measures related to land use planning and
coordination including development density, job creation, land use and transportation measures.
Measure 9 in the report contains transportation-related measures - specifically "Transportation
measures including mobility, accessibility, and air quality indicators" (Metro, 2011). We focus
on the mobility and accessibility metrics, which include vehicle miles traveled, travel time
reliability for major freeways, and transit ridership. The vehicle miles traveled in the Metro
report is taken from the FHWA State Performance Monitoring system. The travel time reliability
numbers come from the data in the Portal data archive. Portal is the regional transportation data
archive for the Portland, OR-Vancouver, WA metropolitan region (Portal, 2014). The key
product in the Metro Performance Measures Report that we use for analysis and prototyping is a
table of travel time reliability measures that includes average travel time and average congested
travel time for freeways in the Portland region; Table 9.2 in the 2011 report.
Key product: Table of travel time reliability.
RTC Congestion Management Process Monitoring Report (Vancouver, WA)
The Congestion Management Process Monitoring Report is an annual report produced by the
Southwest Washington Regional Transportation Council (RTC). Federal law requires that RTC

Guiding Data-Driven Transportation Decisions 5
maintain a Congestion Management Process (CMP); the CMP Monitoring report is part of RTC's
CMP process. The annual report "provides a comprehensive set of data for monitoring the
performance of the transportation system" and "provides on the travel characteristics of the
regional transportation corridors" (RTC, 2013). The report contains a System Monitoring section
that provides system performance measures including vehicle volumes, capacity ratio, travel
speed and intersection delay, vehicle occupancy, safety, truck percentage and several transit
measures including ridership and on-time performance. The key product in this report that we
focus on for analysis and prototyping is the Speed: Auto Travel Speed and Speed: Speed as
Percent of Speed Limit metrics. These speed metrics are presented as maps in the report;
specifically, maps 8, 9, 10 and 11 in the 2013 report. We note that at the current time, the speed
metrics are based on probe runs. However, once confidence in the data is established, these
metrics could be based on data collected through automated sensors, such as Bluetooth detectors
and high-definition radar. Basing the metrics on installed sensors has the potential to increase
temporal and spatial coverage of the metrics. Though not discussed in this paper, the report also
uses Vehicle Volume metrics.
Key product: Maps of Auto Travel Speed and Speed as a Percent of Speed Limit
Metro Portal Annual Report (Portland, OR)
The Metro Portal Annual Report is a small report produced annually by the Portal team at
Portland State University. The report was first produced in 2012 and is expected to be generated
annually. This report contains two primary types of products: maps of speed and plots of volume
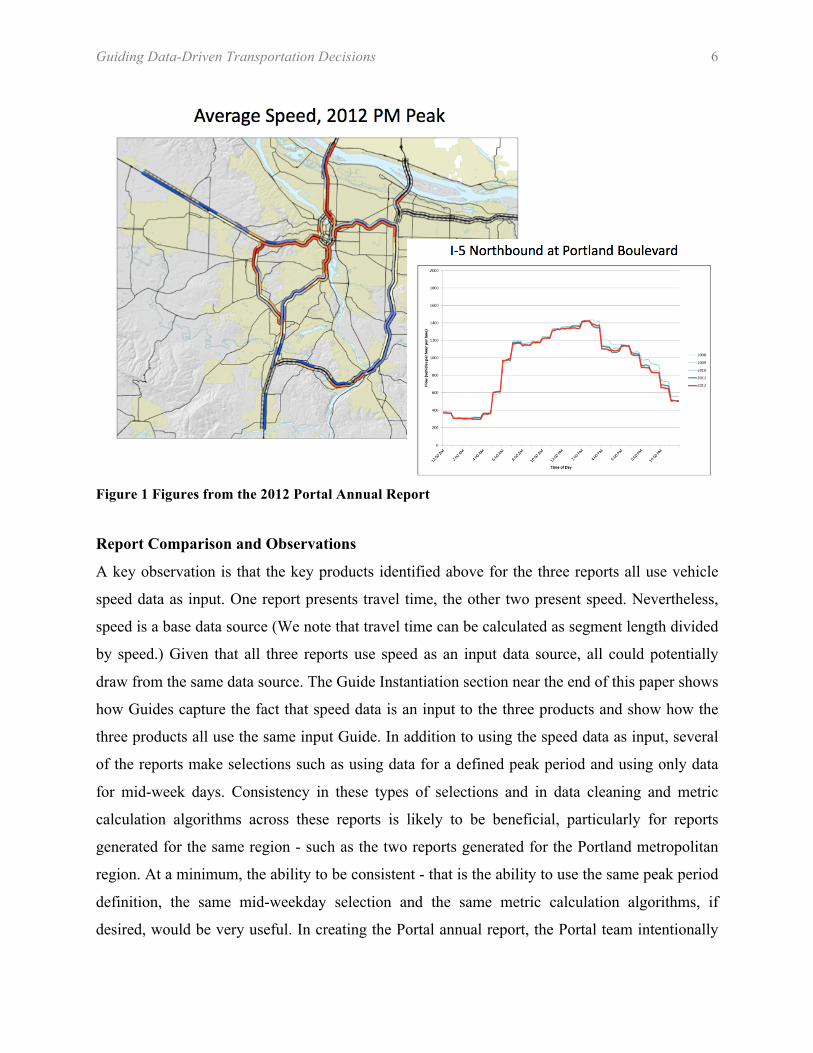
by highway. Figure 1 shows a map and a sample plot from the 2012 Portal Annual Report. The
map shows average vehicle travel speeds in the PM Peak period (4-6PM) for the freeways in
Portland in 2012. The plot shows 15-minute volumes by time of day for mid-weekdays for the I-
5 freeway in Portland at Portland Boulevard. The report contains a series of such plots for key
freeway locations.
Key products: Travel Speed Maps and Volume Plots by Highway.
Guiding Data-Driven Transportation Decisions 6
Figure 1 Figures from the 2012 Portal Annual Report
Report Comparison and Observations
A key observation is that the key products identified above for the three reports all use vehicle
speed data as input. One report presents travel time, the other two present speed. Nevertheless,
speed is a base data source (We note that travel time can be calculated as segment length divided
by speed.) Given that all three reports use speed as an input data source, all could potentially
draw from the same data source. The Guide Instantiation section near the end of this paper shows
how Guides capture the fact that speed data is an input to the three products and show how the
three products all use the same input Guide. In addition to using the speed data as input, several
of the reports make selections such as using data for a defined peak period and using only data
for mid-week days. Consistency in these types of selections and in data cleaning and metric
calculation algorithms across these reports is likely to be beneficial, particularly for reports
generated for the same region - such as the two reports generated for the Portland metropolitan
region. At a minimum, the ability to be consistent - that is the ability to use the same peak period
definition, the same mid-weekday selection and the same metric calculation algorithms, if
desired, would be very useful. In creating the Portal annual report, the Portal team intentionally

Guiding Data-Driven Transportation Decisions 7
used the same selections as in the Metro Performance Measures Report. Capturing those
selections in a formal process would be useful for future report creation. As we will describe,
Guides also capture these types of selections.
GUIDES
In one sentence, a Guide is an encapsulation of the experience required to answer a question. We
proceed to discuss Guide motivation, concept and structure.
Guide Motivation
The reports described above currently require manual effort for data collection and combination
and review and cleaning. In some cases, the process is retained in human memory and is not
documented. The nuanced decisions about data cleaning and combination, which come about
after years of producing reports are difficult to articulate and document. However, we observe
that some pieces of the report creation can be automated. Guides are designed to capture the
pieces of report generation that can be captured.
One might first consider some alternatives. Data integration has been an area of research in
computer science for years (Halevy, 2006). However, a heavy-grade data integration approach
may not be justified for producing transportation performance reports - the example reports are
generated annually or bi-annually, for this type of reporting, even for quarterly reporting, the cost
of maintaining an integrated schema is too much; however, making the data sources accessible
through a common portal is useful. Creating a common portal could mean putting the data in a
database where it can be accessed with SQL queries. SQL queries are very useful and powerful,
but they don't record judgments or the reasoning behind the judgments made in report creation.
In short, traditional data management techniques may be overkill (i.e. data integration) or may
not capture the required information (i.e. SQL queries).
While we understand that we can't totally eliminate human involvement, we do believe that we
can we make it easier for humans to be involved, increase the efficiency of human involvement
and capture some of the human judgments - i.e. the reason a set of data was eliminated from
consideration.

Guiding Data-Driven Transportation Decisions 8
Guide - Concept
A Guide is a set of information that describes and encapsulates a decision-making process. By
describing and encapsulating a decision-making process, a guide may enable reuse of data or
algorithms by making it easier to switch data sources, to respond to a change in the format of a
data source or to re-create a report in a different context - i.e. take a report done for one
metropolitan area and create it for another metropolitan area.
We identify the following objectives for guides:
• A guide should capture both the data requirement and how the data requirement is being
met in a particular instantiation of the guide.
• A guide should embody requirements and expectations as well as results.
• A guide should also capture weaknesses of the current data set so that if the ideal data set
becomes available or is available in a different locality, it can be used (i.e. volumes by
vehicle type were the desired data source, but that data was not available).
• Guides should capture requirements, not just process. The process may over- or under-
constrain due to specifics of the locality and time for which the report is generated. The
process may capture which data is not used for the report, it may not capture why that
data was not used.
Guide Structure
We have identified the following fields as being part of a Guide.
1. Question - The question answered by a Guide.
2. Name - The guide name.
3. Description - A text description of the guide.
4. Parameters - Parameters to the guide such as spatial location or time period.
5. Input Data - A list of data sources and variables (attributes) needed from each data
source.
6. Queries and Analysis - Code such as SQL queries for analyzing the data.

Guiding Data-Driven Transportation Decisions 9
7. Output Data and Format - A list of variables (including types) in the output, output
format and output structure (or organization).
8. Decisions - Decisions made during creation of the report.
9. Quality - Some indication of the quality of the results such as a list of suitable uses.
10. Comments - Things you learned along the way.
Guide Creation and Re-Use
Another motivation for guides is to leverage expert knowledge. A particular analyst may be an
expert in travel time calculation algorithms or a particular MPO (Metropolitan Planning
Organization) may create a report to meet a specific regulation. Guides are intended to capture
such knowledge so it can be easily transferred to other analysts or MPOs. We imagine an initial
guide being created by highly skilled person who selects data and specifies computations and
builds the guide from scratch. A medium skilled person may be able to take that guide and
customize it for a time period or a metropolitan area; such a person may understand the general
concept of the report, but may not be familiar with the details of the calculation algorithms.
Finally, we imagine a lower skills person may be able to simply re-run a report by specifying
parameters such as a desired year. This person may not have an understanding of the report, but
is able to create different versions of the report.
DATA COLLECTION
As discussed, a key issue in creating performance metric reports is locating and combining data.
The Portland Observatory acts as an aggregator and repository for transportation data acquired
from a variety of agencies in the Portland-Vancouver metropolitan area. The Portland
Observatory leverages Portal, the Portland-Vancouver region's transportation data archive
(Portal, 2014). Portal consists of a PostgreSQL database containing approximately 3TB of
transportation-related data collected from Portland-Vancouver area agencies over the past ten
years and a web interface. The data in Portal includes freeway loop detector data, weather data,
Bluetooth travel time data, weigh-in-motion data, transit data, arterial signal data and more.
Figure 2 shows two screenshots from the Portal Data Archive web interface.

Guiding Data-Driven Transportation Decisions 10
Figure 2 Portal Data Archive Web Interface
Data Collection
Data flows into Portal from a variety of sources and systems, collected by agencies using a
variety of sensor technologies and vendor systems supporting them. Table 1 shows the Arterial,
Transit and State Highway data sources for the Portal archive by agency and type of data. In
Table 1, sources in the process of being integrated are in italics. All other sources arrive in
automated or semi-automated (in a few cases) fashion. Considering Table 1, we observe a few
patterns of interest from a data management perspective.
Common Data Formats: Some types of data are produced by multiple agencies. Both Transit
agencies - TriMet (OR) and C-TRAN (WA) produce GTFS data. In this case, the data produced
is in identical formats across systems.
Common Systems: Several agencies use common systems. For example, agencies that manage
traffic signals in the Portland area use the TransSuite central system, agencies that manage traffic
signals in Vancouver use the ATMS.Now central signal system.
Guiding Data-Driven Transportation Decisions 11
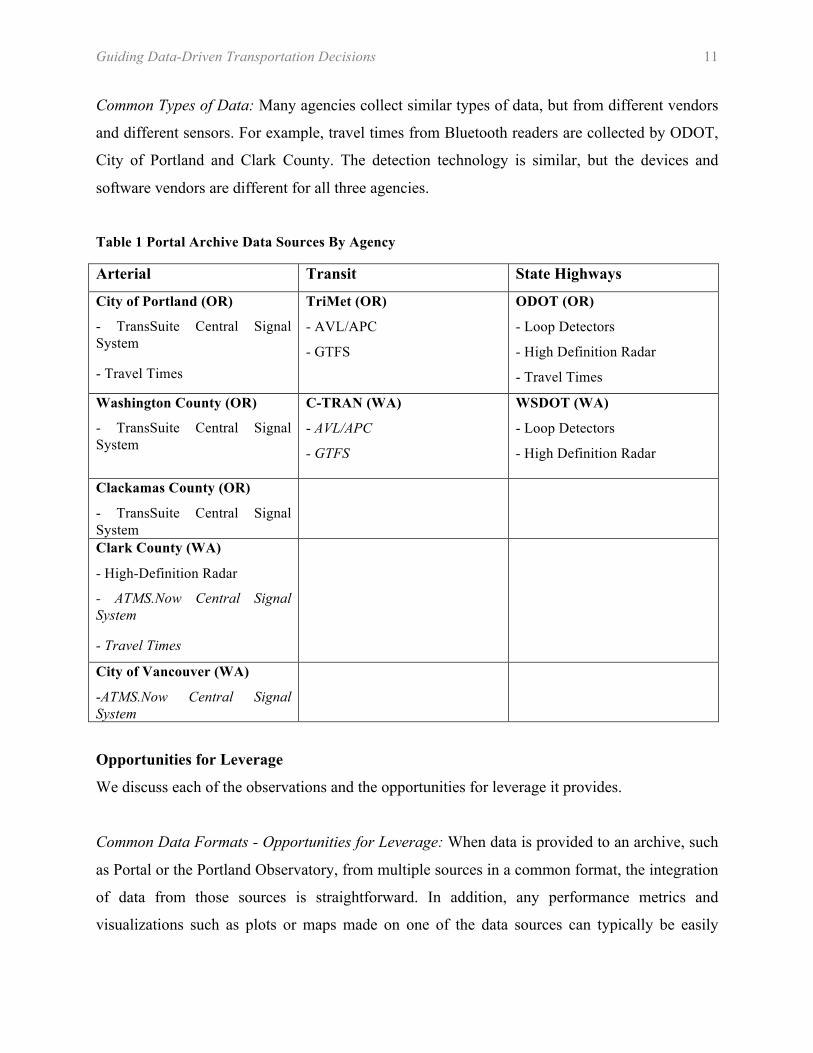
Common Types of Data: Many agencies collect similar types of data, but from different vendors
and different sensors. For example, travel times from Bluetooth readers are collected by ODOT,
City of Portland and Clark County. The detection technology is similar, but the devices and
software vendors are different for all three agencies.
Table 1 Portal Archive Data Sources By Agency
Arterial Transit State Highways
City of Portland (OR)
- TransSuite Central Signal System
- Travel Times
TriMet (OR)
- AVL/APC
- GTFS
ODOT (OR)
- Loop Detectors
- High Definition Radar
- Travel Times
Washington County (OR)
- TransSuite Central Signal System
C-TRAN (WA)
- AVL/APC
- GTFS
WSDOT (WA)
- Loop Detectors
- High Definition Radar
Clackamas County (OR)
- TransSuite Central Signal System
Clark County (WA)
- High-Definition Radar
- ATMS.Now Central Signal System
- Travel Times
City of Vancouver (WA)
-ATMS.Now Central Signal System
Opportunities for Leverage
We discuss each of the observations and the opportunities for leverage it provides.
Common Data Formats - Opportunities for Leverage: When data is provided to an archive, such
as Portal or the Portland Observatory, from multiple sources in a common format, the integration
of data from those sources is straightforward. In addition, any performance metrics and
visualizations such as plots or maps made on one of the data sources can typically be easily

Guiding Data-Driven Transportation Decisions 12
extended to data from the other data sources. Google has developed the General Transit Feed
Specification (GTFS) for describing transit schedule and arrival data (Google, 2014). This format
greatly simplifies processing and visualizing transit data across agencies. GTFS is one of the few
commonly used Common Data Formats of which we are aware.
Common Systems - Opportunities for Leverage: Both the Portland, OR and Vancouver, WA
regions use common central signal systems; though the signal system used by the Portland region
is different than the signal system used by the Vancouver region. Data coming from a common
system provides similar and additional benefits in terms of leverage compared to data with
Common Data Formats. Having the data come from a Common System, we assume the data
format will be the same. In addition, having data come from the same system (either a single or
multiple installations of that system) can leverage transfer mechanisms or protocols established
for that system.
Common Types of Data - Opportunities for Leverage: The phrase "Common Types of Data"
refers to data that is the same "type" of data, but comes from different systems and in different
formats. Extending from the Common Systems discussion above; we comment that signal data
from the Portland signal system and signal data from the Vancouver signal system qualify as
"Common Types of Data" – the data from both systems represents signal operations, but comes
in different formats and requires different network transfer mechanisms. Bluetooth data is
another example of this type of data in the Portland-Vancouver region. Bluetooth data is
provided to the Portal archive in three different formats from three systems. Common Types of
Data do provide opportunities for leverage; however, leveraging such data requires additional
work. Common features of the data that occur across the different data sources must be
identified. Products can then be built on the identified common features. In our experience, this
type of data collection - Common Types of Data – where data is similar, but without a common
format and not from a common system occurs regularly.
It is a goal of the Portland Observatory to address this issue of integrating across "Common
Types of Data." A user producing a performance report does not care what format the data
arrived in or what system the data is from (except, perhaps as those relate to data quality). One

Guiding Data-Driven Transportation Decisions 13
purpose of the "usifications" in the Portland Observatory, described below, is to help abstract
away the incoming data format and system-specific information, so a general user does not need
to worry about those issues and can focus on processing the data itself. As discussed before,
there is a large volume of work in the Computer Science literature on data integration; however,
we believe that work provides a heavyweight solution, when a lightweight solution is more
appropriate.
PROPOSED SYSTEM ARCHITECTURE
We propose an architecture for the Portland Observatory to process and "usify" data. When the
data arrives at the Portland Observatory, we propose to store it in the Portal “raw” form, that is,
in the form that it arrived from the source. Some of the raw data is then “usified”; that is,
cleaned, aggregated, added to or otherwise transformed into a form more directly usable by
observatory clients. For example, data from multiple sensor types and provided by multiple
agencies may be combined to provide traffic speeds and counts across the metropolitan Portland
area. The same raw data may be transformed in different ways for different users, for example
aggregating to different intervals or applying different cleaning methods. Keeping the raw data
allows researchers and analysts to test different methods or models; improvements can be
implemented as new “usifications”.
In the Portland Observatory, developers create Guides that select, combine, aggregate or subset
the data for the users. As discussed, each Guide encapsulates a specification for and produces a
set of data to meet a specific need and a Guide can reuse another Guide as a component, possibly
specifying some different parameters; this reuse provides consistency and allows for faster
development. For example, a Guide for Portland, OR can be reused by Vancouver, WA by
changing the geographic boundaries. If a new cleaning method or model becomes available via a
new usification, a Guide can be altered to use it; all reusing Guides can immediately reap the
benefits, without needed to be altered themselves.
Intel Concurrent Collections (known as CnC) is used to help automate Guide re-use (Burke,
Knobe, et al. 2010). CnC is a programming model that supports a declarative description of an
application (the analysis portion of a Guide in our case). Typically applications are represented

Guiding Data-Driven Transportation Decisions 14
programmatically; that is, an application consists of files of computer code. In contrast, CnC's
application specification is based on the idea of whiteboard drawings. The functionality of an
application may be drawn as a graph on a whiteboard. To use CnC, the drawing of the graph is
translated to a text-based graph specification in the CnC language; then the CnC system executes
the application based solely on the CnC graph specification. To verify what a traditional
application is doing, one must examine the computer code. (The computer code may be
accompanied by a description or specification; but examining the description or specification
does not verify functionality of the code.) In contrast, to verify what a CnC program is doing,
one inspects the graph-based CnC specification. The CnC specification is typically much easier
to read and understand than computer code. This ability to declaratively describe an application
is the key feature of CnC with respect to the Portland Observatory.
Figure 3 Proposed System Architecture Diagram
Figure 3 shows a diagram of the proposed architecture of the system. As discussed above, our
system combines a relational database system (RDBMS) and the CnC parallel programming
environment. The user application is written with CnC and accesses data stored in the relational
database. Combining a parallel programming environment (such as CnC) with a relational
database system is our approach to addressing the variety and varied data sets inherent in big
data, and supports scalability when needed by large datasets. A transportation engineer trying to
produce a report must integrate data from disparate data sources and must clean and process such
data. As data sizes increase, it will be increasingly important for users to think about the
application problem separately from the data layout and parallelization of the problem. Both CnC

Guiding Data-Driven Transportation Decisions 15
and RDBMSs provide conceptual, high-level, declarative interfaces that allow this separation:
the RDBMSs provide declarative access to the data, and CnC enables programmers to
declaratively assemble their application from lower-level functions. Having the process and data
accessed documented in a declarative language allows us to document how data has been
combined - and, equally importantly for privacy and security, what data has not been accessed or
combined in support of a decision. For example, this documentation can assist an agency in
showing that they have acted in accordance with rules and policies governing them.
The technical support required to interface the systems is, in some ways, the easier part of the
work. The more difficult and time-consuming part of these integrations is building the contacts
and relationships with the various agencies, and gaining agreement to share and trust their data
with an external aggregating party. Portland State’s experience in collaborating with these
agencies over the past ten years provides a stable basis for these continuing and expanding
collaborations.
PROTOTYPE IMPLEMENTATION
Using the proposed guide concept and structure and the system architecture described in
previous sections, we implemented a prototype of the three key products identified in the
Example Reports section: the travel time table, the travel speed maps and the volume plots. The
prototype implementation has two parts: Guide Capture and Guide Instantiation. Guide Capture
is a graphical interface that is used to capture features of a guide such as guide name, input data
type, parameters, decisions and comments. The Guide Instantiation is a system that executes the
analysis portion of a Guide and returns the requested results. We note that the Guide Capture and
Guide Instantiation prototypes do not capture the full structure of a Guide as was described
above; our prototype is in its early stages.
Guide Capture
The Guide Capture is a part of the Portland Observatory web interface. Figure 4 shows a
screenshot of the main page of the Portland Observatory web interface. The web interface
supports the display of a variety of data layers including air quality, weather, Bluetooth travel

Guiding Data-Driven Transportation Decisions 16
times, bus stops, bicycle routes, tax lots and school sites. Some data in the observatory is
relatively static such as school sites, bicycle routes and parking meters.
Figure 4 Portland Observatory Web Interface
The Portland Observatory interface supports a set of selectors to allow a user to display selected
data layers for selected dates and times. These selectors appear on the right-hand side of the
Portland Observatory web interface shown in Figure 4. The Guide Capture interface parallels and
leverages these selectors. To create a Guide, the user clicks on the "Create Guide" button in the
lower right-hand portion of the interface. This brings up a "Create Guide " dialog, shown in
Figure 5, that allows the user to specify the guide name and description and make selections
associated with the guide. The selectors in the "Create Guide" dialog (Layers, Year, Start Time)
are similar to those on the right-hand side of the web interface and the selectors in the "Create
Guide" dialog default to the current selections from the web interface. The motivation is for the
user to use the Portland Observatory interface to create a map of the data they want and then use
the "Create Guide" dialog button to capture those selections in a Guide.

Guiding Data-Driven Transportation Decisions 17
Figure 5 Portland Observatory Create Guide Dialog (Part of the Guide Capture Interface)
A relevant feature of the Portland Observatory interface is the ability to add comments to data
layers. Figure 6 shows the Portland Observatory comment interface. A comment can be added to
a data layer at a specified location and time. The comments interface is currently used to record
decisions and comments. Comments recorded for a data layer are associated with Guides created
using for that layer.
Once a Guide is created, it needs to be instantiated with parameters and executed. We describe
this process in the next section.

Guiding Data-Driven Transportation Decisions 18
Figure 6 Portland Observatory Comment Interface
Guide Instantiation
In addition to a Guide Capture interface used to create guides, we have created a Guide
Instantiation system and Guides for the key products identified in the Example Reports section.
The three Guides for the three key products co-exist and operate in one centralized system. These
Guides can communicate with each other, reuse each other, and produce different results
depending on the request.
Guide Instantiation is made available as a service, which is used by the web interface. The
Portland Observatory web interface receives a request from a user to instantiate a Guide and
passes those requests to the Portland Observatory back end. The back end receives requests for
Guide instantiation through the Guide Dispatcher in the form of a guide id and a set of
parameters. For example, a guide for the Metro Portal Annual Report might have the year for
which the report is to be generated as a parameter. The guide id tells the dispatcher what Guide
should be instantiated. We note that guides are hierarchical and thus this request tells the
dispatcher which Guide should be called to process the instantiation request, we call this Guide

Guiding Data-Driven Transportation Decisions 19
the "main Guide." When processing the request, the main Guide (the Guide that first received the
request) can ask other Guides (sub-Guides) to provide sub-answers for the main Guide to
construct or calculate the final result (answer). The sub-Guides themselves could request sub-
answers from other Guides, and so on. In other words, the main request may generate a chain
reaction inside the Portland Observatory across different Guides to make the final answer. The
important thing to notice here is that, although each Guide has its own set of parameters, it is
only the responsibility of the immediate caller to know what those parameters are and how they
should be used; the main caller need only know the parameters for the Guide it calls; the main
caller does not need to know about parameters for the Sub-Guides. Figure 7 shows of the Guide
Instantiation system.
Figure 7 Guide Implementation Architecture Diagram
Going back to the example reports, agencies may ask for data to generate these reports: travel
times, speed, speed as a percentage of the speed limit, volume, and travel time for a specific year.
Although each of those reports is different from an analyst’s perspective, the foundation of all of
these reports is based on the same data using the same analysis methods. Thus, as a basis, the
implementation uses a Guide that receives requests about speed. Giving the requirements
determined by the parameters sent along with the request, the Guide knows what equations to use
and on what data. To generate a report for the speed as a percentage of the speed limit, we only
need two things, speed and speed limit. Since we already have a Guide that calculates speed, the
Guide that generates the speed as a percentage of the speed limit can ask the speed Guide to

Guiding Data-Driven Transportation Decisions 20
answer the speed question then combine the answer with the speed limit to get the final results.
Generating the travel time report follows the same pattern as well since travel time requires
speed and distance. Figure 8 shows the guide hierarchy for these reports.
Figure 8 Guide Hierarchy Diagram
An important thing to notice about Guides is that they don’t provide a complete solution; they
only answer a question. Providing the complete solution is the end-application’s job. In other
words, a Guide can be used by many, completely different applications that provide completely
different solutions.
As a proof of concept, using our web interface, two types of results can be obtained using the
Metro Portland Annual Report volume Guide: an Excel spreadsheet with transportation volume
data for each highway along with their charts comparing volumes for different years and a map
showing volume data for selected highways. Figure 9 shows a diagram of this result output.

Guiding Data-Driven Transportation Decisions 21
Figure 9 Diagram of the Result Output for the Metro Portal Annual Performance Report
CONCLUSION
We have presented a proposed system architecture and prototype implementation designed to
support data-driven decision making, particularly in the transportation domain. The system uses
Guides - an encapsulation of the experience required to answer a question. We selected three
transportation system performance reports and key products to use examples for understanding
and implementing Guides. Guides for these reports capture information such as the data required
for the report, the parameters or selections needed for the report, the decisions made along the
way and more. Based on our proposed system architecture, we implemented a prototype of
Guides – front end Guide Capture using a web interface and back end Guide Instantiation using
CnC and the PostgreSQL relational database. We call our integrated system the Portland
Observatory. The system aims to increase integration across diverse data sources and to increase
the re-usability of the transportation-related data and analysis that lies behind data-driven
performance metrics and decision making and to make better use of valuable human time.

Guiding Data-Driven Transportation Decisions 22
ACKNOWLEDGMENTS
This work was supported in part by the Intel Science and Technology Center for Big Data and a
Maseeh Professorship. The authors acknowledge their collaborators in the transportation
profession in the Portland-Vancouver region including, but certainly not limited to, Steve Callas
(TriMet), Larry Ham (C-TRAN), Bob Hart (RTC), Rob Klug (Clark County), Peter Koonce
(City of Portland), Deena Platman (DKS Associates), Stan Markuson (WSDOT), Dennis
Mitchell (ODOT), Dale Robbins (RTC), Willie Rotich (City of Portland). This work would not
be possible without the atmosphere of collaboration and cooperation that exists among the
transportation professionals in Oregon and Southwest Washington.
REFERENCES
Burke, M., Knobe, K., Newton, R., Sarkar, V. The Concurrent Collections Programming Model.
Technical Report TR 10-12, Department of Computer Science, Rice University,
December 2010).
FHWA. Federal Highway Administration, U.S. Department of Transportation. MAP-21. Moving
Ahead for Progress in the 21st Century. (2012) https://www.fhwa.dot.gov/map21/
Google. General Transit Feed Specification (GTFS) (2014)
https://developers.google.com/transit/gtfs/
Halevy, A., Rajaraman, A., Ordille, J. Data Integration: The Teenage Years. Proceedings of
VLDB 2006, Seoul, Korea, September 2006.
Metro. (2011). Metro 2011 Performance Measures.
Portal. (2013). Portal 2012 Annual Report.
Portal. (2014). Portal data archive. http://portal.its.pdx.edu
Southwest Washington Regional Transportation Council. (2013). Congestion Management
Process 2013 Monitoring Report. http://www.rtc.wa.gov/reports/cmp/CMrpt13.pdf