Guidelines for organizing and analyzing results of Proficiency tests
12
Effective as of: 13.05.2013 Version 1.0 Page 1 of 12 TCOM-TG-02-Organizing and Analyzing PTs and CTs Status: FINAL Print Date: 16.02.2018 INTERNATIONAL SEED TESTING ASSOCIATION (ISTA) Secretariat, Zürichstrasse 50, 8303 Bassersdorf, CH-Switzerland Phone: +41-44-838 60 00, Fax: +41-44-838 60 01, Email: [email protected] , http://www.seedtest.org Technical Guideline Guidelines for organizing and analyzing results of Proficiency tests (PT) and interlaboratory tests for validation of methods (CT) Note: Any copies of this document are not subject to change service Note: This document has been partly replaced by the document “TCOM-TG-06-Organizing and Analyzing PTs”. Information given for CT remain usefull and will be updated in the future. Created by Reviewed by Approved by Date: 2012 21.01.2013 May 2013 Name: Seed Health Committee (SHC) Executive Committee (ECOM) ECOM Signature: Valid from: 13.05.2013
Transcript of Guidelines for organizing and analyzing results of Proficiency tests

Effective as of: 13.05.2013 Version 1.0 Page 1 of 12
TCOM-TG-02-Organizing and Analyzing PTs and CTs Status: FINAL Print Date: 16.02.2018
INTERNATIONAL SEED TESTING ASSOCIATION (ISTA)
Secretariat, Zürichstrasse 50, 8303 Bassersdorf, CH-Switzerland
Phone: +41-44-838 60 00, Fax: +41-44-838 60 01, Email: [email protected], http://www.seedtest.org
Technical Guideline
Guidelines for organizing and analyzing
results of Proficiency tests (PT) and interlaboratory tests for validation of
methods (CT)
Note: Any copies of this document are not subject to change service
Note: This document has been partly replaced by the document “TCOM-TG-06-Organizing and Analyzing PTs”. Information given for CT remain usefull and will be updated in the future.
Created by Reviewed by Approved by
Date: 2012 21.01.2013 May 2013
Name: Seed Health
Committee (SHC)
Executive Committee
(ECOM) ECOM
Signature:
Valid from: 13.05.2013

Effective as of: 13.05.2013 Version 1.0 Page 2 of 12
TCOM-TG-02-Organizing and Analyzing PTs and CTs Status: FINAL Print Date: 16.02.2018
SCOPE
ISTA Seed Health Committee organizes proficiency tests (PT) to monitor the ability of accredited laboratories to detect seed pathogens using the Annexe to Chapter 7 Seed Health Testing methods. It has been difficult for organizers to decide which statistical methods to use for analysing results and to rank laboratories. Several different methods have been used. Organizers of comparative tests (CT) which are used to validate seed health methods before new methods are added to the Annexe have also had questions on how to analyse results. Different types of results are expected based on the class of pathogen or the method used to detect the pathogen.
For detection of fungi, each seed is tested individually on media or blotters and results are generally expressed as the number of infected seeds per the number of seeds tested or as a percentage infection. These are quantitative results.
For detection of bacteria or viruses, seeds are tested using pools containing X number of seeds per subsample. Results are expressed as the number of infected subsamples(or positive subsamples) detected within a total number of subsamples tested. These are qualitative results.
Therefore, ISTA SHC decided to work with ISTA StatCommittee to define some guidelines to help PT and CT organizers to set up and analyze these tests.
The following text establishes the preliminary guidelines for statistical analysis. This is a beginning as many items will need further work and updated versions of the guidelines will be proposed in the future.
RESPONSIBILITY AND ABBREVIATIONS
The Seed Health Committee is responsible for organising Proficiency Tests and inter-laboratory tests for validation of methods and the evaluation of their results.
PT – Proficiency Test
CT – Inter-laboratory (comparative) tests for validation of methods
StatCommittee – Statistic Committee
SHC – Seed Health Committee
PROCESS DESCRIPTION
Seed lots:
Seed lots used for PT and CT can be either naturally contaminated or artificially contaminated. Artificial contamination can be achieved:
For viruses by mixing seeds with ground contaminated tissues
For bacteria by using a vacuum to infiltrate a bacterial suspension into individual seeds, (with or without damaging the teguments)…

Effective as of: 13.05.2013 Version 1.0 Page 3 of 12
TCOM-TG-02-Organizing and Analyzing PTs and CTs Status: FINAL Print Date: 16.02.2018
For fungi, by immersing seeds in a spore suspension or plating seeds on a fungus colony under hydric restriction (use of Manitol to decrease water availability)
A pretest will be necessary to determine the level of contamination, i.e., the expected results of subsamples..
Samples/subsamples: subsamples will be prepared by the organizers and sent to each participant to avoid variation in subsampling in laboratories and to be certain of what is sent. No subsampling should be done in the participating laboratories.
Levels of infection
Healthy, no infection (with saprophytes if possible)
Low and/or medium infection level (1 low / 1 medium or 2 low / 0 medium or 0 low / 2 medium). The organizer needs to be certain, based on pretests, that all low level subsamples are contaminated (at least one infected seed in subsample analysed) and that contamination is over the detection limit of the method. For example, a minimum of 5% contamination for fungi is required to be sure that all subsamples distributed will contain one contaminated seed.
High infection level (not a requirement for PT because this level will not be informative on laboratory efficiency: all laboratories generally detect all high levels)
Number of subsamples per infection level:
Same number of subsamples per infection level for fungi (i.e. 3 for healthy, 3 for low, 3 for high)
Number depending on contamination level when tested by pools (bacteria and viruses) with more focus on healthy and low/medium levels, i.e: more subsamples need to be tested at levels where there is more chance to have a false negative result
A minimum of 3 subsamples per infection level for CT, a minimum of 1 subsample per level for PT
1 result will be reported per subsample
Size of subsample:
When the size of sample is not indicated in the method (Chapter 7 of ISTA rules) / or the method undergoing validation: define the size of subsample which will depend on the detection limit of the method. For validation studies, the size of subsample will be linked to the size of subsample recommended in the future method
When a maximum subsample size is indicated in the method this subsample size should be used.
Effective as of: 13.05.2013 Version 1.0 Page 4 of 12
TCOM-TG-02-Organizing and Analyzing PTs and CTs Status: FINAL Print Date: 16.02.2018
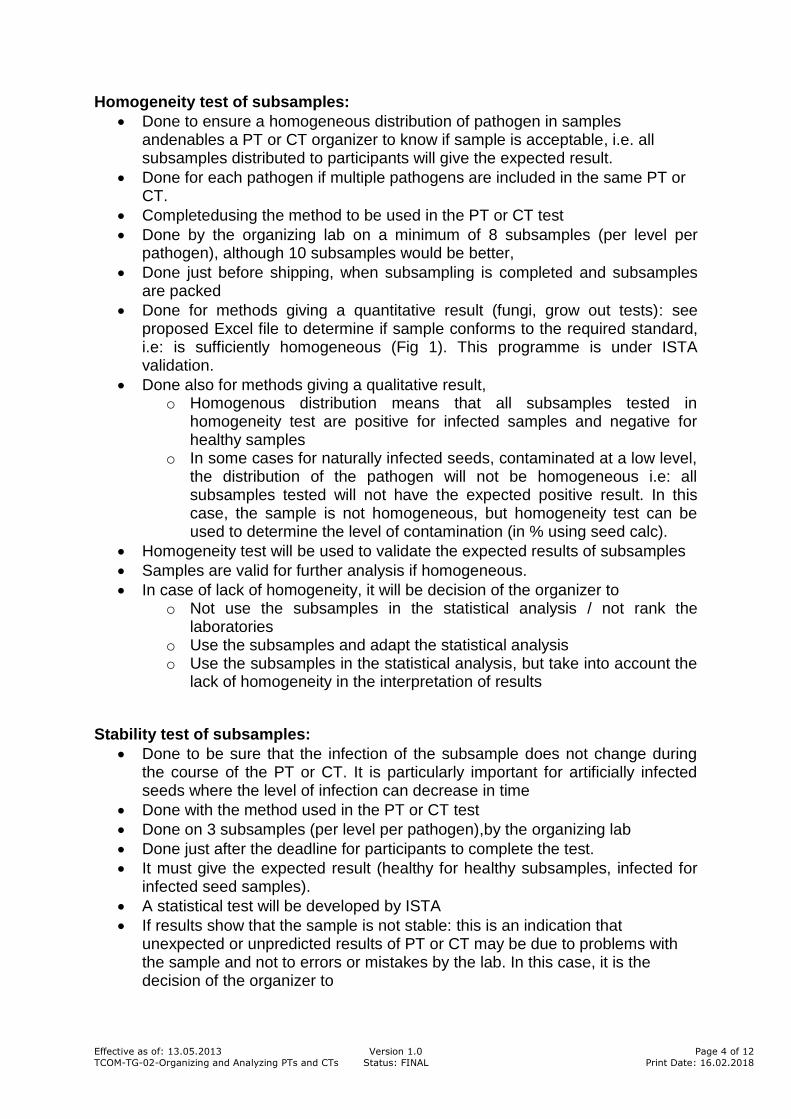
Homogeneity test of subsamples:
Done to ensure a homogeneous distribution of pathogen in samples andenables a PT or CT organizer to know if sample is acceptable, i.e. all subsamples distributed to participants will give the expected result.
Done for each pathogen if multiple pathogens are included in the same PT or CT.
Completedusing the method to be used in the PT or CT test
Done by the organizing lab on a minimum of 8 subsamples (per level per pathogen), although 10 subsamples would be better,
Done just before shipping, when subsampling is completed and subsamples are packed
Done for methods giving a quantitative result (fungi, grow out tests): see proposed Excel file to determine if sample conforms to the required standard, i.e: is sufficiently homogeneous (Fig 1). This programme is under ISTA validation.
Done also for methods giving a qualitative result, o Homogenous distribution means that all subsamples tested in
homogeneity test are positive for infected samples and negative for healthy samples
o In some cases for naturally infected seeds, contaminated at a low level, the distribution of the pathogen will not be homogeneous i.e: all subsamples tested will not have the expected positive result. In this case, the sample is not homogeneous, but homogeneity test can be used to determine the level of contamination (in % using seed calc).
Homogeneity test will be used to validate the expected results of subsamples
Samples are valid for further analysis if homogeneous.
In case of lack of homogeneity, it will be decision of the organizer to o Not use the subsamples in the statistical analysis / not rank the
laboratories o Use the subsamples and adapt the statistical analysis o Use the subsamples in the statistical analysis, but take into account the
lack of homogeneity in the interpretation of results
Stability test of subsamples:
Done to be sure that the infection of the subsample does not change during the course of the PT or CT. It is particularly important for artificially infected seeds where the level of infection can decrease in time
Done with the method used in the PT or CT test
Done on 3 subsamples (per level per pathogen),by the organizing lab
Done just after the deadline for participants to complete the test.
It must give the expected result (healthy for healthy subsamples, infected for infected seed samples).
A statistical test will be developed by ISTA
If results show that the sample is not stable: this is an indication that unexpected or unpredicted results of PT or CT may be due to problems with the sample and not to errors or mistakes by the lab. In this case, it is the decision of the organizer to
Effective as of: 13.05.2013 Version 1.0 Page 5 of 12
TCOM-TG-02-Organizing and Analyzing PTs and CTs Status: FINAL Print Date: 16.02.2018
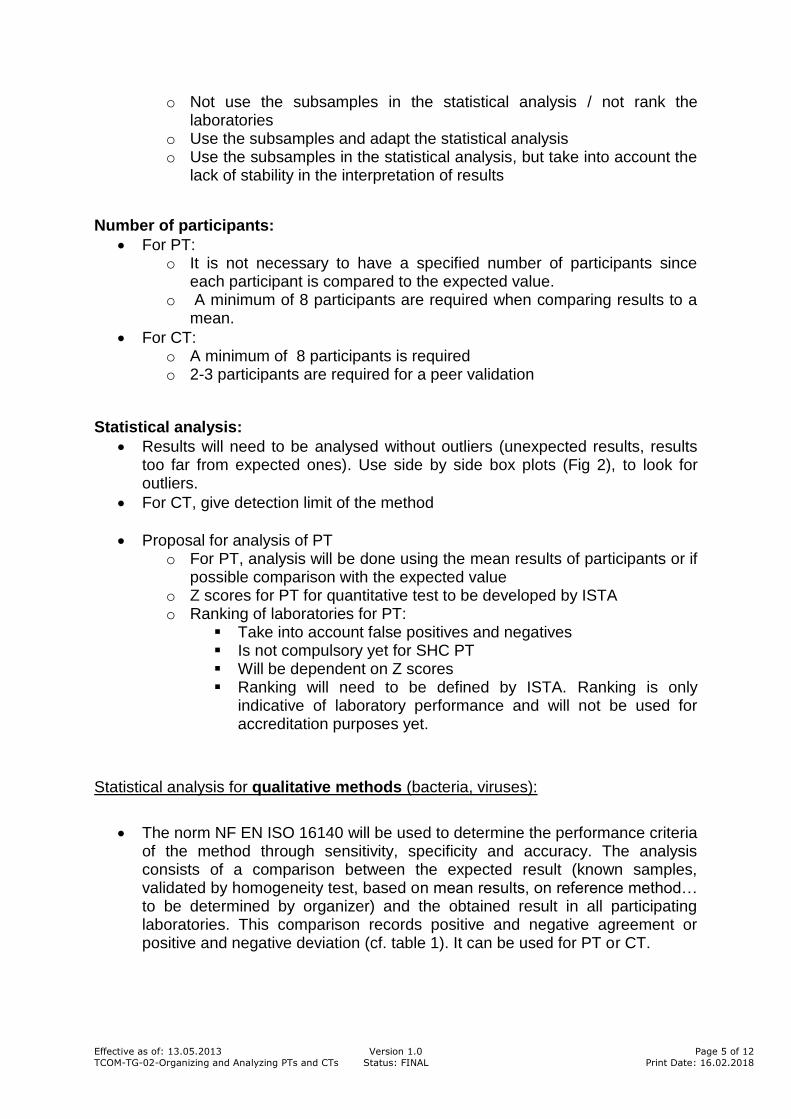
o Not use the subsamples in the statistical analysis / not rank the laboratories
o Use the subsamples and adapt the statistical analysis o Use the subsamples in the statistical analysis, but take into account the
lack of stability in the interpretation of results
Number of participants:
For PT: o It is not necessary to have a specified number of participants since
each participant is compared to the expected value. o A minimum of 8 participants are required when comparing results to a
mean.
For CT: o A minimum of 8 participants is required o 2-3 participants are required for a peer validation
Statistical analysis:
Results will need to be analysed without outliers (unexpected results, results too far from expected ones). Use side by side box plots (Fig 2), to look for outliers.
For CT, give detection limit of the method
Proposal for analysis of PT o For PT, analysis will be done using the mean results of participants or if
possible comparison with the expected value o Z scores for PT for quantitative test to be developed by ISTA o Ranking of laboratories for PT:
Take into account false positives and negatives Is not compulsory yet for SHC PT Will be dependent on Z scores Ranking will need to be defined by ISTA. Ranking is only
indicative of laboratory performance and will not be used for accreditation purposes yet.
Statistical analysis for qualitative methods (bacteria, viruses):
The norm NF EN ISO 16140 will be used to determine the performance criteria of the method through sensitivity, specificity and accuracy. The analysis consists of a comparison between the expected result (known samples, validated by homogeneity test, based on mean results, on reference method… to be determined by organizer) and the obtained result in all participating laboratories. This comparison records positive and negative agreement or positive and negative deviation (cf. table 1). It can be used for PT or CT.

Effective as of: 13.05.2013 Version 1.0 Page 6 of 12
TCOM-TG-02-Organizing and Analyzing PTs and CTs Status: FINAL Print Date: 16.02.2018
Table 1:
expected result + (target) expected result - (non target)
Obtained result + positive agreement +/+ (PA) positive deviation -/+ (PD)
Obtained result - negative deviation +/- (ND) negative agreement -/- (NA)
This definition allows the calculation of sensitivity, specificity, accuracy and reproducibility according to the following mathematical formulas:
Sensitivity = ΣPA/(ΣPA+ΣND)x100
Specificity = ΣNA/(ΣNA+ΣPD)× 100
Accuracy = (ΣNA+ΣPA)/(ΣPA+ΣNA+ΣPD+ΣND)x100
PA = positive agreement
ND = negative deviation
NA = negative agreement
PD = positive deviation
A sensitivity of 100% shows that the method / laboratory always detects the target pathogen: there were no false negatives.
A specificity of 100% shows that the method / laboratory does not give a positive result for a sample that does not contain the target pathogen: there were no false positives.
An accuracy of 100% shows that the target pathogen is always detected.
o At this time, it is difficult to define a % of sensitivity/specificity which is
acceptable therefore the analysis will be done case by case on submitted reports. In all cases, values should be higher than 80%
o Results will depend on number of data analysed: if few data are analysed we can be less confident of values
Repeatability and reproducibility: Following the terminology used in the publication of Langton et al., 2002.
o Repeatability and reproducibility are calculated on similar samples, so should be calculated for each level of infection or for target versus non-target organisms
o Repeatability is called accordance. For each lab it is expressed as the probability that 2 samples give the same result, then the probability is averaged over all laboratories: count for each lab the numbers of pairs

Effective as of: 13.05.2013 Version 1.0 Page 7 of 12
TCOM-TG-02-Organizing and Analyzing PTs and CTs Status: FINAL Print Date: 16.02.2018
both + or – (i.e. number of accords) and number of possible pairs (total number of possible accords)
The number of pairing/accords between n items is : n (n-1) / 2 Accordance=number of accords/number of possible accords in
one laboratory See example Table 2
o Reproducibility is called concordance. Count between laboratories the numbers of pairs both + or – (i.e. number of accords) and number of possible pairs (total number of possible accords)
The number of pairing / accords between n items is : n (n-1) / 2 Concordance=number of accords/number of possible accords
between laboratories See example Table 3
o A decision tree will be defined by ISTA as to what is an “acceptable” accordance or concordance
Analysis depending on % of infection: qualitative results: o Useful for low contaminated samples where the number of positive
subsamples which will be distributed is not precise, because distribution is not homogeneous. It can be used for PT and CT
o In this case, homogeneity test will be used to give precision on determination of the expected value i.e. the % of infection of the sample. This % will be determined with seed calc. Statistical analysis will be done on a probability to have from X to Y samples positives / total analyzed (see example of Excel tool developed figure 3)
For qualitative results (subsample identified as positive or negative for viruses or bacteria), the counting of colonies or number of lesions will be indicative (for a level of contamination for example). It is not expected to do statistical analysis on this aspect.
Statistical analysis for quantitative methods (fungi: % contamination, number of contaminated seeds):
For PT and CT:
Analysis of results: comparison between labs or methods o ANOVA on transformed / not transformed data will be an interim
solution. A normal distribution is not compulsory,but it is important to have stable variance
o GLMM (general linear modified model) targeted is better, ISTA will develop a statistical programme
Repeatability and reproducibility: o ISTA ISO 5725 tool will be an interim solution. o GLMM targeted is better, ISTA will develop a statistical program

Effective as of: 13.05.2013 Version 1.0 Page 8 of 12
TCOM-TG-02-Organizing and Analyzing PTs and CTs Status: FINAL Print Date: 16.02.2018
Report:
For validation studies: see ISTA method validation programme
For PT: synthetic results: overall mean and Z scores (if defined), results for each participant. Report available on request
ANNEX
Annex 1: Fig 1: calculation of conformity for homogeneity test
ANNEX 2: Fig 2: Example of side by side box plot (from ISTA PT on rice 2011)
ANNEX 3: Table 2. Example of calculation of repeatability (CT for validation of Xap primers)
ANNEX 4: Table 3. Example of calculation of reproducibility (CT for validation of Xap pathogenicity test)
ANNEX 5: Figure 3. Example of CT for Tobamovirus method validation
DISTRIBUTION LIST
Seed Health Committee
Statistical Committee
Accreditation and Technical Department

Effective as of: 13.05.2013 Version 1.0 Page 9 of 12
TCOM-TG-02-Organizing and Analyzing PTs and CTs Status: FINAL Print Date: 16.02.2018
ANNEX 1: FIG 1: CALCULATION OF CONFORMITY FOR HOMOGENEITY TEST
ANNEX 2: FIG 2: EXAMPLE OF SIDE BY SIDE BOX PLOT (FROM ISTA PT ON RICE 2011)
Homogeneity test - seed health
Sample size 400
Subsample 1 2 3 4 5 6 7 8 9 10
nb infected seeds 2 5 1 3 6 5 1 8 3 4 Meanpercentage of non infected seeds 99.5 98.75 99.75 99.25 98.5 98.75 99.75 98 99.25 99 99.05
99.05
1.41
0.35
OK
Sample Mean
Tolerance
H value
Homogeneity check
Figure 2 Participants average results of Drechslera oryzae
Lot 3 Lot 5 Lot 6
0
10
20
30
40
50
Lab 8
Lab 1
0
10
20
30
40
50

Effective as of: 13.05.2013 Version 1.0 Page 10 of 12
TCOM-TG-02-Organizing and Analyzing PTs and CTs Status: FINAL Print Date: 16.02.2018
ANNEX 3: TABLE 2. EXAMPLE OF CALCULATION OF REPEATABILITY (CT FOR VALIDATION OF XAP
PRIMERS)
AUDY
sample test 1 test 2 test 3 test 4 test 5 test 6 nb + nb -
nb positive
accords
nb negative
accords
nb possible
accords repeatability
35 non target - - - - - - 0 6 0 15 15 100
33 non target - - - - - - 0 6 0 15 15 100
31 non target + + + + + + 6 0 15 0 15 100
34 non target - - - - - - 0 6 0 15 15 100
32 non target - - - - - - 0 6 0 15 15 100
Mean: 100

Effective as of: 13.05.2013 Version 1.0 Page 11 of 12
TCOM-TG-02-Organizing and Analyzing PTs and CTs Status: FINAL Print Date: 16.02.2018
ANNEX 4: TABLE 3. EXAMPLE OF CALCULATION OF REPRODUCIBILITY (CT FOR VALIDATION OF XAP
PATHOGENICITY TEST)
Sample: SNES LSV INRA nb + nb-
nb positive
accord
nb negative
accords
nb possible
accords
reproducibili
ty
1 target + - + 2 1 1 0 3 0.333333333
2 target + + + 3 0 3 0 3 1
3 target + + + 3 0 3 0 3 1
4 target + + + 3 0 3 0 3 1
5 target + + + 3 0 3 0 3 1
6 target + + + 3 0 3 0 3 1
7 target + + + 3 0 3 0 3 1
8 target + + + 3 0 3 0 3 1
10 target + + + 3 0 3 0 3 1
11 target + + + 3 0 3 0 3 1
12 target + + + 3 0 3 0 3 1
13 target + + + 3 0 3 0 3 1
14 target + + + 3 0 3 0 3 1
15 target + + + 3 0 3 0 3 1
16 target + + + 3 0 3 0 3 1
17 target + + + 3 0 3 0 3 1
18 target + + + 3 0 3 0 3 1
19 target + + + 3 0 3 0 3 1
20 target + + + 3 0 3 0 3 1
21 target + + + 3 0 3 0 3 1
22 target + + + 3 0 3 0 3 1
23 target + + + 3 0 3 0 3 1
25 target + - + 2 1 1 0 3 0.333333333
26 target + + + 3 0 3 0 3 1
27 target + + + 3 0 3 0 3 1
28 target + + + 3 0 3 0 3 1
29 target + + + 3 0 3 0 3 1
30 target + + + 3 0 3 0 3 1
80 0 84 95.24
Pathogenicity test on bean by dipping (+/-)
total reproducibility in %
Effective as of: 13.05.2013 Version 1.0 Page 12 of 12
TCOM-TG-02-Organizing and Analyzing PTs and CTs Status: FINAL Print Date: 16.02.2018
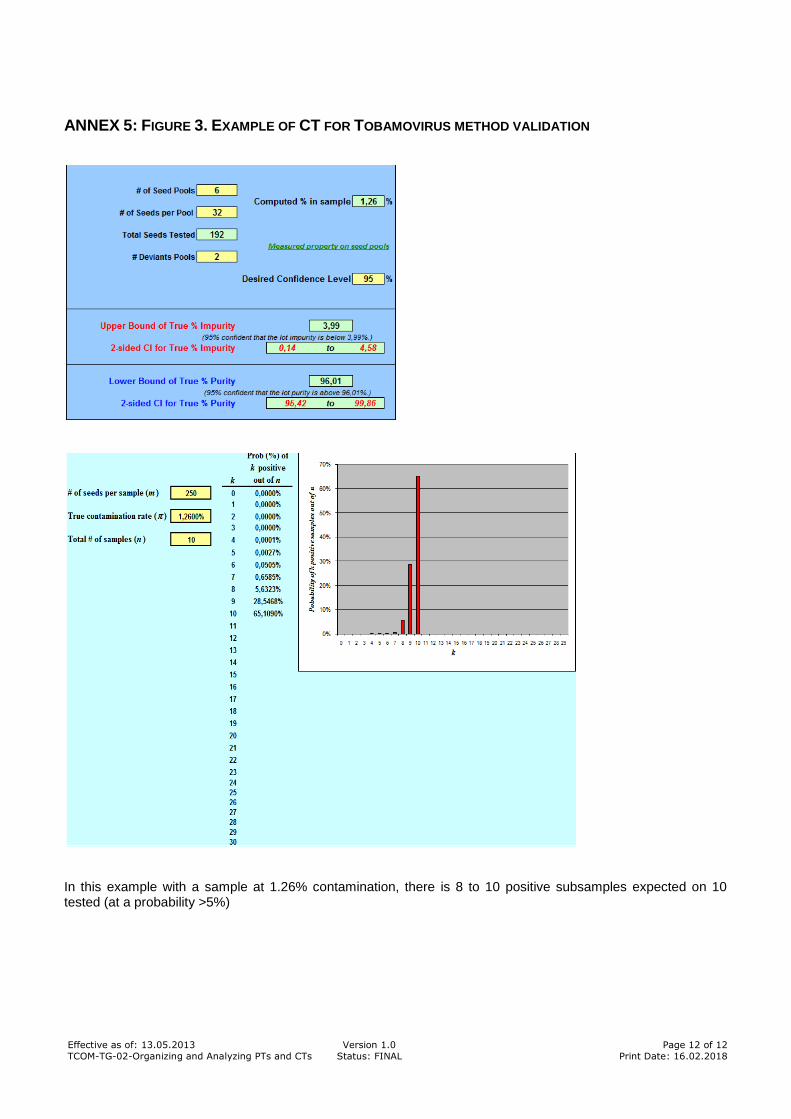
ANNEX 5: FIGURE 3. EXAMPLE OF CT FOR TOBAMOVIRUS METHOD VALIDATION
In this example with a sample at 1.26% contamination, there is 8 to 10 positive subsamples expected on 10 tested (at a probability >5%)