Guidelines for Health, Female Fertility and Udder Health ... · Reproduction trait considerations....
74
Transcript of Guidelines for Health, Female Fertility and Udder Health ... · Reproduction trait considerations....


Table 1. Overview of the possible sources of direct and indirect health information. ............. 10
Table 2. Udder health trait considerations. ..............................................................................15
Table 3. Reproduction trait considerations. ............................................................................ 16
Table 4. Considerations for locomotion traits. ........................................................................ 18
Table 5. Considerations for metabolic traits. ........................................................................... 19
Table 6. Considerations for other disease traits. ..................................................................... 20
Table 7. Considerations for calf health traits. .......................................................................... 21
Table 8. Lactation incidence rates (LIR), i.e. proportions of cows with at least
one diagnosis of the respective disease within the specified time period. ....................... 26
Table 9. Various traits used or possible to use and their potential relation to
various aspects of cow fertility. ......................................................................................... 43
Table 10. Breeding goal trait for which predicted breeding values should
be available on potential selection candidates.................................................................. 50
Table 11. Recording udder health. .............................................................................................51
Table 12. Top ten bulls ranked for udder health (May 2002). ................................................. 52
Table 13. The influence of age on udder conformation in Holstein
Friesian and Jersey (Source: Oldenbroek et al., 1993). .................................................... 65
Table 14. Interbull recommended identification. .................................................................... 66
Table 15. Example of linear scoring report. ............................................................................. 70
Table 16. Milkability-form example. ......................................................................................... 71
Table 17. Example of form for farmers recording mastitis incidents. ...................................... 71
Table 18. Examples of clinical mastitis specifications. ............................................................ 72
Equation 1. For computation of lactation incidence rate for clinical mastitis. ........................ 23
Equation 2. For computation of lactation incidence rate for clinical
mastitis taking account of day as risk. .............................................................................. 23
Equation 3. For computation of prevalence of clinical mastitis. ............................................. 23

Figure 1. A flow chart describing the possible steps in developing a recording program for
female fertility. .................................................................................................................. 39
Figure 2. Infection process. ...................................................................................................... 55
Figure 3. Daily somatic cell count with a clinical mastitis event at
day 28 (Source: Schepers, 1996). ...................................................................................... 57
Figure 4. The upper 95% confidence limit for somatic cell counts in
uninfected cows, in three different parities, in dependance on
days in milk (Source: schepers et al., 1997). ..................................................................... 61
Figure 5. Frequency distribution of clinical mastitis incidents according to
lactation stage (Source: Schepers, 1986). ......................................................................... 61
Figure 6. Percentage of cows of different SCC-classes (x 1.000; year 2.000 calvings,
Australia) per lactation (Source: Hiemstra, 2001). .......................................................... 62
Figure 7. A generalised representation of the milk low
curve (Source: Dodenhoff et al., 2000). ........................................................................... 63
Figure 8. Good recording practices udder health index. ......................................................... 66
Figure 9. Somatic cell count recording practice. ...................................................................... 68
Date of
Change
Nature of Change
August 17 Reformated using new template.
August 17 Table of contents added.
August 17 Heading numbers and heading text edited for clarity and removal of
redundant text.
August 17 Insert links to ICAR website for Claw Health Atlas and Disease Codes.
August 17 Insert table and equation captions. Insert Table and Equation index into Table
of Contents.
August 17 Fixed bulleted lists; fixed et al as italics and minor changes.
August 17 Stopped Track changes and accept all previous changes otherwise there was
no valid pagination.
August 17 Added two Sections female fertility in dairy cattle and udder health (Section
7.2 and 7.3). Add index of figures to Table of Contents. V17.05.
August 17 Added figure and header on page 64.
August 17 Accepted all changes. V17.06.
August 17 Stopped Track change sand accepted all previous changes.

August 17 Moved the file to the new template (v2017_08_29).
August 17 Correct heading error on page 72 and some other minor edits.
Oct. 2017 Hyperlinks have been corrected
Apr. 2018 Minor corrections proposed by Dorota Krencik
Apr. 2018 The “Table of content” for the Figures has been updated as indicated by
Dorota Krencik
Improved health of dairy cattle is of increasing economic importance. Poor health results in greater
production costs through higher veterinary bills, additional labor costs, and reduced productivity.
Animal welfare is also of increasing interest to both consumers and regulatory agencies because
healthy animals are needed to provide high-quality food for human consumption. Furthermore, this is
consistent with the European Union animal health strategy that emphasizes disease prevention over
treatment. Animal health issues may be addressed either directly, by measuring and selecting against
liability to disease, or indirectly by selecting against traits correlated with injury and illness. Direct
observations of health and disease events, and their inclusion in recording, evaluation and selection
schemes, will maximize the efficiency of genetic selection programs. The Scandinavian countries have
been routinely collecting and utilizing those data for years, demonstrating the feasibility of such
programs. Experience with direct health data in non-Scandinavian countries still is limited. Due to the
complexity of health and diseases, programs may differ between countries. This document presents
best-practices with respect to data collection practices, trait definition, and use of health data in
genetic evaluation programs and can be extended to its use for other farm management purposes.
The improvement of cattle health is of increasing economic importance for several reasons. Impaired
health results in increased production costs (veterinary medical care and therapy, additional labor,
and reduced performance), while prices for dairy products and meat are decreasing. Consumers also
want to see improvements in food safety and better animal welfare. Improvement in the general health
of the cattle population is necessary for the production of high-quality food and implies significant
progress with regard to animal welfare. Improved welfare also is consistent with the EU animal health
strategy, which states that that prevention is better than treatment (European Commission, 2007).
Health issues may be addressed either directly or indirectly. Indirect measures of health and disease
have been included in routine performance tests by many countries. However, directly observed
measures of health and disease need to be included in recording, evaluation and selection schemes in
order to increase the efficiency of genetic improvement programs for animal health.
In the Scandinavian countries, direct health data have been routinely collected and utilized for years,
with recording based on veterinary medical diagnoses (Nielsen, 2000; Philipsson and Linde, 2003;
Østerås and Sølverød, 2005; Aamand, 2006; Heringstad et al., 2007). In the non-Scandinavian
countries experience with direct health data is still limited, but interest in using recorded diagnoses or
observations of disease has increased considerably in recent years (Zwald et al., 2006a,b;
Neuenschwander et al., 2008; Neuenschwender, 2010; Appuhamy et al., 2009; Egger-Danner et al.,
2010, Egger-Danner et al., 2012, Koeck et al., 2012a,b, Neuschwander et al., 2012).
Due to the complex biology of health and disease, guidelines should mainly address general aspects of
working with direct health data. Specific issues for the major disease complexes are discussed, but
breed- or population-specific focuses may require amendments to these guidelines.
The collection of direct information on health and disease status of individual animals is preferable to
collection of indirect information. However, population-wide collection of reliable health information

may be easier to implement for indirect rather than direct measures of health. Analyses of health traits
will probably benefit from combined use of direct and indirect health data, but clear distinctions must
be drawn between these two types of data:
a. Diagnoses or observations of diseases
b. Clinical signs or findings indicative of diseases
a. Objectively measurable indicator traits (e.g., somatic cell count, milk urea nitrogen)
b. Subjectively assessable indicator traits (e.g., body condition score, score for limb
conformation)
Health data may originate from different data sources which differ considerably with respect to
information content and specificity. Therefore, the data source must be clearly indicated whenever
information on health and disease status is collected and analyzed. When data from different sources
are combined, the origin of data must be taken into account when defining health traits.
In the following sections, possible sources of health data are discussed, together with information on
which types of data may be provided, specific advantages and disadvantages associated with those
sources, and issues which need to be addressed when using those sources.
Content
a. Primarily report direct health data.
b. Provide disease diagnoses (documented reasons for application of pharmaceuticals), possibly
supplemented by findings indicative of disease, and/or information on indicator traits.
Advantage
a. Information on a broad spectrum of health traits.
b. Specific veterinary medical diagnoses (high-quality data).
c. Legal obligations of documentation in some countries (possible utilization of already
established recording practices).
Disadvantages
a. Only severe cases of disease may be reported (need for veterinary intervention and
pharmaceutical therapy).
b. Possible delay in reporting (gap between onset of disease and veterinary visit).
c. Extra time and effort for recording (complete and consistent documentation cannot be taken
for granted, recording routine and data flow need to be established).
Content
a. Primarily direct health data.
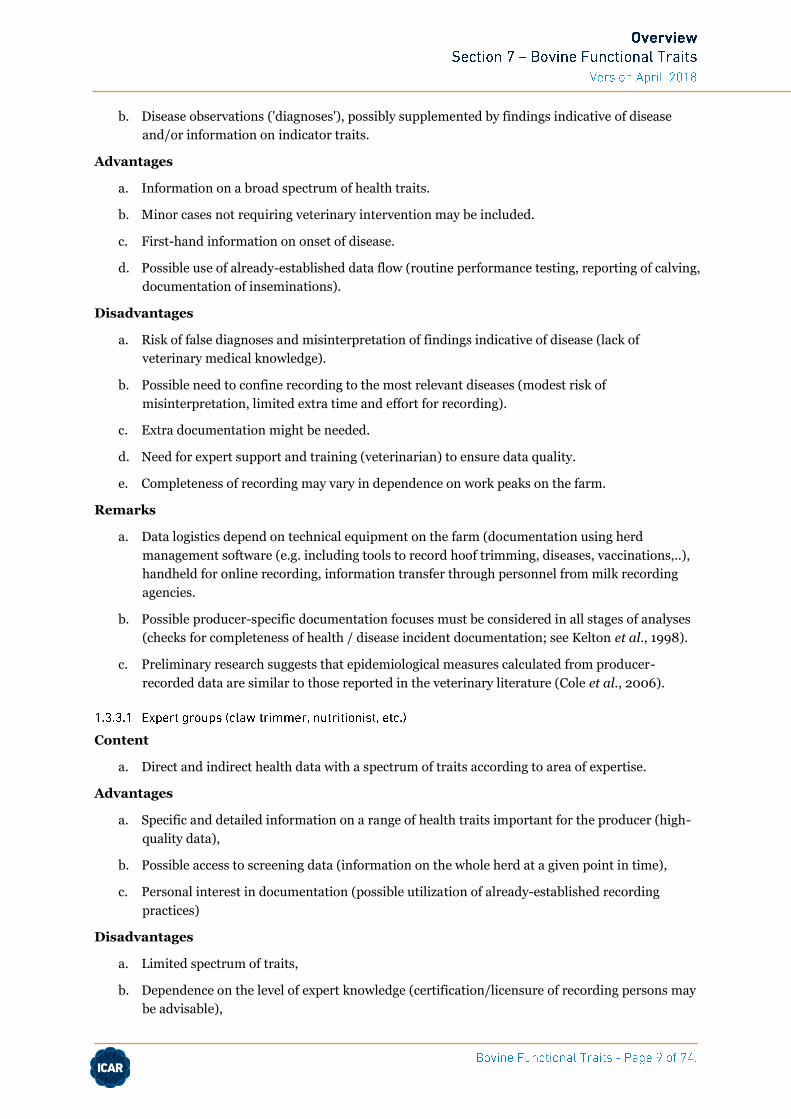
b. Disease observations ('diagnoses'), possibly supplemented by findings indicative of disease
and/or information on indicator traits.
Advantages
a. Information on a broad spectrum of health traits.
b. Minor cases not requiring veterinary intervention may be included.
c. First-hand information on onset of disease.
d. Possible use of already-established data flow (routine performance testing, reporting of calving,
documentation of inseminations).
Disadvantages
a. Risk of false diagnoses and misinterpretation of findings indicative of disease (lack of
veterinary medical knowledge).
b. Possible need to confine recording to the most relevant diseases (modest risk of
misinterpretation, limited extra time and effort for recording).
c. Extra documentation might be needed.
d. Need for expert support and training (veterinarian) to ensure data quality.
e. Completeness of recording may vary in dependence on work peaks on the farm.
Remarks
a. Data logistics depend on technical equipment on the farm (documentation using herd
management software (e.g. including tools to record hoof trimming, diseases, vaccinations,..),
handheld for online recording, information transfer through personnel from milk recording
agencies.
b. Possible producer-specific documentation focuses must be considered in all stages of analyses
(checks for completeness of health / disease incident documentation; see Kelton et al., 1998).
c. Preliminary research suggests that epidemiological measures calculated from producer-
recorded data are similar to those reported in the veterinary literature (Cole et al., 2006).
Content
a. Direct and indirect health data with a spectrum of traits according to area of expertise.
Advantages
a. Specific and detailed information on a range of health traits important for the producer (high-
quality data),
b. Possible access to screening data (information on the whole herd at a given point in time),
c. Personal interest in documentation (possible utilization of already-established recording
practices)
Disadvantages
a. Limited spectrum of traits,
b. Dependence on the level of expert knowledge (certification/licensure of recording persons may
be advisable),
c. Extra time and effort for recording (complete and consistent documentation cannot be taken
for granted, recording routine and data flow need to be established)
d. Business interests may interfere with objective documentation
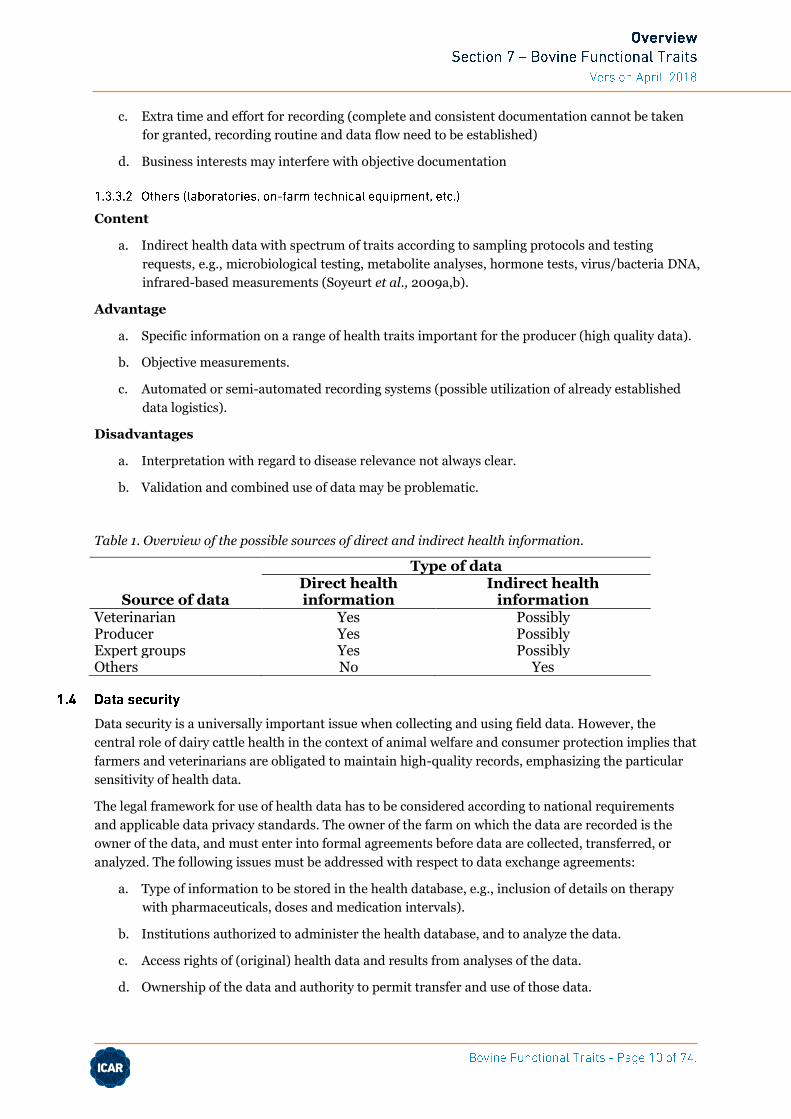
Content
a. Indirect health data with spectrum of traits according to sampling protocols and testing
requests, e.g., microbiological testing, metabolite analyses, hormone tests, virus/bacteria DNA,
infrared-based measurements (Soyeurt et al., 2009a,b).
Advantage
a. Specific information on a range of health traits important for the producer (high quality data).
b. Objective measurements.
c. Automated or semi-automated recording systems (possible utilization of already established
data logistics).
Disadvantages
a. Interpretation with regard to disease relevance not always clear.
b. Validation and combined use of data may be problematic.
Table 1. Overview of the possible sources of direct and indirect health information.
Source of data
Type of data Direct health information
Indirect health information
Veterinarian Yes Possibly Producer Yes Possibly Expert groups Yes Possibly Others No Yes
Data security is a universally important issue when collecting and using field data. However, the
central role of dairy cattle health in the context of animal welfare and consumer protection implies that
farmers and veterinarians are obligated to maintain high-quality records, emphasizing the particular
sensitivity of health data.
The legal framework for use of health data has to be considered according to national requirements
and applicable data privacy standards. The owner of the farm on which the data are recorded is the
owner of the data, and must enter into formal agreements before data are collected, transferred, or
analyzed. The following issues must be addressed with respect to data exchange agreements:
a. Type of information to be stored in the health database, e.g., inclusion of details on therapy
with pharmaceuticals, doses and medication intervals).
b. Institutions authorized to administer the health database, and to analyze the data.
c. Access rights of (original) health data and results from analyses of the data.
d. Ownership of the data and authority to permit transfer and use of those data.

Enrollment forms for recording and use of health data (to be signed by the farmers) have been
compiled by the institutions responsible for data storage and analysis or governmental authorities (e.g.,
Austrian Ministry of Health, 2010).
For any health database it must be guaranteed that:
a. The individual farmers can only access detailed information on their own farm, and for
animals only pertaining to their presence on that farm.
b. The right to edit health data are limited.
c. Access to any treatment information is confined to the farmer and the veterinarian responsible
for the specific treatment, with the option of anonymizing the veterinary data.
Data security is a necessary precondition for farmers to develop enough trust in the system to provide
data. The recording of treatment data is much more sensitive than only diagnoses, and the need to
collect and store such data should be very carefully considered.
Minimum requirements for documentation:
d. Unique animal ID (ISO number).
e. Place of recording (unique ID of farm/herd).
f. Source of data (veterinarian, producer, expert group, others).
g. Date of health incident.
h. Type of health incident (standardized code for recording).
Useful additional documentation:
a. Individual identification of the recording person.
b. Details on respective health incident (exact location, severity).
c. Type of recording and method of data transfer (software used for on-farm recording, online-
transmission).
d. Information on type of diagnosis (first or subsequent).
The systematic use and appropriate interpretation of direct and indirect health data requires that
information on health status be combined with other information on the affected animals (basic
information such as date of birth, sex, breed, sire and dam, farm/herd; calving dates, and performance
records). Therefore, unique identification of the individual animals used for the health data base must
be consistent with the animal ID used in existing databases.
Widespread collection of health data may benefit from legal frameworks for documentation and use of
diagnostic data. European legislation requests documentation of health incidents which involved
application of pharmaceuticals to animals in the food chain. Veterinary medical diagnoses may,
therefore, be available through the treatment records kept by veterinarians and farmers. However, it
must be ensured that minimum requirements for data recording are followed; in particular, it must be
noted that animal identification schemes are not uniform within or across countries. Furthermore, it
must be a clear distinction made between prophylactic and therapeutic use of pharmaceuticals, with
the former being excluded from disease statistics. Information on prophylaxis measures may be
relevant for interpretation of health data (e.g., dry cow therapy), but should not be misinterpreted as
indicators of disease. While recording of the use of pharmaceuticals is encouraged it is not uniformly

required internationally, and health data should be collected regardless of the availability of treatment
information.
In order to avoid misinterpretation of health information and facilitate analysis, a unique code should
be used for recording each type of health incident. This code must fulfill the following conditions:
a. Clear definitions of the health incidents to be recorded, without opportunities for different
interpretations.
b. Includes a broad spectrum of diseases and health incidents, covering all organ systems, and
address infectious and non-infectious diseases.
c. Understandable by all parties likely to be involved in data recording.
d. Permit the recording of different levels of detail, ranging from very specific diagnoses of
veterinarian compared to very general diagnoses or observations by producers.
Starting from a very detailed code of diagnoses, recording systems may be developed that use only a
subset of the more extensive code. However, the identical event identifiers submitted to the health
database must always have the same meaning. Therefore, data must be coded using a uniform national,
or preferably international, scheme before entering information into the central health database. In
the case of electronic recording of health data, it is the responsibility of the software providers to
ensure that the standard interface for direct and/or indirect health data is properly implemented in
their products. When farmers are permitted to define their own codes the mapping of those custom
codes to standard codes is a substantial challenge, and careful consideration should be paid to that
problem (see, e.g., Zwald et al., 2004a).
A comprehensive code of diagnoses with about 1,000 individual input options (diagnoses) is provided
as an appendix to these guidelines. It is based on the code of diagnoses developed in Germany by the
veterinarian Staufenbiel ('zentraler Diagnoseschlüssel') (Annex). The structure of this code is
hierarchical, and it may represent a 'gold standard' for the recording of direct health data. It includes
very specific diagnoses which may be valuable for making management decisions on farms, as well as
broad diagnoses with little specificity for analyses which require information on large numbers of
animals (e.g. genetic evaluation). Furthermore, it allows the recording of selected prophylactic and
biotechnological measures which may be relevant for interpretation of recorded health data.
In the Scandinavian countries and in Austria codes with 60 to 100 diagnoses are used, allowing
documentation of the most important health problems of cattle. Diagnoses are grouped by disease
complexes and are used for documentation by treating veterinarians (Osteras et al., 2007; Austrian
Ministry of Health, 2010; Osteras, 2012).
For documentation of direct health data by expert groups, special subsets of the comprehensive code
may be used. Examples for claw trimmers can be found in the literature (e.g. Capion et al., 2008;
Thomsen et al.,2008; Maier, 2009a, b; Buch et al., 2011).
When working with producer-recorded data, a simplified code of diagnoses should be provided which
includes only a subset of the extensive code (Neuenschwander et al., 2008; USDA, 2010). Diagnoses
included must be clearly defined and observable without veterinary medical expertise. Such a reduced
code may, for example, consider mastitis, lameness, cystic ovarian disease, displaced abomasum,
ketosis, metritis/uterine disease, milk fever and retained placenta (Neuenschwander et al., 2008). The
United States model (USDA, 2010) is event-based, and permits very general reports (e.g., This cow had
ketosis on this day."), as well as very specific ones (e.g., "This cow had Staph. aureus mastitis in the
right, rear quarter on this day.").

Mandatory information will be used for basic plausibility checks. Additional information can be used
for more sophisticated and refined validation of health data when those data are available.
a. The recording farm must be registered to record and transmit health data.
b. If information on the person recording the data are provided, that individual must be
authorized to submit data for this specific farm.
c. The animal for which health information is submitted must be registered to the respective
farm at the time of the reported health incident.
d. The date of the health incident must refer to a living animal (must occur between the birth and
culling dates), and may not be in the future.
e. A particular health event can only be recorded once per animal per day.
f. The contents of the transmitted health record must include a valid disease code. In the case of
known selective recording of health events (e.g., only claw diseases, only mastitis, no calf
diseases), the health record must fit the specified disease category for which health data are
supposed to be submitted.
g. For sources of data with limited authorization to submit health data, the health record must fit
the specified disease category (e.g., locomotory diseases for claw trimmers, metabolic
disorders for nutritionists).
In order to produce reliable and meaningful statistics on the health status in the cattle population,
recording of health events should be as complete as possible on all farms participating in the health
improvement program. Ideally, the intensity of observation and completeness of documentation
should be the same for all animals regardless of sex, age, and individual performance. Only then will a
complete picture of the overall health status in the population emerge. However, this ideal situation of
uniform, complete, and continuous recording may rarely be achieved, so methods must be developed
to distinguish between farms with desirably good health status of animals and farms with poor
recording practices.
Countries with on-going programs of recording and evaluation of health data require a minimum
number of diagnoses per cow and year (e.g., Denmark: 0.3 diagnoses; Austria: 0.1 first diagnoses);
continuity of data registration needs to be considered. Farms that fail to achieve these values are
automatically excluded from further analyses until their recording has improved. However, herd sizes
need to be considered when defining minimum reporting frequencies to avoid possible biases in favor
of larger or smaller farms. Any fixed procedure involves the risk of excluding farms with extraordinary
good herd health, but to avoid biased statistics there seems to be no alternative to criteria for inclusion,
and setting minimum lower limits for reporting. Different criteria will be needed for diseases that
occur with low frequency versus those with high frequency, particularly when the cost of a rare illness
is very high compared to a common one.
Because recording practices and completeness on farms may not be uniform across disease categories
(e.g., no documentation of claw diseases by the producer), data should be periodically checked by
disease category to determine what data should be included. Use of the most-thoroughly documented
group of health traits to make decisions about inclusion or exclusion of a specific farm may lead to
considerable misinterpretation of health data.

There are limited options to routinely check health data for consistency on a per animal basis. Some
diagnoses may only be possible in animals of specific sex, age, or physiological state. Examples can be
found in the literature (Kelton et al., 1998; Austrian Ministry of Health, 2010). Criteria for plausibility
checks will be discussed in the trait-specific part of these guidelines.
Regardless of the sources of health data included, long-term acceptance of the health recording system
and success of the health improvement program will rely on the sustained motivation of all parties
involved. To achieve this, frequent, honest, and open communications between the institutions
responsible for storage and analysis of health data and people in the field is necessary. Producers,
veterinarians and experts will only adopt and endorse new approaches and technologies when
convinced that they will have positive impacts on their own businesses. Mutual benefits from
information exchange and favorable cost-benefit ratios need to be communicated clearly.
When a key objective of data collection is the development a of genetic improvement program for
health, producers must be presented with a reasonable timeline for events. When working with low-
heritability traits that are differentially recorded much more data will be necessary for the calculation
of accurate breeding values than for typical production traits. It is very important that everyone is
aware of the need to accumulate a sufficient dataset to support those calculations, which may take
several years. This will help ensure that participants remain motivated, rather than become
discouraged when new products are not immediately provided. The development of intermediate
products, such as reports of national incidence rates and changes over time, could provide tools useful
to producers between the start of data collection and the introduction of genetic evaluations.
Health reports, produced for each of the participating farms and distributed to authorized persons,
will help to provide early rewards to those participating in health data recording. To assist with
management decisions on individual farms, health reports should contain within-herd statistics
(health status of all animals on the farm and stratified by age and/or performance group), as well as
across-herd statistics based on regional farms of similar size and structure. Possible access to the
health reports by authorized veterinarians or experts will help to maximize the benefits of data
recording by ensuring that competent help with data interpretation is provided.
Most health incidents in dairy herds fit into few major disease complexes (e.g., Heringstad et al., 2007;
Koeck et al., 2010a,b, Wolff, 2012), each of which implies that specific issues be addressed when
working with related health information. In particular, variation exists with regard to options for
plausibility checks of incoming data including eligible animal group, time frame of diagnoses, and
possibility of repeated diagnoses.
Distinctions must be drawn between diseases which may only occur once in an animal's lifetime
(maximum of one record per animal) or once in a predefined time period (e.g., maximum of one
record per lactation) on the one hand and disease which may occur repeatedly throughout the life-
cycle. Assumptions regarding disease intervals, i.e., the minimum time period after which the same
health incident may be considered as a recurrent case rather than an indicator of prolonged disease,
need to be considered when comparing figures of disease prevalences and distributions. Furthermore,
it must be decided if only first diagnoses or first and recurrent diagnoses are included in lifetime
and/or lactation statistics. Differences will have considerable impact on comparability of results from
health data analyses.

Mastitis is the qualitatively and quantitatively most important udder health trait in dairy cattle (e.g.
Amand et al., 2006; Heringstad et al., 2007, Wolff, 2012). The term mastitis refers to any
inflammation of the mammary gland, i.e., to both subclinical and clinical mastitis. However, when
collecting direct health data one should clearly distinguish between clinical and subclinical cases of
mastitis. Subclinical mastitis is characterized by an increased number of somatic cells in the milk
without accompanying signs of disease, and somatic cell count (SCC) has been included in routine
performance testing by many countries, representing an indicator trait for udder health (indirect
health data).
Cows affected by clinical mastitis show signs of disease of different severity, with local findings at the
udder and/or perceivable changes of milk secretion possibly being accompanied by poor general
condition. Recording of clinical mastitis (direct health data) will usually require specific monitoring,
because reliable methods for automated recording have not yet been developed. Documentation
should not be confined to cows in first lactation, but include cows of second and subsequent lactations.
Optional information on cases that may be documented and used for specific analyses includes
a. Type of clinical disease (acute, chronic).
b. Type of secretion changes (catarrhal, hemorrhagic, purulent, necrotizing).
c. Evidence of pathogens which may be responsible for the inflammation.
d. Location of disease (affected quarter or quarters).
e. Presence of general signs of disease.
Appropriate analyses of information on clinical mastitis require consideration of the time of
onset or first diagnosis of disease (days in milk). Clinical mastitis developing early and late in
lactation may be considered as separate traits.
Table 2. Udder health trait considerations.
Parameters to check incoming health data
Recommended inclusion criterion Remarks
Eligible animal group Heifers and cows (obligatory: sex = female)
Exceptions possible (where appropriate, diagnoses in younger females may be considered separately)
Time frame of diagnoses 10 days before calving to 305 days in milk
Exceptions possible (where appropriate, diagnoses beyond -10 to 305 days in milk may be considered separately; shorter reference periods may be defined)
Repeated diagnoses Possible per animal and lactation (possibility of multiple diagnoses per lactation)
Definition of minimum time period after which same diagnosis may be considered as recurrent case rather than prolonged disease
Reproductive disorders represents a set of diseases which have the same effect (reduced fertility or
reproductive performance), but differ in pathogenesis, course of disease, organs involved, possible
therapeutic approaches, etc. To allow the use of collected health data for improvement of management
on the herd and/or animal level, recording of reproductive disorders should be as specific as possible.

Grouping of health incidents belonging to this disease complex may be based on the time of
occurrence and/or organ involved. Within each of these disease groups, specific plausibility checks
must be applied considering, for example, time frame of diagnoses and possibility of multiple
diagnoses per lactation (recurrence). Fixed dates to be considered include the length of the bovine
ovarian cycle (21 days) and the physiological recovery time of reproductive organs after calving (total
length of puerperium: 42 days).
Examples:
a. Embryonic death, abortion.
b. Bradytocia (uterine inertia), perineal rupture.
c. Retained placenta, puerperal disease, ... .
Examples:
a. Cystic ovaries, silent heat.
b. Metritis (uterine infection), ...
Table 3. Reproduction trait considerations.
Parameters to check incoming health data
Recommended inclusion criterion Remarks
Eligible animal group
Heifers and cows Minimum age should be consistent with performance data analyses
Time frame of diagnoses
Depending on type of disease Fixed patho-physiological time frames should be considered (e.g. Duration of puerperium, cycle length)
Repeated diagnoses Depending on type of disease: maximum of one diagnosis per animal (e.g. Genital malformation), maximum of one diagnosis per lactation (e.g. Retained placenta) or possibility of multiple diagnoses per lactation (e.g. Cystic ovaries)
Definition of minimum time period after which same diagnosis may be considered as recurrent case rather than prolonged disease (e.g. 21 days for cystic ovaries because of direct relation to the ovary cycle)
Recording of locomotory diseases may be performed on different level of specificity. Minimum
requirement for recording may be documentation of locomotion score (lameness score) without details
on the exact diagnoses. However, use of some general trait lameness will be of little value for deriving
management measures.
Because of the heterogeneous pathogenesis of locomotory disease, recording of diagnoses should be as
specific as possible.

Rough distinction may be drawn between claw diseases and other locomotory diseases, but
results of health data analyses will be more meaningful when more detailed information is available.
Therefore, recording of specific diagnoses is strongly recommended. Determination of the cause of
disease and options for treatment and prevention will benefit from detailed documentation of affected
structure(s), exact location, type and extent of visible changes. Such details may be primarily available
through veterinarians (more severe cases of locomotory diseases) and claw trimmers (screening data
and less severe cases of locomotory diseases). However, experienced farmers may also provide
valuable information on health of limbs and claws.
Care must be taken when referring to terms from farmers' jargon, because definitions are often rather
vague and diagnoses of diseases may be inconsistent. Documentation practices differ based on training
and professional standards, e.g., claw trimmers and veterinarians, as well as nationally and
internationally, and different schemes have been implemented in various on-farm data collection
systems. To ensure uniform central storage and analysis of data, tools for mapping data to a consistent
set of keys must to be developed, and unambiguous technical terms (veterinary medical diagnoses)
should be used in documentation whenever possible.
Examples:
a. Laminitis complex (white line disease, sole haemorrhage, sole duplication, wall lesions, wall
buckling, wall concavity).
b. Sole ulcer (sole ulcer at typical site = rusterholz's disease, sole ulcer at atypical site, sole ulcer
at tip of claw).
c. Digital dermatitis (mortellaro's disease = hairy foot warts = heel warts = papillomatous digital
dermatitis).
d. Heel horn erosion (erosio ungulae = slurry heel).
e. Interdigital dermatitis, interdigital phlegmon (interdigital necrobacillosis = foot rot),
interdigital hyperplasia (interdigital fibroma = limax = tylom).
f. Circumscribed aseptic pododermatitis, septic pododermatitis.
g. Horn cleft, ... .
The expertise of professional claw trimmers should be used when recording claw diseases. In herds
with regular claw trimming (by the producer or a professional claw trimmer) accessibility of screening
data, i.e., information on claw status of all animals regardless of regular or irregular locomotion
(lameness) or absence or presence of other signs of disease (e.g., swelling, heat), will significantly
increase the total amount of available direct health data, enhancing the reliability of analyses of those
traits. Incidences of claw diseases may be biased if they are collected on based on examinations, or
treatment, of lame animals.
Other information about claws which may be relevant to interpret overall claw health status of the
individual animal, such as claw angles, claw shape or horn hardness, also may be documented. Some
aspects of claw conformation may already be assessed in the course of conformation evaluation.
Analyses of claw disease may benefit from inclusion of such indirect health data.
Refer to ICAR Claw Atlas for detailed descriptions. The Claw Atlas is available on the ICAR website:
a. As a .pdf file in English here.

b. Translations in twenty other languages here.
c. As a poster in English here.
d. As a poster in German here.
Examples:
a. Lameness (lameness score).
b. Joint diseases (arthritis, arthrosis, luxation).
c. Disease of muscles and tendons (myositis, tendinitis, tendovaginitis).
d. Neural diseases (neuritis, paralysis), ... .
Low frequencies of distinct diagnoses will probably interfere with analyses of other
locomotory diseases involving a high level of specificity. Nevertheless, the improvement of
locomotory health on the animal and/or farm level will require detailed disease information
indicating causative factors which need to be eliminated. The use of data from veterinarians
may allow deeper insight into improvement options. Despite a substantial loss of precision,
simple recording of lame animals by the producers may be the easiest system to implement
on a routine basis. Rapidly increasing amounts of data may then argue for including
lameness or lameness score in advanced analyses.
Table 4. Considerations for locomotion traits.
Parameters to check incoming health data
Recommended inclusion criterion Remarks
Eligible animal group
No sex or age restriction
Sex- and/or age-dependent differences in intensity of systematic recording should be considered
Time frame of diagnoses
No time restriction -
Repeated diagnoses Possibility of multiple diagnoses per animal independent of lactation
Definition of minimum time period after which same diagnosis may be considered as recurrent case rather than prolonged disease (no clear physiological reference period)
The range of bovine metabolic and digestive disorders is generally rather broad, including diverse
infectious and non-infectious disease. Although each of these diseases may have significant impacts on
individual animal performance and welfare, few of them are of quantitative importance. Major
diseases can broadly be characterized as disturbances of mineral or carbohydrate metabolism, which
are caused in the lactating cow primarily by imbalances between dietary requirements and intakes.
Examples:
a. Milk fever (i.e., hypocalcaemia, periparturient paresis), tetany (i.e., hypomagnesiaemia).

b. Ketosis (i.e., acetonaemia), ... .
Examples:
a. Ruminal acidosis, ruminal alkalosis, ruminal tympany.
b. Abomasal tympany, abomasal ulcer, abomasal displacement (left displacement of the
abomasum, right displacement of the abomasum).
c. Enteritis (catarrhous enteritis, hemorrhagic enteritis, pseudomembranous enteritis,
necrotisizing enteritis).
Table 5. Considerations for metabolic traits.
Parameters to check incoming health data
Recommended inclusion criterion Remarks
Eligible animal group Depending on type of disease: no sex or age restriction or restriction to adult females (calving-related disorders)
Sex- and/or age-dependent differences in intensity of systematic recording should be considered
Time frame of diagnoses Depending on type of disease: no time restriction or restriction to (extended) peripartum period
Possible definition of risk periods (where appropriate, diagnoses beyond may be considered separately)
Repeated diagnoses Depending on type of disease: maximum of one diagnosis per lactation (e.g. Milk fever), possibility of multiple diagnoses per lactation and independent of lactation (e.g. Enteritis)
Definition of minimum time period after which same diagnosis may be considered as recurrent case rather than prolonged disease (no clear physiological reference period)
Diseases affecting other organ systems may occur infrequently. However, recording of those diseases is
strongly recommended to get complete information on the health status of individual animals.
Interpretation of the effect of certain diseases on overall health and performance will only be possible,
if the whole spectrum of health problems is included in the recording program.
Examples:
a. Diseases of the urinary tract (hemoglobinuria, hematuria, renal failure, pyelonephritis,
urolithiasis, ...).
b. Respiratory disease (tracheitis, bronchitis, bronchopneumonia, ...).
c. Skin diseases (parakeratosis, furunculosis, ...).
d. Cardiovascular disease (cardiac insufficiency, endocarditis, myocarditis, thrombophlebitis, ...).

Table 6. Considerations for other disease traits.
Parameters to check incoming health data
Recommended inclusion criterion Remarks
Eligible animal group No sex or age restriction
Sex- and/or age-dependent differences in intensity of systematic recording should be considered
Time frame diagnoses No time restriction - Repeated diagnoses Possibility of multiple
diagnoses per animal independent of lactation (e.g. Tracheitis)
Definition of minimum time period after which same diagnosis may be considered as recurrent case rather than prolonged disease (no clear physiological reference period)
Impaired calf health may have considerable impact on dairy cattle productivity. Optimization of
raising conditions will not only have short-term positive effects with lower frequencies of diseased
calves, but also may result in better condition of replacement heifers and cows. However, management
practices with regard to the male and female calves usually differ between farms and need to be
considered when analyzing health data. On most dairy farms the incentive to record health events
systematically and completely will be much higher for female than for male calves. Therefore, it may
be necessary to generally exclude the male calves from prevalence statistics and further analyses.
Examples:
a. Omphalitis (omphalophlebitis, omphaloarteriitis, omphalourachitis).
b. Umbilical hernia.
c. Congenital heart defect (persitent ductus arteriosus botalli, patent foramen ovale, ...).
d. Neonatal asphyxia.
e. Enzootic pneumonia of calves.
f. Disturbance of oesophageal groove reflex.
g. Calf diarrhea, ... .

Table 7. Considerations for calf health traits.
Parameters to check incoming health data
Recommended inclusion criterion Remarks
Eligible animal group Calves Sex-dependent differences in intensity of systematic recording should be considered
Time frame of diagnoses Depending on type of disease (e.g. Neonatal period, suckling period)
Possible definition of risk periods (where appropriate, diagnoses beyond may be considered separately)
Repeated diagnoses Depending on type of disease: maximum of one diagnosis per animal (e.g. Neonatal asphyxia) or possibility of multiple diagnoses per animal (e.g. Diarrhea)
Definition of minimum time period after which same diagnosis may be considered as recurrent case (no clear physiological reference period)
Rapid feedback is essential for farmers and veterinarians to encourage the development of an efficient
health monitoring system. Information can be provided soon after the data collection begins in the
form individual farm statistics. If those results include metrics of data quality, then producers may
have an incentive to quickly improve their data collection practices. Regional or national statistics
should be provided as soon as possible as well. Early detection and prevention of health problems is an
important step towards increasing economic efficiency and sustainable cattle breeding. Accordingly,
health reports are a valuable tool to keep farmers and veterinarians motivated and ensure continuity of
recording.
Direct and indirect observations need to be combined for adequate and detailed evaluations of health
status. Reference should be made to key figures such as calving interval, pregnancy rate after first
insemination, and non-return rate. A short time interval between calving and many diagnoses of
fertility disorders is due to the high levels of physiological stress in the peripartum period, and also
may indicate that a farmer is actively working to improve fertility in their herd. A low rate of reported
mastitis diagnoses is not necessarily proof of good udder health, but may reflect poor monitoring and
documentation.
In addition to recording disease events, on-farm system also can be used to record useful management
information, such as body condition scores, locomotion scores, and milking speed (USDA, 2010).
Individual animal statuses (clear/possibly infected/infected) for infectious diseases such as
paratuberculosis (Johne's disease) and leukosis also may be tracked. Such data may be useful for
monitoring animal welfare on individual farms.
Optimized herd management is important for economically successful farming. Timely availability of
direct health information is valuable and supplements routine performance recording for early
detection of problems in a herd. Therefore, health data statistics should be added to existing farm
reports provided by milk recording organizations. Examples from Austria are found in Egger-Danner
et al. (2007) and Austrian Ministry of Health (2010).

The EU-Animal Health Strategy (2007-2013), 'Prevention is better than cure', underscores the
increased importance placed on preventive rather than curative measures. This implicates a change of
the focus of the veterinary work from therapy towards herd health management.
With the consent of the farmer, the veterinarian can access all available information about herd health.
The most important information should be provided to the farmer and veterinarian in the same way to
facilitate discussion at eye-level. However, veterinarians may be interested in additional details
requiring expert knowledge for appropriate interpretation. Health recording and evaluation programs
should account for the need of users to view different levels of detail.
The overall health status of the herd will benefit from the frequent exchange of information between
farmers and veterinarians and their close cooperation. Incorrect interpretation or poor documentation
of health events by the farmer may be recognized by attending veterinarians, who can help correct
those errors. Herd health reports will provide a valuable and powerful tool to jointly define goals and
strategies for the future, and to measure the success of previous actions.
Immediate reactions
It is important that farmers and veterinarians have quick access to herd health data. Only then can
acute health problems, which may be related to management, be detected and addressed promptly. An
Internet-based tool may be very helpful for timely recording and access to data.
Long term adjustments
Less-detailed reports summarizing data over longer time periods (e.g., one year) may be compiled to
provide an overview of the general health status of the herd. Such summary reports will facilitate
monitoring of developments within farm over time, as well as comparisons among farms on district
and/or province level. References for management decisions which account for the regional
differences should be made available (Austrian Ministry of Health, 2010; Schwarzenbacher et al.,
2010). Definitions of benchmarks are valuable, and for improvement of the general health status it is
important to place target oriented measures.
Ministries and other organizations involved in animal health issues are very interested in monitoring
the health status of the cattle population. Consumers also are increasingly concerned about aspects of
food safety and animal welfare. Regardless of which sources of health information are used, national
monitoring programs may be developed to meet the demands of authorities, consumers and producers.
The latter may particularly benefit from increased consumer confidence in safe and responsible food
production.
It is recommended that all information, including both direct and indirect observations, be taken into
account when monitoring activity and preparing reports. For example, information on clinical mastitis
should be combined with somatic cell count or laboratory results.
It is extremely important to clearly define the respective reference groups for all analyses. Otherwise,
regional differences in data recording, influences of herd structure and variation in trait definition may
lead to misinterpretation of results. To ensure the reliability of health statistics it may be necessary to
define inclusion criteria, for example a minimum number of observations (health records) per herd
over a set time period. Such lower limits must account for the overall set-up of the health monitoring
program (e.g., size of participating farms, voluntary or obligatory participation in health recording).

Key measures that may be used for comparisons among populations are incidence and prevalence. In
any publication it must be clear which of the two rates is reported, and also how the rates have been
calculated.
Incidence
Number of new cases of the disease or health incident in a given population occurring in a specified
time period which may be fixed and identical for all individuals of the population (e.g., one year or one
month) or relate to the individual age or production period (e.g., lactation = day 1 to day 305 in milk).
For example, the lactation incidence rate (LIR) of clinical mastitis (CM) can be calculated as the
number of new CM cases observed between day 1 and day 305 in milk.
Equation 1. For computation of lactation incidence rate for clinical mastitis.
population in themilk in 305day and 1day between present sindividual ofnumber total
milkin 305day and 1day between CM of cases new=LIR
CM
Another, and arguably a more accurate incidence rate could be calculated, by taking into account the
total number of days at risk in the denominator population. This allows for the fact that some animals
will leave the herd prematurely (or may join the herd late) and will therefore not contribute a 'full unit'
of time of risk to the calculation.
Equation 2. For computation of lactation incidence rate for clinical mastitis taking account of day as
risk.
LIRCM = new cases of CM between day 1 and day 305 in milk
N(days) / 305
Where N(days) is the total number of days that individual cows were present in the herd when
between 1 and 305 days in milk; ie a cow present throughout lactation will add 305 days, a cow culled
on day 30 of lactation will only contribute 30 days etc., … (divided by 305 as that is the period of
analysis).
Prevalence
Number of individuals affected by the disease or health incident in a given population at a particular
point in time or in a specified time period.
Equation 3. For computation of prevalence of clinical mastitis.
PrevalenceCM = number of occurrences of CM between day 1 and day 305 in milk
population during the same time period (e.g. N(days) / 305)
Traits for which breeding values are predicted differ between countries and dairy breeds. However,
total merit indices have generally shifted towards functional traits over the last several years (Ducrocq,
2010). Currently, most countries use indirect health data like somatic cell counts or non-return rates
for genetic evaluation to improve health and feritility in the dairy population. Direct health
information may be used in the future, and already has been included in genetic evaluations for several
years in the Scandinavian countries (Heringstad et al., 2007; Østeras et al., 2007; Johansson et al.,
2006; Johansson et al., 2008; Interbull, 2010; Negussie et al., 2010).

Trait definitions for genetic analyses must account for frequencies of health incidents, with low
incidence rates requiring more records for reliable estimation of genetic parameters and prediction of
breeding values. Broader and less-specific definitions of health traits may mitigate this problem, with a
possible loss of selection intensity. However, obligatory plausibility checks of data must be performed
as specifically as possible, and any combination of traits at a later stage must account for the
pathophysiology underlying the respective health traits. Examples of trait definitions found in the
literature are given together with the reported frequencies in Table 8.
Many studies have shown that breeding measures based on direct health information can be successful
(e.g., Amand, 2006, Zwald et al., 2006a,b; Heringstad et al., 2007). When using indirect health data
alone or in combination with direct health data it must be remembered that the information provided
by the two types of traits is not identical. For example, the genetic correlations among clinical mastitis
and somatic cell count are in the range of 0.6 to 0.7 depending on the definition of the indirect
measure of mastitis (e.g., Koeck et al., 2010b). Correlation estimates are lower for fertility traits, with
moderately negative genetic correlation of -0.4 between early reproduction disorders and 56-day non-
return-rate (Koeck et al., 2010a).
Heritability estimates of direct health traits range from 0.01 to 0.20 and are higher when only first
rather than all lactation records are used (Zwald et al., 2004). Results from Fleckvieh and Norwegian
Red indicate that heritabilities of metabolic diseases may be higher than heritabilities of udder,
locomotory, and reproductive diseases (Zwald et al., 2004; Heringstad et al., 2005). When comparing
genetic parameter estimates, methodological differences such as the use of linear versus threshold
models need to be considered.
Existing genetic variation among sires with respect to functional traits can be used to select for
improved health and longevity. Experience from the Scandinavian countries shows that genetic
evaluation for direct health traits can be successfully implemented. For several disease complexes it
may be advantageous to combine direct and indirect health data (e.g.Johansson et al., 2006,
Johanssen et al., 2008, Negussie et al., 2010, Pritchard et al., 2011 and Urioste et al., 2011; Koeck et
al., 2012a,b).
Further information on already-established genetic evaluations for functional traits including
considered direct and indirect health information can be found on the Interbull website
(http://www.interbull.org/ib/geforms ).

Examples of national genetic evaluations (2010)

Table 8. Lactation incidence rates (LIR), i.e. proportions of cows with at least one diagnosis of the
respective disease within the specified time period.
Breed trait
Time period (parities
considered) LIR (%) Reference
Danish Red Udder diseases
-10 to 100 days in milk
(1st lactation)
22
Nielsen et al., 2000
Reproductive disturbances 12 Digestive and metabolic diseases
3
Feet and legs disorders 6 Danish Holstein
Udder diseases -10 to 100 days in
milk (1st lactation)
21
Nielsen et al., 2000
Reproductive disturbances 10 Digestive and metabolic diseases
3
Feet and legs disorders 6 Danish Jersey
Udder diseases -10 to 100 days in
milk (1st lactation)
24
Nielsen et al., 2000
Reproductive disturbances 3 Digestive and metabolic diseases
2
Feet and legs disorders 4 Norwegian Red
Clinical mastitis -15 to 120 days in milk (1st, 2nd, 3rd lactation)
15.8 19.8 24.2
Heringstad et al., 2005
Milk fever -15 to 30 days in milk (1st, 2nd, 3rd lactation)
0,1 1,9 7,9
Ketosis -15 to 120 days in milk (1st, 2nd, 3rd lactation)
7.5 13.0 17.2
Retained placenta 0 to 5 days in milk (1st,
2nd, 3rd lactation)
2.6 3.4 4.3
Swedish Holstein
Clinical mastitis -10 to 150 days in milk (1st, 2nd, 3rd lactation)
10.4 12.1 14.9
Carlén et al., 2004
Finnish Ayrshire
Clinical mastitis -7 to 150 days in milk (1st, 2nd, 3rd lactation)
9.0 10.6 13.5
Negussie et al., 2006
Fleckvieh (Simmental)
Clinical mastitis -10 to 150 days in milk 9.6 Koeck et al., 2010a
Early reproductive disorders 0 to 30 days in milk 7.2 Koeck et al., 2010a
Late reproductive disorders 31 to 150 days in milk 14.3 Koeck et al., 2010b
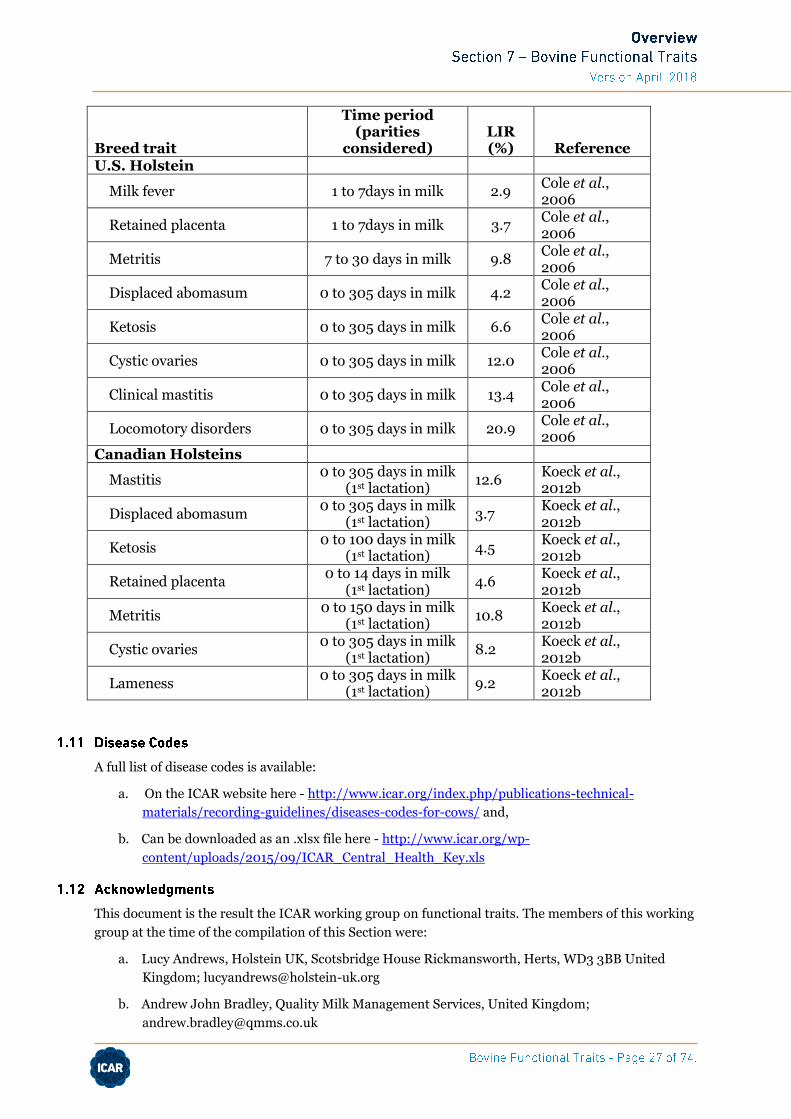
Breed trait
Time period (parities
considered) LIR (%) Reference
U.S. Holstein
Milk fever 1 to 7days in milk 2.9 Cole et al., 2006
Retained placenta 1 to 7days in milk 3.7 Cole et al., 2006
Metritis 7 to 30 days in milk 9.8 Cole et al., 2006
Displaced abomasum 0 to 305 days in milk 4.2 Cole et al., 2006
Ketosis 0 to 305 days in milk 6.6 Cole et al., 2006
Cystic ovaries 0 to 305 days in milk 12.0 Cole et al., 2006
Clinical mastitis 0 to 305 days in milk 13.4 Cole et al., 2006
Locomotory disorders 0 to 305 days in milk 20.9 Cole et al., 2006
Canadian Holsteins
Mastitis 0 to 305 days in milk
(1st lactation) 12.6
Koeck et al., 2012b
Displaced abomasum 0 to 305 days in milk
(1st lactation) 3.7
Koeck et al., 2012b
Ketosis 0 to 100 days in milk
(1st lactation) 4.5
Koeck et al., 2012b
Retained placenta 0 to 14 days in milk
(1st lactation) 4.6
Koeck et al., 2012b
Metritis 0 to 150 days in milk
(1st lactation) 10.8
Koeck et al., 2012b
Cystic ovaries 0 to 305 days in milk
(1st lactation) 8.2
Koeck et al., 2012b
Lameness 0 to 305 days in milk
(1st lactation) 9.2
Koeck et al., 2012b
A full list of disease codes is available:
a. On the ICAR website here - http://www.icar.org/index.php/publications-technical-
materials/recording-guidelines/diseases-codes-for-cows/ and,
b. Can be downloaded as an .xlsx file here - http://www.icar.org/wp-
content/uploads/2015/09/ICAR_Central_Health_Key.xls
This document is the result the ICAR working group on functional traits. The members of this working
group at the time of the compilation of this Section were:
a. Lucy Andrews, Holstein UK, Scotsbridge House Rickmansworth, Herts, WD3 3BB United
Kingdom; [email protected]
b. Andrew John Bradley, Quality Milk Management Services, United Kingdom;

c. John B. Cole, Animal Improvement Programs Laboratory, USA; [email protected]
d. Christa Egger-Danner, ZuchtData EDV-Dienstleistungen GmbH, Austria; egger-
[email protected] (Chairperson since 2011)
e. Nicholas Gengler, Gembloux Agricultural University, Belgium; [email protected]
f. Bjorg Heringstad, Department of Animal and Aquacultural Sciences / Geno , Norwegian
University of Life Sciences, Norway; [email protected]
g. Jennie Pryce, Victorian Departement of Primary Industries, Australia;
h. Katharina Stock, VIT, Germany; [email protected]
i. Erling Strandberg, Sweden (member and chairperson till 2011); [email protected]
Frank Armitage, United Kingdom; Georgios Banos, Faculty of Veterinary Medicine, Greece; Ulf
Emanuelson, Swedish University of Agricultural Science, Sweden; Ole Klejs Hansen, Knowledge
Centre for Agriculture, Denmark and Filippo Miglior, Canadian Dairy Network, Canada and is thanked
for their support and contribution. Rudolf Staufenbiel, FU Berlin, and co-workers is thanked for their
contributions to standardization of health data recording.
1. Aamand, G. P., 2006. Data collection and genetic evaluation of health traits in the Nordic
countries. British Cattle Conference, Shrewsbury, UK, 2006.
2. Appuhamy, J.A.D.R.N., Cassell, B.G., Cole, J.B., 2009. Phenotypic and genetic relationship of
common health disorders with milk and fat yield persistencies from producer-recorded health
data and test-day yields. J. Dairy Sci. 92: 1785-1795.
3. Aumueller, R., Bleriot, G., Neeteson, A. M., Neuteboon, M., Osstenbach, P., Rehben, E., 2009.
EADGENE animal - health data comparison recommendations for the future.
https://www.verbrauchergesundheit.gv.at/tiere/recht/kundmachungen/monitoring_rind.ht
ml
4. FABRETP-EADGENE. http://www.fabretp.eu/eadgene.html
8. Buch, L.H., Sorensen, A.C., Lassen, J., Berg, P., Eriksson, J-.A., Jakobsen, J.H., Sorensen,
M.K., 2011. Hygiene-related and feed-related hoof diseases show different patterns of genetic
correlations to clinical mastitis and female fertility. J. Dairy Sci. 94:1540-1551.
9. Capion, N., Thamsborg, S.M.,Enevoldsen, C., 2008. Prevalence of foot lesions in Danish
Holstein cows. Veterinary Record 2008, 163:80-96.
10. Cole, J.B., Sanders, A.H., and Clay, J.S., 2006: Use of producer-recorded health data in
determining incidence risks and relationships between health events and culling. J. Dairy Sci.
89(Suppl. 1):10(abstr. M7).
11. Ducrocq, V., 2010: Sustainable dairy cattle breeding: illusion or reality? 9th World Congress
on Genetics Applied to Livestock Production. 1.-6.8.2010, Leipzig, Germany.
12. Egger-Danner, C., Fuerst-Waltl, B., Obritzhauser, W., Fuerst, C., Schwarzenbacher, H.,
Grassauer, B., Mayerhofer, M., Koeck, A., 2012. Recording of direct health traits in Austria -
experience report with emphasis on aspects of availability for breeding purposes. J. Dairy Sci.
(in press).

13. Egger-Danner, C., Fuerst-Waltl, B., Janacek, R., Mayerhofer, M., Obritzhauser, W., Reith, F.,
Tiefenthaller, F., Wagner, A., Winter, P., Wöckinger, M., Wurm, K., Zottl, K., 2007.
Sustainable cattle breeding supported by health reports. 58th Annual Meeting of the EAAP,
August 26-29, 2007, Dublin.
14. Egger-Danner, C., Obritzhauser, W., Fuerst-Waltl, B., Grassauer, B., Janacek, R., Schallerl, F.,
Litzllachner, C., Koeck, A., Mayerhofer, M., Miesenberger J., Schoder, G., Sturmlechner, F.,
Wagner, A., Zottl, K., 2010. Registration of health traits in Austria - experience review. Proc.
ICAR 37th Annual Meeting - Riga, Latvia. 31.5. - 4.6. 2010.
15. Envoldsen, C., 2010. Epidemological tools for herd diagnosis. XXVI World Buiatric Congress.
Santiago, Chile.
16. European Commission, 2007: European Union Animal Health Strategy (2007-2013):
prevention is better than cure.
http://ec.europa.eu/food/animal/diseases/strategy/animal_health_strategy_en.pdf
17. Heringstad, B., Rekaya, R., Gianola, D., Klemetsdal, G., Weigel, K.A., 2003. Genetic change for
clinical mastitis in Norwegian cattle: A threshold model analysis. J. Dairy Sci. 86: 369-375.
18. Heringstad, B., Chang, Y.M., Gianola, D., Klemetsdal, G., 2005. Genetic correlations between
clinical mastitis, milk fever, ketosis and retained placenta within and between the first three
lactations of Norwegian Red (NRF). In: EAAP-Book of Abstracts No 11: 56th Annual Meeting
of the EAAP, 3-4.6..2005 Uppsala, Sweden.
19. Heringstad, B., Klemetsdal, G., Steine, T., 2007. Selection responses for disease resistance in
two selection experiments with Norwegian red cows. J. Dairy Sci. 90: 2419-2426.
20. Interbull, 2010. Description of GES as applied in member countries. http://www-
interbull.slu.se/national_ges_info2/framesida-ges.htm
21. Johansson, K., S. Eriksson, J. Pösö, M. Toivonen, U. S. Nielsen, J.A. Eriksson, G.P. Aamand.
2006. Genetic evaluation of udder health traits for Denmark, Finland and Sweden. Interbull
Bulletin 35: 92-96.
22. Johansson, K., J. Pöso, U. S. Nielsen, J.A.Eriksson, G.P. Aamand., 2008. Joint genetic
evaluation of other disease traits in Denmark, Finland and Sweden. Interbull Meeting,
Interbull Bulletin 38:107-112.
23. Kelton, D. F., Lissemore, K. D., Martin. R. E., 1998. Recommendations for recording and
calculating the incidence of selected clinical diseases of dairy cattle. J. Dairy Sci. 81: 2502-
2509.
24. Koeck, A., Egger-Danner, C., Fuerst, C., Obritzhauser, W., Fuerst-Waltl, B., 2010. Genetic
analysis of reproductive disorders and their relationship to fertility and milk yield in Austrian
Fleckvieh dual purpose cows. J. Dairy Sci. 93: 2185-2194.
25. Koeck, A., Heringstad, B., Egger-Danner, C., Fuerst, C., Fuerst-Waltl, B., 2010. Comparison of
different models for genetic analysis of clinical mastitis in Austrian Fleckvieh dual purpose
cows. J. Dairy Sci. (in press).
26. Koeck, A., F. Miglior, D. F. Kelton, and F. S. Schenkel (2012a). Alternative somatic cell count
traits to improve mastitis resistance in Canadian Holsteins. J. Dairy Sci. 95:432-439.
27. Koeck, A., F. Miglior, D. F. Kelton, and F. S. Schenkel (2012b). Health recording in Canadian
Holsteins - data and genetic parameters. J. Dairy Sci. (submitted for publication). LeBlanc, S.

J., Lissemore, K. D., Kelton, D. F., Duffield, T. F., Leslie, K. E., 2006. Major advances in
disease prevention in dairy cattle.J. Dairy Sci. 89:1267-1279
28. Maier, M., 2009. Erfassung von Klauenveränderungen im Rahmen der Klauenpflege.
Diplomarbeit, Universität für Bodenkultur, Vienna.
29. Maier, M., 2010. Klauengesundheit durch Zucht verbessern. In: Der Fortschrittliche Landwirt.
www.zar.at/filemanager/download/22445/
30. Negussie, M., M. Lidauer, E.A. Mäntysaari, I. Stranden, J. Pösö, U.S. Nielsen, K. Johansson, J-
A. Eriksson, G.P. Aamand. 2010. Combining test day SCS with clinical mastitis and udder type
traits: a random regression model for joint genetic evaluation of udder health in Denmark,
Finland and Sweden. Interbull Bulletin 42: 25-31.
31. Neuenschwander, T. F.-O., Miglior, F., Jamrocik, J., Schaeffer, L. R., 2008. Comparison of
different methods to validate a dataset with producer-recorded health events.
http://cgil.uoguelph.ca/dcbgc/Agenda0809/Health_180908.pdf
32. Neuenschwander, T.F.O., 2010. Studies on disease resistance based on producer-recorded
data in Canadian Holsteins. PhD thesis. University of Guelph, Guelph, Canada.
33. Neuenschwander, T. F.-O., F. Miglior, J. Jamrozik, O. Berke, D. F. Kelton, and L. Schaeffer.
2012. Genetic parameters for producer-recorded health data in Canadian Holstein cattle.
Animal DOI: 10.1017/S1751731111002059.
34. Nielsen, U. S., Aamand, G. P., Mark, T., 2000. National genetic evaluation of udder health and
other traits in Denmark. Interbull Open Meeting, Bled, 2000, Interbull Bulletin 25: 143-150.
35. Olssen, S.-O.,Boekbo, P.,Hansson, S.Ö.,Rautala, H., Østerås, O.,2001. Disease recording
systems and herd health schemes for production diseases. Acta vet. scan. 2001, Suppl. 94,51-
60.
36. Østerås, O., Sølverød, L., 2005. Mastitis control systems: the Norwegian experience. In:
Hogevven, H. (Ed.), Mastitis in dairy production: Current knowledge and future solutions,
Wageningen Academic Publishers, The Netherlands, 91-101.
37. Østerås, O., Solbu, H., Refsdal, A. O., Roalkvan, T., Filseth, O., Minsaas, A., 2007. Results and
evaluation of thirty years of health recordings in the Norwegian dairy cattle population. J.
Dairy Sci. 90: 4483-4497.
38. Østerås, O. 2012. Årsrapport Helsekortordningen 2011.pdf. http://storfehelse.no/6689.cms .
Accessed, April 16, 2012.
39. Phillipson, J., Lindhe, B., 2003. Experiences of including reproduction and health traits in
Scandinavian dairy cattle breeding programmes. Livestock Production Sci. 83: 99-112.
40. Pritchard, T.C., R. Mrode, M.P. Coffey, E. Wall., 2011. Combination of test day somatic cell
count and incidence of mastitis for the genetic evaluation of udder health. Interbull-Meeting.
Stavanger, Norway. http://www.interbull.org/images/stories/Pritchard.pdf . Accessed
November 2, 2011.
41. Schwarzenbacher, H., Obritzhauser, W., Fuerst-Waltl, B., Koeck, A., Egger-Danner, C., 2010.
Health monitoring yystem in Austrian dual purpose Fleckvieh cattle: incidences and
prevalences. In: EAAP-Book of Abstracts No 11: 61th Annual Meeting of the EAAP, August 23-
27, 2010 Heraklion, Greece.

42. Soyeurt, H., Dardenne, P., Gengler, N, 2009a. Detection and correction of outliers for fatty
acid contents measured by mid-infrared spectrometry using random regression test-day
models. 60th Annual Meeting of the EAAP, Barcelona 24-27, 2009, Spain.
43. Soyeurt, H., Arnould, V.M.-R., Dardenne, P., Stoll, J., Braun, A., Zinnen, Q., Gengler, N.
2009b. Variability of major fatty acid contents in Luxembourg dairy cattle.60th Annual
Meeting of the EAAP, Barcelona 24-27, 2009, Spain.
44. Thomsen, P.T., Klaas, I.C. and Bach, K., 2008. Short communication: scoring of digital
dermatitis during milking as an alternative to scoring in a hoof trimming chute. J. Dairy Sci.
91:4679-4682.
45. Urioste, J.I., J. Franzén, J.J.Windig, E. Strandberg., 2011. Genetic variability of alternative
somatic cell count traits and their relationship with clinical and subclinical mastitis. Interbull-
meeting. Stavanger, Norway. http://www.interbull.org/images/stories/Urioste.pdf . Accessed
November 2, 2011.
46. USDA, 2010. Format 6, the data exchange format health events.
http://aipl.arsusda.gov/CFRCS/GetRCS.cfm?DocType=formats&DocName=fmt6.html
47. Wolff, C., 2012. Validation of the Nordic Disease Recording Systems for Dairy Cattle with
Special Reference to Clinical Mastitis. Doctoral Thesis. Faculty of Veterinary Medicine and
Animal Science, Department of Clinical Sciences, Swedish University of Agricultural Sciences,
Uppsala 2012. http://pub.epsilon.slu.se/8546/1/wolff_c_120110.pdf
48. Windig, JJ., Ouweltjes, W. Ten Napel, J, de Jong, G, Veerkamp RF, De Haas, Y., 2010.
Combining somatic cell count traits for optimal selection against mastitis. J. Dairy Sci. 93(4):
1690-1701.
49. Zwald, N. R., Weigel, K. A., Chang, Y. M., Welper R. D., Clay, J. S., 2004a. Genetic selection
for health traits using producer-recorded data. I. Incidence rates, heritability estimates and
sire breeding values. J. Dairy Sci. 87: 4287-4294.
50. Zwald, N. R., Weigel, K. A., Chang, Y. M., Welper R. D., Clay, J. S., 2004b. Genetic selection
for health traits using producer-recorded data. II. Genetic correlations, disease probabilities
and relationships with existing traits. J. Dairy Sci. 87: 4295-4302.
These guidelines are intended to provide people involved in keeping and breeding of dairy
cattle with recommendations for recording, management and evaluation of female fertility.
Aspects of bull fertility are covered by another set of ICAR guidelines (Section 6), compiled
by the ICAR working group for Artificial Insemination. The guidelines described here
support establishing good practices for recording, data validation, genetic evaluation and
management aspects of female fertility.
To establish a recording scheme for female fertility the following data are desirable:
a. Calving dates.
b. All artificial insemination dates including natural mating dates where possible.
c. Information on fertility disorders.
d. Pregnancy test results.

e. Culling data.
f. Body condition score.
g. Hormone assays.
Other novel predictors of fertility, such as activity based information (pedometer), are also
growing in popularity.
This document includes a list of parameters for female fertility and information on recording
and validating these data.
In broad terms, "fertility" is defined as the ability to produce offspring. In the dairy industry,
female fertility refers to the ability of a cow to conceive and maintain pregnancy within a
specific time period; where the preferred time period is determined by the particular
production system in use. The relevance of certain fertility parameters may therefore differ
between production systems, and evaluations of female fertility data have to account for
these differences.
There are currently significant challenges to achieving pregnancy in high yielding dairy cows.
Accordingly, female fertility has received substantial attention from scientists, veterinarians,
farm advisors and farmers. Culling rates due to infertility are much higher than two or three
decades ago, and conception rates and calving intervals have also deteriorated. There is no
doubt that selection for high yields, while placing insufficient or no emphasis on fertility, has
played a role in declining rates of female fertility worldwide, because genetic correlations
between production and fertility are unfavourable (e.g. Pryce and Veerkamp 1999; Sun et al.,
2010). Most breeding programs have attempted to reverse this situation by estimating
breeding values for fertility and including them with appropriate weightings in a multi-trait
selection index for the overall breeding objective of dairy cattle.
One of the most important ways that fertility can be improved, through both management
strategies and getting better breeding values is by collecting high quality fertility phenotypes.
Female fertility is a complex trait with a low heritability, because it is a combination of
several traits which may be heterogeneous in their genetic background. For example, it is
desirable to have a cow that returns to cyclicity soon after calving, shows strong signs of
oestrus, has a high probability of becoming pregnant when inseminated, has no fertility
disorders and the ability to keep the embryo/foetus for the entire gestation period. For
heifers, the same characteristics except the first one apply. Multiple physiological functions
are involved including hormone systems, defense mechanisms and metabolism, so a larger
number of parameters may reflect fertility function or dysfunction. However, in initiating a
data recording scheme for female fertility it is often not practical (although desirable) to
encompass all aspects of good fertility.
The obstacles that exist in adequate recording of fertility measures include: data capture
i.e. handwritten notebooks versus computerized data recording and how these data link to a
central database used to store data from multiple herds. Although many countries already
have adequate fertility recording systems in place, the quality of data captured may still vary
by herd. Many farmers are already motivated to improve fertility (as there is global
awareness of the decline in dairy cow fertility over recent years). However, what is not always
clearly understood is the importance of different sources of fertility data in providing tools
that can be used to improve fertility performance.

The principles and type of data that should be recorded are the same regardless of the
production system. However, the way in which the data are used i.e. the measures of fertility
may vary according to the type of production system. For this reason, we have made a
distinction between seasonal and non-seasonal herds:
In seasonal systems cows calve (typically) in the spring, so that peak milk production
matches peak grass growth. An alternative is autumn calving herds that use feed conserved
from pasture grown in the summer months. True seasonal systems have all cows calving as a
tight time frame, i.e. within 8 weeks of the planned start of calvings.
In year-round-systems heifers calve for the first time (predominantly) at a certain age e.g.
close to two years of age regardless of the month of year and calvings occur all through the
year, so that the calving pattern appears to be reasonably flat.
Calving dates can be used to calculate the interval between consecutive calvings and to
confirm previously predicted pregnancies / conceptions.
To consider: In order to handle bias from culling it is useful to also record culling of cows and
the culling reasons.
Data on inseminations can be used either alone or in combination with other data e.g. calving
dates to define interval traits. Where the measure is initiated by a calving date, it can only be
calculated for cows.
Insemination (and calving) dates can be used to calculate the following traits, those that can
be measured for cows and/or heifers are indicated in brackets:
a. Interval from calving to first insemination (cows).
b. Interval from planned start of mating to first insemination (cows and heifers).
c. Non-return rate (to first insemination or within a defined time period) (cows and heifers).
d. Conception rate (to any insemination).
e. Calving rate within a time period (an individual's phenotype is 0/1) (cows and heifers).
f. Number of inseminations per lactation or insemination period (cows and heifers).
g. Number of inseminations per calving or pregnancy.
h. Interval from first to last insemination (cows and heifers).
i. Interval between inseminations (cows and heifers).
j. Interval from calving to last insemination (cows).
There is no best set of traits for evaluation of female fertility, but it is recommended to
consider traits which reflect more than one aspect of fertility, e.g. interval from calving to
first insemination or interval from calving to first oestrus (return to cyclicity) and non-return
rate (probability of conception). For seasonal calving systems, submission rate and calving
rate could be alternatives, refer to Table 9. However, calving interval (the interval between

two calvings) requires the least data, only calving dates, and is often used as a first step to
genetic evaluations for fertility in the absence of insemination or other fertility data. It has to
be used with care as highlighted above.
These data are either diagnoses related to treatments by veterinarians or observations from
farmers. Details can be found above in 1.9.1 above.
Milk yield is correlated to fertility, and could be used as a predictor (for example in a multi-
trait analysis of fertility). However, care should be taken, as the heritability of milk yield is
high compared to fertility, the contribution of milk yield to the fertility breeding value could
be considerable, making it difficult to identify bulls that are superior for both fertility and
milk production. Results from selection based on Total Merit Indices show that it is possible
to stabilize fertility if a certain weight is put on fertility.
Recent research confirmed genetic links between fertility and milk composition. In particular,
changes of milk fatty acid profiles were identified (Bastin et al., 2011) as useful predictors.
Pregnancy status can be determined by veterinary diagnosis, such as uterine palpation or
ultrasound or by using information from hormones or circulating peptides associated with
pregnancy. The timing of this data is important and should generally be done in consultation
with veterinary practitioners. Other hormones, such as progesterone can be used to to
determine the post-partum onset of cyclic activity and calculate e.g. interval from calving to
first luteal activity (CLA) or other similar traits. The advantage of this trait, is that compared
with the interval from calving to first insemination, it is not influenced by the farmer's
decision of when to start inseminations. However, it may be costly.
Physical activity increases during oestrus, in addition there are other behavioural changes,
such as standing heat and mounting behavior. These signs are used to detect oestrus and can
be used to calculate traits such as interval between calving and resumption of oestrus. Tail
paint (on the tail head) or colour ampoules attached to the tail head are used in some
countries to aid oestrus detection. For larger herds, tail painting is used as a tool to aid
insemination rather than resumption of cyclicity, however, on many farms, the decision to
inseminate is often made after a defined period between calving and first insemination. In
many practical situations it may be unrealistic to expect oestrus (without insemination) data
to be collected, however recently there has been innovation in automating heat detection. For
example, pedometers and more sophisticated activity monitors are now being used routinely
on many farms as part of a management package. As cows become more active when in
oestrus, the pedometer information needs to be compared to a baseline for the same cow and
algorithms have been developed to interpret the data collected. The efficiency of oestrus
detection rate has been reported to range between 50 and 100% depending on the criteria of
success (At-Taras and Spahr, 2001). The gold-standard of oestrus detection are still
progesterone measurements and imperfect concordance between pedometer and
progesterone determined oestrus has been determined because activity monitors will not
detect silent behavioural oestrus (Lovendahl and Chagunda, 2010). However, clearly there is
an advantage in both progesterone and activity determined oestrus as they do not require
farm observations.

Culling data and culling reasons are important information especially if traits referring to
longer time intervals (i.e. particularly those referring to calving dates) are used. Information
on cows or heifers culled because of fertility disorders are of use, especially to remove bias
arising from cows disappearing from the recording system i.e. a bull can have a biased proof
if a lot of his daughters are culled for infertility and this is not recorded.
In the absence of accurate culling data, a useful proxy for monitoring fertility at the herd level
is the proportion of animals failing to conceive by 300 days post calving. Cows not served by
300 days most likely reflect non-fertility culls, whereas cows that have been served and fail to
conceive are more likely to reflect culls as a result of failure to conceive given that the
majority of involuntary culls and decisions on planned culling occur in early lactation prior to
the start of the breeding season.
Metabolic stress is defined as the degree of metabolic load that distorts normal physiological
function. A distortion of normal physiological function may be temporary infertility, where
the metabolic load is too great for the cow to invest in reproduction (future pregnancy) when
the current lactation is not sustainable. Metabolic load is reflected by the stability of energy
balance, which Veerkamp et al. (2001) suggested was related to traits such as milk yield, body
condition score (BCS) and live weight (LWT).
By itself live weight is not a particularly good measure of energy balance, as tall thin cows
may have weights similar to smaller cows in better condition. Therefore, BCS has been
favoured as an indicator for energy balance. Cows with low BCS may have health problems,
such as metritis, which may be the underlying problem for poor fertility. However, most
studies worldwide have shown that BCS is a good indicator of female fertility, as cows that
are mobilize body tissue may be more likely to use this energy to sustain lactation instead of
invest in a pregnancy. Therefore, BCS has been found to be suitable to be incorporated into
selection indexes for fertility, such as in New Zealand (Harris et al., 2007). BCS is sometimes
measured as part of the linear type assessment in pedigree and progeny testing herds it can
also be measured by the farmer. However, in some situations, use of BCS as a predictor trait
for fertility has been found to be limited (Gredler et al., 2008).
Female fertility data originates from different data sources which differ considerably with
respect to information content and specificity; for example from veterinary practices,
laboratories, milk recording organizations, breed associations and farms etc. Therefore,
ideally, the data source should be clearly indicated whenever information on fertility status is
collected and analyzed. When data from different sources are combined, the origin of data
must be taken into account. Regardless of the data source, it is desirable to have as few steps
as possible from initial data recording.
Initiation of lactation requires a calving date to be recorded for a cow. Calving dates are
generally collected by organizations that are responsible for recording milk production, based
on dates reported by the farmer, or more commonly gathered during the registration of
births in countries operating mandatory birth registration systems. Calving dates are the
most basic source of data available for evaluation of female fertility and can be used to
determine calving intervals (defined as the number of days between two consecutive
calvings).
Content
a. Calving dates.
b. Culling reasons.
Advantages
a. Covers both cyclicity and conception.
b. No additional effort for recording and therefore can be used as an easy first-step into
evaluating fertility.
c. Possible use of already-established data flow (reporting of calving).
Disadvantages
a. Missing dates for cows with problems around calving that do not enter the herd for milk
recording.
b. Only available for cows, not for heifers.
c. Calving interval data may be censored, as cows that are infertile are often culled before calving
again. If specific culling reasons are available, then information on animals that are culled for
infertility can be a very useful addition to calving interval data, as the least fertile cows (i.e.
cows culled for infertility) can be distinguished from cows culled for other reasons.
AI organisations and other AI operators record insemination dates and the AI sire used for
the insemination. Inseminations can either be recorded in a log book and later transferred to
a computer or directly into a computer (sometimes handheld device).
Content
a. Information on inseminations (date of insemination, sire/origin of semen, semen batch,
inseminator e.g. technician or member of farm staff).
b. Sexed semen, embryo transfer, straw splitting etc. should be noted.
c. Interventions such as synchrony should also be recorded, as it is possible that this may affect
analysis results.
Advantages
a. If logistics for collection of insemination data are established, data can be collected from many
farms.
b. A broad range of measures of fertility can be calculated from insemination dates (often with
calving dates) see Table 1. These measures can cover conception and cyclicity.
Disadvantages
a. If logistics for collection of insemination data are not established, considerable efforts may
be needed to set-up recording.
b. Completeness of recording may vary, especially if there are no legal documentation
requirements.
c. In situations where farmers often use AI for a set period of time followed by natural mating
to farm bulls, some mating dates will be missing.
Veterinarians are often involved in monitoring herd fertility. Pregnancy diagnosis or
pregnancy testing is practiced and recorded by many veterinary practices to confirm a
pregnancy. Uterine palpation per rectum or ultrasonography at around day 60 of conception
is a valuable source of data because it is more accurate than non-return rates. Treatment for
fertility disorders should also be recorded. From the economic point of view, a cow with good
fertility without any treatments needed may be clearly preferred over a cow that was treated
several times before it got pregnant.
Content
a. Pregnancy status.
b. Diagnoses of fertility disorders.
Advantages
a. Direct information on fertility, which is not covered by calving and insemination data.
Dsadvantages
a. Veterinary support and training needed to ensure data quality and consistency in diagnosis
and definitions.
b. Completeness of recording may vary depending on work peaks on the farm.
c. Accurate animal identification may be an issue, as the data may be used (by the veterinary
practice) to assess herd-level fertility rather than individual cow fertility.
d. Data on pregnancy diagnosis may only be available for a subset of the herd.
Multiple herd management software packages are available for dairy farmers to record their
own data. Some of this software interacts with the milk-recording organizations via standard
interfaces, i.e. there are automatic exchanges of data between the central database and the
computer on the farm. Farmers can enter calving, insemination, culling and pregnancy test
information themselves. For genetic evaluation purposes, it is important that all the data is
entered. Information on natural matings (if applicable) should also be recorded where
possible and practical, which may not be the case for very large herds.
Conten
a. Insemination data.
b. Calving data.
c. Pregnancy test results.
Advantages
a. No additional effort for recording.
b. Continuous recording.

Disadvantages
a. Very often only software solutions within farm, difficulties of standardized export of data,
although many software packages ensure data exchange with the genetic evaluation unit is
possible.
b. Trait definitions may differ between systems, requiring source-specific data handling.
c. Incompleteness of insemination data, for example in some cases only the last successful
insemination may be recorded for management purposes
Data security is a universally important issue when collecting and using field data.
The legal framework for use of fertility data has to be considered according to national
requirements and data privacy standards. The owner of the farm on which the data are
recorded is the owner of the data, and must enter into formal agreements before data are
collected, transferred, or analyzed.
Documentation is the precondition of use of fertility data for management and breeding
purposes.
Pre-requisite information:
a. Unique animal identification of both the cow and service sire.
b. Unique herd identification.
c. Ancestry or pedigree information (at the very least the cow's sire should be recorded).
d. Birth registration.
e. A central database (Often data is recorded on the farm's computer(s) and then uploaded to the
milk recording agency who then transfer the data to a central database. Alternatively, data can
exchange directly between the farm computer and the central database).
Useful additional documentation:
a. Individual identification of the recording person.
b. Details on respective fertility event.
c. Artificial insemination or natural service.
d. Type of semen used (e.g. sexed semen, fresh semen).
e. Type of recording and method of data transfer (software used for on-farm recording, online-
transmission).
The systematic use and appropriate interpretation of fertility data requires that different
types of information can be combined such as date of birth, sex, breed, sire and dam,
farm/herd; calving dates, and performance records. Therefore, unique identification of the
individual animals used for the fertility database must be consistent with the animal ID used
in existing databases (for more details see the "ICAR rules, standards and guidelines on
methods of identification").
Data that can be used to calculate female fertility measures can originate from a number of
sources including farm software, milk-recording organisations, veterinarians, breed societies
and laboratories. Ideally, as much data as possible should be recorded electronically, as this

reduces transcription errors. As long as data is as error free as possible, the origin of data is
less important. However, it is preferable for data to be transferred to a central database in as
few steps as possible and as quickly as possible. Genetic evaluation of young bulls relies on
early information on fertility being available.
Stepwise decision support for recording fertility
In setting up a recording scheme or using data for genetic evaluation of fertility, the data that
is currently captured needs to be considered in addition to implementing strategies for
including other data. For example, calving dates and consequently calving interval, is the
most basic measure of fertility. Then, insemination dates can be added, to calculate interval
traits and non-return rates. Ideally, pregnancy test results should also be recorded as these
can be used as early indicators of conception. Finally, or in some cases alternatively, other
predictors, such as fertility disorders, type traits, culling reasons and measures derived from
hormones assays can also be added.
Refer to Figure 1.
Figure 1. A flow chart describing the possible steps in developing a recording program for female
fertility.
a. If only data from a milk recording organization is available then calving interval can be
measured as the interval between 2 successive calvings.
b. If insemination data is available then days to first service (DFS), non-return (NR), number of
services per conception (SPC), first to last service interval (FLI), calving to last insemination
(CLI), days open (DOP) can be measured. Conception within 42 days of the planned start of

mating and presented for mating within 21 days of the planned start of mating are measures
suitable for seasonal systems and require a day when inseminations were started in the
breeding season to be identified. Similarly first service submission can be used if a voluntary
wait period is defined.
c. If information about fertility disorders (diagnoses) are available, the information about cows
with e.g. cystic ovaries, silent heat, metritis, retained placenta or puerperal diagnoses can be
included in an fertility index.
d. If pregnancy test/diagnosis data is available, then conception or pregnancy to the first (or
second) insemination can be calculated, or in seasonal systems, conception within 42 days of
the planned start of mating.
e. If type data is recorded regularly across parities, body condition score (a measure of fatness
and metabolic status) can be evaluated. The limitation with condition score as part of a type
classification scheme is that it is generally only recorded once, often on only selected cows,
and therefore its usefulness may be limited.
f. If there are research herds or dedicated nucleus herds available, then commencement of luteal
activity can be measured on a subset of animals (reference population). If these animals are
also genotyped, then a genomic prediction equation can be calculated that can be applied to
animals with genotypes but not phenotypes.
a. Recorded data should always be accompanied by a full description of the recording program.
b. If herds were selected how was this done?
c. How were the people involved in recording (e.g., veterinarians, and farmers) selected and
instructed? Any standardized recording protocol used?
d. What types of recording forms or (computer) programs were used? - What type of equipment
was used?
Is there any selection of animals within herds? Consistency, completeness and timeliness of
the recording and representativeness of the data compared to the national population is of
utmost importance. The amount of information and the data structure determine the
accuracy of the data; measures of this accuracy should always be provided.
National evaluation centers are encouraged to devise simple methods to check for logical
inconsistencies in the data. Examples of data checks include:
d. The recording farm must be registered or have a valid herd-testing identification.
e. The animal must be registered to the respective farm at the time of the fertility event.
f. The date of the fertility event must refer to a living animal (must occur between the birth and
culling dates), and may not be in the future.
g. A particular insemination must be plausible. For example are the insemination dates
impossible? (e.g. before the calving or birth date)
Regardless of the sources of fertility data included, long-term acceptance of the recording
system and success of the fertility improvement program will rely on the sustained
motivation of all parties involved. Quantifying the benefits of data recording of these data is
important. For example, data can be useful information for herd management, but also
genetic evaluation and integration of these traits into selection programs.
Refer to Table 9.
Calving interval is the number of days between two consecutive calvings. Calving interval
covers both return to cyclicity and conception, however its main disadvantage is that it is
sometimes biased because cows with the worst fertility are often culled early and hence do
not re-calve. Calving interval is also available later than many other measures of fertility, so is
not as useful for selection decisions.
Days open is the interval between calving and the last insemination date. It is similar to
calving interval provided the cow conceives to the last insemination, in which case days open
is calving interval minus the gestation length. The USA currently calculates daughter
pregnancy rate as 21/(Days Open - voluntary waiting period + 11). The voluntary waiting
period is the period after calving that a farmer deliberately does not inseminate the cow.
Non-return rate is a binary measure of whether a new mating or insemination event occurs
after the first insemination within a time period. Frequently studied intervals are 28 days
(NR28), 56 days (NR56) or 90 days (NR90). The reference period recommended by Interbull
is 56 days. This trait can be evaluated for both heifers and cows.
The number of days between calving and first insemination is sometimes influenced by
management aspects and this needs to be considered in fertility evaluations. However, it does
provide a measure of return to cyclicity post-calving. However, it does not provide
information on conception (Table 9).
The number of days between first insemination and positive pregnancy diagnosis.
Success or failure to conceive after each AI (this can be evaluated for heifers and cows)
The binary measure of whether a cow returns 42 or 56 days from the herd's planned start of
mating. It is generally confirmed by the presence of a subsequent calving date. A herd's
planned start of mating is when artificial inseminations for the herd commence.
The number of inseminations in a lactation or within a certain time period (this can be
evaluated for heifers and cows).

A subjective scale is often used for recording of heat strength. This scale could be divided in
different ways and could have various numbers of classes, but the classes should be ordered
in intensity. As an example, the Swedish system has a five-point scale (very weak, weak, clear
signs, strong, very strong heat signs) where each point is described in more detail regarding
physical signs of the vulva and mounting/being mounted.
The percentage of cows mated in a fixed number of days after the herd's start of mating. On
an individual cow basis, recording is a binary score i.e. AI'd within a period of days from the
herd's start of mating.
Information on specific fertility disorders can provide valuable information for evaluation of
female fertility. Recording details can be found in the ICAR Health guidelines.
The Body Condition Score (BCS) measures the fatness of the cow, especially in the region of
the loin, hip, pinbone, and tailhead areas. Change in BCS in early lactation may be a better
indicator of fertility compared with single observations of BCS per parity. To consider change
in BCS it has to be recorded at least twice in early lactation and requires the dates of
measurement.
For monitoring the health status of dairy cows, an assessment of fertility is also useful to
ensure that a complete picture of the health of the herd is available. For more information see
the ICAR Health Guidelines.

Table 9. Various traits used or possible to use and their potential relation to various aspects of cow
fertility.
Ref. Trait description
Aspect System
Re
tur
n t
o
cy
cli
cit
y
Oe
str
us
sig
ns
Pr
ob
. o
f
co
nc
ep
tio
n
Ab
ilit
y t
o
ke
ep
em
br
yo
Se
as
on
al
Ye
ar
ly
1 Interval between two consecutive
calvings (calving interval) + + + +
2
Days open, interval from calving
to conception (or last
insemination)
+ + + +
3 Non-return rate (56, 128, .. days) ++ +
4 Interval from calving to first
insemination ++ +
5 Interval from first ins. to
conception (or last insemination) + ++ +
6
Conception to 1st insemination
(determined with pregnancy
diagnosis)
++ +
7 Calving rate (e.g. 42 or 56 days)
from planned start of calving ++ ++
8 Number of ins. per series + ++ +
9 Heat strength +
11 Treatments for fertility problems + + +
12
Body condition score, live weight
change during early lact., energy
balance
+ + + +
Submission rate: e.g., interval
from planned start of mating to
first insemination
++ +
Interval from calving to first
luteal activity ++
Interval between inseminations + (+)
The number of + indicates how well the measure relates to the aspect of fertility
indicates the suitability of the measure to the production system
Although these guidelines focus mainly on evaluation of female fertility for genetic
improvement, information is also very useful for on-farm decision-support. Routinely
recording of fertility data allows the presentation of key figures for veterinary herd
management.
Optimized herd management is important for financially successful farming
Results of recording can be presented per individual animal or about cohorts and distinguish
between retrospective "outputs" such as calving index and "inputs" such as number of
services, results of pregnancy diagnosis in order to analyze overall performance (Breen et al.,
2009).
However, for short term decisions (e.g. whether to continue to inseminate or not) on-farm recording of
fertility is probably the only practical solution. More sophisticated decision support may include
correction of the observed level for systematic environmental effects (such as parity or stage in
lactation) and time analysis. Fertility reports summarizing the fertility performance of age-groups
within the dairy herd also allows farmers to benchmark their farm to others.
Timely availability of fertility information is valuable and supplements routine performance recording
for optimized fertility management of the herd. Therefore, fertility data statistics should be added to
existing farm reports provided by milk recording organizations. Examples from Austria are found in
the Austrian Ministry of Health (2010).
Immediate reactions
It is important that farmers and veterinarians have quick and easy access to herd fertility data. Only
then can acute fertility problems, which may be related to management, be detected and addressed
promptly. An Internet-based tool may be very helpful for timely recording and access to data. Lists of
actions with animals ready to be inseminated or pregnancy tested are helpful.
Long term adjustments
Less-detailed reports summarizing data over longer time periods (e.g., one year) may be compiled to
provide an overview of the general fertility status of the herd. Such summary reports will facilitate
monitoring of developments within farm over time, as well as comparisons among farms on district
and/or province level (Breen et al., 2009; Austrian Ministry of Health, 2010). Publication of key
figures on female fertility at herd level will provide decision support at the tactical level. A general
recommendation is to present recent averages (last year), but also to present trend over several years.
If available, it is advised to include a comparison of the averages with a mean of a larger group of
(similar) farms. For example, the average days open might be compared with the average days open
for all farms in the same region or with the same milk production level.
Farm averages might also be specified for different groups of animals at the farm. For
example, days open might be presented as an average for first lactation cows versus later
parity animals. This denotes which groups require specific attention in the preventive
management.

Definitions of benchmarks are valuable, and for improvement of the general fertility status it
is important to place target oriented measures.
Government bodies and other organizations involved in animal health issues are very
interested in monitoring the health status of the cattle population. Consumers also are
increasingly concerned about aspects of food safety and animal welfare. Regardless of which
sources of health information are used, national monitoring programs may be developed to
meet the demands of authorities, consumers and producers. The latter may particularly
benefit from increased consumer confidence in safe and responsible food production.
Fertility data is also important for providing genetic evaluations, both within country and between
countries. The following section is from the Interbull website
(http://www.interbull.org/ib/idea_trait_codes) and are the traits that the Interbull Steering committee
chose in August 2007 to become part of MACE evaluations of fertility. Interbull considers female
fertility traits classified as follows:
a. T1 (HC): Maiden (H)eifer's ability to (C)onceive. A measure of confirmed conception, such as
conception rate (CR), will be considered for this trait group. In the absence of confirmed
conception an alternative measure, such as interval first-last insemination (FL), interval first
insemination-conception (FC), number of inseminations (NI), or non-return rate
(NR,preferably NR56) can be submitted.
b. T2 (CR): Lactating (C)ow's ability to (R)ecycle after calving. The interval calving-first
insemination (CF) is an example for this ability. In the abscence of such a trait, a measure of
the interval calving-conception, such as says oprn (DO) or calving interval (CI) can be
submitted.
c. T3 (C1): Lactating (C)ow's ability to conceive (1), expressed as a rate trait. Traits like
conception rate (CR) and non-return rate (NR, preferably NR56) will be considered for this
trait group.
d. T4 (C2): Lactating (C)ow's ability to conceive (2), expressed as an interval trait. The interval
first insemination-conception (FC) or interval first-last insemination (FL) will be considered
for this trait group. As an alternative, number of inseminations (NI) can be submitted. In the
abscence of any of these traits, a measure of interval calving-conception such as days open
(DO), or calving interval (CI) can be submitted. All countries are expected to submit data for
this trait group, and as a last resort the trait submitted under T3 can be submitted for T4 as
well.
e. T5 (IT): Lactating cow's measurements of (I)nterval (T)raits calving-conception, such as days
open (DO) and calving interval (CI).
Based on the above trait definitions the following traits have been submitted for international
genetic evaluation of female fertility traits.
1. Andersen-Ranberg, I.M, Heringstad, B.,Klemetsdal, G., Svendsen, M. & Steine, T., 2003.
Heifer fertility in Norwegian dairy cattle: Variance components and genetic change. J. Dairy
Sci. 86, 2706-2714.

2. Austrian Ministry of Health, 2010. Kundmachung des TGD-Programms
Gesundheitsmonitoring Rind.
http://bmg.gv.at/home/Schwerpunkte/Tiergesundheit/Rechtsvorschriften/Kundmachungen/
Kundmachung_des_TGD_Programms_Gesundheitsmonitoring_Rind.
3. Bastin, C., Soyeurt, H., Vanderick, S. & Gengler, N., 2011. Genetic relationships between milk
fatty acids and fertility of dairy cows. Interbull Bulletin 44, 190-194.
4. Breen, J.E., Hudson, C.D., Bradley, A.J. & Green, M.J., 2009. Monitoring dairy herd fertility
performance in the modern production animal practice. British Cattle Veterinary Association
(BCVA) Congress, Southport, November 2009.
5. Fuerst, C. & Egger-Danner, C.,2002. Joint genetic evaluation for fertility in Austria and
Germany. Interbull Bulletin 29, 73-76.
6. Fuerst, C. & Gredler, B.,2010. Genetic Evaluation of Fertility Traits. Interbull Bulletin 40, 3-9.
www.interbull.slu.se/bulletins/bulletin40/Fuerst-Gredler.pdf.
7. González-Recio, O. & Alenda, R., 2005.Genetic parameters for female fertility traits and a
fertility index in Spanish dairy cattle. J. Dairy Sci. 88, 3282-3289.
8. González-Recio, O., Alenda, R., Chang, Y.M., Weigel, K.A. & Gianola, D., 2006. Selection for
Female Fertility Using Censored Fertility Traits and Investigations of the Relationship with
Milk Production. J Dairy Sci. 2006 Nov;89(11):4438-4444.
9. Gredler, B. Fuerst, C. & Soelkner, H., 2007. Analysis of New Fertility Traits for the Joint
Genetic Evaluation in Austria and Germany. Interbull Bulletin 37, 152-155.
10. Harris, B.L., Pryce, J.E. & Montgomerie, W.A., 2007. Experiences from breeding for economic
efficiency in dairy cattle in New Zealand Proc. Assoc. Advmt. Anim. Breed. Genet. 17:434.
11. Heringstad, B., Andersen-Ranberg, I.M., Chang, Y.M. & Gianola, D., 2006. Genetic analysis of
nonreturn rate and mastitis in first-lactation Norwegian Red cows. J. Dairy Sci. 89, 4420-4423.
12. ICAR (International Committee for Animal Recording), 2012. International agreement of
recording practices. Available online at http://www.icar.org/index.php/about-us-icar-
facts/statutes-and-by-laws / (assessed July 207).
13. Jorjani, H., 2006. International genetic evaluation for female fertility traits. Interbull Bulletin
34, 57-64.
14. Koeck, A., Egger-Danner, C., Fuerst, C., Obritzhauser, W. & Fuerst-Waltl, B., 2010. Genetic
analysis of reproductive disorders and their relationship of fertilty and milk yield in Austrian
Fleckvieh dual-purpose cows. J. Dairy Sci. 93, 2188-2194.
15. Pryce, J.E. & Veerkamp R.F., 1999. The incorporation of fertility indices in genetic
improvement programmes. Br. Soc. Anim;Vol 1:Occasional Mtg. Pub. 26.
16. Roxström, A., Strandberg, E., Berglund, B., Emanuelson, U. & Philipsson, J., 2001. Genetic
and environmental correlations among female fertility traits and milk production in different
parities of Swedish Red and White dairy cattle. Acta Agric. Scand., Sect. A., Animal Science 51,
192-199.
17. Schnyder, U. & Stricker, C., 2002. Genetic evaluation for female fertility in Switzerland.
Interbull Bulletin 29, 138-141.
18. Sun, C., Madsen, P., Lund M.S., Zhang Y, Nielsen U.S. & Su S., 2010. Improvement in genetic
evaluation of female fertility in dairy cattle using multiple-trait models including milk
production traits. J. Anim. Sci. 88:871-878.
19. Thaller, G., 1998. Genetics and breeding for fertility. Interbull Bulletin 18, 55-61.
20. VanRaden, P., 2013. Genetic evaluations for fitness and fertility in the United States and other
nations. http://aipl.arsusda.gov/publish/other/2003/raleigh03_pvr.pdf.
21. Veerkamp, R. F., Koenen, E. P. C. & De Jong, G. 2001. Genetic correlations among body
condition score, yield, and fertility in first-parity cows estimated by random regression models.
J. Dairy Sci. 84, 2327-2335.
This document is the result of the work of the ICAR Functional Traits Working Group. The
members of this working group are, in alphabetical order:
a. Lucy Andrews, Holstein UK, Scotsbridge House Rickmansworth, Herts, WD3 3BB United
Kingdom.
b. Andrew John Bradley, Quality Milk Management Services, United Kingdom.
c. John B. Cole, Animal Improvement Programs Laboratory, USA.
d. Christa Egger-Danner, ZuchtData EDV-Dienstleistungen GmbH, Austria; (Chairperson of the
ICAR Functional Traits Working Group since 2011)
e. Nicolas Gengler, Gembloux Agro-Bio Tech, University of Liège, Belgium.
f. Bjorg Heringstad, Department of Animal and Aquacultural Sciences / Geno , Norwegian
University of Life Sciences, Norway.
g. Jennie Pryce, Victorian Department of Environment and Primary Industries, Victoria,
Australia
h. Katharina Stock, VIT, Germany.
i. Erling Strandberg, Swedish University of Agricultural Science, Uppsala, Sweden.
The working group acknowledges the valuable contributions and support in improving this
document of Brian Wickham (ICAR) and Pavel Bucek (Czech-Moravian Breeders'
Corporation), Stephanie Minery (Idele, France), Pascal Salvetti (UNCEIA), Oscar Gonzalez-
Recio and Mekonnen Haile-Mariam (DEPI, Melbourne, Australia) and John Morton (Jemora,
Geelong, Australia).

These guidelines are written in a schematic way. Enumeration is bulleted and important information is
shown in text boxes. Important words are printed bold in the text.
The aim of these guidelines is to provide dairy cattle breeders involved in breeding programmes with a
stepwise decision-support procedure establishing good practices in recording and evaluation of udder
health (and correlated traits). These guidelines are prepared such that they can be useful both when a
first start to the breeding programme is to be made, or when an existing breeding programme is to be
updated. In addition, these guidelines supply basic information for breeders not familiar
(inexperienced or ‘lay-persons’) with (biological and genetic) backgrounds of udder health and
correlated traits.
Stepwise decision-support in developing a recording and evaluation system for udder health,
to support a genetic improvement scheme in dairy cattle.
These guidelines are divided in four parts:
a. General introduction including a summary of the main principles.
b. Background information on udder health and correlated traits.
c. Stepwise decision-support for recording udder health and correlated traits.
d. Stepwise decision-support for genetic evaluation of udder health and correlated traits.
The experienced animal breeder using these guidelines should read chapter 1 and is advised to read
the text boxes of section 3.4 below. The inexperienced user is advised to read the full text of section 3.4
below.
A healthy udder can be best defined as an udder that is ‘free from mastitis’. Mastitis is an
inflammatory response, generally presumed to be caused by a bacterium.
Mastitis is generally considered as the most costly disease in dairy cattle because of its high
incidence and its physiological effects on e.g. milk production. In many countries breeding for a better
production in dairy cattle has been practised for years already. This selection for highly productive
dairy cows has been successful. However, together with a production increase, generally udder health
has become worse. Production traits are unfavourably correlated with subclinical and clinical mastitis
incidence.
A healthy udder is an udder free from inflammatory responses to microorganisms.

A decreased udder health is an unfavourable phenomenon, because of several costs of mastitis like e.g.
veterinary treatment, loss in milk production and untimely involuntary culling. Mastitis also implies
impaired animal welfare.
There is little hope that mastitis will be eradicated or an effective vaccine developed. The disease is
much too complex. However, reducing the incidence of this disease is possible. An important
component in reducing the incidence of mastitis is breeding for a better resistance. Dairy cattle
breeding should properly balanced selection emphasis on production traits (milk and beef) and
functional traits (such as fertility, workability, health, longevity, feed efficiency). This requires good
practices for recording and evaluation of all traits - see table for an overview. These guidelines support
establishing good practices for recording and evaluation of udder health. Decision-support for other
trait groups will be subject of other guidelines developed by the ICAR working group on Functional
Traits.
Operational situation breeding value prediction to be aimed for in dairy cattle genetic improvement
schemes (source Proceedings International Workshop on Genetic Improvement of Functional Traits in
cattle (GIFT) - breeding goals and selection schemes (7-9 November 1999, Wageningen, Interbull
bulletin no. 23, page 221.)
It is important to reduce the incidence of mastitis, because of production
efficiency and animal welfare
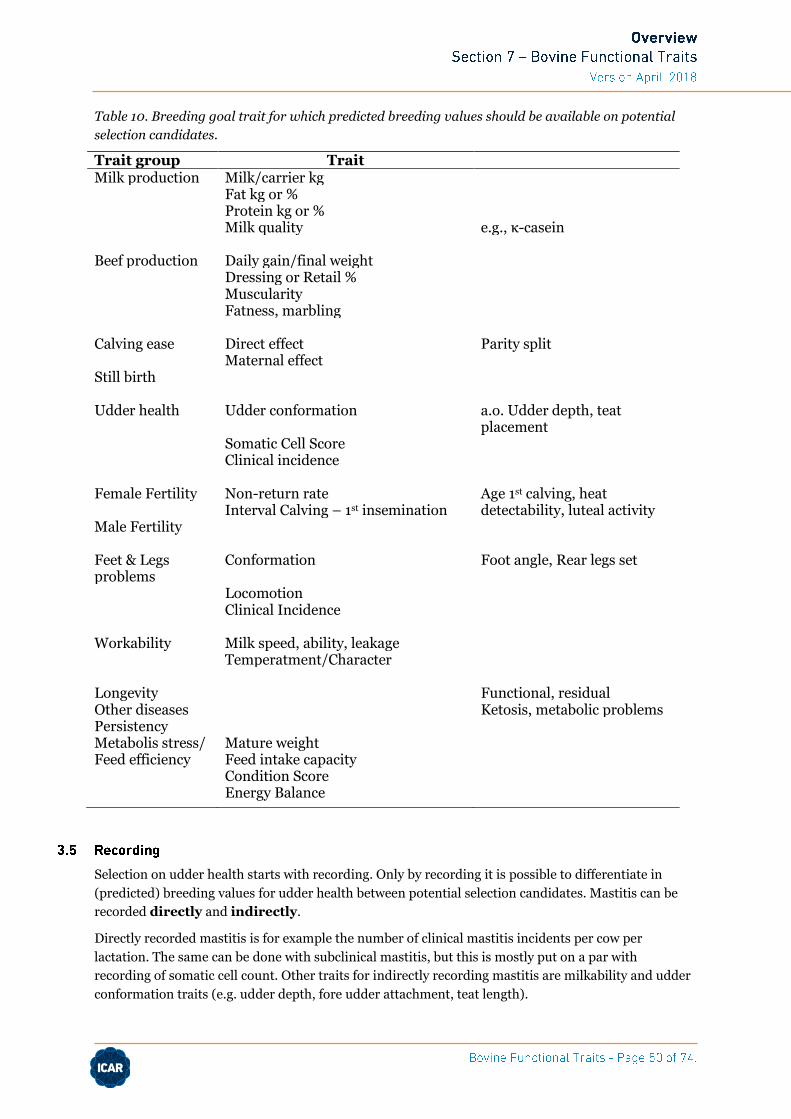
Table 10. Breeding goal trait for which predicted breeding values should be available on potential
selection candidates.
Trait group Trait Milk production Milk/carrier kg Fat kg or % Protein kg or % Milk quality e.g., κ-casein Beef production Daily gain/final weight Dressing or Retail % Muscularity Fatness, marbling Calving ease Direct effect Parity split Maternal effect Still birth Udder health Udder conformation a.o. Udder depth, teat
placement Somatic Cell Score Clinical incidence Female Fertility Non-return rate Age 1st calving, heat
detectability, luteal activity Interval Calving – 1st insemination Male Fertility Feet & Legs problems
Conformation Foot angle, Rear legs set
Locomotion Clinical Incidence Workability Milk speed, ability, leakage Temperatment/Character Longevity Functional, residual Other diseases Ketosis, metabolic problems Persistency Metabolis stress/ Feed efficiency
Mature weight Feed intake capacity Condition Score Energy Balance
Selection on udder health starts with recording. Only by recording it is possible to differentiate in
(predicted) breeding values for udder health between potential selection candidates. Mastitis can be
recorded directly and indirectly.
Directly recorded mastitis is for example the number of clinical mastitis incidents per cow per
lactation. The same can be done with subclinical mastitis, but this is mostly put on a par with
recording of somatic cell count. Other traits for indirectly recording mastitis are milkability and udder
conformation traits (e.g. udder depth, fore udder attachment, teat length).

Table 11. Recording udder health.
Direct Indirect Clinical mastitis incidents Somatic cell count
Milkability Udder conformation traits
Subclinical mastitis incidents
Clinical mastitis is an outer visual or perceptible sign of an inflammatory response of the udder:
painful, red, swollen udder. The inflammatory response can also be recognised by abnormal milk, or a
general illness of the cow, with fever. Sub-clinical mastitis is also an inflammatory response of the
udder, but without outer visual or perceptible signs of the udder. An incident of sub-clinical mastitis is
detectable with indicators like conductivity of the milk, NAG-ase, cytokines and somatic cell count in
the milk.
Recording and evaluation of udder health requires measuring direct and indirect traits, but also basic
information is necessary. With an existing breeding programme to be updated with udder health, this
prerequisite information is generally available, which might not be the case when starting with a new
breeding programme.
a. Unique animal identification and registration.
b. Unique herd identification and registration.
c. Individual animal pedigree information.
d. Birth registration.
e. A well functioning central database.
f. Milk recording system (time information and logistics of sampling milk samples).
The recorded data from different farms should be combined to serve as a basis for a genetic evaluation
of potential selection candidates in the genetic improvement scheme (per region, country or
internationally). A genetic evaluation requires data to be recorded in a uniform manner. There should
be ample data for reliable breeding value estimation. The quality of genetic improvement depends on
the quality of these estimated breeding values.
On the basis of the estimated breeding values, selection candidates will be ranked. Estimated breeding
values will be available per (recorded) trait, or as a combined ‘udder health index’. Such an udder
health index will be a weighted summation of estimated breeding values for recorded (direct and
indirect) traits. A ranking of selection candidates on an udder health index facilitates a selection on
those animals that contribute mostly to improve udder health, i.e., reduced mastitis incidence.
Together with indexes for other important trait groups, the udder health index can be combined
towards a broader, general merit or performance index used for overall ranking of selection candidates.
The table below (Table 12) shows the top 10 of bulls marketed world-wide with the highest estimated
breeding value (EBV) for udder health (May 2002). This is on the basis of the calculations of the
national Dutch organization for cattle breeding (NVO). The formula below shows the calculation of the
breeding values for udder health:

Equation 4. Example of calculation of the breeding values for udder health.
EBVUH
= -6.603 x EBVSCC
- 0.193 x (EBVms
- 100) + 0.173 x (EBVud
- 100)+ 0.065 x (EBVfua
-
100) – 0.108 x (EBVtl -100) +100
where EBVUH : EBV for udder health, EBV
SCC : EBV for somatic cell count at 2log-scale;
EBVms : EBV for milking speed; EBV
ud : EBV for udder depth: EBV for fore udder attachment;
EBVtl : EBV for teat length
The Durable Performance Sum (DPS) is the Dutch basis for the overall ranking of bulls. The
components of the DPS are production, health and durability. The Total Score is the total score of the
conformation of the bulls. The components for this trait are type, udder conformation and feet & legs.
Table 12. Top ten bulls ranked for udder health (May 2002).
Name bull Durable Performance
Sum Total Score
Conformation Udder health
index Suntor magic 52 107 115 Carol prelude mtoto et 217 112 111 Wranada king arthur 97 109 111 Caernarvon thor judson-et 87 107 111 Mar-gar choice salem-et *tl 65 108 111 Prater 51 112 111 Ramos 192 108 110 Ds-kirbyville morgan-et 165 108 110 Whittail valley zest et 158 104 110 V centa 129 112 110

Estimated breeding values for Swedish bulls for production, health and other functional Traits, sorted on mastitis (February 2002).
Name bull Total Merit Index Production
index Milk (kg) Production traits
Protein (kg) Fat (kg) Daily gain G Ross 14 107 103 106 106 97 Botans 18 119 113 119 115 92 Stöpafors 12 108 105 108 106 98 Inlag-ET 13 106 106 106 109 96 Torpane 11 101 100 100 109 106 Flaka 21 111 112 111 114 111 Bredåker 14 106 100 105 113 104 Brattbacka 14 108 95 107 109 97 Stensjö-ET 20 118 115 117 123 105
Health traits
Dau. fert. Calvings
Mast. Resist. Other
diseases Longevity Name bull S MGS 96 108 96 110 97 106 97 104 97 108 100 104 G Ross 95 89 98 106 100 111 Botans 105 106 108 104 103 106 Stöpafors 105 97 105 104 103 119 Inlag-ET 107 115 110 104 99 115 Torpane 108 96 107 103 103 Flaka 104 106 102 103 108 112 Bredåker 100 106 103 102 98 107

Functional traits Name bull Stature Legs Udder Milk speed Tempr 102 111 105 89 105 97 96 101 102 102 G Ross 108 101 107 105 101 Botans 96 103 103 107 98 Stöpafors 103 97 105 108 96 Inlag-ET 100 101 97 92 98 Torpane 104 103 104 105 96 Flaka 97 99 104 92 96 Bredåker 94 94 100 110 107

This chapter (3.9) gives background information on udder health and correlated traits. It is about
direct (clinical mastitis) and indirect traits (somatic cell count, milkability and udder conformation
traits). For the experienced reader reading only the bold printed words and text boxes should be
sufficient.
The first line of defence against an infection of microorganisms is the mechanical prevention of the
mammary gland. This mechanical prevention is opposite to the ease of microorganisms to enter the
teat canal: the easier the entrance, the weaker the mechanical prevention. The quality of this defence is
related to the milkability and the udder conformation traits, like e.g. teat length and udder depth.
However, when microorganisms enter the mammary gland, then the immune system causes an
attraction of leukocytes to the place of infection, which results in an enlarged somatic cell count. So,
a short term increase in somatic cell count with or without accompanying clinical signs are on one
hand a symptom of a failing first line of defence, but on the other hand indicating an appropriate
immunological reaction. The picture below (Figure 2) shows the infection process, together with the
destruction of a milk-secreting cell.
Figure 2. Infection process.
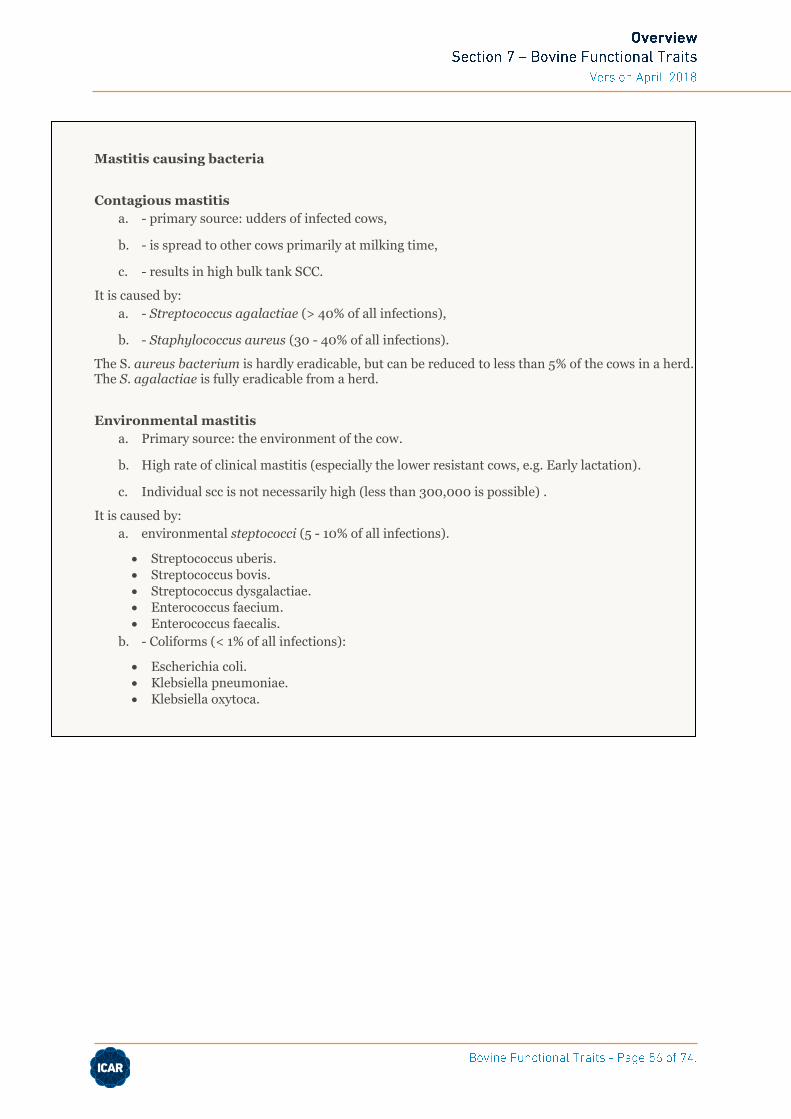
Mastitis causing bacteria
Contagious mastitis
a. - primary source: udders of infected cows,
b. - is spread to other cows primarily at milking time,
c. - results in high bulk tank SCC.
It is caused by:
a. - Streptococcus agalactiae (> 40% of all infections),
b. - Staphylococcus aureus (30 - 40% of all infections).
The S. aureus bacterium is hardly eradicable, but can be reduced to less than 5% of the cows in a herd. The S. agalactiae is fully eradicable from a herd.
Environmental mastitis
a. Primary source: the environment of the cow.
b. High rate of clinical mastitis (especially the lower resistant cows, e.g. Early lactation).
c. Individual scc is not necessarily high (less than 300,000 is possible) .
It is caused by:
a. environmental steptococci (5 - 10% of all infections).
Streptococcus uberis.
Streptococcus bovis.
Streptococcus dysgalactiae.
Enterococcus faecium.
Enterococcus faecalis.
b. - Coliforms (< 1% of all infections):
Escherichia coli.
Klebsiella pneumoniae.
Klebsiella oxytoca.

Mastitis can be subdivided in clinical and subclinical mastitis. Clinical mastitis is mastitis with outer
visual or perceptible signs of the udder or the milk. Clinical mastitis is observed as abnormal milk, like
flaky, clotted and / or “watery” milk. Possible perceptible signs on the udder are redness, painfulness
and swollenness with fever.
Subclinical mastitis is not perceptible directly by a farmer or veterinarian, but is detectable with
indicators. The most used indicator is the number of somatic cells per ml milk (somatic cell count).
Other, less practised physiological indicators of subclinical mastitis are electrical conductivity of the
milk, N-acetyl-ß-D-glucosaminidase, bovine serum albumin, antitrypsin, sodium, potassium and
lactose content.
Somatic cell count (x 1000)
Days in
trial Daily somatic cell count with a clinical mastitis event at day 28 (Source: Schepers, 1996)
Figure 3. Daily somatic cell count with a clinical mastitis event at day 28 (Source: Schepers, 1996).
The somatic cell count is the most widely accepted criterion for indicating the udder health status of a
dairy herd. An enlarged number of somatic cells in milk, which is unfavourable, points to a defence
reaction.
Somatic cells in milk are primarily leukocytes or white blood cells along with sloughed epithelial or
milk secreting cells. White blood cells are present in milk in response to tissue damage and/or
clinical and subclinical mastitis infections. These cell numbers increase in milk as the cow’s immune
system works to repair damaged tissues and combat mastitis-causing organisms. As the degree of
damage or the severity of infections increase, so does the level of white blood cells. Epithelial cells
are always present in milk at low levels. They are there as a result of a natural process inside the udder
whereby new cells automatically replace old tissue cells. Epithelial cells result in normal milk SCC
levels of <50,000.
The recommended industry standard for bulk SCC on delivery is one that is consistently <200,000.
Many herds, which are successful in maintaining a herd SCC <100,000, have minimal to no mastitis
infections.

So, somatic cells are partly white blood cells or body defence cells whose primary functions are to
eliminate infections and repair tissue damage. Somatic cell levels or numbers in the mammary gland
do not reflect the whole pool of cells that can be recruited from the blood to fight infections. Somatic
cells are sent in high numbers only when and where they are needed. Therefore, high SCC indicates
mammary infection. A certain number of cells is necessary once an infection invades the udder.
Together with a favourite low SCC, the speed of cell recruitment to the mammary gland and the
cell competency are the major factors in infection prevention.
Recording clinical mastitis is possible but not common practice (yet). Scandinavian countries are the
only countries that include mastitis incidence directly in their national recording and evaluation
programs. However, other countries are working on a national recording and evaluation scheme for
mastitis incidence as well. Reasons for increased interest in recording clinical mastitis are in
a. Veterinary farm management support (i.e., identification of diseased animals and establishing
treatment procedure).
b. National veterinary policy-making (i.e., drugs regulations and preventive epidemiological
measures).
c. Citizens’ and consumers’ concerns about animal health and welfare and product quality and
safety (i.e., chain management, product labelling).
d. Genetic improvement (i.e., monitoring genetic level of the population and selection and
mating strategies).
It is to be emphasised that recording of clinical mastitis is difficult, as it requires a clear definition (as
given in these guidelines), an accurate administration with for example dates of incidence and
(unique) cow numbers. It is also important that the reasons for recording are made clear to
stakeholders and that information is not only gathered centrally, but also processed to obtain clear
information for farm management support to be reported back to the farmer.
The (phenotypic) occurrence of clinical or subclinical mastitis is influenced by the genetic merit of the
animal (its breeding value) and by environmental effects. When considering the total phenotypic
variance between animals, for clinical mastitis about 2-5 % is because of genetic differences between
the animals. The remaining differences between animals are because of different environmental
influences and measuring errors. Known systematic environmental influences are for example in
parity of the cow or stage in lactation. An evaluation of udder health traits will have to carefully
consider these systematic environmental influences.
On-farm management decision-support
Although these quidelines focus on evaluation of udder health for
genetic improvement, information is also very useful for on-farm
The somatic cell count is the number of somatic cells per millilitre of milk.
Normal milk has less than 200,000 cells per millilitre.
decision-support. Routinely recording of clinical incidents and somatic
cell count allows the presentation of key figures for veterinary herd
management.
Operational - individual animal level
Results of recording can be presented per individual animal. To
support decision making, a note can accompany the presentation of the
recording level when the level is above a certain threshold. For
example, a SCC above 200,000 indicates that the cow may suffer from
subclinical mastitis and requires treatment or it is advised to perform a
bacteriological culturing. An additional listing might provide a direct
overview of cows with attention levels for which further action is
advised.
More sophisticated decision support may include correction of the
observed level for systematic environmental effects (such as parity or
stage in lactation) and time analysis.
Mastitis caused by different bacteria requires different preventive and
curative measurements to be taken. Therefore, information from
bacteriological culturing is generally very important in operational
farm management.
Tactical - herd level
Publication of key figures on mastitis incidence, bacteriological
culturing and SCC at herd level will provide decision support at the
tactical term. A general recommendation is to present recent averages,
but also to present the course of the averages over a longer time period.
If available, it is advised to include a comparison of the averages with a
mean of a larger group of (similar) farms. For example, the average on
SCC might be compared with the average bulk somatic cell count for all
farms delivering milk to the same factory.
Farm averages might also be specified for different groups of animals
at the farm. For example, SCC might be presented as an average for
first lactation females versus later parity animals. This denotes which
groups require specific attention in the preventive and curative
management.
In Norway, Finland and Denmark each individual cow has a health card, which is updated each time
the veterinarian treats the animal. For example in Norway is a strict regulation of drugs such that all
antibiotic treatments are carried out by the veterinary, and the farmer is not allowed treating his own
animals. Completeness and consistency requires a very accurate administration; a condition in order
to let a health card system be useful for breeding programs.
In the Netherlands, it is now included in the ‘chain control on quality of milk’ that the farm is regularly
visited by a veterinarian to record health status of the cows. This gives a ‘test-day’ comparison of all
cows in the herd. This information can possibly be used for national veterinarian monitoring
programmes and for selection programmes.
In many countries a reliable recording of clinical mastitis incidents is hard to achieve, which makes
this trait not the first step in developing an udder health index. Somatic cell count (SCC) is genetically
highly correlated with clinical mastitis: 0.60-0.70. This means, that when analysing field data, an
observed high level of SCC is generally accompanied by a clinical mastitis event. In other words,
although milk of healthy cows also shows variance in SCC, in day-to-day field data, most of the
variance in SCC is caused by clinical mastitis events.
Given its high correlation to clinical mastitis, SCC is an appropriate indicator of udder health, as
a. Somatic cell counts can be routinely recorded in most milk recording systems, giving better
opportunities of accurate, complete and standardised observations.
b. About 10-15% of the observed variation in scc is caused by differences in breeding values of the
animals, which is higher than in clinical mastitis.
c. It also reflects incidence of subclinical intramammary infections.
Bulk somatic cell count
Sofar, we have considered SCC on animal level. In farm management also the
average bulk somatic cell count (BSCC) is of interest. In many countries the
BSCC is a basis for milk price payment by the dairy industry. The BSCC can also
play a role in decision-support.
High BSCC herds mainly deal with high levels of contagious, invasive
organisms, which are mostly subclinical. Many cows are infected and
substantial udder damage and milk losses are caused. When these infections
become clinical, they are usually mild. Environmental infections are rarely seen
because they are opportunists and can not compete with the highly invasive
organisms. Low SCC herds have low levels of contagious, invasive pathogens.
Thus, when they do have infections, they are usually environmental.
Environmental infections are very vivid, with a severe illness and a possible
death as a result. Environmental infections are not invasive, but opportunistic,
thus most animals who get these are usually suppressed or heavily stressed, e.g.
early lactation animals. A good management from the farmer can reduce the
number of environmental infections.

The upper 95% confidence limit for somatic cell counts in uninfected cows, in three different
parities, in dependence on days in milk (Source: Schepers et al., 1997).
Figure 4. The upper 95% confidence limit for somatic cell counts in uninfected cows, in three different
parities, in dependance on days in milk (Source: schepers et al., 1997).
Days after calving
Mastitis incidence (%)
Frequency distribution of clinical mastitis incidents according to lactation stage (Source: Schepers,
1996)
Figure 5. Frequency distribution of clinical mastitis incidents according to lactation stage (Source:
Schepers, 1986).

Percentage of cows in different SCC-classes (x 1000; year 2000 calvings, Australia) per
lactation (Source Hiemstra, 2001).
0.0
10.0
20.0
30.0
40.0
50.0
60.0
70.0
80.0
90.0
100.0
1 2 3 4 5 6 7 8 9 10
Lactation number
Percentage
% <200 % 201-300 % 301-500 % 501-600 % >600
Figure 6. Percentage of cows of different SCC-classes (x 1.000; year 2.000 calvings, Australia) per
lactation (Source: Hiemstra, 2001).
The importance of reducing clinical mastitis seems clear (high costs and impaired welfare), the
importance of reducing subclinical mastitis might seem less obvious. However, there are several
reasons for reducing the amount of subclinical mastitis (an increased number of somatic cells in milk
(SCC)) in dairy cattle, like:
a. Daughters of sires that transmit the lowest somatic cell score (log-transformation of somatic
cell count) have lower incidence of clinical mastitis and fewer clinical episodes during first and
second lactation.
b. Decreased somatic cell count (SCC) has been shown to improve dairy product quality, shelf life
and cheese yield. Increased SCC decreases cheese yield in two ways:
By decreasing the amount of casein as a percentage of total protein in milk.
By decreasing the efficiency of conversion of casein into cheese.
c. High SCC in milk affects the price of milk in many payment systems that are based on milk
quality.
d. High SCC milk has a reduced flavour score because of an increase in salts.
a. Clinical mastitis: low incidence and few episodes.
b. Improved dairy product quality.
c. Higher milk prices.
Part of the somatic cells is white blood cells - they are an essential part of the cow's immune system.
Trying to lower the incidence of cases with highly increased somatic cell count (as an indicator that a

defense reaction was necessary) is advised. Trying to lower somatic cell count below natural levels in
milk of healthy cows is not advised. An essential part of the natural defense system is also the speed of
white blood cells recruitment.
There is an unfavourable genetic correlation between milkability (milking speed, milking ease or milk
flow) and somatic cell count. Faster milking cows tend to have a higher lactation somatic cell count. In
general, an unfavourable genetic correlation between milkability (i.e., milking speed) and udder health
is assumed. This is explained by a possibly easier mechanical entry of pathogens into the udder
associated with an easier exit of milk out of the udder ant teat canal.
However, some remarks are to be made with respect to this correlation between milkability and udder
health.
Non-linearity
The genetic correlation is assumed to be non-linear. This means that at low and mediate levels of
milking speed there is no influence on udder health. Only with extremely high milking speed, also
observed as leakage of milk before milking time, the teat canal is too wide facilitating easy entrance of
microorganisms.
Figure: A generalised representation of the milk flow curve (source: Dodenhoff et al., 2000).
Figure 7. A generalised representation of the milk low curve (Source: Dodenhoff et al., 2000).
Complete draining with milking.
With each milking, the last fraction of milk contains 3 to 10 times more cells than the first fraction.
This however depends on the completeness of withdrawing milk from the udder, which itself is again
related to milking speed. A higher milking speed, facilitates a more complete draining of the udder

causing a higher SCC. This supports the suggestion that milking speed is unfavourably correlated with
SCC but not with clinical mastitis.
Another important point is that milking speed is associated with the farmer’s labour time for
milking. Increased milking speed per cow implies decreased costs for electrical power and decreased
wear on milking equipment. Combining the two main aspects
a. Reducing milking speed, or more specifically leakage as wanted because of udder health.
b. Increasing milking speed because of reducing labour time
makes that milking speed is a trait with an intermediate, optimum level.
Recording of milking speed can be practised with advanced equipment. This advanced equipment can
be:
a. An additional equipment to be installed at regular intervals or at specific recording herds as
part of a (national) recording programme for milking speed, or
b. An integral part of the milking system at the farm, together with for example recording of milk
conductivity, giving an integral, operational decision-support for the farmer in detecting cows
with udder health problems.
An overall subjective scoring of milking speed can also be practised. The farmer can make a linear
scoring of 1 very slow to 5 very fast (see also Section 5 of the ICAR Guidelines).
Linear udder conformation is part of the recommended conformation recording in dairy cattle as
approved by the World Holstein Friesian Federation (WHFF) and ICAR (see Section 5 of the ICAR
Guidelines). Approved standard traits are:
Fore udder attachment Rear udder height
Median suspensory ligament Udder depth
Teat placement Teat length
A full description of these traits is given in 3.10.6 below. The reason for approval of this set of traits is
based on the fact that each of these traits can have a predictive value for udder health, or the trait
influences workability (and thus milking time). We therefore also recommend recording of udder
conformation according to the ICAR/WHFF-recommendations.
Based on literature studies some indicative relative importance of the traits can be given. The udder
conformation trait with the largest influence on udder health is the udder depth. Shallow udders
appear to be obviously healthier than deep udders. A reason why shallow udders are healthier may be
that deep udders have an increased exposure to pathogenic bacteria and are more likely to be injured.
Fore udder attachment also has an important influence on the udder health together with teat length.
Probably again the main aspect here is that improved udder conformation (better attachment and
shorter teats) decreases exposure to pathogens.
Again, also other traits are of importance, but the genetic relationship with udder health may be lower,
and different traits may provide similar genetic information. This generally causes udder health
indexes to be based on a limited number of udder conformation traits only.

Example age effect on udder conformation
Table 13. The influence of age on udder conformation in Holstein Friesian and Jersey (Source:
Oldenbroek et al., 1993).
Lactaction number
Breed Trait (cm) 1 2 3
Holstein Distance rear
udder-floor
60.5 55.6 51.8
Distance between
front teath
18.1 20.2 21.6
Jersey Distance rear
udder-floor
51.2 47.5 44.8
Distance between
front teath
14.2 14.9 15.5
Udder conformation changes over lifetime of the animal. Moreover, selection of cows favours (directly
or indirectly) survival of cows with better udder conformation. This implies, that either observations
are to be adjusted for age effects, or observations used for genetic evaluation are to be taken from a
specified age only. In general, (inter)national evaluations are based on observations during first
lactation only.
The most complete udder health index includes direct and indirect udder health traits. An example of
a direct trait is the inclusion of clinical mastitis in the index as happens in the Scandinavian countries.
In some other countries, like The Netherlands, Canada and the United States, only indirect traits are
used in the udder health index. These indirect traits can be subdivided in three main groups: somatic
cell count, milkability and udder conformation traits.
a. Recording clinical mastitis directly by a farmer or veterinarian: outer visual signs on the udder
or the milk.
b. Recording subclinical mastitis: not visual directly, but only perceptible by indicators. The most
frequently used indicator is the number of somatic cells in milk (SCC), which can be routinely
recorded parallel to milk recording.

Good recording practices udder health index
Direct Indirect
Clinical Subclinical SCC Udder
Milkability
conformation
1 2 3 4
Figure 8. Good recording practices udder health index.
c. Recording udder conformation. There are several udder conformation traits with an influence
on udder health. The most important one by far is udder depth, followed by fore udder
attachment and teat length.
d. Recording milkability (i.e., milking speed) by actual measurement or (linear) appraisal by the
farmer. Milkability is an optimum trait: high milking speed is favourable as it reduces labour
time for milking, but it increases leakage of milk and thus bacterial invasion of the teat canal.
This chapter gives a stepwise description of the possibilities to record udder health and correlated
indicator traits. The starting-point is a situation in which not many efforts have been done yet, to
improve udder health. In each step, a description is given on “What ?” to record, by “Who ?” this is
done, and “When ? “.
Each animal’s ID should be unique to that animal, given to the animal at birth, never be used
again for any other animal, and be used throughout the life of the animal in the country of
birth and also by all other countries. The following information contained in Table 14 should
be provided for each animal. For further details please refer to INTERBULL bulletin no. 28
(2001) direct link here:https://journal.interbull.org/index.php/ib/article/view/371/371.
Table 14. Interbull recommended identification.
Breed code Character 3
Country of birth code Character 3
Sex code Character 1
Animal code Character 12
Birth date and sire and dam IDs should be recorded for all animals. Genetic evaluation
centers should, in cooperation with other interested parties, keep track and report percentage
of animals with missing ID and pedigree information. The overall quantitative measure of
data quality should include percentage of sire and dam identified animals or alternatively
percentage of missing ID's. Measures should be adopted to reduce the percentage of non-

parent identified animals and missing birth information to very low numbers and ideally to
zero. Examples of such measures are supervision of natural matings and artificial
inseminations, avoidance of mixed semen, monitoring parturitions, comparison of birth date
with calving date of dam, taking bull's ID from AI straws, etc. If there is the slightest doubt
about parentage of a calf, utilization of genetic markers, e.g. micro-satellites, to ascertain
parentage at birth is recommended. Until this goal is achieved, it is the INTERBULL
recommendation that doubtful pedigree and birth information to be set to unknown (set
parent ID to zero).
Before an udder health system can be developed, a number of prerequisites should be accounted for:
a. Unique animal identification and registration.
b. Unique herd identification and registration.
c. Individual animal pedigree information.
d. Birth registration.
e. A well functioning central database.
f. Milk recording system (time information and logistics of sampling milk samples).
For these prerequisites in general, we refer to Interbull bulletin no. 28 (2001). Two aspects of these
Interbull recommendations, animal ID and pedigree information, are cited below.
A lactation period is considered to commence on the day the animal gives birth. A lactation period is
considered to end the day the animal ceases to give milk (goes dry). The lactation number refers to the
number of the last lactation period started by the animal. The number of days in lactation denotes the
time span between calendar date of the mastitis incident and the day the last lactation period
commenced. The number of days in lactation may be negative when the incident occurs during the
dry-period proceeding next calving. For more detailed information on the definition of lactation period,
please see ICAR guidelines Section 2.
What ? In a milk recording system, with regular intervals milk samples are taken per cow.
Samples are being gathered and taken to an official laboratorium for analysis on contents
of fat and protein. In addition, milk samples can be used for among others analysis of milk
urea or somatic cell count.
Somatic cell count (SCC) in milk samples is obtained using Coulter Counter or Fossomatic
equipment. Standardised procedures are available from the International Dairy
Federation (www.idf.org). In milk of first parity cows, SCC ranges from 50.000-100.000
cells per ml from healthy udders to >1.000.000 cells per ml from udder quarters having
an inflammatory infection. A current IDF standard is that subclinical mastitis is diagnosed
in udders with milk having a SCC >200.000 cells per ml.
SCC can be presented either in absolute SCC or in classes based on the absolute SCC. As
the distribution of absolute SCC is very skewed, generally a log-transformation is applied
to a Somatic Cell Score (SCS). Other log-transformations are also used, sometimes
including a correction of SCC for milk yield and effects like season and parity. SCS again
can be analysed as a linear trait or used to define classes.
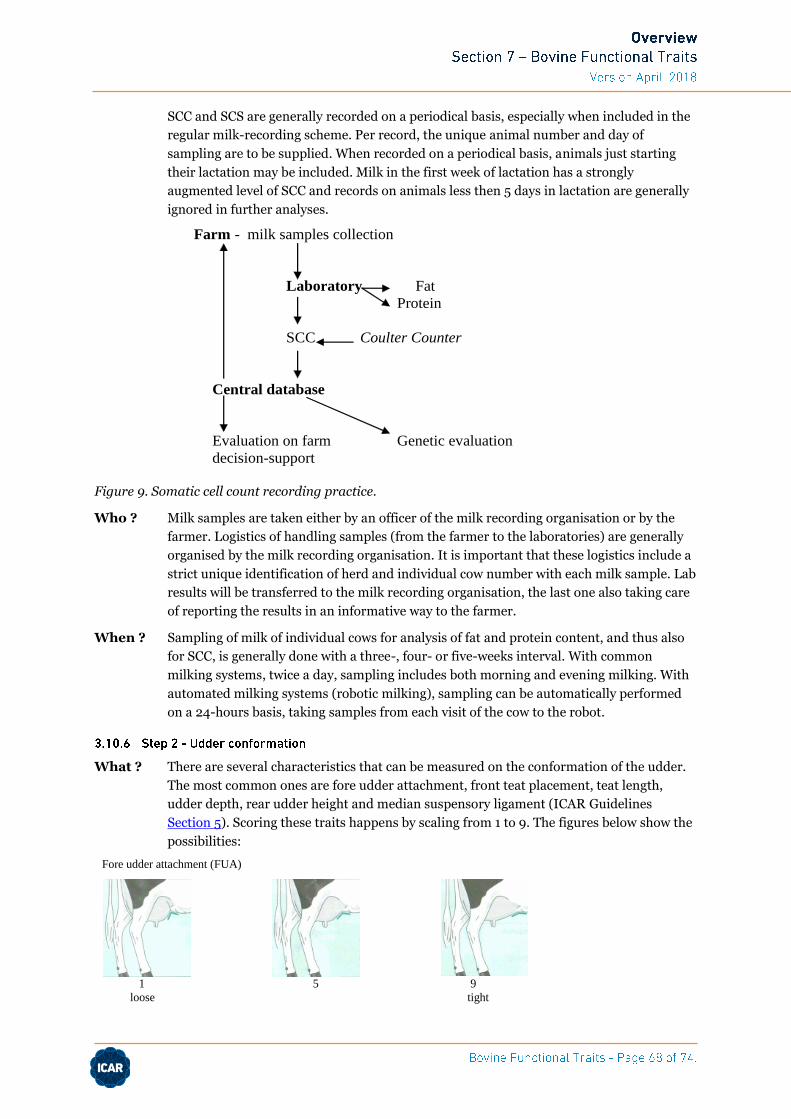
SCC and SCS are generally recorded on a periodical basis, especially when included in the
regular milk-recording scheme. Per record, the unique animal number and day of
sampling are to be supplied. When recorded on a periodical basis, animals just starting
their lactation may be included. Milk in the first week of lactation has a strongly
augmented level of SCC and records on animals less then 5 days in lactation are generally
ignored in further analyses.
Farm - milk samples collection
Laboratory Fat
Protein
SCC Coulter Counter
Central database
Evaluation on farm Genetic evaluation
decision-support
Figure 9. Somatic cell count recording practice.
Who ? Milk samples are taken either by an officer of the milk recording organisation or by the
farmer. Logistics of handling samples (from the farmer to the laboratories) are generally
organised by the milk recording organisation. It is important that these logistics include a
strict unique identification of herd and individual cow number with each milk sample. Lab
results will be transferred to the milk recording organisation, the last one also taking care
of reporting the results in an informative way to the farmer.
When ? Sampling of milk of individual cows for analysis of fat and protein content, and thus also
for SCC, is generally done with a three-, four- or five-weeks interval. With common
milking systems, twice a day, sampling includes both morning and evening milking. With
automated milking systems (robotic milking), sampling can be automatically performed
on a 24-hours basis, taking samples from each visit of the cow to the robot.
What ? There are several characteristics that can be measured on the conformation of the udder.
The most common ones are fore udder attachment, front teat placement, teat length,
udder depth, rear udder height and median suspensory ligament (ICAR Guidelines
Section 5). Scoring these traits happens by scaling from 1 to 9. The figures below show the
possibilities:
Fore udder attachment (FUA)
1 5 9
loose tight

Front teat placement (FTP)
1 5 9
wide narrow
Teat length (TL)
1 5 9
short long
Udder depth (UD) (code 1 is lower than hock)
2 5 9
deep shallow
Rear udder height (RUH)
1 5 9
low high
Median suspensory ligament (MSL)
1 5 9
weak strong
A report per cow is made of the six udder conformation traits mentioned above. An example of such a
report is in Table 15 below.

Table 15. Example of linear scoring report.
Inspector Piet Paaltjes Organisation Top-cow-bred Herd Hiemstra-dairy UBN 3459678 Date of inspection May 24, 2002
Cow number Fore udder attachment
Front teat placement
Teat ength
Udder depth
Rear udder height
Median suspensory
ligament 154389505385 5 4 3 6 8 7 154389505392 3 3 5 2 4 4 154389505404 7 6 5 7 7 8 154389505413 2 2 6 3 3 4 …. …..
Who ? Specialised inspectors score the udder conformation from the data processing
organisation. Their specialism can be guaranteed through regular meetings, where new
standards can come up for discussion. The WHFF organises international standardisation
of inspectors for the Holstein Friesian breed. The inspectors bring the records to the data
processing organisation, where the records will be processed, stored and used for
evaluation. Again, it is important that the reports include a strict unique identification of
herd and individual cow number. The inspectors also leave a copy of the report with the
farmer.
In order to let the udder conformation information be useful for estimating udder health,
linkage of the udder conformation data to the SCC-information should be warranted.
When ? In most current conformation scoring systems, only the cows in their first lactation are
scored. This makes scoring at least once a year necessary, assuming a calving interval of 12
months. However, it would be better to score more than once a year, for example once per
9 months. A heifer with a calving interval of 11 months will be dried off after 9 months.
Such a heifer can be missed, when scoring only once per 12 months is performed.
What ? The milkability (or milking speed) can be measured routinely on a large scale by
subjectively scoring (the milking speed of certain small numbers of cows can be measured
with advanced equipment). A milkability-form contains the individual cows together with
the possibilities “very slow, slow, average, fast or very fast milking”. An example of a
milkability-form is in Table 16.

Table 16. Milkability-form example.
Person scoring Farmer Organisation Top-Cow-Bred Herd Hiemstra-dairy UBN 3459678 Date of recording May 24, 2002
Cow number Very slow Slow Average Fast
Very fast
154389505385 x 154389505392 x 154389505404 x 154389505413 x x …. …..
Who ? The milkability-forms have to be filled up by the farmer. The farmer can send the form to
the milk recording organisation or give the form to the officer of the milk recording
organisation during the milk recording. After this the information can be used for the
evaluation. Again, it is important that the forms include a strict unique identification of
herd and individual cow number.
In order to let the milkability information be useful for estimating udder health, linkage of
the milkability data to the SCC-information should be warranted.
When ? As the milking speed does not really change over lactations, estimating the milking speed
only in the cow’s first lactation is sufficient. Again, assuming a 12 months calving interval,
makes a scoring of the milking speed once a year necessary.
What ? In recording of udder health, the following general trait definition is recommended
(following IDF recommendations):
a. Clinical mastitis = inflammatory response of the udder: painful, red, swollen udder, with fever.
This results in abnormal milk, and possibly outer visual or perceptible signs of the udder.
Besides the cow can show a general illness.
b. Healthy udder = absence of clinical or sub-clinical mastitis.
Table 17. Example of form for farmers recording mastitis incidents.
Person scoring Farmer Organisation Top-Cow-Bred Herd Hiemstra-dairy UBN 3459678 Period of inspection January-June, 2002 Ear tag number cow Date Details 0538
January 26 Extremely clotted and
watery “milk” 0576 February 5 - 0529 April 17 Teat injury 0541 May 31 Culled June 2nd 0602 June 2 Veterinary treatment ….
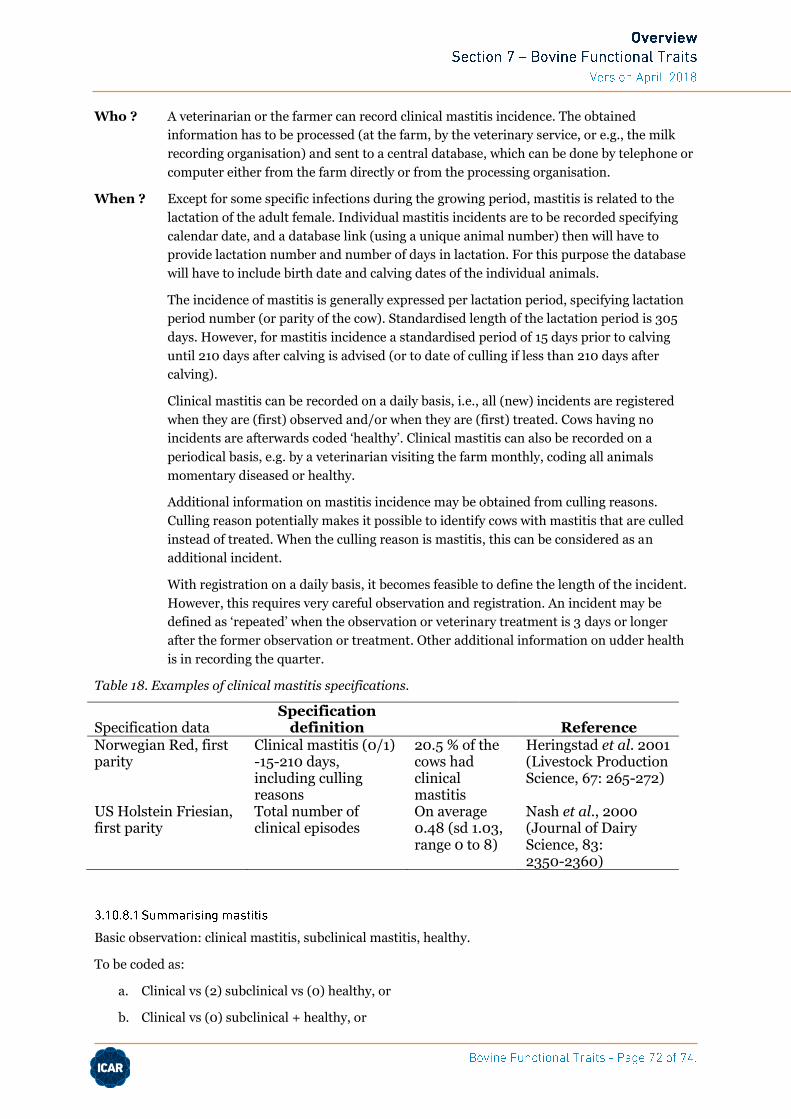
Who ? A veterinarian or the farmer can record clinical mastitis incidence. The obtained
information has to be processed (at the farm, by the veterinary service, or e.g., the milk
recording organisation) and sent to a central database, which can be done by telephone or
computer either from the farm directly or from the processing organisation.
When ? Except for some specific infections during the growing period, mastitis is related to the
lactation of the adult female. Individual mastitis incidents are to be recorded specifying
calendar date, and a database link (using a unique animal number) then will have to
provide lactation number and number of days in lactation. For this purpose the database
will have to include birth date and calving dates of the individual animals.
The incidence of mastitis is generally expressed per lactation period, specifying lactation
period number (or parity of the cow). Standardised length of the lactation period is 305
days. However, for mastitis incidence a standardised period of 15 days prior to calving
until 210 days after calving is advised (or to date of culling if less than 210 days after
calving).
Clinical mastitis can be recorded on a daily basis, i.e., all (new) incidents are registered
when they are (first) observed and/or when they are (first) treated. Cows having no
incidents are afterwards coded ‘healthy’. Clinical mastitis can also be recorded on a
periodical basis, e.g. by a veterinarian visiting the farm monthly, coding all animals
momentary diseased or healthy.
Additional information on mastitis incidence may be obtained from culling reasons.
Culling reason potentially makes it possible to identify cows with mastitis that are culled
instead of treated. When the culling reason is mastitis, this can be considered as an
additional incident.
With registration on a daily basis, it becomes feasible to define the length of the incident.
However, this requires very careful observation and registration. An incident may be
defined as ‘repeated’ when the observation or veterinary treatment is 3 days or longer
after the former observation or treatment. Other additional information on udder health
is in recording the quarter.
Table 18. Examples of clinical mastitis specifications.
Specification data Specification
definition Reference Norwegian Red, first parity
Clinical mastitis (0/1) -15-210 days, including culling reasons
20.5 % of the cows had clinical mastitis
Heringstad et al. 2001 (Livestock Production Science, 67: 265-272)
US Holstein Friesian, first parity
Total number of clinical episodes
On average 0.48 (sd 1.03, range 0 to 8)
Nash et al., 2000 (Journal of Dairy Science, 83: 2350-2360)
Basic observation: clinical mastitis, subclinical mastitis, healthy.
To be coded as:
a. Clinical vs (2) subclinical vs (0) healthy, or
b. Clinical vs (0) subclinical + healthy, or

c. Clinical + subclinical vs (0) healthy.
Primary data is unique cow number + observation mastitis + calendar date. This allows combination
with other herd data, pedigree data, reproduction and milk recording data. This also allows calculation
of a contemporary group mean (e.g., based on all animals in the same herd and parity).
Other aspects are:
a. Recording of incidents per lactation period -10 to 210 days in lactation
b. Repeated observation when 3 days or longer after last observation
c. Inclusion of culling for mastitis as additional incident.
a. Bacteriological culturing of milk samples to find the specific bacterium responsible for the
inflammation (e.g., Staphylococcus aureus, coliform, Streptococcus agalactiae ) -
recommendations on standard methodology are provided by the IDF
b. Removal of teats, teat injuries - there are standards for scoring of teat injuries, but these are
not included in any official guideline
For the recording of subclinical mastitis, we can also use measurements others than SCC, either from
on-line recording in the milking parlour or from centralised analysis of milk samples. In these
recommendations, no further attention is paid to conductivity of milk, NAG-ase, and cytokines. A lot
of work in this area is in progress and some of it is already implemented in automated milking systems
- for further information we refer to information of the ICAR Recording and Sampling Devices sub-
Committee.
Recorded data should always be accompanied by a full description of the recording programme.
a. How were herds selected?
b. How were recording persons (e.g., veterinarians, and farmers) selected and instructed? Any
standardised recording protocol used?
c. What types of recording forms or (computer) programs are used? - What type of equipment is
used?
d. Is there any (change of) selection of animals within herds?
Each record should at least include a unique individual animal number, and the recording date. In
case of mastitis, also a unique identification of person responsible for the recording is to be included.
The unique individual animal number should facilitate a data link to a pedigree file (e.g., sire), milk
recording file (e.g., calving date, birth date) and to a unique herd number. When this data links can not
be established, each record on mastitis and somatic cell count should also include pedigree, birth date,
calving date and parity and unique herd number.
After completion of recording, precise specification is required of any data checking, adjustment and
selection steps.
Examples:
a. What types of data checks are practised? (E.g., does the unique number exist for a living
animal, or is recording date within a known lactation period?)
b. Are averages and standard deviations within herds or per recording person standardised?

c. Is a minimum of records per herd, per animal or whatever applied before data analysis is
started ?
Consistency and completeness of the recording and representativeness of the data is of utmost
importance. Any doubt on this is to be included in a discussion on the results. The amount of
information and the data structure determine the accuracy of the result; measures of this accuracy
should always be provided.
For general information on data quality, we refer to Interbull bulletin no. 28, and the reports of the
ICAR working group on Data Quality.
Information from a single farm can be combined with information from other farms to serve as a basis
for a genetic evaluation (per region, country, or breeding organisation, or even internationally). A first
prerequisite is of course that information is recorded in a uniform manner. A second prerequisite is a
(national) database with appropriate data logistics to combine pedigree files (herd book, identification
and registration), milk recording files and files with reproductive data.
It is recommended that breeding values on udder health for marketed sires are available on a routinely
basis, i.e., included in a listing of marketed sires by official organisations. The udder health index
might be considered one of the major sub-indexes. The udder health index itself should preferably be
composed of predicted breeding values for direct traits and predicted breeding values for indirect,
indicator traits (i.e., udder conformation, SCS and milk flow). Combination of direct and indirect
information maximises accuracy of selection on resistance towards clinical and subclinical mastitis. In
turn, the udder health index should be used to compose an overall performance index, for an overall
ranking of animals.
The udder health index can be presented
a. Either in absolute units (e.g., monetary units or % of diseased daughters) or in relative terms.
b. Using either an observed or standardised standard deviation.
c. Rrelative to either an absolute or relative genetic basis (e.g., as a deviation from 100).
It is recommended that a uniform basis of presenting indexes for functional traits is chosen per
country or breeding organisation.
Within the udder health index, the weighting of predicted breeding values (PBVs) for direct and
predictor traits is to be based on the information content - dependent on relationship between trait
and udder health, and the accuracy of the PBVs (i.e., the number of underlying observations). As the
information contents generally differ per sire, relative weighting within the udder health index should
be performed on an individual sire basis.
Weighting of the udder health index as part of an overall ranking index is to be based on the relative
(economic, ecological and social-cultural) value of genetically improved udder health relative to other
traits.