Guidelines for Estimating Unmetered Landscaping … for Estimating Unmetered Landscaping Water Use...
49
iii PNNL-19498 Prepared for the U.S. Department of Energy under Contract DE-AC05-76RL01830 Guidelines for Estimating Unmetered Landscaping Water Use KL McMordie Stoughton July 2010
Transcript of Guidelines for Estimating Unmetered Landscaping … for Estimating Unmetered Landscaping Water Use...

iii
PNNL-19498
Prepared for the U.S. Department of Energy under Contract DE-AC05-76RL01830
Guidelines for Estimating Unmetered Landscaping Water Use KL McMordie Stoughton July 2010

PNNL-19498
Guidelines for Estimating Unmetered Landscaping Water Use
KL McMordie Stoughton
July 2010
Prepared for U.S. Department of Energy Federal Energy Management Program Under Contract DE-AC05-76RL01830
Pacific Northwest National Laboratory Richland, Washington 99352


iii
Summary
Executive Order 13514 requires Federal agencies to develop a baseline for industrial, landscaping, and
agricultural water use in fiscal year 2010. Measuring actual water use through flow meters is the best
method to develop this baseline. But there are instances where Federal sites do not meter these
applications, so developing a baseline will be problematic. Therefore the intent of this document is to
assist Federal agencies in the baseline development by providing a methodology to calculate unmetered
sources of landscaping water use utilizing engineering estimates.
The document lays‐out step by step instructions to estimate landscaping water using two alternative
approaches: evapotranspiration method and irrigation audit method. The evapotranspiration method
option calculates the amount of water needed to maintain a healthy turf or landscaped area for a given
location based on the amount of water transpired and evaporated from the plants. The
evapotranspiration method offers a relatively easy “one‐stop‐shop” for Federal agencies to develop an
initial estimate of annual landscape water use. The document presents annual irrigation factors for 36
cities across the U.S. that represents the gallons of irrigation required per square foot for distinct
landscape types. By following the steps outlined in the document, the reader can choose a location that
is a close match their location and landscape type to provide a rough estimate of annual irrigation needs
without the need to research specific data on their site.
The second option presented in the document is the irrigation audit method, which is the physical
measurement of water applied to landscaped areas through irrigation equipment. Steps to perform an
irrigation audit are outlined in the document. An irrigation audit requires some knowledge on the
specific procedures to accurately estimate how much water is being consumed by the irrigation
equipment.

iv

v
Acknowledgments
This document was prepared by the Pacific Northwest National Laboratory (PNNL) on behalf of the
Federal Energy Management Program. PNNL would like to thank the Federal Water Working Group of
the Interagency Energy Management Task Force, which provided initial direction and later review of the
supplemental guidance.
Representatives of the working group include the following individuals:
Dan Amon – Environmental Protection Agency
Andy Crigler – Department of Defense – Office of the Secretary of Defense
William Eng – Department of Defense – Army
Bucky Green – Environmental Protection Agency
Michael Green – National Aeronautical Space Administration
Mary Heying – Department of Interior
Sam Higuchi – National Aeronautical Space Administration
Charles Johnson – Department of Agriculture
Dexter Johnson – Environmental Protection Agency
Regina Larrabee – Veterans Affairs
William Lintner – Department of Energy, Chairman
Jose Maniwang – Department of Justice
Daniel Magro – Department of Defense – Navy
Don Mauritz – Lawrence Berkeley National Laboratory
Sandy Morgan – Department of Agriculture
Tara O’Hare – Environmental Protection Agency
John Park – Veterans Affairs
Larry Pierce – Department of Housing and Urban Development
Robert Scinta – Department of Commerce
Justin Spenillo – Environmental Protection Agency
Stephanie Tanner – Environmental Protection Agency
Wayne Thalasinos – National Aeronautical Space Administration
Chris Tindal – Department of Defense – Navy
Chau Tran – Department of Justice
Cynthia Vallina – Office of Management and Budget
David Zimmerman – Tennessee Valley Authority
The following people also provided technical and production assistance:
Sue Arey – Pacific Northwest National Laboratory
Brian Boyd ‐ Pacific Northwest National Laboratory
Elisabeth Giever – Pacific Northwest National Laboratory
Peter Mayer – Aquacraft Inc.
Bill Sandusky – Pacific Northwest National Laboratory

vi

vii
Contents
Summary ...................................................................................................................................................... iii
Acknowledgments ......................................................................................................................................... v
1.0 Background ....................................................................................................................................... 1
2.0 Option 1: Estimating Landscaping Water Use Using the Evapotranspiration Method ..................... 3
2.1 Getting Started .............................................................................................................................. 3
2.2 Find the Best Match to your Location ........................................................................................... 4
2.3 Identify your Turfgrass and Landscape Type ................................................................................ 8
2.4 Estimate Square Footage of the Irrigated Area .......................................................................... 10
2.5 Select the Annual Irrigation Factor ............................................................................................. 11
2.6 Determine your Irrigation System Efficiency .............................................................................. 16
2.7 Calculate your Total Annual Irrigation ........................................................................................ 17
3.0 Option 2: Estimating Landscaping Water Use Using the Irrigation Audit Method ........................ 21
3.1 Perform an Irrigation Audit ......................................................................................................... 21
3.2 Calculate your Precipitation Rate ............................................................................................... 22
3.3 Estimate your Annual Runtime ................................................................................................... 22
3.4 Estimate Square Footage of the Irrigated Area .......................................................................... 22
3.5 Calculate your Total Annual Irrigation ........................................................................................ 23
4.0 Subsequent Reporting Years ........................................................................................................... 25
5.0 Glossary ........................................................................................................................................... 27
6.0 Resources ........................................................................................................................................ 29
7.0 References ...................................................................................................................................... 31
Appendix ‐‐ Calculations for the Annual Irrigation Factor Tables ............................................................. A‐1
viii
Figures
Figure 1 ‐ Climate Zones of the United States and Puerto Rico .................................................................... 5
Figure 2 ‐ High Density Landscape Area ...................................................................................................... 10
Tables
Table 1 ‐ City Locations by Climate Zone ...................................................................................................... 7
Table 2 ‐ Turfgrass Seasons ........................................................................................................................... 8
Table 3 ‐ Annual Irrigation Factor ‐‐ Turfgrass (gal/sqft/year) .................................................................... 12
Table 4 ‐ Annual Irrigation Factor ‐‐ Landscaped Areas with High Water Requirements (gal/sqft/yr) ...... 13
Table 5 ‐ Annual Irrigation Factor ‐‐ Landscaped Areas with Moderate Water Requirements
(gal/sqft/yr) ................................................................................................................................................. 14
Table 6 ‐ Annual Irrigation Factor ‐‐ Landscaped Areas with Low Water Requirements (gal/sqft/yr) ....... 15
1
1.0 Background
Executive Order 13514, Federal Leadership in Environmental, Energy, and Economic Performance, was
signed on October 5, 2009 by President Obama. EO 13514 has water provisions that require Federal
agencies to improve water use efficiency and management as follows:
1. Reduce potable water consumption intensity by 2% annually through fiscal year (FY) 2020, or 26% by the end of fiscal year 2020, relative to a FY 2007 baseline.
2. Reduce agency industrial, landscaping, and agricultural water consumption 2% annually, or 20% by the end of fiscal year 2020, relative to a FY 2010 baseline.
The second provision listed above requires that Federal agencies develop a baseline for industrial,
landscaping, and agricultural water use so that all efficiency efforts can be judged against this baseline.
Each Federal site must develop a baseline for these industrial, landscaping, and agricultural uses and
report the total FY 2010 consumption to their respective agency. Measuring actual water use through
flow meters is the best method to develop the FY 2010 baseline. But there are instances where Federal
sites do not meter these applications, so developing a baseline will be problematic. If permanent
metering is not practical, then a temporary flow meter offers a sound solution. Temporary ultra‐sonic
flow meters can be installed to the outside of a pipe and do not require a disruption of the process. If
large landscapes pull irrigation water from an on‐site well that contain reliable pumping records, water
use can be estimated by taking the pump flow rate at the given well depth multiplied by the annual
runtime.
If these metering options are not applicable or practical and the landscaping water source is not from an
on‐site well with adequate pumping records, then an engineering estimate must be used to estimate
annual water use. Therefore, the intent of this document is to assist Federal agencies in estimating
unmetered sources of landscaping water use utilizing engineering estimates1. Two approaches are
covered in this document:
1. Evapotranspiration Method – estimate of supplemental water requirements based on the amount
of water transpired and evaporated from the plants for different locations across the U.S.
2. Irrigation Audit Method – physical measurement of water applied to landscaped areas through
irrigation equipment
The evapotranspiration (ET) method provided in this document serves as an initial starting place for
estimating landscaping water use baseline whereas the irrigation audit offers a method of spot
measuring actual landscape water use. It should be noted that an irrigation audit requires knowledge
on how to perform an audit and requires the purchase of some minor equipment. On the other hand,
the ET method does not require training or purchase of equipment but does require some basic
knowledge of the landscape and the use of specific calculations provided in this document. This
1 Note, the Federal Energy Management Program has produced a companion document that provides a
methodology on how to estimate unmetered industrial processes.

2
document focuses on the ET method because it offers a relatively easy “one‐stop‐shop” for Federal
agencies to develop an initial estimate of annual landscape water use for the FY 2010 baseline. The
irrigation audit method is also discussed so that both options can be considered. Note several
assumptions are required to use the ET method in this document; therefore the estimated landscape
water use can have a fairly wide range of possible values.

3
2.0 Option 1: Estimating Landscaping Water Use Using the Evapotranspiration Method
The evapotranspiration (ET) method calculates the amount of water needed to maintain a healthy turf
or landscaped area for a given location based on the water requirements of the type of plants, specific
conditions of the site, and precipitation received by the site. ET represents the loss of water from the
Earth’s surface through the combined processes of evaporation (from soil and plant surfaces) and plant
transpiration.
2.1 Getting Started
This document describes how to estimate annual supplemental irrigation requirements for:
Cool and warm season turfgrasses
Low water consuming landscaped area
Moderate water consuming landscaped areas
High water consuming landscaped areas
Annual Irrigation Factor: This document provides annual irrigation factors for 36 cities across the U.S.
that represents the gallons of irrigation required per square foot for distinct landscape and turf types in
corresponding locations (shown in Tables 3 through 6 of this document). ET and precipitation data was
acquired for all 36 U.S. locations to estimate these annual irrigation factors. Multiplying the
appropriate factor by the square footage of your landscape or turfgrass area and dividing this value by
the system efficiency will provide you an estimate of the annual irrigation requirements for a given
location. Through the process described in this document,
you can estimate your irrigation requirements by choosing
a U.S. location that closely matches your area. This will
give you an initial estimate for your landscaping water use
baseline without the need to research and investigate your
local ET and precipitation data*.
To use the process laid out in the document, you will need
to perform six key steps to estimate your total annual
landscaping water use:
1. Find the best match to your location
2. Identify your turf and landscape area type
3. Estimate your square footage of turf and landscaped areas
4. Select the appropriate annual irrigation factor from the tables in the document
5. Determine the irrigation system efficiency
6. Calculate your total annual irrigation
* The Appendix provides detailed information on how the annual irrigation factors were developed. If you want to calculate a more precise annual irrigation factor instead of choosing one from the 36 cities that are provided in Tables 3 through 6, collect local ET and precipitation data on your location for FY 2010 and follow the process in the Appendix.

4
This information is utilized to estimate the total annual landscape water use by using the following
formula:
These steps are outlined in the flowchart below:
The remainder of this section takes you through these steps.
2.2 Find the Best Match to your Location
The first step in this process is to pick a city in Figure 1 that best matches your location. Figure 1 shows
general climate zones in the U.S. with several cities identified in each zone [ZenTech 2010]. This
document provides the annual irrigation needs for different landscape types for each of these locations.
It is very important to pick the best match to your location so that the irrigation estimate is as
accurate as possible. To assist with this, a listing of the cities with associated climate zones, zip codes,
peak reference evapotranspiration (ETo) and rainfall values are provided in Table 12. The peak ETo
(referring to the month with the highest ET requirement) and rainfall data can be used to help identify
the best match for your location’s climate if you are unsure which city is most appropriate. First, go to
2 ETo refers to the reference evapotranspiration. More information is provided on ETo in the Glossary and
Appendix of this document.
1. Find your location's best
match
2. Identify your turf or landscape
type
3. Estimate the irrigated area
4. Select the annual irrigation
factor
5. Determine irrigation system
efficiency
Multiply annual irrigation factor by irrigated area
Divide this number by
system efficiency
Total annual landscape water use

5
the U.S. Environmental Protection Agency (EPA) WaterSense Program “Water Budget Data Finder”
website: http://www.epa.gov/watersense/nhspecs/wb_data_finder.html Enter the zip code of your
location in the box provided in the website. Note the peak ETo and rainfall value of your location. Then
find a few locations in Table 1 that have similar ETo and rainfall values and pick the city that best
matches this information and is in a similar climate zone. By doing this, you are choosing the city that
has similar irrigation requirements to your location. See an example of this process at the end of this
section.
Figure 1 - Climate Zones of the United States and Puerto Rico

6
The Climate zones of the U.S. depicted in this map are:
Alpine: high mountain regions of the Rocky Mountains, Sierra Nevada, and Cascade Mountain
ranges
Desert: regions of the U.S. that receive very little precipitation including southern Arizona, south
eastern California, southern Utah, and Nevada
Humid Continental (cool summer): northeastern areas of the U.S. that typically have cooler
summers and harsh winters such as up‐state New York, Vermont, Minnesota, and Wisconsin
Humid Continental (warm summer): Midwestern and northeastern areas of the U.S. with hotter
summers and milder winters such as Ohio, Indiana, and Pennsylvania
Humid Southern: hot humid regions of the southern U.S. such as Mississippi, middle and eastern
Texas, Georgia, and Florida
Mediterranean: western regions of California
Marine ‐ West Coast: coastal regions of Oregon and Washington
Semi‐arid: regions of the U.S. which are characterized by grasslands or sparsely treed areas that
have relatively low levels of precipitation such as western Kansas, New Mexico, Idaho, and
eastern Wyoming and eastern Colorado
Subarctic: Very cold regions, namely Alaska
Tropical: regions in the U.S. that are hot and humid and have no significant seasonal changes
including the southern tip of Florida, Hawaii, and Puerto Rico

7
Table 1 - City Locations by Climate Zone [ZenTech 2010]
Climate Zone City State Zip Code Peak ETo (in/mo)
Peak Rainfall (in/mo)
Alpine Bozeman MT 59715 7.37 1.44
Alpine Laramie WY 82051 7.44 1.33
Alpine Santa Fe NM 87501 7.75 1.16
Desert Bakersfield CA 93301 10.39 0.00
Desert Las Vegas NV 89044 13.03 0.03
Desert Phoenix AZ 85003 13.40 0.02
Desert Reno NV 89501 8.92 0.13
Humid Continental ‐ Cool Summer Bangor ME 04401 4.80 3.03
Humid Continental ‐ Cool Summer Milwaukee WI 53202 6.08 3.11
Humid Continental ‐ Cool Summer Minneapolis MN 55401 6.85 3.41
Humid Continental ‐ Warm Summer Boston MA 02108 6.18 2.66
Humid Continental ‐ Warm Summer Cincinnati OH 45202 6.23 3.34
Humid Continental ‐ Warm Summer Kansas City MO 64101 7.43 3.47
Humid Continental ‐ Warm Summer Omaha NE 68102 7.15 3.14
Humid Continental ‐ Warm Summer Philadelphia PA 19102 6.25 3.43
Humid Southern Atlanta GA 30303 6.48 3.29
Humid Southern Houston TX 77002 6.91 3.24
Humid Southern Memphis TN 38103 7.38 3.17
Humid Southern New Orleans LA 70116 6.13 4.08
Humid Southern Raleigh NC 27601 6.03 3.53
Humid Southern San Antonio TX 78205 8.42 0.87
Humid Southern Washington DC 20004 6.46 2.99
Marine ‐ West Coast Olympia WA 98501 5.14 0.70
Marine ‐ West Coast Portland OR 97086 6.20 0.58
Marine ‐ West Coast Seattle WA 98101 5.44 0.65
Mediterranean Los Angeles CA 90001 6.59 0.00
Mediterranean Sacramento CA 95814 9.47 0.00
Mediterranean San Francisco CA 94102 5.24 0.04
Semi‐arid Amarillo TX 79107 9.64 2.33
Semi‐arid Boise ID 83601 7.76 0.45
Semi‐arid Denver CO 80002 8.25 1.78
Semi‐arid Rapid City SD 57701 7.86 2.01
Semi‐arid Salt Lake City UT 84101 10.13 0.57
Subarctic Anchorage AK 99501 4.09 1.03
Tropical Honolulu HI 96853 7.44 5.87
Tropical Miami FL 33010 6.65 2.16

8
2.3 Identify your Turfgrass and Landscape Type
Next, you need to identify which areas are irrigated at your facility and if these areas are predominantly
turfgrass or landscaped plants. For example, recreational and athletic fields are typically considered
turfgrass area. Areas with a mixture of plants such as trees, shrubs, and flowerbeds are considered
landscaped areas.
You need to identify the type of turfgrass and landscaped areas at your location. The next two sections
help to direct you on how to do this.
Turfgrass Type
In general, there are two types of turfgrass – cool and warm season. Cool season grasses thrive in cooler
climates and generally require more water than warm season grass to thrive. Warm season grasses are
better suited for hot summers and are generally more drought tolerant. You’ll need to know which type
of grass you irrigate. Your ground maintenance personnel should be able to identify which type of grass
you have at your location. Table 2 lists common species of grass and their associated season. (See the
section on Turfgrass Evapotranspiration in the Appendix to learn more about turfgrass water
requirements.)
Table 2 - Turfgrass Seasons [California Department of Water Resources 2000] [University of Florida 2009]
Turfgrass type Season Type
annual bluegrass cool
annual ryegrass cool
Bermuda grass warm
buffalo grass warm
colonial bentgrass cool
creeping bentgrass cool
hard fescue cool
highland bentgrass cool
Kentucky bluegrass cool
kikuyugrass warm
meadow fescue cool
perennial ryegrass cool
red fescue cool
rough‐stalked cool
seashore paspalum warm
St. Augustinegrass warm
tall fescue cool
zoysiagrass warm

9
Landscape Type
For landscape areas that are not exclusively turfgrass such as sites with trees, shrubs, and flowerbeds,
there are three parameters that designate the amount of water necessary for plants to thrive:
1. Water requirements of the plant species (low, moderate, or high)
2. Density of plantings (low, average, or high)
3. Type of microclimate of the landscape (protected, open, or intense exposure)
These parameters are described below to help you identify which type you have at your facility.
Landscape Water Requirements
Supplemental water requirements for landscape plants vary across the U.S. You need to determine the
relative amount of irrigation that is required for your landscape. The ranges of watering requirements
used in this document are low, moderate, or high water requirements. Keep in mind that the water
requirements for your landscape are specific to your area. Plants that require low amounts of water are
native or well adapted plants to a particular area (which is a good strategy to limit supplemental
irrigation requirements). If your landscape does not include species that are native or drought tolerant
in your area, then they likely are moderate to high water consuming plants. For example, a native tree
to Tennessee, (e.g. White Oak), will require very little supplemental water in its home state, but will
require large amounts of irrigation in an arid state such as Nevada to thrive.
To identify the level of supplemental water required for the plants in your landscape, contact your
ground maintenance department. If you cannot get information on the general water requirements of
your landscaped areas from staff on site, then you’ll need to do some investigating. Local organizations
such as a cooperative extension office of a local university may be a good starting place. The
cooperative extension office in your area will likely have water requirements of specific plants. The U.S.
Department of Agriculture has a website that identifies local cooperative extension offices across the
country at: http://www.csrees.usda.gov/Extension/
Because each cooperative extension office will have a different set of information on their website,
you’ll likely save time by calling the office to talk to staff at the office about getting resources on water
requirements rather than performing a web search. But before you call, you’ll need to know the general
types of plants that are in your landscaped areas. Remember, you are trying to determine if your
landscape area has low, moderate, or high water requirements for your location.
10
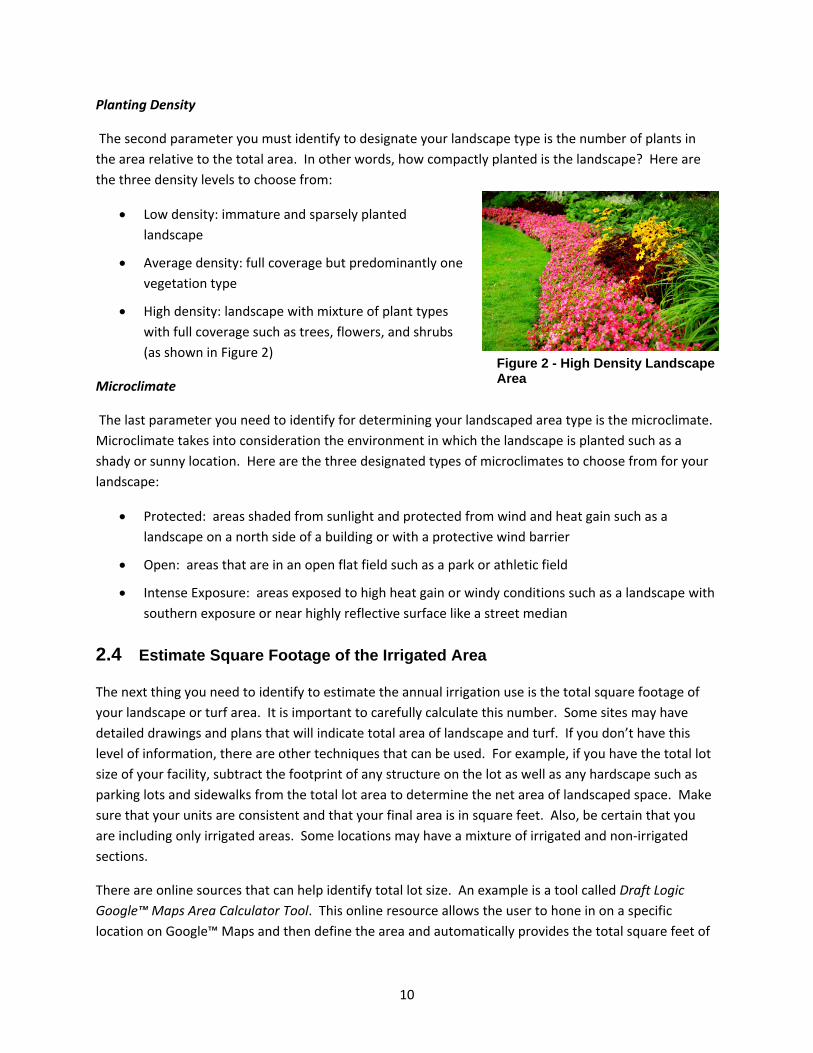
Planting Density
The second parameter you must identify to designate your landscape type is the number of plants in
the area relative to the total area. In other words, how compactly planted is the landscape? Here are
the three density levels to choose from:
Low density: immature and sparsely planted
landscape
Average density: full coverage but predominantly one
vegetation type
High density: landscape with mixture of plant types
with full coverage such as trees, flowers, and shrubs
(as shown in Figure 2)
Microclimate
The last parameter you need to identify for determining your landscaped area type is the microclimate.
Microclimate takes into consideration the environment in which the landscape is planted such as a
shady or sunny location. Here are the three designated types of microclimates to choose from for your
landscape:
Protected: areas shaded from sunlight and protected from wind and heat gain such as a
landscape on a north side of a building or with a protective wind barrier
Open: areas that are in an open flat field such as a park or athletic field
Intense Exposure: areas exposed to high heat gain or windy conditions such as a landscape with
southern exposure or near highly reflective surface like a street median
2.4 Estimate Square Footage of the Irrigated Area
The next thing you need to identify to estimate the annual irrigation use is the total square footage of
your landscape or turf area. It is important to carefully calculate this number. Some sites may have
detailed drawings and plans that will indicate total area of landscape and turf. If you don’t have this
level of information, there are other techniques that can be used. For example, if you have the total lot
size of your facility, subtract the footprint of any structure on the lot as well as any hardscape such as
parking lots and sidewalks from the total lot area to determine the net area of landscaped space. Make
sure that your units are consistent and that your final area is in square feet. Also, be certain that you
are including only irrigated areas. Some locations may have a mixture of irrigated and non‐irrigated
sections.
There are online sources that can help identify total lot size. An example is a tool called Draft Logic
Google™ Maps Area Calculator Tool. This online resource allows the user to hone in on a specific
location on Google™ Maps and then define the area and automatically provides the total square feet of
Figure 2 - High Density Landscape Area

11
area of the defined lot. Find this tool at: http://www.daftlogic.com/projects‐google‐maps‐area‐
calculator‐tool.htm
Once you enter this website, switch the map to “satellite” mode by selecting it from the drop down list
in the right hand corner. Then enter the zip code of your location. Zoom in on your location close
enough so that you can see all the distinct points of your landscape area. Then select each major point
of your landscape area. Lines will pop up as you select points that define the area you are selecting.
The total area in square feet of your landscape will appear at the bottom of the map.
2.5 Select the Annual Irrigation Factor
Next, select the appropriate annual irrigation factor. The annual irrigation factor is the amount of
annual supplemental water required to maintain healthy turf or landscaped area. Below you’ll find a
series of four tables that provide this factor for cool and warm season turfgrasses as well as low,
moderate, and high water consuming landscaped areas. The annual irrigation factor takes into account
the typical growing season for each location as well the amount of effective precipitation received by
the plants for the specific location. (See more details on these terms and methodology in the Glossary
and Appendix.)
Here is a description of the tables provided and direction on how to use them:
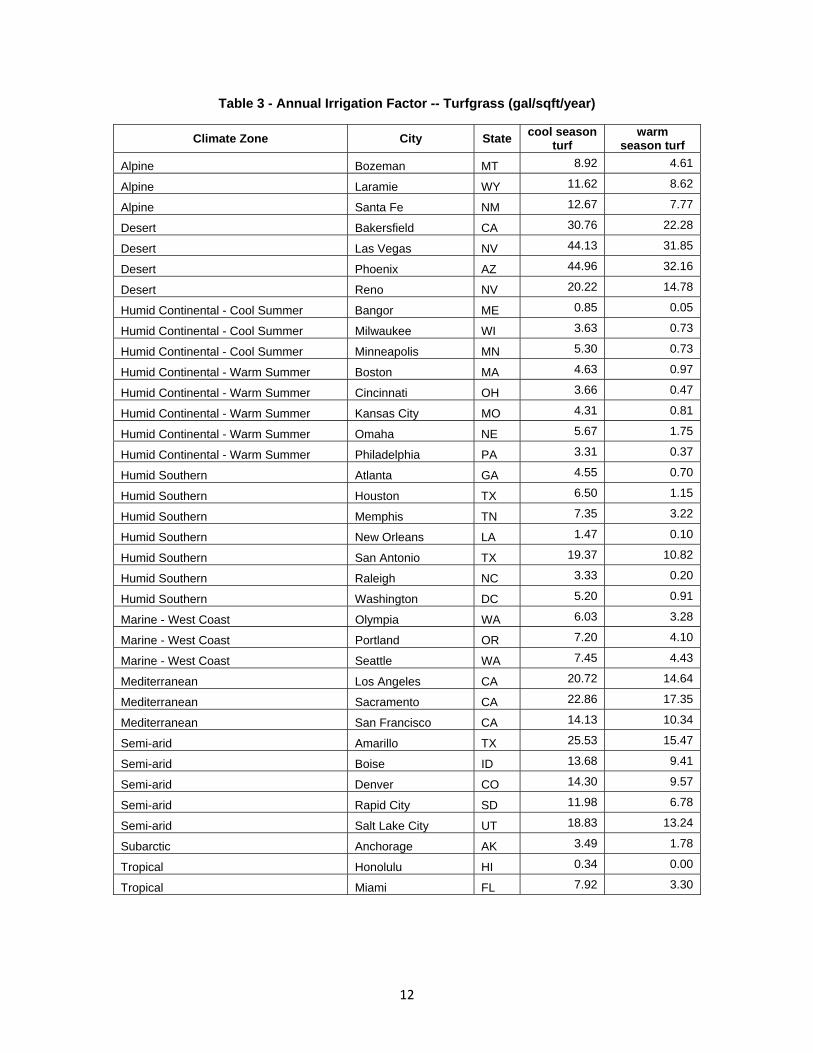
Turfgrasses: Table 3 shows the annual irrigation factor for both cool season and warm season
turf types. Identify the season of your turf and find the nearest location. Note the annual
irrigation factor.
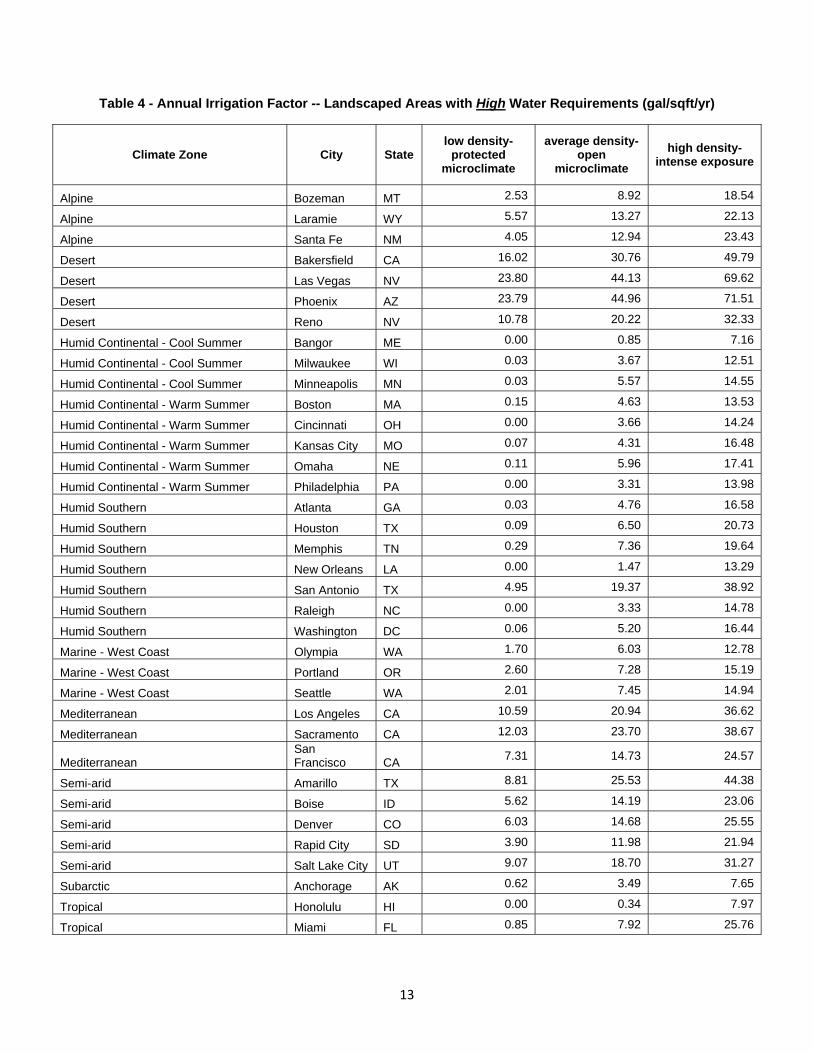
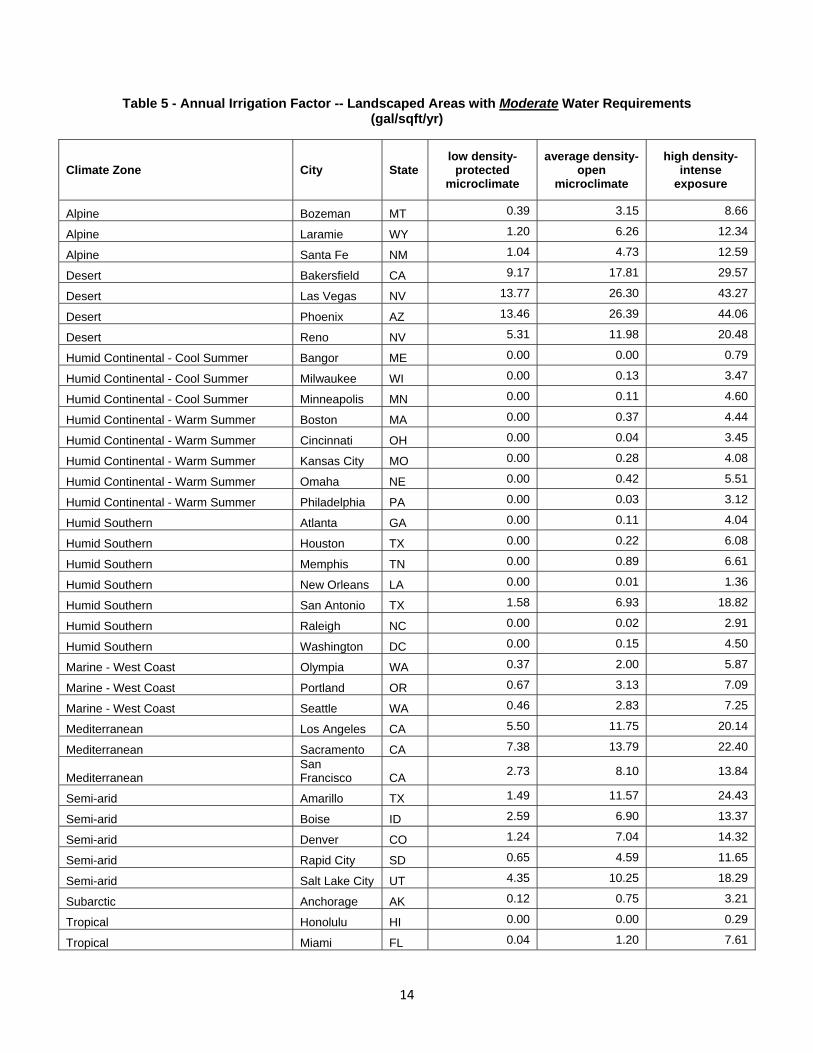
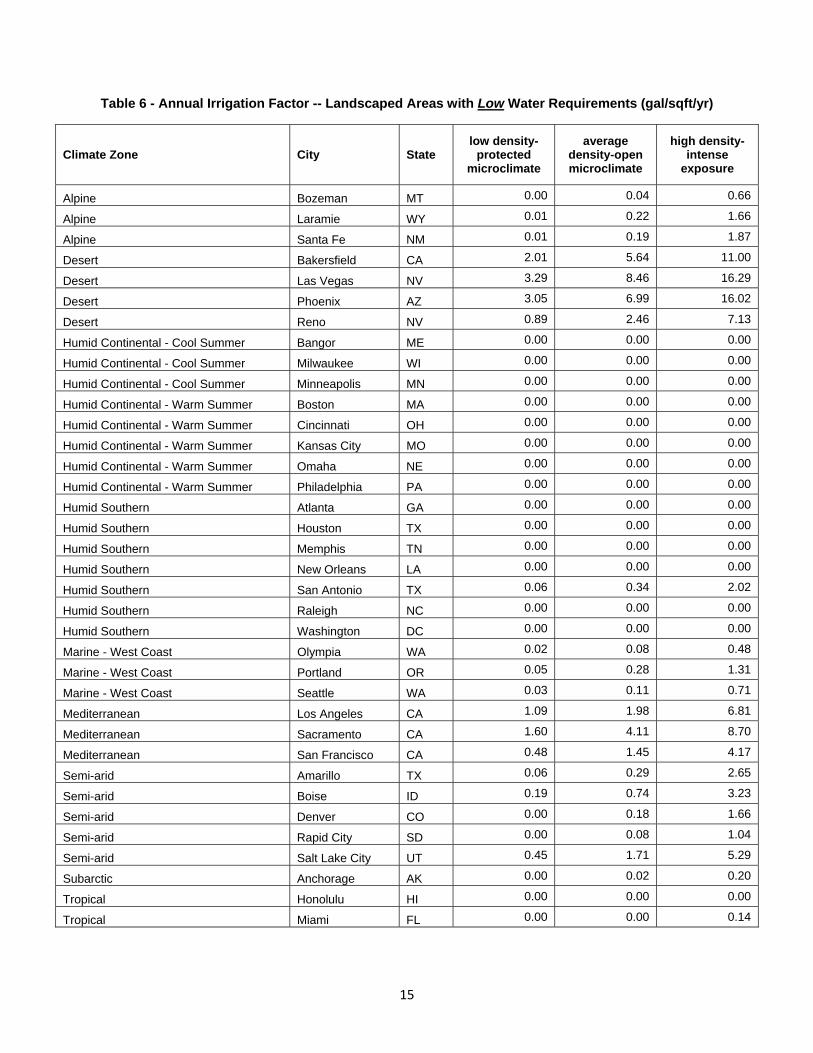
Landscaped Areas: Tables 4 through 6 show landscape types for high, moderate, and low water
consuming plants. First, find the table that best suits the plants’ water requirements (high,
moderate, or low). Then, choose the landscape type that best suits your area in terms of
density and microclimate. Note the annual irrigation factor for the nearest location. Here are
the types of landscapes that are included in each table:
o Low density and protected microclimate
o Average density and open microclimate
o High density and intense exposure microclimate
Your landscape may not be a perfect match to the scenarios in the table. For example, you may have
low density plantings but intense exposure in your landscape. If this is the case, consider choosing two
scenarios that closely meet your landscape type, and then select a factor that is in between this range to
determine your annual water use. An example of this process is provided at the end of the section.
Note, if the annual irrigation factor in the table is zero, this means that there is typically no irrigation
requirement for this type of landscape for the particular location because the area receives enough
precipitation to meet watering requirements for the specific landscape type.
12
Table 3 - Annual Irrigation Factor -- Turfgrass (gal/sqft/year)
Climate Zone City State cool season
turf warm
season turf
Alpine Bozeman MT 8.92 4.61
Alpine Laramie WY 11.62 8.62
Alpine Santa Fe NM 12.67 7.77
Desert Bakersfield CA 30.76 22.28
Desert Las Vegas NV 44.13 31.85
Desert Phoenix AZ 44.96 32.16
Desert Reno NV 20.22 14.78
Humid Continental - Cool Summer Bangor ME 0.85 0.05
Humid Continental - Cool Summer Milwaukee WI 3.63 0.73
Humid Continental - Cool Summer Minneapolis MN 5.30 0.73
Humid Continental - Warm Summer Boston MA 4.63 0.97
Humid Continental - Warm Summer Cincinnati OH 3.66 0.47
Humid Continental - Warm Summer Kansas City MO 4.31 0.81
Humid Continental - Warm Summer Omaha NE 5.67 1.75
Humid Continental - Warm Summer Philadelphia PA 3.31 0.37
Humid Southern Atlanta GA 4.55 0.70
Humid Southern Houston TX 6.50 1.15
Humid Southern Memphis TN 7.35 3.22
Humid Southern New Orleans LA 1.47 0.10
Humid Southern San Antonio TX 19.37 10.82
Humid Southern Raleigh NC 3.33 0.20
Humid Southern Washington DC 5.20 0.91
Marine - West Coast Olympia WA 6.03 3.28
Marine - West Coast Portland OR 7.20 4.10
Marine - West Coast Seattle WA 7.45 4.43
Mediterranean Los Angeles CA 20.72 14.64
Mediterranean Sacramento CA 22.86 17.35
Mediterranean San Francisco CA 14.13 10.34
Semi-arid Amarillo TX 25.53 15.47
Semi-arid Boise ID 13.68 9.41
Semi-arid Denver CO 14.30 9.57
Semi-arid Rapid City SD 11.98 6.78
Semi-arid Salt Lake City UT 18.83 13.24
Subarctic Anchorage AK 3.49 1.78
Tropical Honolulu HI 0.34 0.00
Tropical Miami FL 7.92 3.30
13
Table 4 - Annual Irrigation Factor -- Landscaped Areas with High Water Requirements (gal/sqft/yr)
Climate Zone City State low density-
protected microclimate
average density-open
microclimate
high density-intense exposure
Alpine Bozeman MT 2.53 8.92 18.54
Alpine Laramie WY 5.57 13.27 22.13
Alpine Santa Fe NM 4.05 12.94 23.43
Desert Bakersfield CA 16.02 30.76 49.79
Desert Las Vegas NV 23.80 44.13 69.62
Desert Phoenix AZ 23.79 44.96 71.51
Desert Reno NV 10.78 20.22 32.33
Humid Continental - Cool Summer Bangor ME 0.00 0.85 7.16
Humid Continental - Cool Summer Milwaukee WI 0.03 3.67 12.51
Humid Continental - Cool Summer Minneapolis MN 0.03 5.57 14.55
Humid Continental - Warm Summer Boston MA 0.15 4.63 13.53
Humid Continental - Warm Summer Cincinnati OH 0.00 3.66 14.24
Humid Continental - Warm Summer Kansas City MO 0.07 4.31 16.48
Humid Continental - Warm Summer Omaha NE 0.11 5.96 17.41
Humid Continental - Warm Summer Philadelphia PA 0.00 3.31 13.98
Humid Southern Atlanta GA 0.03 4.76 16.58
Humid Southern Houston TX 0.09 6.50 20.73
Humid Southern Memphis TN 0.29 7.36 19.64
Humid Southern New Orleans LA 0.00 1.47 13.29
Humid Southern San Antonio TX 4.95 19.37 38.92
Humid Southern Raleigh NC 0.00 3.33 14.78
Humid Southern Washington DC 0.06 5.20 16.44
Marine - West Coast Olympia WA 1.70 6.03 12.78
Marine - West Coast Portland OR 2.60 7.28 15.19
Marine - West Coast Seattle WA 2.01 7.45 14.94
Mediterranean Los Angeles CA 10.59 20.94 36.62
Mediterranean Sacramento CA 12.03 23.70 38.67
Mediterranean San Francisco CA
7.31 14.73 24.57
Semi-arid Amarillo TX 8.81 25.53 44.38
Semi-arid Boise ID 5.62 14.19 23.06
Semi-arid Denver CO 6.03 14.68 25.55
Semi-arid Rapid City SD 3.90 11.98 21.94
Semi-arid Salt Lake City UT 9.07 18.70 31.27
Subarctic Anchorage AK 0.62 3.49 7.65
Tropical Honolulu HI 0.00 0.34 7.97
Tropical Miami FL 0.85 7.92 25.76
14
Table 5 - Annual Irrigation Factor -- Landscaped Areas with Moderate Water Requirements (gal/sqft/yr)
Climate Zone City State low density-
protected microclimate
average density-open
microclimate
high density-intense
exposure
Alpine Bozeman MT 0.39 3.15 8.66
Alpine Laramie WY 1.20 6.26 12.34
Alpine Santa Fe NM 1.04 4.73 12.59
Desert Bakersfield CA 9.17 17.81 29.57
Desert Las Vegas NV 13.77 26.30 43.27
Desert Phoenix AZ 13.46 26.39 44.06
Desert Reno NV 5.31 11.98 20.48
Humid Continental - Cool Summer Bangor ME 0.00 0.00 0.79
Humid Continental - Cool Summer Milwaukee WI 0.00 0.13 3.47
Humid Continental - Cool Summer Minneapolis MN 0.00 0.11 4.60
Humid Continental - Warm Summer Boston MA 0.00 0.37 4.44
Humid Continental - Warm Summer Cincinnati OH 0.00 0.04 3.45
Humid Continental - Warm Summer Kansas City MO 0.00 0.28 4.08
Humid Continental - Warm Summer Omaha NE 0.00 0.42 5.51
Humid Continental - Warm Summer Philadelphia PA 0.00 0.03 3.12
Humid Southern Atlanta GA 0.00 0.11 4.04
Humid Southern Houston TX 0.00 0.22 6.08
Humid Southern Memphis TN 0.00 0.89 6.61
Humid Southern New Orleans LA 0.00 0.01 1.36
Humid Southern San Antonio TX 1.58 6.93 18.82
Humid Southern Raleigh NC 0.00 0.02 2.91
Humid Southern Washington DC 0.00 0.15 4.50
Marine - West Coast Olympia WA 0.37 2.00 5.87
Marine - West Coast Portland OR 0.67 3.13 7.09
Marine - West Coast Seattle WA 0.46 2.83 7.25
Mediterranean Los Angeles CA 5.50 11.75 20.14
Mediterranean Sacramento CA 7.38 13.79 22.40
Mediterranean San Francisco CA
2.73 8.10 13.84
Semi-arid Amarillo TX 1.49 11.57 24.43
Semi-arid Boise ID 2.59 6.90 13.37
Semi-arid Denver CO 1.24 7.04 14.32
Semi-arid Rapid City SD 0.65 4.59 11.65
Semi-arid Salt Lake City UT 4.35 10.25 18.29
Subarctic Anchorage AK 0.12 0.75 3.21
Tropical Honolulu HI 0.00 0.00 0.29
Tropical Miami FL 0.04 1.20 7.61
15
Table 6 - Annual Irrigation Factor -- Landscaped Areas with Low Water Requirements (gal/sqft/yr)
Climate Zone City State low density-
protected microclimate
average density-open microclimate
high density-intense
exposure
Alpine Bozeman MT 0.00 0.04 0.66
Alpine Laramie WY 0.01 0.22 1.66
Alpine Santa Fe NM 0.01 0.19 1.87
Desert Bakersfield CA 2.01 5.64 11.00
Desert Las Vegas NV 3.29 8.46 16.29
Desert Phoenix AZ 3.05 6.99 16.02
Desert Reno NV 0.89 2.46 7.13
Humid Continental - Cool Summer Bangor ME 0.00 0.00 0.00
Humid Continental - Cool Summer Milwaukee WI 0.00 0.00 0.00
Humid Continental - Cool Summer Minneapolis MN 0.00 0.00 0.00
Humid Continental - Warm Summer Boston MA 0.00 0.00 0.00
Humid Continental - Warm Summer Cincinnati OH 0.00 0.00 0.00
Humid Continental - Warm Summer Kansas City MO 0.00 0.00 0.00
Humid Continental - Warm Summer Omaha NE 0.00 0.00 0.00
Humid Continental - Warm Summer Philadelphia PA 0.00 0.00 0.00
Humid Southern Atlanta GA 0.00 0.00 0.00
Humid Southern Houston TX 0.00 0.00 0.00
Humid Southern Memphis TN 0.00 0.00 0.00
Humid Southern New Orleans LA 0.00 0.00 0.00
Humid Southern San Antonio TX 0.06 0.34 2.02
Humid Southern Raleigh NC 0.00 0.00 0.00
Humid Southern Washington DC 0.00 0.00 0.00
Marine - West Coast Olympia WA 0.02 0.08 0.48
Marine - West Coast Portland OR 0.05 0.28 1.31
Marine - West Coast Seattle WA 0.03 0.11 0.71
Mediterranean Los Angeles CA 1.09 1.98 6.81
Mediterranean Sacramento CA 1.60 4.11 8.70
Mediterranean San Francisco CA 0.48 1.45 4.17
Semi-arid Amarillo TX 0.06 0.29 2.65
Semi-arid Boise ID 0.19 0.74 3.23
Semi-arid Denver CO 0.00 0.18 1.66
Semi-arid Rapid City SD 0.00 0.08 1.04
Semi-arid Salt Lake City UT 0.45 1.71 5.29
Subarctic Anchorage AK 0.00 0.02 0.20
Tropical Honolulu HI 0.00 0.00 0.00
Tropical Miami FL 0.00 0.00 0.14

16
2.6 Determine your Irrigation System Efficiency
After determining your irrigation factor, estimate the efficiency of your irrigation system. System
efficiency relates to how much irrigation water is actually being used by your turf or plants. Your system
efficiency is based on the type of irrigation equipment installed as well as the maintenance and
scheduling of the system. A perfect system, operating at 100% efficiency, would have no leaks, losses,
or waste. But no system is 100% efficient ‐‐ water is lost from runoff, leaks, and evaporation for
example. Efficiency can also be impacted by poor maintenance such as broken sprinkler heads or
caused by scheduling problems such as watering during windy periods.
The type of irrigation equipment that is used to water the landscape has a big impact on system
efficiency. For turf and landscape irrigation, there are two main types of equipment:
Sprinkler systems: water delivered across a wide area through sprinkler heads such as pop‐up
and rotor heads
Micro irrigation: water delivered at lower pressures directly to the root zone of the plant via drip
or micro‐spray equipment
Sprinkler systems tend to have a lower equipment efficiency ranging between 50% to 70% where micro
irrigation have less losses with efficiency ratings between 70% and 90%. [Alliance for Water Efficiency
2009]
To determine your system efficiency, choose the efficiency rating from the list below that best matches
the characteristics of your system [Alliance for Water Efficiency 2009]:
Low Efficiency – 50%: sprinkler type systems that are aging with poor maintenance and lack of
proper scheduling
Medium Efficiency – 65%: sprinkler type systems that have regular maintenance and proper
scheduling
High Efficiency – 85%: micro irrigation systems that have regular maintenance and proper
scheduling
If you feel your system does not fall into one of these efficiency ratings, choose a number in between
these values that best matches the scenario at your location.
17
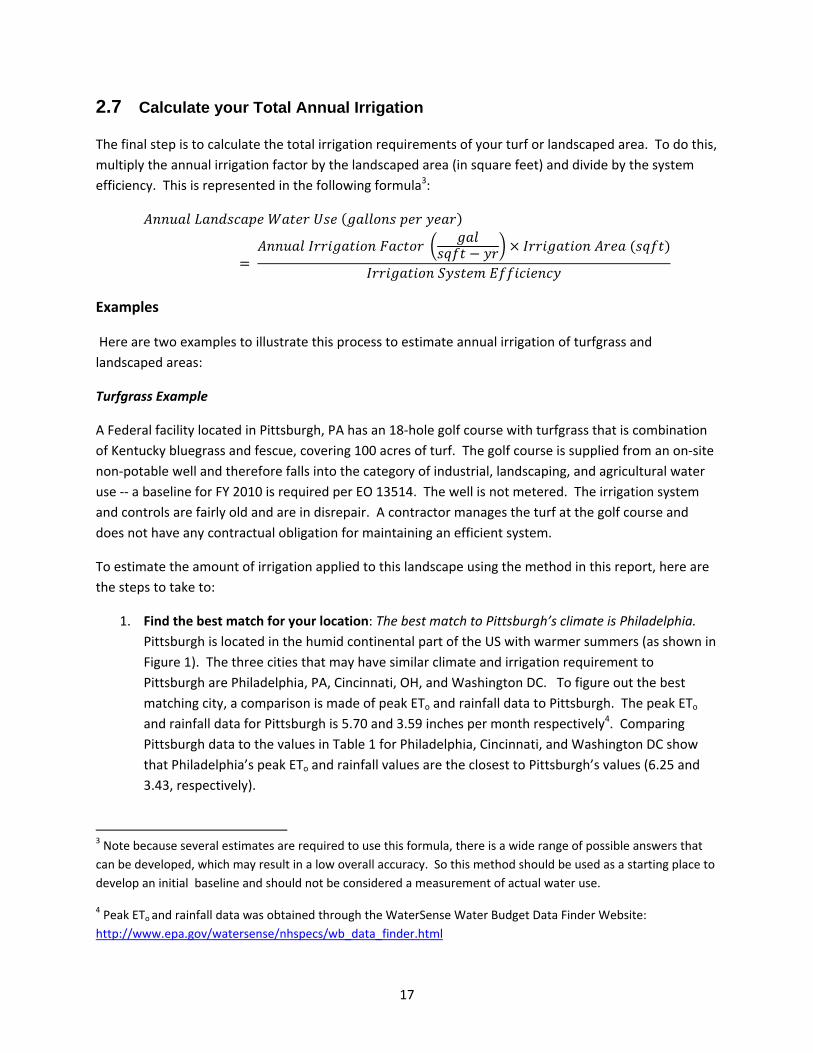
2.7 Calculate your Total Annual Irrigation
The final step is to calculate the total irrigation requirements of your turf or landscaped area. To do this,
multiply the annual irrigation factor by the landscaped area (in square feet) and divide by the system
efficiency. This is represented in the following formula3:
Examples
Here are two examples to illustrate this process to estimate annual irrigation of turfgrass and
landscaped areas:
Turfgrass Example
A Federal facility located in Pittsburgh, PA has an 18‐hole golf course with turfgrass that is combination
of Kentucky bluegrass and fescue, covering 100 acres of turf. The golf course is supplied from an on‐site
non‐potable well and therefore falls into the category of industrial, landscaping, and agricultural water
use ‐‐ a baseline for FY 2010 is required per EO 13514. The well is not metered. The irrigation system
and controls are fairly old and are in disrepair. A contractor manages the turf at the golf course and
does not have any contractual obligation for maintaining an efficient system.
To estimate the amount of irrigation applied to this landscape using the method in this report, here are
the steps to take to:
1. Find the best match for your location: The best match to Pittsburgh’s climate is Philadelphia.
Pittsburgh is located in the humid continental part of the US with warmer summers (as shown in
Figure 1). The three cities that may have similar climate and irrigation requirement to
Pittsburgh are Philadelphia, PA, Cincinnati, OH, and Washington DC. To figure out the best
matching city, a comparison is made of peak ETo and rainfall data to Pittsburgh. The peak ETo
and rainfall data for Pittsburgh is 5.70 and 3.59 inches per month respectively4. Comparing
Pittsburgh data to the values in Table 1 for Philadelphia, Cincinnati, and Washington DC show
that Philadelphia’s peak ETo and rainfall values are the closest to Pittsburgh’s values (6.25 and
3.43, respectively).
3 Note because several estimates are required to use this formula, there is a wide range of possible answers that
can be developed, which may result in a low overall accuracy. So this method should be used as a starting place to
develop an initial baseline and should not be considered a measurement of actual water use.
4 Peak ETo and rainfall data was obtained through the WaterSense Water Budget Data Finder Website:
http://www.epa.gov/watersense/nhspecs/wb_data_finder.html
18
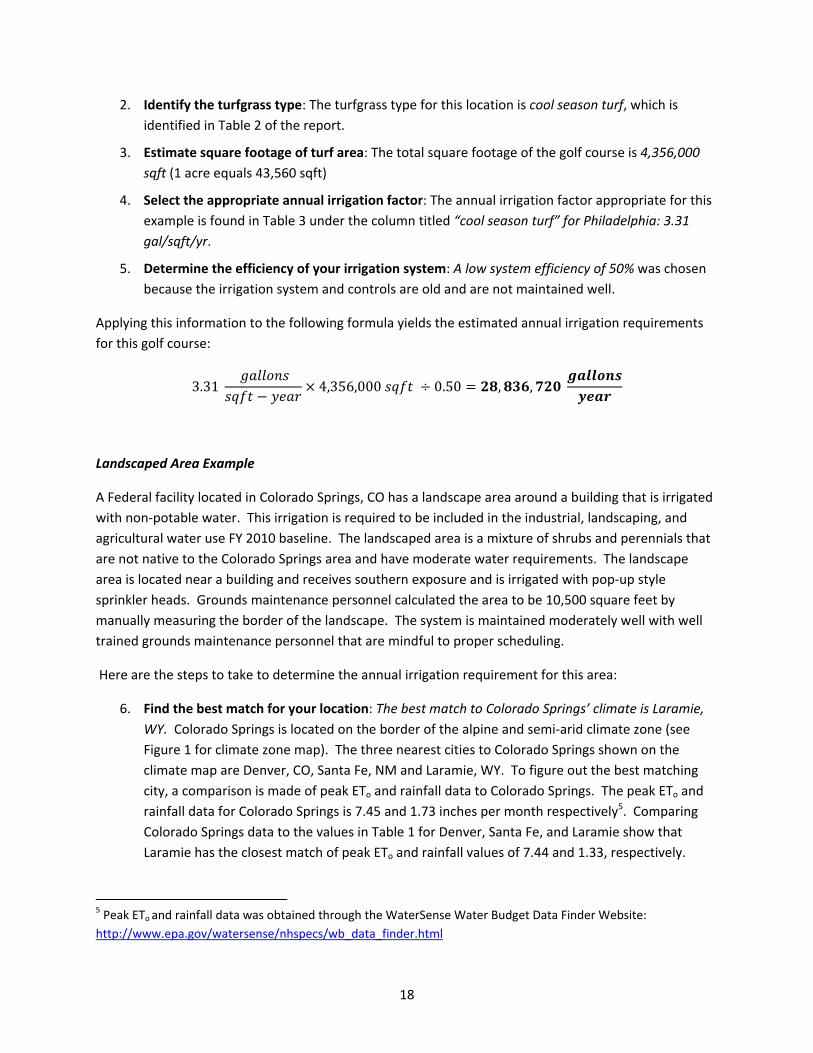
2. Identify the turfgrass type: The turfgrass type for this location is cool season turf, which is
identified in Table 2 of the report.
3. Estimate square footage of turf area: The total square footage of the golf course is 4,356,000
sqft (1 acre equals 43,560 sqft)
4. Select the appropriate annual irrigation factor: The annual irrigation factor appropriate for this
example is found in Table 3 under the column titled “cool season turf” for Philadelphia: 3.31
gal/sqft/yr.
5. Determine the efficiency of your irrigation system: A low system efficiency of 50% was chosen
because the irrigation system and controls are old and are not maintained well.
Applying this information to the following formula yields the estimated annual irrigation requirements
for this golf course:
3.31
4,356,000 0.50 , ,
Landscaped Area Example
A Federal facility located in Colorado Springs, CO has a landscape area around a building that is irrigated
with non‐potable water. This irrigation is required to be included in the industrial, landscaping, and
agricultural water use FY 2010 baseline. The landscaped area is a mixture of shrubs and perennials that
are not native to the Colorado Springs area and have moderate water requirements. The landscape
area is located near a building and receives southern exposure and is irrigated with pop‐up style
sprinkler heads. Grounds maintenance personnel calculated the area to be 10,500 square feet by
manually measuring the border of the landscape. The system is maintained moderately well with well
trained grounds maintenance personnel that are mindful to proper scheduling.
Here are the steps to take to determine the annual irrigation requirement for this area:
6. Find the best match for your location: The best match to Colorado Springs’ climate is Laramie,
WY. Colorado Springs is located on the border of the alpine and semi‐arid climate zone (see
Figure 1 for climate zone map). The three nearest cities to Colorado Springs shown on the
climate map are Denver, CO, Santa Fe, NM and Laramie, WY. To figure out the best matching
city, a comparison is made of peak ETo and rainfall data to Colorado Springs. The peak ETo and
rainfall data for Colorado Springs is 7.45 and 1.73 inches per month respectively5. Comparing
Colorado Springs data to the values in Table 1 for Denver, Santa Fe, and Laramie show that
Laramie has the closest match of peak ETo and rainfall values of 7.44 and 1.33, respectively.
5 Peak ETo and rainfall data was obtained through the WaterSense Water Budget Data Finder Website:
http://www.epa.gov/watersense/nhspecs/wb_data_finder.html

19
7. Identify the landscape type: The landscape type is moderate water use with average density
and intense exposure because it is located next to a building with southern exposure.
8. Estimate square footage of landscaped area: 10,500 sqft
9. Select the appropriate annual irrigation factor: Table 5 is the appropriate table for this
landscape because the plants have moderate water requirements. Because the landscaped area
has an average density and intense exposure, the appropriate factor is a value between
Laramie’s average density‐open microclimate and high density‐intense exposure annual
irrigation factor. The mid‐point between these two factors is 9.3, which was used for this
landscape.
10. Determine the efficiency of your irrigation system: A medium system efficiency of 65% was
chosen because pop‐up sprinkler heads typically are moderately efficient and the system is fairly
well maintained with good scheduling.
Applying this information to the following formula yields the estimated annual irrigation requirements
for this landscaped area:
9.3
10,500 0.65 ,

20

21
3.0 Option 2: Estimating Landscaping Water Use Using the Irrigation Audit Method
Estimating landscaping water use through the irrigation audit method requires the physical
measurement of irrigation water applied to the landscape.
To use this method, you will be required to follow five steps:
1. Perform an irrigation audit
2. Calculate the precipitation rate of your equipment
3. Estimate annual runtime of your equipment
4. Estimate total area of your landscape
5. Calculate total annual irrigation
3.1 Perform an Irrigation Audit
An irrigation audit requires specific procedures to accurately estimate how much water is being
consumed by your equipment. It is suggested that the Recommended Audit Guidelines produced by the
Irrigation Association are followed when performing an irrigation audit6.[Irrigation Association 2009]
The Irrigation Association has developed standard protocols for irrigation audits and also provides
irrigation auditor certification training. The basic procedures outlined in these guidelines include the
following steps:
Obtain catchment devices, called “catch cans”, which will be used to measure water from the
system. (Irrigation audit catch cans can be purchased through internet sources. Pre‐calibrated
plastic rain gauges can also be used.)
Measure the area of the “throat” of the catch can in square inches. The throat is the opening of
the catch can.
Perform a pre‐inspection audit, testing for basic operational performance of the system and
identifying problems such as broken heads. Make necessary repairs and adjustments.
Place catch cans in a uniform pattern on the landscape area. Follow the Irrigation Association
guidelines that specify spacing requirements for different types of sprinkler system equipment.
Run the irrigation system over a given period of time – note the time period (typically done in 15
minute intervals).
Test the system under normal operating conditions and with minimum wind (less than 5 miles
per hour).
Measure the volume of water in each catch can (typically measured in milliliters).
6 The Recommended Audit Guidelines produced by the Irrigation Association is available at:
www.irrigation.org/certification/pdf/AuditGuidelines_final.pdf
22
3.2 Calculate your Precipitation Rate
The basic goal of an irrigation audit is to determine your irrigation equipment’s precipitation rate. The
precipitation rate is the amount of water that is delivered to your landscape area over a given period of
time, provided in inches per hour. The method described in this section only applies to sprinkler
systems and not drip irrigation. Also, this method is best used for irrigation systems where the sprinkler
heads provide similar precipitation rates. For example, if a landscape area has a mixture of rotor and
pop up spray heads, estimating the precipitation rate of the system using an irrigation audit will not
reflect the actual water consumption. Precipitation rates vary between different types of sprinkler
heads ranging between 1.0 to 2.5 inches per hour for pop‐up spray heads and 0.1 to 1.5 inches per hour
for rotor type heads7. [Alliance for Water Efficiency 2009]
The precipitation rate can be calculated using the following formula:
3.66
The factor 3.66 converts water volume of milliliters to cubic inches and runtime minutes to hours.
3.3 Estimate your Annual Runtime
Along with the precipitation rate, you also need to know the annual runtime of your system to estimate
the annual landscape water use. The annual runtime of your system can be estimated by understanding
your monthly or weekly irrigation schedule. Take the number of hours your system runs each week or
month and multiply this number by the number of weeks or months your irrigation system operates
throughout the year. (Note, many areas of the U.S. do not require irrigation during the cooler times of
the year, so make sure to account for only the irrigation season of your landscape.) For example, if a
system operates from April through September for 12 hours each month, then the annual runtime of
the system is 72 hours.
3.4 Estimate Square Footage of the Irrigated Area
The other parameter that is required for estimating the annual landscape water use using the irrigation
audit method is the total landscape area in square feet. Find information on this procedure that is
described in section 2.4 titled Estimate Square Footage of the Irrigated Area.
7 A good resource to get basic information on irrigation equipment, go to the Alliance for Water Efficiency website
at: http://allianceforwaterefficiency.org/Irrigation_System_Heads_Introduction.aspx
23
3.5 Calculate your Total Annual Irrigation
To calculate the total annual landscape water use, utilize this formula:
0.6233
Note, the factor of 0.6233 converts volume of water to gallons from 1 square foot and 1 inch deep.
An irrigation audit will not only provide the precipitation rate of your system, but it can also provide the
overall effectiveness of your system. A proper irrigation audit investigates how well the irrigation
system is watering your landscape and can identify problem areas so repairs and adjustments can be
made. If you choose the irrigation audit method, consider contracting a certified irrigation auditor or a
WaterSense irrigation partner. Hiring a trained professional will ensure that the recommended
Irrigation Association guidelines are followed appropriately and that you gain beneficial information on
your irrigation system. To get more information on the Irrigation Association, go to:
http://www.irrigation.org And to get further information on how to locate a WaterSense irrigation
partners, go to: http://www.epa.gov/watersense/meet_our_partners.html
Also, some state and local organizations may offer free irrigation audits as part of water conservation
programs. Check with your water provider to see if these services may be available in your area. You
may want to start your search through the EPA WaterSense program’s website that provides a portal to
access information on water efficiency rebates across the US at:
http://www.epa.gov/watersense/rebate_finder_saving_money_water.html

24

25
4.0 Subsequent Reporting Years
Now that you’ve estimated your baseline for unmetered landscape water use, how will you document
changes in water use for subsequent reporting years? The best approach is to install meters on these
applications. This will offer you a way to check your baseline estimate and also accurately report any
consumption changes in future years. If metering is not practical, you can use this document to report
changes in water use by utilizing these same methodologies. This will not be entirely accurate, but it can
provide you a methodology to estimate changes in irrigation. The following list provides some scenarios
for estimating future changes in water use for unmetered landscape irrigation using either the ET
method or irrigation audit method:
Evapotranspiration Method:
If turf or landscape plants have been replaced with new species, choose a new annual irrigation
factor that reflects the new landscape type and apply this factor to the annual landscape water
use formula.
If the operating efficiency has changed due to better scheduling or maintenance of the irrigation
equipment, select a higher efficiency rating and apply to the annual landscape water use
formula.
Irrigation Audit Method:
If operating runtime changes, apply the new runtime to the annual landscape water use formula
If the irrigation equipment has been repaired, perform another irrigation audit to estimate a
new precipitation rate and apply to the given formulas.

26

27
5.0 Glossary
Annual Irrigation Factor: This factor represents supplemental water requirements for turf or landscaped
areas in gallons per square feet per year. The supplemental irrigation represents the amount of water
needed during a typical growing season that is not satisfied by precipitation.
Effective Precipitation (EP): Effective precipitation is defined in this document as the amount of
precipitation that is absorbed and stored in the soil, available for plants.
Evapotranspiration (ET): ET represents the loss of water from the Earth’s surface through the combined
processes of evaporation (from soil and plant surfaces) and plant transpiration (i.e., internal
evaporation). [Irrigation Association 2001]
Irrigation System Efficiency: This term represents the percentage of beneficial irrigated water that
reaches the turf or landscaped plants. For example, a system efficiency of 50% equates to half of the
water applied to the landscape area reaches the plants while the other half of the irrigated water is
wasted through inefficiencies such as runoff, broken sprinkler heads, and improper scheduling.
Landscape Water Consumption: This term is defined as the controlled application of water to outdoor
spaces that have been designed to achieve socio‐behavioral, environmental, and/or aesthetic outcomes
to supplement water requirements not satisfied by rainfall. Examples of landscaping water
consumption include (but are not limited to) irrigation of turf or landscaped beds and recreational fields.
Precipitation Rate: Precipitation rate is the amount of water that is applied to landscaped areas over a
specific length of time through irrigation equipment measured typically in inches per hour.
Reference Evapotranspiration (ETo): The reference ET rate provides the total amount of water needed
to grow high water consuming alfalfa grass during a specific time frame and location under conditions of
that area (including variables such as humidity, temperature, and wind speed). ETo does not include
rainfall received in that area. This term specifically is the amount of water that evaporates from 4‐ to 7‐
inch tall alfalfa growing in an open‐field condition over a given time frame under specific conditions for a
particular location. The units of ETo are typically provided in inches. [California Department of Water
Resources 2000]

28
29
6.0 Resources
The following links provide resources for researching water efficient strategies for landscaping and irrigation. Alliance for Water Efficiency Resource Library on Landscape, Irrigation, and Outdoor Water Use: http://allianceforwaterefficiency.org/Landscape_and_Irrigation_Library_Content_Listing.aspx
Irrigation Association ‐ Smart Water Applications Technologies (SWAT):
http://www.irrigation.org/SWAT/Industry/
WaterSense Water Budget Tool: http://www.epa.gov/watersense/nhspecs/water_budget_tool.html
Watersmart Guidebook: A Water‐Use Efficiency Plan Review Guide for New Businesses by East Bay Municipal Utility District: http://www.allianceforwaterefficiency.org/WaterSmart_Guidebook_for_Businesses.aspx
University of California Cooperative Extension Center for Landscape and Urban Horticulture: http://groups.ucanr.org/CLUH/Landscape_Irrigation_Management_and_Conservation/

30
31
7.0 References
Alliance for Water Efficiency. 2009. Irrigation Equipment Introduction Website, Chicago, IL – provided typical efficiency of irrigation systems: http://allianceforwaterefficiency.org/Irrigation_Equipment_Introduction.aspx . Accessed July 2010.
California Department of Water Resources. August 2000. A Guide to Estimating Irrigation Water Needs of Landscape Planting in California – The Landscape Coefficient Method and WUCOLS III, University of California Cooperative Extension, Sacramento, CA – provided basic methodology for calculating annual irrigation factors: www.water.ca.gov/wateruseefficiency/docs/wucols00.pdf. Accessed July 2010.
Irrigation Association. December 2001. The ASCE Standardized Reference Evapotranspiration Equation, Falls Church, VA – provided definition of evapotranspiration: http://www.irrigation.org/defaultcontent.aspx?id=844&terms=ASCE+Standardized+Reference+Evapotranspiration. Accessed July 2010.
Irrigation Association. September 2009. Recommended Audit Guidelines, Falls Church, VA –provided steps for irrigation auditing practices: http://www.irrigation.org/defaultcontent.aspx?id=842&terms=Audit+guidelines. Accessed July 2010.
University of Florida, Irrigation Research, Southwest Florida Water Management District. 2009. Turfgrass Crop Coefficients Website, Institute of Food and Agricultural Sciences Extension, Gainesville, FL – provided turfgrass crop coefficients: http://irrigation.ifas.ufl.edu/turfgrass/turfgrass‐crop‐coefficient.shtml. Accessed July 2010.
U.S. Environmental Protection Agency. March 2010. Water Budget Tool Website, N.W. Washington, D.C. – provided reference evapotranspiration and precipitation data: http://www.epa.gov/watersense/nhspecs/wb_data_finder.html. Accessed July 2010.
ZenTech. 2010. Climate Guide Website, Japan – provided the climate map: http://www2m.biglobe.ne.jp/%257eZenTech/English/Climate/USA/index.htm. Accessed July 2010.

32
Appendix
Calculations for the Annual
Irrigation Factor Tables


A‐1
Appendix -- Calculations for the Annual Irrigation Factor Tables
Information provided in the Appendix documents the approach taken to calculate the annual irrigation
factors. It is not necessary to read the Appendix to use the process outlined in the main body of the
document. But, if the reader wishes to calculate the annual irrigation factor using precise ET data of a
given location instead of utilizing the annual irrigation factors provided Tables 3 – 6 in the main body of
the report, then the Appendix can serve as a model to prepare the necessary calculations.
The type of data needed to calculate the annual irrigation factors are the following:
Reference Evapotranspiration
Turfgrass Evapotranspiration (also called crop evapotranspiration)
Landscape Evapotranspiration
Turfgrass and Landscape Coefficients
Precipitation
The following section details these factors and equations used to develop the annual irrigation factor.
Evapotranspiration
The evapotranspiration method was used to develop the data to calculate the annual irrigation factors.
This approach utilizes information on actual water requirements for specific landscape types based on
the evaporation and transpiration of the plants in the landscape.
Turfgrass Evapotranspiration
The general equation used to calculate water requirements for turfgrass is as follows [6]:
ETc Kc x ETo
Where: ETc = Turfgrass Evapotranspiration (also known as crop evapotranspiration) Kc = Turfgrass Coefficient (also known as crop coefficient)
ETo = Reference Evapotranspiration
The turfgrass evapotranspiration is amount of water (typically in inches over a given time period)
needed to maintain healthy turf for a given location. This value is adjusted based on a “reference crop”.
The reference crop is alfalfa, which is a high water‐consuming grass. In other words, water required for
all turf types whether it is Kentucky bluegrass or Bermuda grass is compared to the water needs of
alfalfa. So, the reference evapotranspiration is the total amount of water needed to grow alfalfa grass
during a specific time frame and location under typical regional conditions for that area (including
variables such as humidity, temperature, and wind speed).
A‐2
The turfgrass coefficient indicates the relative amount of water needed for the landscape compared to
the reference crop (which has a Kc of 1). This term is also referred to as crop coefficient and represents
the fraction of water lost from different species of turfgrass relative to the reference
evapotranspiration. Cool season grasses, such as fescue, have a Kc of 0.8, while warm season grasses
have a Kc of 0.6. This means that cool season grasses typically require about 80% of the water of alfalfa
to retain a healthy state while warm season grasses such as Bermuda and zoysiagrass need about 60% of
the water. [California Department of Water Resources 2000] Note the turfgrass evapotranspiration
does not include precipitation received by the location.
Landscape Evapotranspiration
The general equation used to calculate water requirements of landscaped areas which includes a
combination of plants such as shrubs, flowers, and trees is as follows [California Department of Water
Resources 2000]:
ETL KL ETo
Where: ETL = Landscape Evapotranspiration KL = Landscape Coefficient
ETo = Reference Evapotranspiration
Similar to the description above for turfgrass, landscape evapotranspiration calculates the amount of
water needed to maintain a healthy landscape. The landscape coefficient reflects the fraction of water
needed to maintain the health of a given landscape relative to the amount of water needed for the
reference crop of alfalfa. The landscape coefficient is based on three factors: 1) type of species, 2)
density of plants in the landscape, and 3) the microclimate of the landscape (e.g. protected vs. exposed).
Each of these factors are multiplied together to determine the overall landscape coefficient. Here is the
equation for landscape coefficient [California Department of Water Resources 2000]:
KL ks kd kmc
Where: ks = Species Factor kd = Density Factor
kmc = Microclimate Factor
The factors are explained below:
Species Factor (ks)
The species factor is defined by the water needs of the plants in the landscape for the given location.
The following species factors can be applied to three general landscape types:
Low ks: Plants with minimal water needs have a low ks ranging between 0.1 and 0.3
A‐3
Average ks: Plants with moderate water needs have an average ks of between 0.4 and 0.6
High ks: Plants with elevated water requirements have a high ks of between 0.7 and 0.9.
Note, if there is a mixture of plants with differing water needs, the species factor is chosen for the plant
type with the highest water requirement.
Density Factor (kd)
The density factor determines how densely populated the plants are in the landscape. The following
density factors can be applied to three general landscape types:
Low kd: Immature and sparsely planted landscape have a low kd ranging between 0.5 and 0.9
Average kd: Predominantly one vegetation type have an average kd of 1
High kd: Landscape with mixture of plant types with full coverage have a high kd ranging
between 1.1 and 1.3.
Microclimate Factor (kmc)
The microclimate factor takes into consideration the environment in which the landscape is planted.
Factors determining kmc include effects of temperature, wind, and amount of sunlight. The following
microclimate factors can be applied to three general landscape types:
Low kmc: Areas shaded from sunlight and protected from wind and heat gain have a low kmc
ranging between 0.5 and 0.9
Average kmc: Landscape areas that are in an open flat field (the same as the reference
conditions) have an average kmc of 1
High kmc: Landscape areas with intense exposure to the elements such as high heat gain or
windy conditions have a high kmc ranging between 1.1 and 1.4.
Reference ETo Rates and Precipitation Data The reference evapotranspiration (ETo)and precipitation data used in this document was provided
through the U.S. Environmental Protection Agency’s WaterSense program. WaterSense has developed a
tool called the WaterSense Landscape Water Budget Tool
(http://www.epa.gov/watersense/nhspecs/water_budget_tool.html). [U.S. Environmental Protection
Agency 2010] This tool utilizes ETo rates and precipitation developed by the International Water
Management Institute (IWMI) Climate Atlas. The IWMI Climate Atlas utilizes 30 years of historical
climate data. The data includes information by location on factors including precipitation, temperature,
humidity levels, and evaporation rates to calculate the ETo for specific locations.
A‐4
WaterSense provided monthly ETo and precipitation data for specific locations which were included in
the tables of this document. The growing season for each location was determined to be those months
where reference evapotranspiration exceeded precipitation. Also, the effective precipitation was taken
into account as well in the model which assumed that 85% of the precipitation that was received by the
landscape area was absorbed by the soil and usable by the plants.
Annual Irrigation Factor
The annual irrigation factor provided in tables of this document represents the amount of water in
gallons per square foot required to maintain a healthy landscaped or turf area over 1 year. The annual
irrigation factor takes into account the growing season for the location and plant type as well as the
amount of effective precipitation that is typically received in that area on a monthly basis. The following
formula represents the annual irrigation factor:
Where:
Annual Irrigation Factor (gallons per square foot per year) = supplemental water required to
maintain healthy landscape per square foot of landscaped area
∑ETc = sum of monthly crop or landscape coefficients during the growing season for the specific
location, in inches per month.
∑Rainfall = sum of monthly historical rainfall received during the growing season for the specific
location, in inches per month.
EP = effective precipitation factor representing the amount of precipitation that is actually
absorbed by the soil for plant growth
Cu = conversion factor of 0.6233 to convert annual irrigation from inches to gallons
The annual irrigation factor represents the sum of monthly supplemental water requirements to
maintain a healthy landscape or turf area, shown in the Tables 3 through 6 of the document. The user
of the document then multiplies the annual irrigation factor by the landscape area (square feet) and
divides by the system efficiency to calculate the estimated total irrigation needed for the year.

A‐5


![Landscaping Ideas [Read-Only]counties.agrilife.org/karnes/files/2011/08/landscaping-ideas.pdf · Landscaping Ideas. Landscaping Ideas. Landscaping Blunders. Landscaping Blunders.](https://static.fdocuments.us/doc/165x107/5fdae2a2d6608009004e5f9d/landscaping-ideas-read-only-landscaping-ideas-landscaping-ideas-landscaping.jpg)