
Guideline IEC appendices - itk.ntnu.no · PDF fileOLF Recommended Guidelines for the...
46
OLF Recommended Guidelines for the application of IEC 61508 and IEC 61511 in the petroleum activities on the Norwegian Continental Shelf No.: 070 Date effective: 01.02.2001 Revision no.: 01 Date revised: NA 1 of 46 CONTENT APPENDIX A BACKGROUND FOR MINIMUM SIL REQUIREMENTS ............................................................... 2 APPENDIX B EXAMPLES ON HOW TO DEFINE EUC ............................................................................................21 APPENDIX C EXAMPLES ON HOW TO HANDLE DEVIATIONS ........................................................................24 APPENDIX D ESTIMATION OF PROBABILITY OF FAILURE ON DEMAND................................................29 APPENDIX E LIFECYCLE PHASES FOR A TYPICAL OFFSHORE PROJECT..............................................37 APPENDIX F COLLECTION AND ANALYSIS OF RELIABILITY DATA .........................................................39
Transcript of Guideline IEC appendices - itk.ntnu.no · PDF fileOLF Recommended Guidelines for the...
OLF Recommended Guidelines for the application of IEC 61508 and IEC 61511 in the petroleumactivities on the Norwegian Continental Shelf
No.: 070 Date effective: 01.02.2001 Revision no.: 01 Date revised: NA 1 of 46
CONTENT
APPENDIX A BACKGROUND FOR MINIMUM SIL REQUIREMENTS ...............................................................2
APPENDIX B EXAMPLES ON HOW TO DEFINE EUC............................................................................................21
APPENDIX C EXAMPLES ON HOW TO HANDLE DEVIATIONS........................................................................24
APPENDIX D ESTIMATION OF PROBABILITY OF FAILURE ON DEMAND................................................29
APPENDIX E LIFECYCLE PHASES FOR A TYPICAL OFFSHORE PROJECT..............................................37
APPENDIX F COLLECTION AND ANALYSIS OF RELIABILITY DATA.........................................................39
OLF Recommended Guidelines for the application of IEC 61508 and IEC 61511 in the petroleumactivities on the Norwegian Continental Shelf
No.: 070 Date effective: 01.02.2001 Revision no.: 01 Date revised: NA 2 of 46
APPENDIX A Background for minimum SIL requirements
A.1 General
This appendix documents the background for the minimum SIL requirements as presented in Table 7.1, section 7.6,of this guideline. The formulas used in the calculations are discussed in Appendix D.
When stating minimum SIL requirements like the ones given in this guideline, one main objective should be to ensurea performance level equal to or better than today’s standard. In this regard, there are certain considerations to be madein order to avoid that the stated criteria actually result in a relaxation of the safety level. Some of these considerationsare discussed below:
- When using “conservative” failure rates and/or long test intervals for calculating the failure probability of a givenfunction, the resulting PFD ≈ =λDU ⋅ .τ / 2, becomes “high”. Accordingly, a “low” SIL value will be claimed forthe function, resulting in a “non-conservative” requirement in the minimum SIL table;
- Consequently, it is important that the input data fed into the calculations in this appendix are realistic both withrespect to the failure rates being representative for new equipment as well as the test intervals.
- For several important safety functions, the failure probability “on demand” seem to become in the order of 1.10-2
(e.g. 1.1.10-2) when calculating the PFD using “standard” reliability data and test intervals. If this results in a SIL1 requirement, there are two aspects to be kept in mind: (1) In such case the PFD can vary between 0.1 – 0.01and (2) As discussed above the historical data from e.g. from OREDA and PDS might be conservative for newequipment. Therefore, as a general rule in this appendix, a SIL N requirement has been claimed when thecalculated FPD is in the lower end of the interval of SIL N-1. E.g. when the estimated PDF = 1.1.10-2, a SIL 2requirement is given. This is also in line with the NPD requirement for continues improvements.
The failure data, which are presented below and as used in the "generic quantifications", are considered to be typicalvalues, often used in previous calculations of this type. However, it is stressed that these values should not be useduncritically in future calculations. Actually some of the input data may now be outdated, and more important, inactual calculations it is crucial that application specific data are applied whenever available and documented.
Another important aspect concerns the failure rate λDU, which is the rate of critical failures undetectable by automaticself-test. The λDU values applied in the example calculations assumes a certain diagnostic coverage, which is givenfrom the applied data source (mainly PDS - see below). It is therefore important that during the process of SILverification, the assumed diagnostic coverage factors are properly documented. This requirement will, in addition,follow from the documentation of hardware safety integrity, ref. Table 2 and 3 in IEC 61508-2, where requirements to(amongst other) diagnostic coverage (DC) and safe failure fraction (SFF) are given depending on the claimed SIL.
For the examples given here, some details are omitted, e.g. barriers, relays and signal adapters. In the finalcalculations, to prove compliance, all components and modules that may influence PFD of the function has to beincluded. In addition to the PFD requirements all other requirements has to be fulfilled, to prove compliance.
A.2 Data dossier
This section contains a collection of the reliability data used in the calculations.
With respect to the applied failure rates, these are to a large degree based upon the PDS report “Reliability Data forControl and Safety Systems, 1998 Edition” which is considered the most “up to date” database for the referredequipment.
A.2.1 Reliability Data
Table A.1 summarises the failure rates used in this appendix. λDU is here the rate of failures causing Fail-To-Operate(FTO) failures, undetectable by automatic self-test. TIF (Test Independent Failure) is the probability that a componentwhich has just been functionally tested will fail on demand, i.e. resembling the term “systematic failure” in IEC61508/61511
OLF Recommended Guidelines for the application of IEC 61508 and IEC 61511 in the petroleumactivities on the Norwegian Continental Shelf
No.: 070 Date effective: 01.02.2001 Revision no.: 01 Date revised: NA 3 of 46
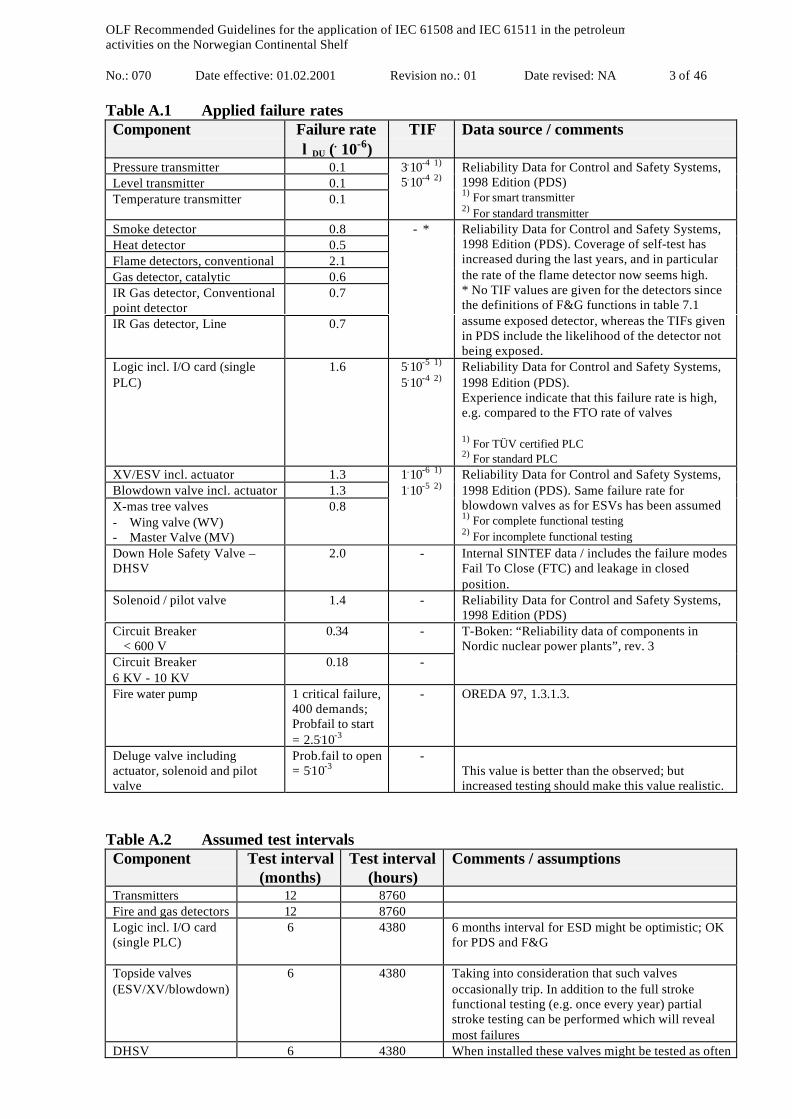
Table A.1 Applied failure ratesComponent Failure rate
λDU (. 10-6)TIF Data source / comments
Pressure transmitter 0.1Level transmitter 0.1Temperature transmitter 0.1
3.10-4 1)
5.10-4 2)Reliability Data for Control and Safety Systems,1998 Edition (PDS)1) For smart transmitter2) For standard transmitter
Smoke detector 0.8Heat detector 0.5Flame detectors, conventional 2.1Gas detector, catalytic 0.6IR Gas detector, Conventionalpoint detector
0.7
IR Gas detector, Line 0.7
- * Reliability Data for Control and Safety Systems,1998 Edition (PDS). Coverage of self-test hasincreased during the last years, and in particularthe rate of the flame detector now seems high.* No TIF values are given for the detectors sincethe definitions of F&G functions in table 7.1assume exposed detector, whereas the TIFs givenin PDS include the likelihood of the detector notbeing exposed.
Logic incl. I/O card (singlePLC)
1.6 5.10-5 1)
5.10-4 2)Reliability Data for Control and Safety Systems,1998 Edition (PDS).Experience indicate that this failure rate is high,e.g. compared to the FTO rate of valves
1) For TÜV certified PLC2) For standard PLC
XV/ESV incl. actuator 1.3Blowdown valve incl. actuator 1.3X-mas tree valves- Wing valve (WV)- Master Valve (MV)
0.8
1.10-6 1)
1.10-5 2)Reliability Data for Control and Safety Systems,1998 Edition (PDS). Same failure rate forblowdown valves as for ESVs has been assumed1) For complete functional testing2) For incomplete functional testing
Down Hole Safety Valve –DHSV
2.0 - Internal SINTEF data / includes the failure modesFail To Close (FTC) and leakage in closedposition.
Solenoid / pilot valve 1.4 - Reliability Data for Control and Safety Systems,1998 Edition (PDS)
Circuit Breaker < 600 V
0.34 -
Circuit Breaker6 KV - 10 KV
0.18 -
T-Boken: “Reliability data of components inNordic nuclear power plants”, rev. 3
Fire water pump 1 critical failure,400 demands;Probfail to start= 2.5.10-3
- OREDA 97, 1.3.1.3.
Deluge valve includingactuator, solenoid and pilotvalve
Prob.fail to open= 5.10-3
-This value is better than the observed; butincreased testing should make this value realistic.
Table A.2 Assumed test intervalsComponent Test interval
(months)Test interval
(hours)Comments / assumptions
Transmitters 12 8760Fire and gas detectors 12 8760Logic incl. I/O card(single PLC)
6 4380 6 months interval for ESD might be optimistic; OKfor PDS and F&G
Topside valves(ESV/XV/blowdown)
6 4380 Taking into consideration that such valvesoccasionally trip. In addition to the full strokefunctional testing (e.g. once every year) partialstroke testing can be performed which will revealmost failures
DHSV 6 4380 When installed these valves might be tested as often

OLF Recommended Guidelines for the application of IEC 61508 and IEC 61511 in the petroleumactivities on the Norwegian Continental Shelf
No.: 070 Date effective: 01.02.2001 Revision no.: 01 Date revised: NA 4 of 46
as each month, increasing to every third month andthen to twice a year.
Solenoid /pilot valve 6 4380Circuit Breakers 24 17520Fire water pumps - - NFPA requires weekly starts of fire water pumpsDeluge valve - -
Table A.3 below summarises the above input data with respect to resulting PFD (probability of failure on demand),i.e.:
PFD =λDU ⋅ τ /2.
When Table A.1 presents several values (as for the TIF-probability), one value within the interval is chosen in TableA.3. Finally, also some "typical" β-factors are included in Table A.3. This is partly based on the PDS Reliability Data(1998 Edition) letting β ≈ 2 ⋅ p22. The PDS values for some components are combined values for random hardwareand systematic failures. However, Table A.3 provides separate β-s for these two failure categories. An analysisperformed for Norsk Hydro (Tune) is another source for the β-factors for random hardware failures presented inTable A.3. This Hydro analysis applied the IEC 61508 approach for calculating some β-factors. According to thesedata sources the suggested β-values are perhaps somewhat optimistic. All values for random hardware failures arewithin the range that follows from the IEC approach; i.e. 0.5%<β<5% for logic, and 1%<β<10% for sensors andactuators.
It is stressed that Table A.3 in no way presents "The recommended values". They are simply "typical values" to beused in the "example calculations".
Table A.3 Summary of component reliability. Values used in example calculations.
Component Test interv.τ, (months)
Fail. rate, λDU
per 106 hrsPFD TIF-
prob.β-
factor5)
Pressure transmitter 12 0.1Level transmitter 12 0.1Temperature transmitter 12 0.1
0.44⋅10-3 3.10-4 2)2%
(5% forTIF)
Smoke detector 12 0.8 3.50⋅10-3
Heat detector 12 0.5 2.19⋅10-3
Flame detectors, conventional 12 2.1 9.20⋅10-3
Gas detector, catalytic 12 0.6 2.63⋅10-3
IR Gas detector, Conv. point detector 12 0.7IR Gas detector, Line 12 0.7 3.07⋅10-3
5.10-4 2)5%
(20% forTIF)
Logic incl. I/O card (single PLC) 6 1.6 3.50⋅10-3 1⋅10-4 1% (50%)XV/ESV incl. actuator 6 1.3 2.85⋅10-3
Blowdown valve incl. actuator 6 1.3 1) 2.85⋅10-3
X-mas tree valves (WV, MV) 6 0.8 1.75⋅10-35⋅10-6
2%(5% for
TIF)
Down Hole Safety Valve – DHSV 6 2.0 4.38⋅10-3 5⋅10-6 3) -Solenoid / pilot valve 6 1.4 3.07⋅10-3 - 4) 2%-10%6)
Circuit Breaker, < 600 V 24 0.34 2.98⋅10-3 - -.Circuit Breaker, 6 KV - 10 KV 24 0.18 1.58⋅10-3 - -Fire water pump, (fail to start) - - 2.5.10-3 - 5%Deluge valve incl. actuator, solenoidand pilot valve, (fail to open)
- - 5.0.10-3 - -
1) Use the same FTO rate as for XV/ESV, even if this is another failure mode (here Fail-To-Open)2) Suggested TIF-probability, given exposed detector3) It is suggested to use same TIF-probability as for XV/ESV4) TIF-probability for pilot is included in figure for main valve/actuator.5) Value applies to dangerous undetectable random hardware failures (duplicated system). Values inparenthesis apply for systematic failures (TIF).6) β=10% for pilot valves on the same valve, otherwise β=2%
OLF Recommended Guidelines for the application of IEC 61508 and IEC 61511 in the petroleumactivities on the Norwegian Continental Shelf
No.: 070 Date effective: 01.02.2001 Revision no.: 01 Date revised: NA 5 of 46
A.2.2 Assumed average demand rate
In this guideline, the demand rates are not used to determine the required SIL (see section 7). However, in order toallow follow-up during operation, it is considered an advantage to have some typical or average demand rates as abasis for comparison (see section 10). As proven field data is usually missing, assumed average demand rates aretherefore suggested below. As part of the requirements in section 10 of this guideline, these demand rates have to becollected separately for each installation in the future.
There are several limitations and pitfalls in using the figures presented below:• The Cause&Effect diagram for the installation will influence strongly on the dependence between the various
figures• Some figures are given per installation, not per function. Single functions repeatedly contributing to the demand
rate should be investigated• The figures should be calibrated depending on size and complexity of the process• Here, some average oil and gas processing installation is assumed• As SIL (in this guideline) is independent of the demand rates, a conservative assumption will be to assume low
demand rates as a basis for comparison• Only real demands should be counted, not spurious activation
The following assumptions were made when stipulating the annual demand rates:• It is assumed 3 demands per year for the ESD segregation. Of these 2 are manually released• For the (one assumed) automatically initiated ESD segregation, it is assumed that
- 20% comes from confirmed fire- 80% comes from confirmed gas
• The total number of exposures of single F&G detectors are assumed as- 2 fire alarms- 8 gas alarms
• 10 electric isolations are required as a consequence of detected fire or gas• Blowdown is manually activated for 2 of the 3 ESD demands• 3 isolations per well and/or riser due to ESD segregations are assumed
- in addition, it is assumed that the installation inlet also is closed 10 times due to PSD (might be aseparate/additional PSD valve depending on specific solution)
• 3 PSD segregations are assumed, all due to ESD segregation• 21 local PSD functions (pressure, level and temperature) per platform (see table for distribution)• 1 release of deluge due to confirmed fire or gas
OLF Recommended Guidelines for the application of IEC 61508 and IEC 61511 in the petroleumactivities on the Norwegian Continental Shelf
No.: 070 Date effective: 01.02.2001 Revision no.: 01 Date revised: NA 6 of 46
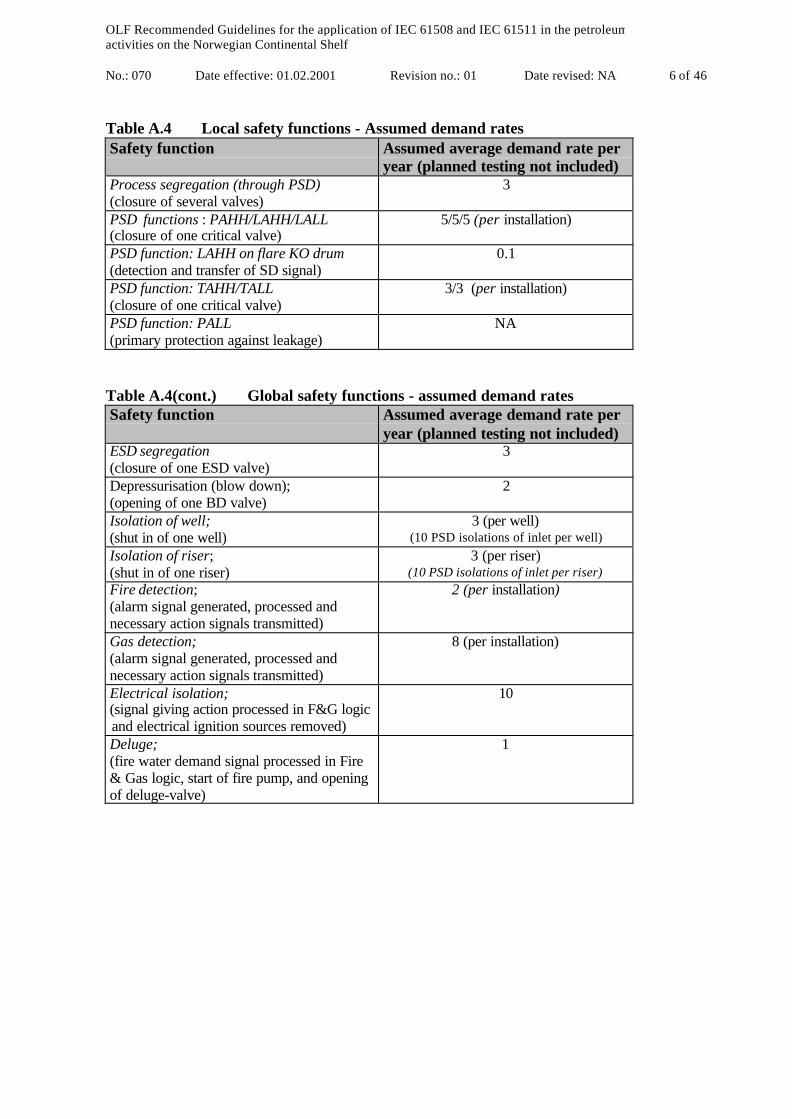
Table A.4 Local safety functions - Assumed demand ratesSafety function Assumed average demand rate per
year (planned testing not included)Process segregation (through PSD)(closure of several valves)
3
PSD functions : PAHH/LAHH/LALL(closure of one critical valve)
5/5/5 (per installation)
PSD function: LAHH on flare KO drum(detection and transfer of SD signal)
0.1
PSD function: TAHH/TALL(closure of one critical valve)
3/3 (per installation)
PSD function: PALL(primary protection against leakage)
NA
Table A.4(cont.) Global safety functions - assumed demand ratesSafety function Assumed average demand rate per
year (planned testing not included)ESD segregation(closure of one ESD valve)
3
Depressurisation (blow down);(opening of one BD valve)
2
Isolation of well;(shut in of one well)
3 (per well)(10 PSD isolations of inlet per well)
Isolation of riser;(shut in of one riser)
3 (per riser)(10 PSD isolations of inlet per riser)
Fire detection;(alarm signal generated, processed andnecessary action signals transmitted)
2 (per installation)
Gas detection;(alarm signal generated, processed andnecessary action signals transmitted)
8 (per installation)
Electrical isolation;(signal giving action processed in F&G logicand electrical ignition sources removed)
10
Deluge;(fire water demand signal processed in Fire& Gas logic, start of fire pump, and openingof deluge-valve)
1
OLF Recommended Guidelines for the application of IEC 61508 and IEC 61511 in the petroleumactivities on the Norwegian Continental Shelf
No.: 070 Date effective: 01.02.2001 Revision no.: 01 Date revised: NA 7 of 46
A.3 PSD functions
A.3.1 Process segregation through PSD
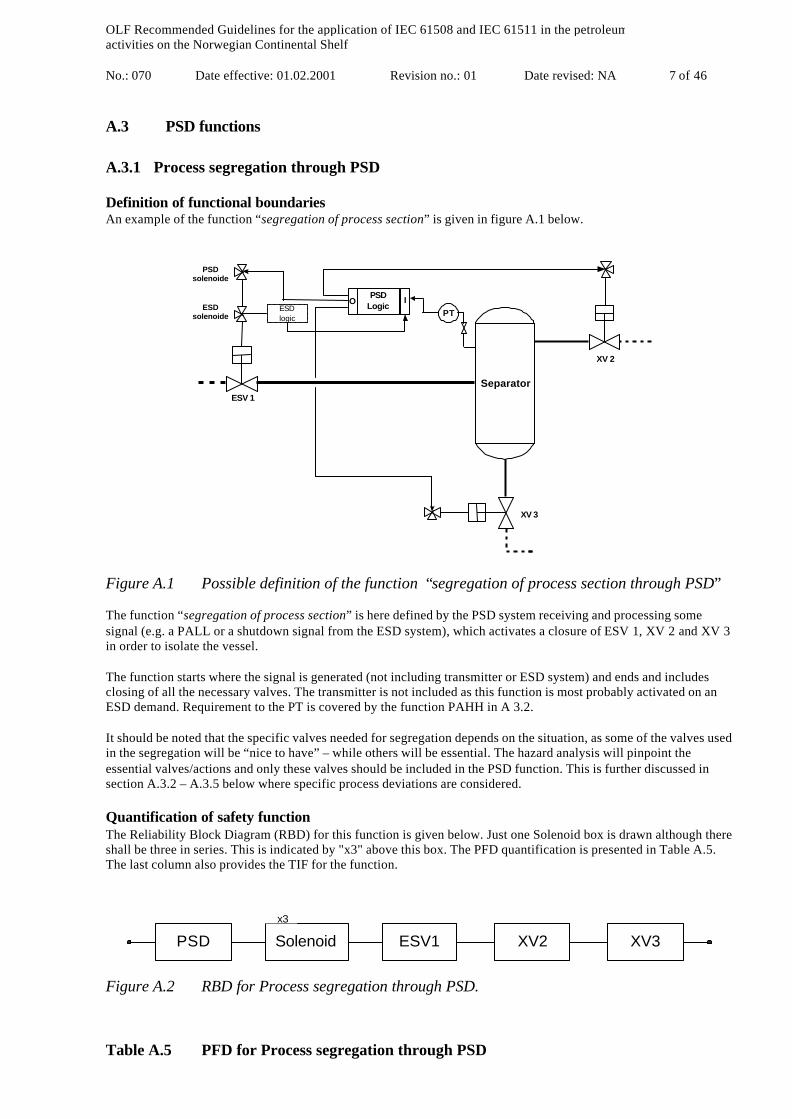
Definition of functional boundariesAn example of the function “segregation of process section” is given in figure A.1 below.
PT
PSDsolenoide
ESV 1
Separator
XV 2
XV 3
ESDsolenoide
PSDLogic
IOESDlogic
Figure A.1 Possible definition of the function “segregation of process section through PSD”
The function “segregation of process section” is here defined by the PSD system receiving and processing somesignal (e.g. a PALL or a shutdown signal from the ESD system), which activates a closure of ESV 1, XV 2 and XV 3in order to isolate the vessel.
The function starts where the signal is generated (not including transmitter or ESD system) and ends and includesclosing of all the necessary valves. The transmitter is not included as this function is most probably activated on anESD demand. Requirement to the PT is covered by the function PAHH in A 3.2.
It should be noted that the specific valves needed for segregation depends on the situation, as some of the valves usedin the segregation will be “nice to have” – while others will be essential. The hazard analysis will pinpoint theessential valves/actions and only these valves should be included in the PSD function. This is further discussed insection A.3.2 – A.3.5 below where specific process deviations are considered.
Quantification of safety functionThe Reliability Block Diagram (RBD) for this function is given below. Just one Solenoid box is drawn although thereshall be three in series. This is indicated by "x3" above this box. The PFD quantification is presented in Table A.5.The last column also provides the TIF for the function.
Figure A.2 RBD for Process segregation through PSD.
Table A.5 PFD for Process segregation through PSD
SolenoidPSD ESV1 XV2 XV3
x3
OLF Recommended Guidelines for the application of IEC 61508 and IEC 61511 in the petroleumactivities on the Norwegian Continental Shelf
No.: 070 Date effective: 01.02.2001 Revision no.: 01 Date revised: NA 8 of 46
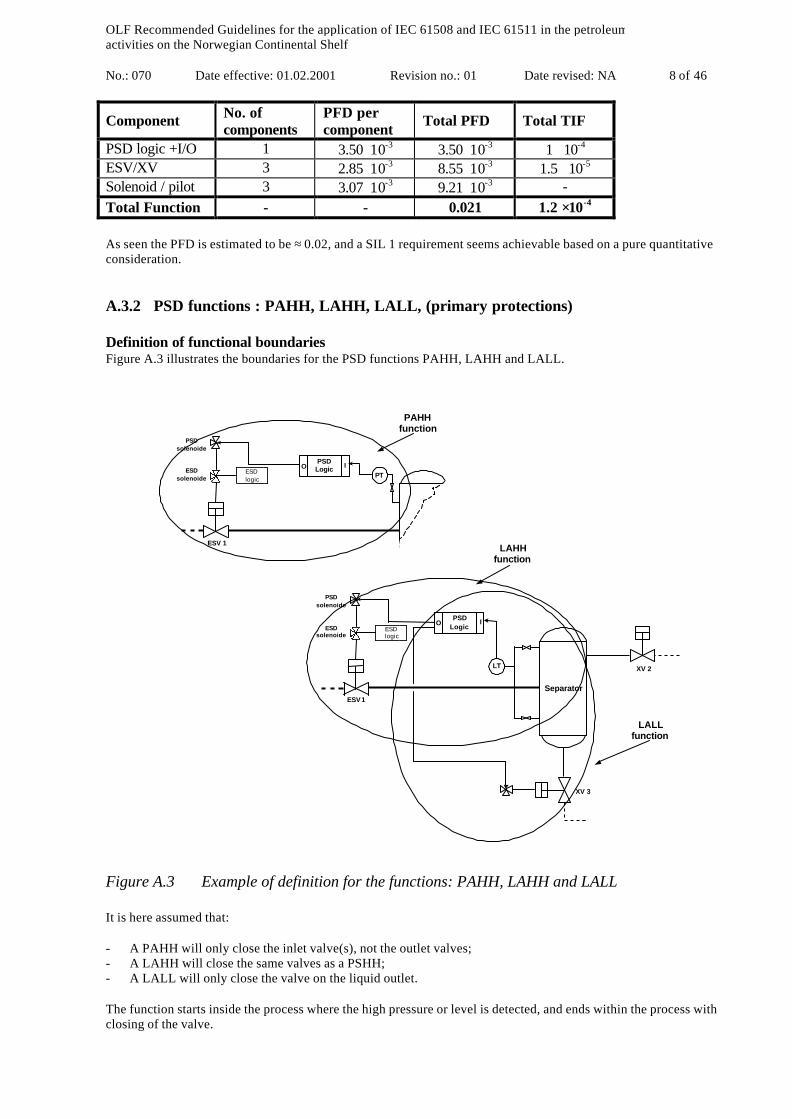
Component No. ofcomponents
PFD percomponent Total PFD Total TIF
PSD logic +I/O 1 3.50⋅ 10-3 3.50⋅ 10-3 1 ⋅ 10-4
ESV/XV 3 2.85⋅ 10-3 8.55⋅ 10-3 1.5 ⋅ 10-5
Solenoid / pilot 3 3.07⋅ 10-3 9.21⋅ 10-3 -Total Function - - 0.021 1.2 ⋅ 10-4
As seen the PFD is estimated to be ≈ 0.02, and a SIL 1 requirement seems achievable based on a pure quantitativeconsideration.
A.3.2 PSD functions : PAHH, LAHH, LALL, (primary protections)
Definition of functional boundariesFigure A.3 illustrates the boundaries for the PSD functions PAHH, LAHH and LALL.
PT
PSDsolenoide
ESV 1
Separator
ESDsolenoide
PSDLogic IO
ESDlogic
LT
PSDsolenoide
ESV 1
Separator
XV 2
XV 3
ESDsolenoide
PSDLogic
IOESDlogic
PAHHfunction
LAHHfunction
LALLfunction
Figure A.3 Example of definition for the functions: PAHH, LAHH and LALL
It is here assumed that:
- A PAHH will only close the inlet valve(s), not the outlet valves;- A LAHH will close the same valves as a PSHH;- A LALL will only close the valve on the liquid outlet.
The function starts inside the process where the high pressure or level is detected, and ends within the process withclosing of the valve.
OLF Recommended Guidelines for the application of IEC 61508 and IEC 61511 in the petroleumactivities on the Norwegian Continental Shelf
No.: 070 Date effective: 01.02.2001 Revision no.: 01 Date revised: NA 9 of 46
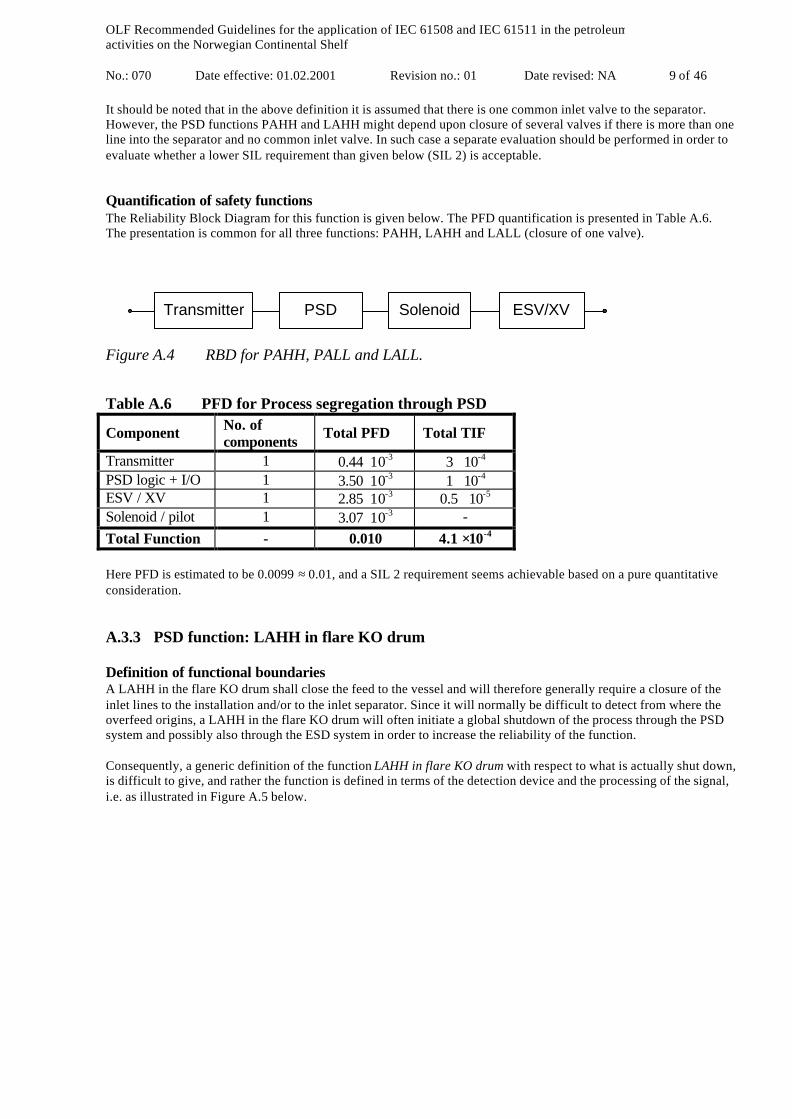
It should be noted that in the above definition it is assumed that there is one common inlet valve to the separator.However, the PSD functions PAHH and LAHH might depend upon closure of several valves if there is more than oneline into the separator and no common inlet valve. In such case a separate evaluation should be performed in order toevaluate whether a lower SIL requirement than given below (SIL 2) is acceptable.
Quantification of safety functionsThe Reliability Block Diagram for this function is given below. The PFD quantification is presented in Table A.6.The presentation is common for all three functions: PAHH, LAHH and LALL (closure of one valve).
Figure A.4 RBD for PAHH, PALL and LALL.
Table A.6 PFD for Process segregation through PSD
Component No. ofcomponents Total PFD Total TIF
Transmitter 1 0.44⋅ 10-3 3 ⋅ 10-4
PSD logic + I/O 1 3.50⋅ 10-3 1 ⋅ 10-4
ESV / XV 1 2.85⋅ 10-3 0.5 ⋅ 10-5
Solenoid / pilot 1 3.07⋅ 10-3 -Total Function - 0.010 4.1 ⋅ 10-4
Here PFD is estimated to be 0.0099 ≈ 0.01, and a SIL 2 requirement seems achievable based on a pure quantitativeconsideration.
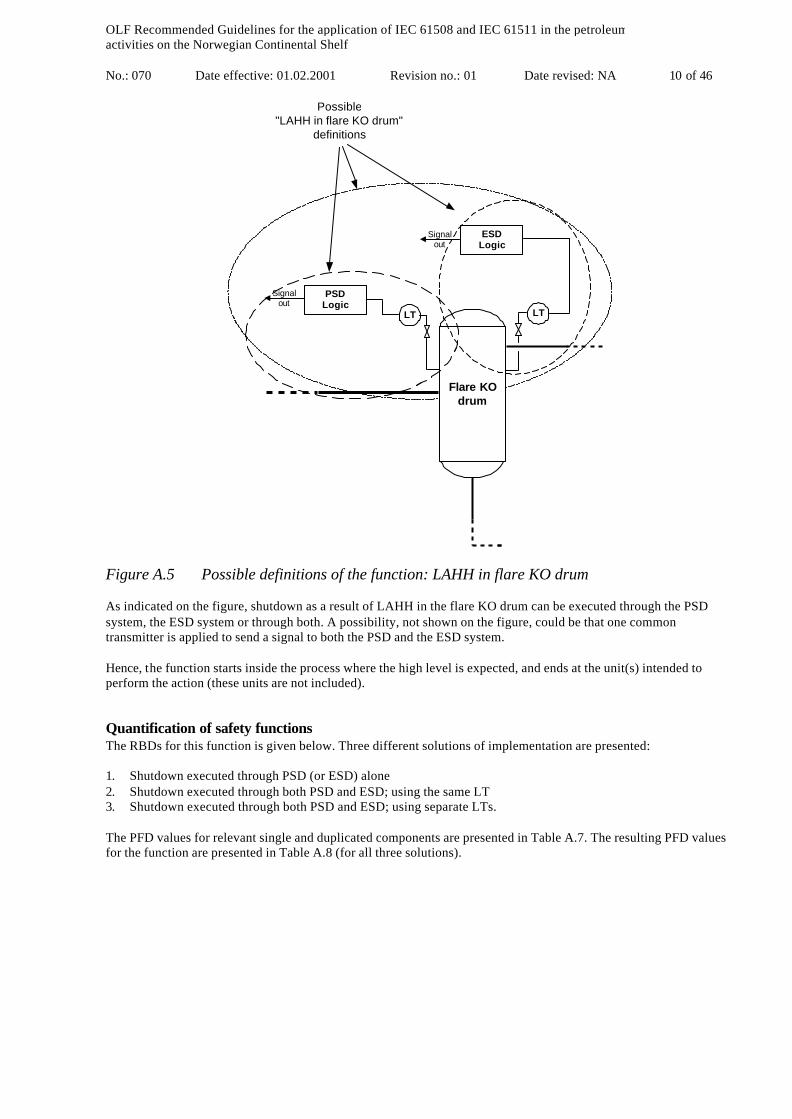
A.3.3 PSD function: LAHH in flare KO drum
Definition of functional boundariesA LAHH in the flare KO drum shall close the feed to the vessel and will therefore generally require a closure of theinlet lines to the installation and/or to the inlet separator. Since it will normally be difficult to detect from where theoverfeed origins, a LAHH in the flare KO drum will often initiate a global shutdown of the process through the PSDsystem and possibly also through the ESD system in order to increase the reliability of the function.
Consequently, a generic definition of the function LAHH in flare KO drum with respect to what is actually shut down,is difficult to give, and rather the function is defined in terms of the detection device and the processing of the signal,i.e. as illustrated in Figure A.5 below.
PSDTransmitter Solenoid ESV/XV
OLF Recommended Guidelines for the application of IEC 61508 and IEC 61511 in the petroleumactivities on the Norwegian Continental Shelf
No.: 070 Date effective: 01.02.2001 Revision no.: 01 Date revised: NA 10 of 46
LT
Flare KOdrum
PSDLogic
LT
ESDLogic
Signalout
Signalout
Possible"LAHH in flare KO drum"
definitions
Figure A.5 Possible definitions of the function: LAHH in flare KO drum
As indicated on the figure, shutdown as a result of LAHH in the flare KO drum can be executed through the PSDsystem, the ESD system or through both. A possibility, not shown on the figure, could be that one commontransmitter is applied to send a signal to both the PSD and the ESD system.
Hence, the function starts inside the process where the high level is expected, and ends at the unit(s) intended toperform the action (these units are not included).
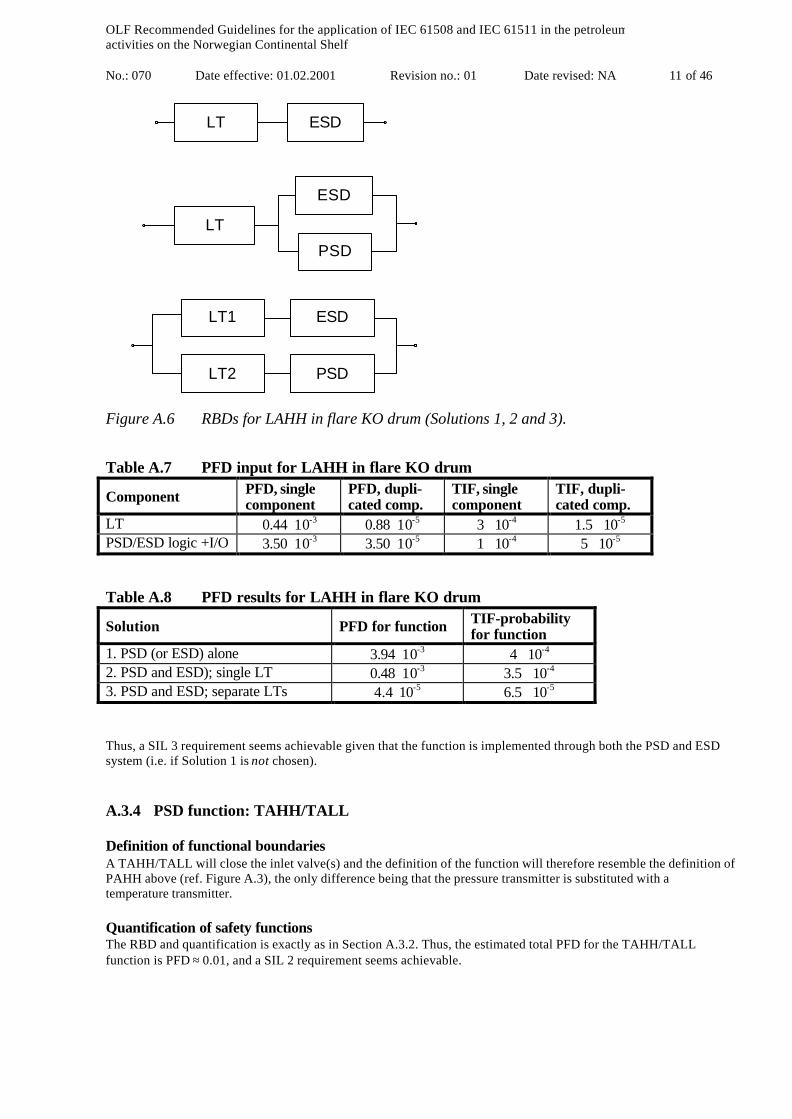
Quantification of safety functionsThe RBDs for this function is given below. Three different solutions of implementation are presented:
1. Shutdown executed through PSD (or ESD) alone2. Shutdown executed through both PSD and ESD; using the same LT3. Shutdown executed through both PSD and ESD; using separate LTs.
The PFD values for relevant single and duplicated components are presented in Table A.7. The resulting PFD valuesfor the function are presented in Table A.8 (for all three solutions).
OLF Recommended Guidelines for the application of IEC 61508 and IEC 61511 in the petroleumactivities on the Norwegian Continental Shelf
No.: 070 Date effective: 01.02.2001 Revision no.: 01 Date revised: NA 11 of 46
Figure A.6 RBDs for LAHH in flare KO drum (Solutions 1, 2 and 3).
Table A.7 PFD input for LAHH in flare KO drum
Component PFD, singlecomponent
PFD, dupli-cated comp.
TIF, singlecomponent
TIF, dupli-cated comp.
LT 0.44⋅ 10-3 0.88⋅ 10-5 3 ⋅ 10-4 1.5 ⋅ 10-5
PSD/ESD logic +I/O 3.50⋅ 10-3 3.50⋅ 10-5 1 ⋅ 10-4 5 ⋅ 10-5
Table A.8 PFD results for LAHH in flare KO drum
Solution PFD for function TIF-probabilityfor function
1. PSD (or ESD) alone 3.94⋅ 10-3 4 ⋅ 10-4
2. PSD and ESD); single LT 0.48⋅ 10-3 3.5 ⋅ 10-4
3. PSD and ESD; separate LTs 4.4⋅ 10-5 6.5 ⋅ 10-5
Thus, a SIL 3 requirement seems achievable given that the function is implemented through both the PSD and ESDsystem (i.e. if Solution 1 is not chosen).
A.3.4 PSD function: TAHH/TALL
Definition of functional boundariesA TAHH/TALL will close the inlet valve(s) and the definition of the function will therefore resemble the definition ofPAHH above (ref. Figure A.3), the only difference being that the pressure transmitter is substituted with atemperature transmitter.
Quantification of safety functionsThe RBD and quantification is exactly as in Section A.3.2. Thus, the estimated total PFD for the TAHH/TALLfunction is PFD ≈ 0.01, and a SIL 2 requirement seems achievable.
LT ESD
ESD
LT
PSD
LT1 ESD
LT2 PSD
OLF Recommended Guidelines for the application of IEC 61508 and IEC 61511 in the petroleumactivities on the Norwegian Continental Shelf
No.: 070 Date effective: 01.02.2001 Revision no.: 01 Date revised: NA 12 of 46
A.3.5 PSD function: PALL (primary protection against leakage)
Definition of functional boundariesThe PALL function is frequently applied as primary protection against leakage (in addition to gas detection) and willnormally initiate a closure of both the inlet and outlet valves. Consequently, this particular PSD function is similar tothe function “segregation of process section “ as described in section A.3.1 above. Since the reliability of the lowpressure detection itself is highly uncertain for all leaks except very large ones, the definition of PALL should be asfor segregation of process section, i.e. excluding the sensor device.
Hence, the function starts inside the process where the low pressure is expected, and ends within the process with thevalve.
Quantification of safety functionNo special requirements apply according to this guideline. This requires that adequate automatic gas detection isprovided to cover the leakage. It should, however, be noted that excluding the sensor device, the function fulfils a SIL1 requirement.
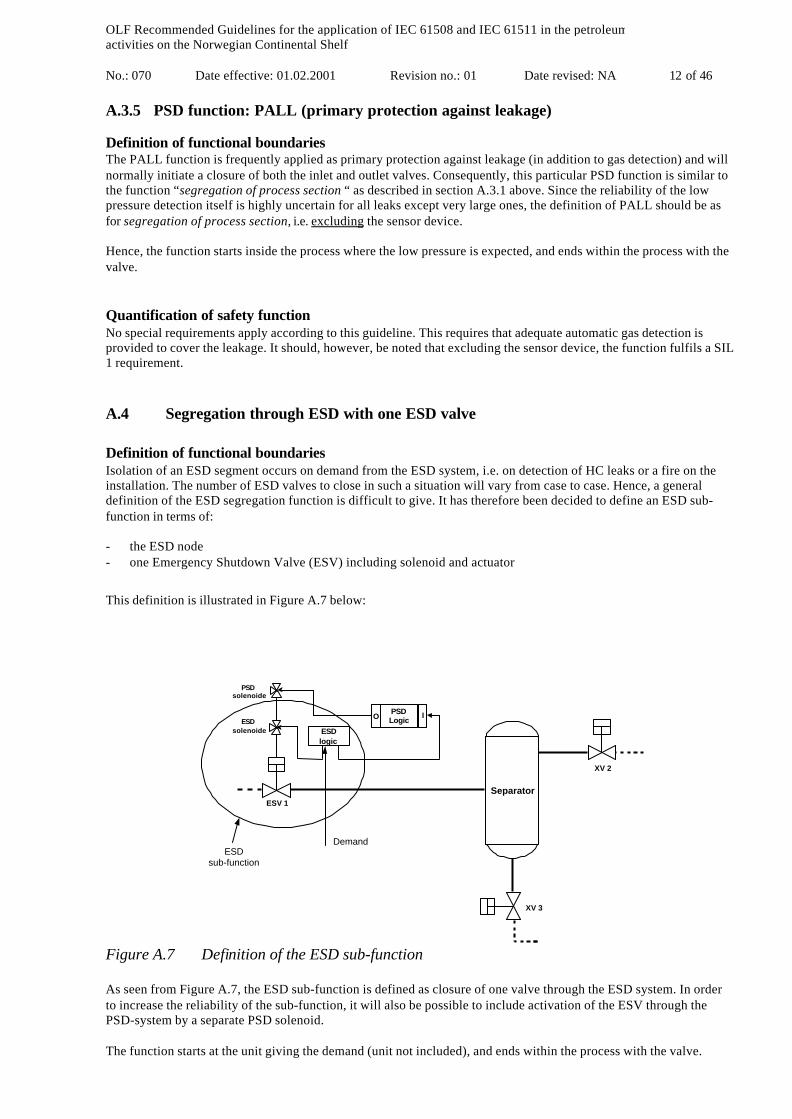
A.4 Segregation through ESD with one ESD valve
Definition of functional boundariesIsolation of an ESD segment occurs on demand from the ESD system, i.e. on detection of HC leaks or a fire on theinstallation. The number of ESD valves to close in such a situation will vary from case to case. Hence, a generaldefinition of the ESD segregation function is difficult to give. It has therefore been decided to define an ESD sub-function in terms of:
- the ESD node- one Emergency Shutdown Valve (ESV) including solenoid and actuator
This definition is illustrated in Figure A.7 below:
PSDsolenoide
ESV 1
Separator
XV 2
XV 3
ESDsolenoide
PSDLogic
IO
ESDlogic
ESDsub-function
Demand
Figure A.7 Definition of the ESD sub-function
As seen from Figure A.7, the ESD sub-function is defined as closure of one valve through the ESD system. In orderto increase the reliability of the sub-function, it will also be possible to include activation of the ESV through thePSD-system by a separate PSD solenoid.
The function starts at the unit giving the demand (unit not included), and ends within the process with the valve.
OLF Recommended Guidelines for the application of IEC 61508 and IEC 61511 in the petroleumactivities on the Norwegian Continental Shelf
No.: 070 Date effective: 01.02.2001 Revision no.: 01 Date revised: NA 13 of 46
Quantification of safety functionsThe Reliability Block Diagram for this function is given below. The PFD quantification is presented in Table A.9.
Figure A.8 RBD for ESD sub-function (Segregation through ESD with one ESD valve).
Table A.9 PFD for Segregation through ESD
Component No. ofcomponents Total PFD Total TIF
ESD logic + I/O 1 3.50⋅ 10-3 1 ⋅ 10-4
ESV 1 2.85⋅ 10-3 0.5 ⋅ 10-5
Solenoid / pilot 1 3.07⋅ 10-3 -Total Function - 0.009 1.1 ⋅ 10-4
Here PFD is estimated to be 0.009, and based on a pure quantitative consideration a SIL 2 requirement seemsachievable for this ESD sub-function.
A quantitative risk analysis should be conducted to verify that the minimum SIL-requirement gives an overallacceptable risk when all the ESD valves are taken into consideration. The following should then be considered:
- number of ESD-valves needed to isolate each fire area- scenarios where the system is demanded (e.g. leak and fire scenarios)- process conditions (pressure, temperature) and duration of leaks and fires.- common cause failures- etc.
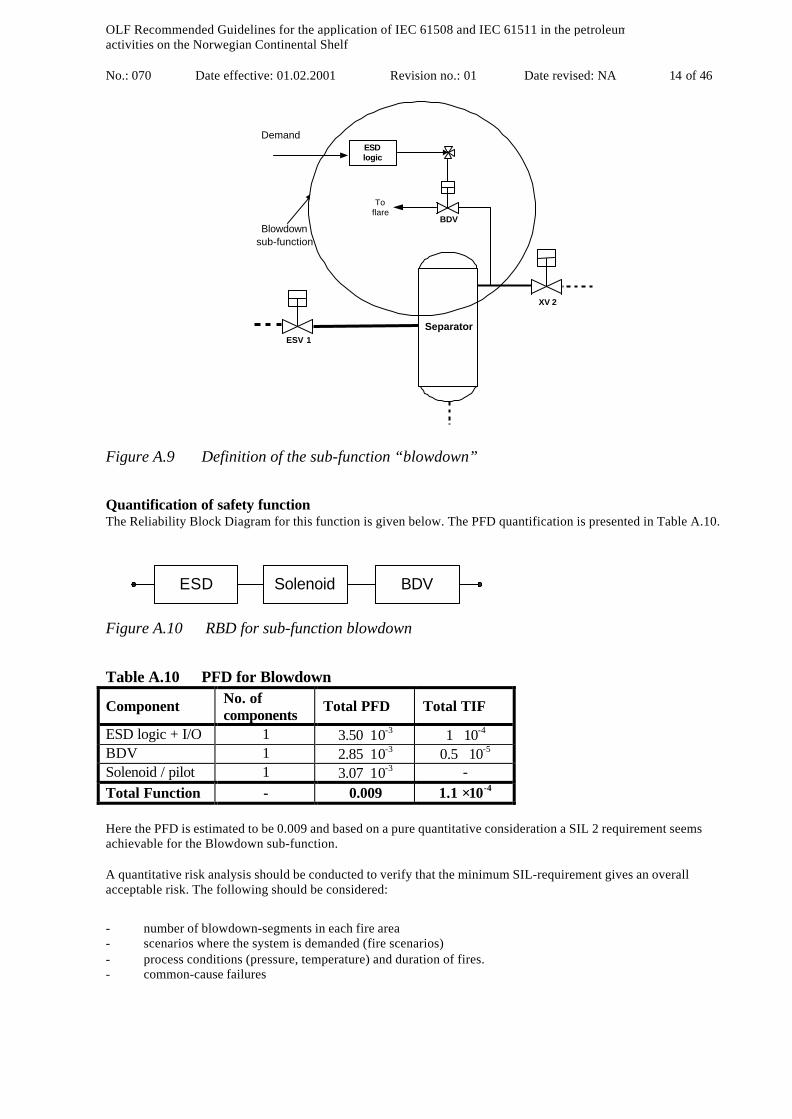
A.5 Blowdown
Definition of functional boundariesThe sub-function blowdown includes:
- the ESD node- one blowdown valve (BDV) incl. solenoid and actuator
The function starts at the unit giving the demand (unit not included), and ends with the inventory having free accessthrough the BDV.
The probability of successful manual blowdown activation is not included in the definition of the function. Figure A.9illustrates the sub-function “blowdown”.
ESD Solenoid ESV
OLF Recommended Guidelines for the application of IEC 61508 and IEC 61511 in the petroleumactivities on the Norwegian Continental Shelf
No.: 070 Date effective: 01.02.2001 Revision no.: 01 Date revised: NA 14 of 46
ESV 1
Separator
XV 2
ESDlogic
BDV
Toflare
Blowdownsub-function
Demand
Figure A.9 Definition of the sub-function “blowdown”
Quantification of safety functionThe Reliability Block Diagram for this function is given below. The PFD quantification is presented in Table A.10.
Figure A.10 RBD for sub-function blowdown
Table A.10 PFD for Blowdown
Component No. ofcomponents Total PFD Total TIF
ESD logic + I/O 1 3.50⋅ 10-3 1 ⋅ 10-4
BDV 1 2.85⋅ 10-3 0.5 ⋅ 10-5
Solenoid / pilot 1 3.07⋅ 10-3 -Total Function - 0.009 1.1 ⋅ 10-4
Here the PFD is estimated to be 0.009 and based on a pure quantitative consideration a SIL 2 requirement seemsachievable for the Blowdown sub-function.
A quantitative risk analysis should be conducted to verify that the minimum SIL-requirement gives an overallacceptable risk. The following should be considered:
- number of blowdown-segments in each fire area- scenarios where the system is demanded (fire scenarios)- process conditions (pressure, temperature) and duration of fires.- common-cause failures
ESD Solenoid BDV
OLF Recommended Guidelines for the application of IEC 61508 and IEC 61511 in the petroleumactivities on the Norwegian Continental Shelf
No.: 070 Date effective: 01.02.2001 Revision no.: 01 Date revised: NA 15 of 46
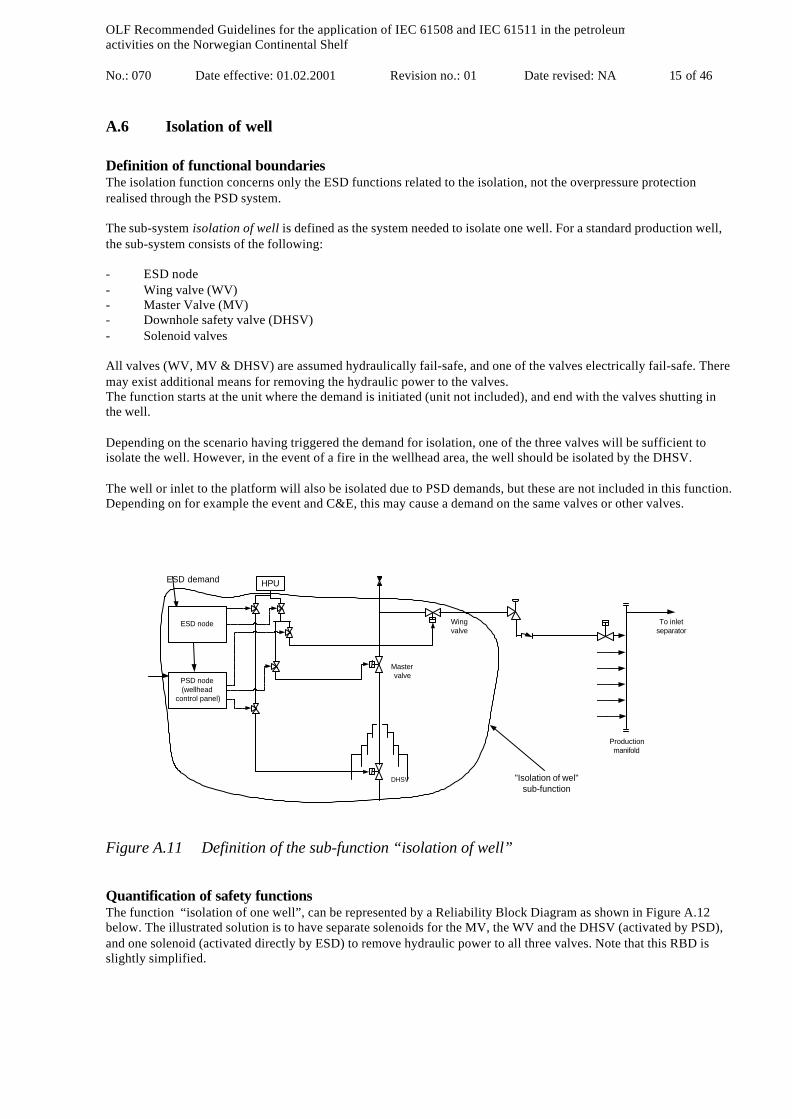
A.6 Isolation of well
Definition of functional boundariesThe isolation function concerns only the ESD functions related to the isolation, not the overpressure protectionrealised through the PSD system.
The sub-system isolation of well is defined as the system needed to isolate one well. For a standard production well,the sub-system consists of the following:
- ESD node- Wing valve (WV)- Master Valve (MV)- Downhole safety valve (DHSV)- Solenoid valves
All valves (WV, MV & DHSV) are assumed hydraulically fail-safe, and one of the valves electrically fail-safe. Theremay exist additional means for removing the hydraulic power to the valves.The function starts at the unit where the demand is initiated (unit not included), and end with the valves shutting inthe well.
Depending on the scenario having triggered the demand for isolation, one of the three valves will be sufficient toisolate the well. However, in the event of a fire in the wellhead area, the well should be isolated by the DHSV.
The well or inlet to the platform will also be isolated due to PSD demands, but these are not included in this function.Depending on for example the event and C&E, this may cause a demand on the same valves or other valves.
Productionmanifold
DHSV
To inletseparator
Mastervalve
Wingvalve
PSD node(wellhead
control panel)
"Isolation of wel"sub-function
HPUESD demand
ESD node
Figure A.11 Definition of the sub-function “isolation of well”
Quantification of safety functionsThe function “isolation of one well”, can be represented by a Reliability Block Diagram as shown in Figure A.12below. The illustrated solution is to have separate solenoids for the MV, the WV and the DHSV (activated by PSD),and one solenoid (activated directly by ESD) to remove hydraulic power to all three valves. Note that this RBD isslightly simplified.
OLF Recommended Guidelines for the application of IEC 61508 and IEC 61511 in the petroleumactivities on the Norwegian Continental Shelf
No.: 070 Date effective: 01.02.2001 Revision no.: 01 Date revised: NA 16 of 46
PSD Solenoid 2
Solenoid 1
Solenoid 3
Solenoid, ESD
ESD
WV
MV
DHSV
Figure A.12 RBD for “failure to isolate one well”
The calculations are presented in Table A.11, and the result in Table A.12. The quantifications assume common causefailure between the master and the wing valve, but not between MV/WV and DHSV. The essential contribution isfrom the ESD-system. In addition, the quantification here gives a small contribution from common cause failures ofthe solenoids, (as the IEC model gives the same result for common cause failure, irrespective of whether there is a1oo2, 1oo3 or 1oo4 configuration).
Table A.11 PFD input for isolation of one well
Component PFD, singlecomponent
PFD, dupli-cated comp.
TIF, singlecomponent
TIF, dupli-cated comp.
ESD/PSD logic +I/O 3.50⋅ 10-3 - 1 ⋅ 10-4 -Solenoid 3.07⋅ 10-3 6.14⋅ 10-5 1) - -MV /WV 1.75⋅ 10-3 3.50⋅ 10-5 5 ⋅ 10-6 0.3⋅ 10-6
DHSV 4.38⋅ 10-3 - 5 ⋅ 10-6 -1) The standard β-factor model used here gives (essentially) same result for the 1oo4, 1oo3 and 1oo2 voting (cf.Appendix D). A more refined modelling would give a better value for 1oo3 with a factor 3.
Table A.12 PFD results for isolation of one well.
Solution PFD for function TIF-probabilityfor function
1. Separate solenoids for MV,WVand DHSV. Additional "ESDsolenoid" to remove hydraulic powerto valves,
3.6 ⋅ 10-3 1) 1 ⋅ 10-4
1) Would be 3.5 ⋅ 10-3 if the more refined β-factor model for 1oo3 (1oo4) voting of solenoids was applied.
Here PFD is estimated to be 0.0036, and based on a pure quantitative consideration SIL 2 requirement is achievablefor the isolation of a single well. By introducing a redundant ESD-logic (1oo2 voting), the example calculation wouldgive PFD = 4 ⋅ 10-5, and SIL 3 is clearly achievable.
Since isolation of the well is considered a crucial safety function, and since three valves are available for isolation, aSIL 3 requirement has been stated. As observed, this can be achieved by introducing redundancy with respect tosafety in the ESD logic.
A quantitative risk analysis should be conducted to verify that the minimum SIL-requirement gives an acceptable riskwhen the total number of wells are taken into consideration. The following should be considered:
- Number of wells- Production / injection wells with or without gas-lift- Wells in connection with special operations, such as wireline, coiled tubing, workover, testing, cleanup, etc.
OLF Recommended Guidelines for the application of IEC 61508 and IEC 61511 in the petroleumactivities on the Norwegian Continental Shelf
No.: 070 Date effective: 01.02.2001 Revision no.: 01 Date revised: NA 17 of 46
A simplified example of how a verification of the stated SIL 3 requirement can be performed using QRA, is given inAppendix C.2.
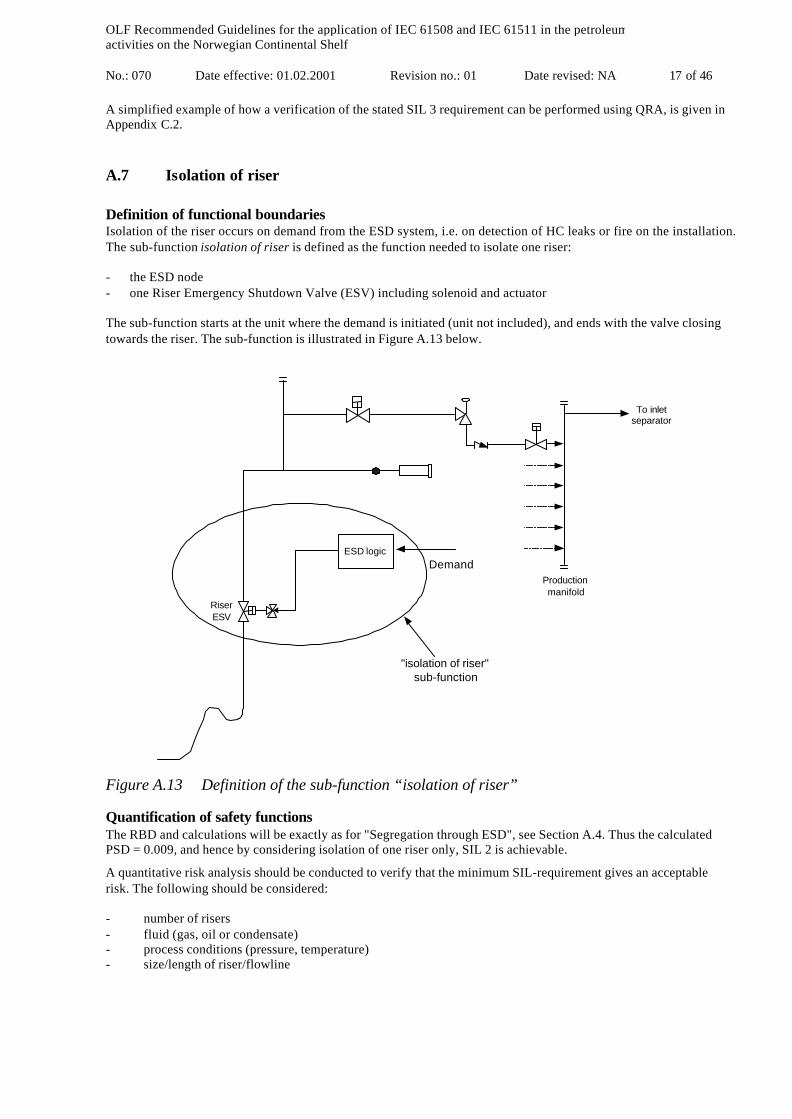
A.7 Isolation of riser
Definition of functional boundariesIsolation of the riser occurs on demand from the ESD system, i.e. on detection of HC leaks or fire on the installation.The sub-function isolation of riser is defined as the function needed to isolate one riser:
- the ESD node- one Riser Emergency Shutdown Valve (ESV) including solenoid and actuator
The sub-function starts at the unit where the demand is initiated (unit not included), and ends with the valve closingtowards the riser. The sub-function is illustrated in Figure A.13 below.
Productionmanifold
RiserESV
To inletseparator
ESD logic
"isolation of riser"sub-function
Demand
Figure A.13 Definition of the sub-function “isolation of riser”
Quantification of safety functionsThe RBD and calculations will be exactly as for "Segregation through ESD", see Section A.4. Thus the calculatedPSD = 0.009, and hence by considering isolation of one riser only, SIL 2 is achievable.
A quantitative risk analysis should be conducted to verify that the minimum SIL-requirement gives an acceptablerisk. The following should be considered:
- number of risers- fluid (gas, oil or condensate)- process conditions (pressure, temperature)- size/length of riser/flowline
OLF Recommended Guidelines for the application of IEC 61508 and IEC 61511 in the petroleumactivities on the Norwegian Continental Shelf
No.: 070 Date effective: 01.02.2001 Revision no.: 01 Date revised: NA 18 of 46
A.8 Fire detection
Definition of functional boundaries
The Fire & Gas detection system consists mainly of detectors and Fire&Gas logic solvers. Fire detection is generallybased on three principles, i.e. smoke detection, heat detection and flame detection:
- For smoke detection the sub-function starts when the smoke has entered the detection chamber, and ends with thesignal given from the F&G system.
- For heat detection the sub-function starts when the radiation has entered the detection chamber, and ends with thesignal given from the F&G system.
- For flame detection the sub-function starts when the flames are present at the detection device, and ends with thesignal given from the F&G system.
Note that the fire detection sub-function is defined in terms of one single detector.
Quantification of safety functions
The RBD is presented in Figure A.14. The PFDs for the three cases, smoke detection, heat detection and flamedetection are presented in Table A.13. This indicates that SIL 2 may be realistic, but the present quantification gives aPFD > 0.01 for flame detection (based on conservative data).
Figure A.14 RBD for fire detection sub-function
Table A.13 PFD and TIF results for fire detection.
Function PFD for function 1) TIF-probabilityfor function
1. Smoke detection 0.0072. Heat detection 0.0063. Flame detection 0.013
6⋅ 10-4
1) Failure data for detectors and logic are considered conservative. Diagnostic coverage for fire detectors haveincreased during the last years.
If a fire-central or some other logic’s is used to interface between the detector and the F&G, this has to included in thecalculations.
A.9 Gas detection
Definition of functional barriersGas detection is in general based on two different principles; point detection and line detection:
- For point detectors the function starts when the gas has entered the detection chamber, and ends with the signalgiven from the F&G system.
- For line detectors the function starts when the gas has entered the beam, and ends with the signal given from theF&G system.
The F&G detection system will have different actions based on configuration of the logic. There are different actionsdepending on where the gas is detected, and typically for new platforms (signal is given at 20% of LEL);
- 1ooN detectors will give an alarm in CCR.- 1ooN detectors in non-hazardous areas will give electrical isolation of this area.- 2ooN in any area will give electrical isolation and stop production.
Detector F&G
OLF Recommended Guidelines for the application of IEC 61508 and IEC 61511 in the petroleumactivities on the Norwegian Continental Shelf
No.: 070 Date effective: 01.02.2001 Revision no.: 01 Date revised: NA 19 of 46
Here, the gas detection sub-function is defines in terms of one single detector.
Quantification of safety functionThe RBD for a single gas detector is identical to that for fire detection (Figure A.14). The quantification for gasdetection is given in Table A.14.
Table A.14 PFD and TIF results for gas detection sub-function (i.e. single detector)
Function PFD for function TIF-probabilityfor function
1. Catalytic detector 0.0062. IR gas detector, conven. point det. 0.0073. IR gas detector, line detector 0.007
6⋅ 10-4
From the table it is seen that a SIL 2 requirement is achievable.
It should be noted that in Appendix D.7, some example calculations have been performed for different types of gasdetection voting configurations.
A.10 Electrical isolation
Definition of functional barriersThe SIL-requirement applies for the subsystem needed for electrical isolation given signal from F&G node, i.e:
- F&G node- Circuit breakers / relay
The function starts at the unit initiating the demand (unit not included), and ends when the equipment is isolated.
Electric isolation is initiated from by F&G detection system. There are different actions depending on where the gasis detected. On new platforms, 1ooN detection in non-hazardous area gives electrical isolation of this area, while2ooN in any area isolates this area or shut down main power.
Quantification of safety functionThe RBD is presented in Figure A.15, for the case of 6 circuit breakers (CB). The PFD values are presented in TableA.15, using data for 600V circuit breakers. In this case it is not straightforward to achieve SIL 2. Using the data fromTable A.3 would allow only 2 CB to get SIL 2. Of course, test interval < 24 months would help. Observe that the CBof 6KV has a lower PFD. To conclude, the SIL 2 requirement can be achieved if only a few circuit breakers need toopen.
Figure A.15 RBD for Fire detection
Table A.15 PFD results for Electrical isolation. Example with 6 circuit breakers
Component No. ofcomponents
PFD percomponent Total PFD Total TIF
F&G logic + I/O 1 3.50⋅ 10-3 3.5⋅ 10-3 1 ⋅ 10-4
Circ. Breaker (600V) 6 2.98⋅ 10-3 17.9⋅ 10-3
Total Function - - 0.05 1 ⋅ 10-4
F&G Circ. breaker/relay
x6
OLF Recommended Guidelines for the application of IEC 61508 and IEC 61511 in the petroleumactivities on the Norwegian Continental Shelf
No.: 070 Date effective: 01.02.2001 Revision no.: 01 Date revised: NA 20 of 46
A.11 Deluge
Definition of functional boundariesThe system boundaries includes the fire water demand signal processed in the fire pump logic, start of fire pumps,and opening of one deluge-valves (given confirmed fire).
- F&G node- The nozzles, water intake, strainers, ring main etc. are not included but are assumed covered by inspection and
maintenance program.- The pump system consists of 2x100 % capacity pumps
The function starts at the unit initiating the demand (unit not included), and end when there is flowing water throughthe deluge valve.
Quantification of safety functionThe RBD is presented in Figure A.16. The resulting PFD calculations are given in Table A.16. These quantificationsindicate that SIL 2 can be achieved.
Figure A.16 Reliability block diagram for deluge function
Table A.16 PFD results for deluge
Component Voting PFD percomponent System PFD System TIF
F&G logic + I/O 1oo1 3.5⋅ 10-3 3.50⋅ 10-3 1 ⋅ 10-4
F-W pump 1oo2 2.5⋅ 10-3 0.13⋅ 10-3 -Deluge valve 1oo1 5.0⋅ 10-3 5.00⋅ 10-3 -Total Function - - 0.009 5.1 ⋅ 10-4
F-W pump1
F&G
F-W pump2DelugeV
OLF Recommended Guidelines for the application of IEC 61508 and IEC 61511 in the petroleumactivities on the Norwegian Continental Shelf
No.: 070 Date effective: 01.02.2001 Revision no.: 01 Date revised: NA 21 of 46
APPENDIX B Examples on how to define EUC
IEC 61508 does not give any particular requirements as to how the EUC should be defined. Hence, it is entirelywithin the hands of those who wish to claim conformance to the standard to define the scope and boundary of thesystem to be considered. The important point will be that the EUC boundaries are clearly defined and in a mannersuch that all the relevant hazards to be considered in later lifecycle stages can be identified and described.
However, since definition of EUC is an important aspect of IEC 61508, section 7.3.1 and 7.3.2 of the guidelinebriefly discuss how EUC can be defined for local and global safety functions respectively. In this appendix, anexample of a possible EUC definition is given for each type of these safety functions.
B.1 Definition of EUC for local safety functionsWith respect to identification of hazards against which the local safety functions will protect, this is normally donethrough the HAZOP and SAT analyses. Consequently, an appropriate EUC definition would be parallel to thedefinition of process components applied in ISO 10418 (i.e. API RP 14C), i.e. the definition should include theprocess unit and associated piping and valves.
Consider a process with a high-pressure separator for a two-phased separation of oil and gas. A simplified schematicof the separator is shown in figure B.1 together with an indication of possible EUC definition. Protection of theseparator is designed according to ISO 10418, with a primary and secondary barrier against undesirable events. Thelocal safety functions for the separator are implemented through the PSD system and the PSV.
Separator
XV Controlvalve
XV
XV
EUC
PSV
Figure B.1 Example of EUC definition for local safety functions
Hence, for this example the EUC boundaries are defined in terms of the PSD valves, which are used to isolate theseparator during different PSD scenarios (ref. Appendix A.3).
OLF Recommended Guidelines for the application of IEC 61508 and IEC 61511 in the petroleumactivities on the Norwegian Continental Shelf
No.: 070 Date effective: 01.02.2001 Revision no.: 01 Date revised: NA 22 of 46
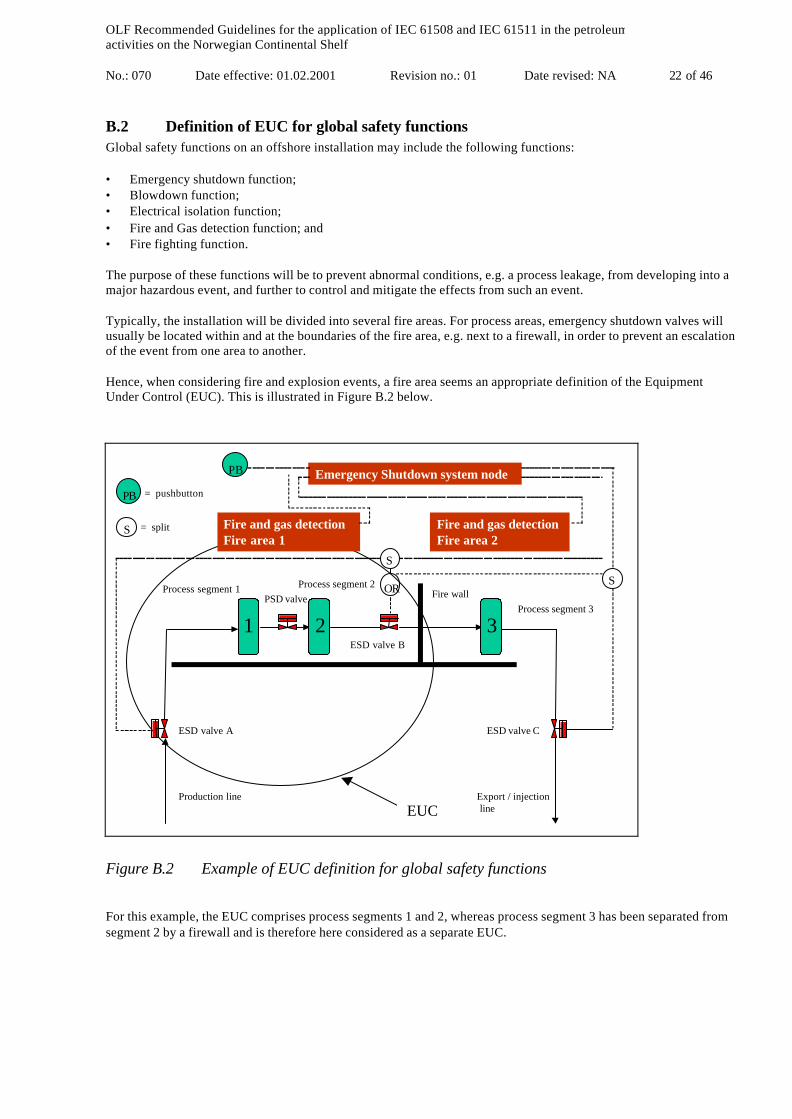
B.2 Definition of EUC for global safety functionsGlobal safety functions on an offshore installation may include the following functions:
• Emergency shutdown function;• Blowdown function;• Electrical isolation function;• Fire and Gas detection function; and• Fire fighting function.
The purpose of these functions will be to prevent abnormal conditions, e.g. a process leakage, from developing into amajor hazardous event, and further to control and mitigate the effects from such an event.
Typically, the installation will be divided into several fire areas. For process areas, emergency shutdown valves willusually be located within and at the boundaries of the fire area, e.g. next to a firewall, in order to prevent an escalationof the event from one area to another.
Hence, when considering fire and explosion events, a fire area seems an appropriate definition of the EquipmentUnder Control (EUC). This is illustrated in Figure B.2 below.
Figure B.2 Example of EUC definition for global safety functions
For this example, the EUC comprises process segments 1 and 2, whereas process segment 3 has been separated fromsegment 2 by a firewall and is therefore here considered as a separate EUC.
3
Fire and gas detectionFire area 1
Fire and gas detectionFire area 2
Emergency Shutdown system node
SOR
S
2
PB
Export / injection line
Production line
1
ESD valve A
ESD valve B
ESD valve C
PSD valveProcess segment 1 Process segment 2
Process segment 3Fire wall
EUC
PB
S
= pushbutton
= split
OLF Recommended Guidelines for the application of IEC 61508 and IEC 61511 in the petroleumactivities on the Norwegian Continental Shelf
No.: 070 Date effective: 01.02.2001 Revision no.: 01 Date revised: NA 23 of 46
One important motivation for defining the EUC in terms of a fire area, will be the associated possibility of defining anacceptable EUC risk as required by IEC 61508/61511. With respect to acceptance criteria, the operators will havedifferent types, which often will have the format of:
- an overall acceptance criteria for the installation (e.g. given in terms of an acceptable Fatal Accident Rate, FAR)and;
- different criteria related to the main safety functions, such as loss of escape routes, safe haven and evacuationmeans, as well as criteria related to loss of structural integrity and escalation of the event.
Whereas the overall FAR criterion will normally not be very suitable for defining acceptable EUC risk, the escalationcriterion appears to be more applicable. This criterion would e.g. typically be defined in terms of the acceptableannual frequency for escalation of an event to another area. For the above example, the acceptable EUC risk could forexample be defined as follows: For a fire or explosion event originating in process segment 1 or 2, i.e. within theEUC, escalation to another area on the installation shall not occur with an accumulated frequency above 1 .10-4 peryear.
It should be noted that when using the minimum SIL table as given in section 7.6 of the guideline, EUC definitionand the definition of an acceptable EUC risk will mainly apply to the handling of deviations.
When defining the EUC as indicated above, this may well include several process segments and several blowdownsections connected by process shutdown valves. Furthermore, with respect to electrical isolation, the extent of actualisolation will vary considerably depending on where gas is detected and will also interact closely between thedifferent areas. For the above example (Figure B.2), gas detection in process segment 3 would e.g. typically initiateelectrical isolation both in this area and in the EUC under consideration.
If found more suitable, it might be considered to define the EUC in terms of several fire areas, e.g. all the hazardousareas on the installation as one EUC, and another EUC as the non-hazardous areas. As indicated initially in thischapter, the important point will be to define EUC in a manner such that all relevant hazards can be identified.
OLF Recommended Guidelines for the application of IEC 61508 and IEC 61511 in the petroleumactivities on the Norwegian Continental Shelf
No.: 070 Date effective: 01.02.2001 Revision no.: 01 Date revised: NA 24 of 46
APPENDIX C Examples on how to handle deviations
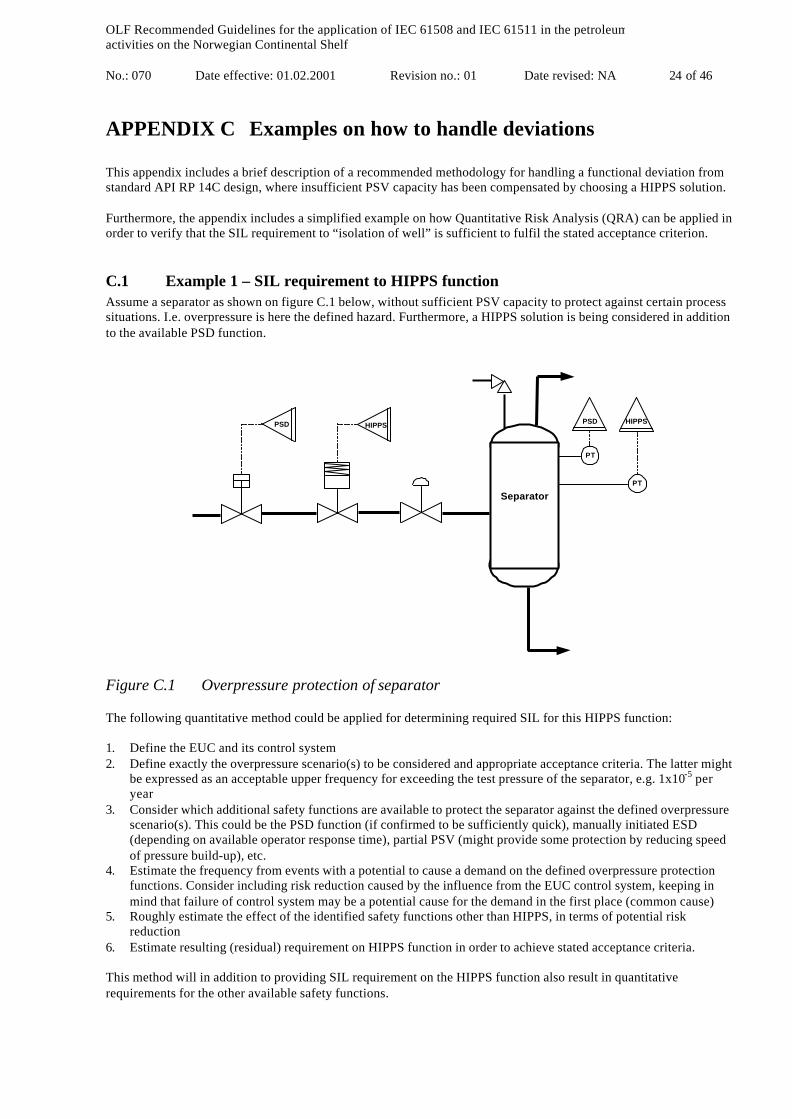
This appendix includes a brief description of a recommended methodology for handling a functional deviation fromstandard API RP 14C design, where insufficient PSV capacity has been compensated by choosing a HIPPS solution.
Furthermore, the appendix includes a simplified example on how Quantitative Risk Analysis (QRA) can be applied inorder to verify that the SIL requirement to “isolation of well” is sufficient to fulfil the stated acceptance criterion.
C.1 Example 1 – SIL requirement to HIPPS functionAssume a separator as shown on figure C.1 below, without sufficient PSV capacity to protect against certain processsituations. I.e. overpressure is here the defined hazard. Furthermore, a HIPPS solution is being considered in additionto the available PSD function.
SeparatorPT
PT
HIPPSPSDHIPPSPSD
Figure C.1 Overpressure protection of separator
The following quantitative method could be applied for determining required SIL for this HIPPS function:
1. Define the EUC and its control system2. Define exactly the overpressure scenario(s) to be considered and appropriate acceptance criteria. The latter might
be expressed as an acceptable upper frequency for exceeding the test pressure of the separator, e.g. 1x10⁻⁵ peryear
3. Consider which additional safety functions are available to protect the separator against the defined overpressurescenario(s). This could be the PSD function (if confirmed to be sufficiently quick), manually initiated ESD(depending on available operator response time), partial PSV (might provide some protection by reducing speedof pressure build-up), etc.
4. Estimate the frequency from events with a potential to cause a demand on the defined overpressure protectionfunctions. Consider including risk reduction caused by the influence from the EUC control system, keeping inmind that failure of control system may be a potential cause for the demand in the first place (common cause)
5. Roughly estimate the effect of the identified safety functions other than HIPPS, in terms of potential riskreduction
6. Estimate resulting (residual) requirement on HIPPS function in order to achieve stated acceptance criteria.
This method will in addition to providing SIL requirement on the HIPPS function also result in quantitativerequirements for the other available safety functions.
OLF Recommended Guidelines for the application of IEC 61508 and IEC 61511 in the petroleumactivities on the Norwegian Continental Shelf
No.: 070 Date effective: 01.02.2001 Revision no.: 01 Date revised: NA 25 of 46
C.2 Example 2 – Verification by QRA of a stated Safety Integrity Level
C.2.1 Risk acceptance criteria
Regulatory requirementsSection 9 of “Styringsforskriften” (currently available in draft revision only) stipulates that operators (or partiesresponsible for operation of an installation) in the petroleum industries shall define acceptance criteria for risk in thepetroleum activities. In addition, Section 9 in “Innretningsforskriften” stipulates that accidental (or environmental)loads should not cause impairment of a main safety function with a frequency exceeding 1.10-4 pr. year. Main safetyfunctions are defined in Section 6 of the same regulation to be;
• prevention of escalation of accidental events in order to prevent personnel outside the immediate vicinity ofthe area affected by the accident from being injured
• maintaining the structural integrity of load bearing construction for the time required to evacuate theinstallation
• protect rooms of importance for mitigating the accidental events for the time required to evacuate theinstallation
• keep at least one escape route open from each area in which personnel can be located until evacuation to asafe haven and rescue of personnel have been carried out
Personnel riskGenerally, risk acceptance criteria used by operators on the Norwegian continental shelf define an upper limit on theacceptable risk, using varying measures for risk to personnel, environment and assets. The overall risk acceptancecriteria are normally not split pr. accidental event. This allows for some degree of flexibility, i.e. it is possible totolerate a higher risk from process accidents, as long as this is compensated by reduction in the risk from otheraccident categories in order to ensure that the total risk level is acceptable. The ALARP principle is widely used,implying that the risk should be reduced to a level “as low as reasonably practicable”. ALARP is normallydemonstrated using cost/benefit evaluations with risk reducing measures being implemented when e.g. the cost ofaverting a fatality are not prohibitively high.
Material damage risk / safety functionsThe NORSOK standard Z-013 (currently under revision) specifies that “a frequency 1 x 10⁻⁴ per year for each type ofaccidental load has been used frequently as the limit of acceptability for the impairment of each main safety function.Sometimes one prefers an overall frequency summing up all accidental load types. For these purposes an overallfrequency of 5 x 10⁻⁴ per year has been used as the impairment frequency limit”.
The 1 x 10⁻⁴ criteria may be derived from “innretningsforskriften”, and can be used as a basis for SIL determination.It should be noted that several operators on the Norwegian continental shelf have elected to use an overall 5 x 10⁻⁴
criteria, not setting a level for the maximum risk contribution from each accidental event. It should also be noted thatthe interpretation of how the risk acceptance criteria are to be applied may vary between the different operators.
Risk acceptance vs. SIL requirementsSIL requirements can influence both the likelihood (process control/PSD) and consequence (ESD) of an accidentalevent, and it seems reasonable to expect a certain consistency between the SIL requirements and the overall riskacceptance criteria. Where this guideline specifies SIL requirements for subfunctions, quantitative risk analysesshould be applied to ensure that the overall risk is acceptable when compared to the established acceptance criteria. Ingeneral, setting “standard” safety integrity levels may be compared to setting a “standard” level of risk acceptance.Such “standard” criteria will not take into consideration elements that may be considered in a QRA, e.g;
• Installation (structural) design and layout• Process design and layout• Process plant size / capability• ESD / PSD philosophy• Maintenance standards
In order to verify whether or not the standard Safety Integrity Levels will result in an acceptable overall risk level, amore detailed analysis is required. Example calculations are given below.

OLF Recommended Guidelines for the application of IEC 61508 and IEC 61511 in the petroleumactivities on the Norwegian Continental Shelf
No.: 070 Date effective: 01.02.2001 Revision no.: 01 Date revised: NA 26 of 46
C.2.2 Isolation of production wells
General – application of acceptance criteriaThe guideline specifies that the subsystem “isolation of one well” should meet a minimum safety integrity level ofSIL 3. The following high-level example is intended to demonstrate whether or not this is adequate in order to meetan overall risk acceptance criterion. Reference is also made to Annex C of IEC 61511-3 for additional examples.
The acceptance criterion to be applied in the following example is that any single accidental event should notcontribute to the frequency of escalation (breach of firecell integrity) with a frequency exceeding 1 x 10⁻⁴ pr. year.
AssumptionsThe installation considered has a process layout as indicated in Figure C.2 below. This includes;
• Five production wells with “standard” wellhead configuration.• A wellhead area segregated from other areas with a H-120 fire division• A production manifold located in the wellhead area, separated from the oil and gas separation process by an
ESD valve.
H-120 firewall
HP SeparatorMani.
Wellhead Area Utility LQ/Accommodation
H-120 firewallH-120 firewall
HP SeparatorMani.
Wellhead Area Utility LQ/Accommodation
H-120 firewall
Figure C.2 - Example Wellhead / Process layout
For the purpose of this example it is assumed that any fire originating in the production manifold will have durationless than 120 minutes should isolation be successful. The fire will then not threaten the firewall separating the processand wellhead areas. However, failure to isolate the segment (failure to shut in wells) will result in the fire durationexceeding 120 minutes, with a high likelihood of failure of the firewall.
GeneralTo limit inventory available to feed any leak, all wells must be shut in, and the ESD valve downstream the productionmanifold must close. Closing in wells can typically be achieved by closing at least one of the following valves;
• DHSV• Upper master valve• Production wing valve
Note that the DHSV is the only valve that can prevent flow to surface in the event of damage to the wellheads. Aminimum SIL of 3 has been set for isolation of each well, in accordance with specifications given in this guideline.Section A.6 indicates that this is achievable with current day technology. This SIL requirement is used to establish aprobability of isolation failure for further use in the risk model.
Simplified event tree analysisIn order to evaluate the annual frequency of failure of the firewall due to fires from the production manifold, an eventtree approach is used. For the purpose of this example it is assumed that depressurisation of the HP separator segmentis successful, resulting in failure to close the ESDV upstream of the HP separator not being a critical failure withrespect to the firewall integrity. The critical aspect will then be whether or not it is possible to shut in the wells.An example event tree is given in Figure C.3.
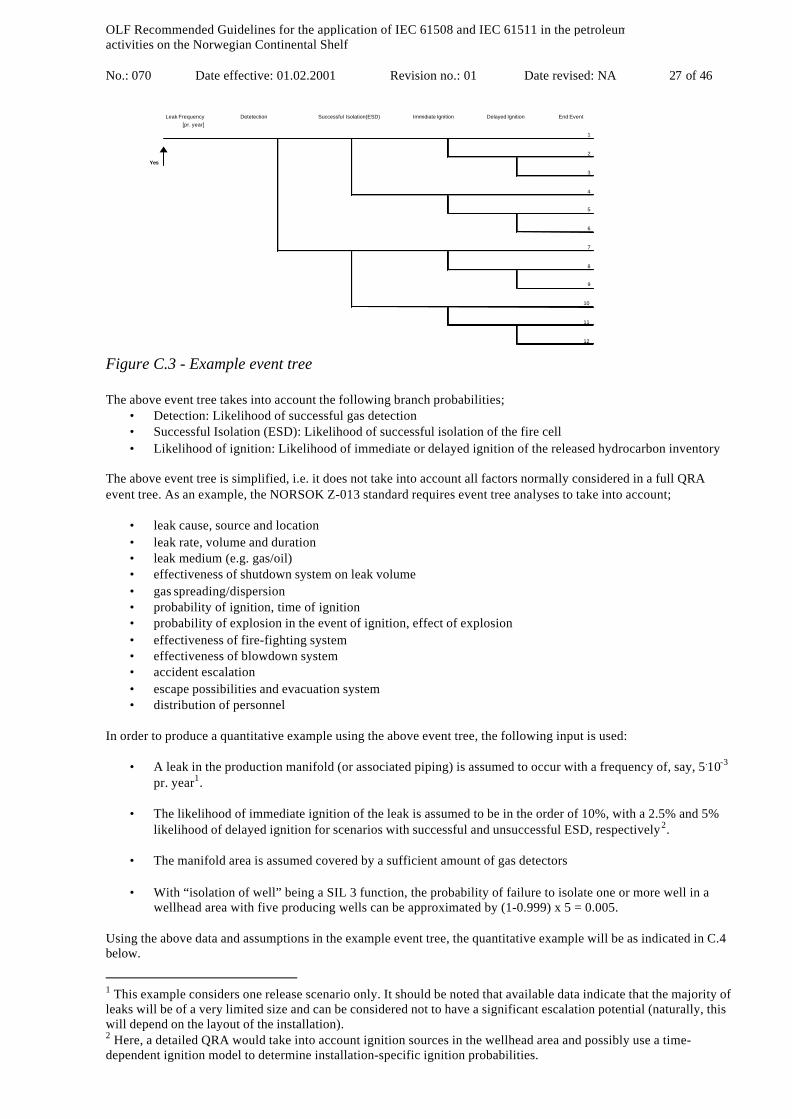
OLF Recommended Guidelines for the application of IEC 61508 and IEC 61511 in the petroleumactivities on the Norwegian Continental Shelf
No.: 070 Date effective: 01.02.2001 Revision no.: 01 Date revised: NA 27 of 46
Leak Frequency End Event
[pr. year]
1
2
Yes
3
4
5
6
7
8
9
10
11
12
Detetection Successful Isolation(ESD) Immidiate Ignition Delayed Ignition
Figure C.3 - Example event tree
The above event tree takes into account the following branch probabilities;• Detection: Likelihood of successful gas detection• Successful Isolation (ESD): Likelihood of successful isolation of the fire cell• Likelihood of ignition: Likelihood of immediate or delayed ignition of the released hydrocarbon inventory
The above event tree is simplified, i.e. it does not take into account all factors normally considered in a full QRAevent tree. As an example, the NORSOK Z-013 standard requires event tree analyses to take into account;
• leak cause, source and location• leak rate, volume and duration• leak medium (e.g. gas/oil)• effectiveness of shutdown system on leak volume• gas spreading/dispersion• probability of ignition, time of ignition• probability of explosion in the event of ignition, effect of explosion• effectiveness of fire-fighting system• effectiveness of blowdown system• accident escalation• escape possibilities and evacuation system• distribution of personnel
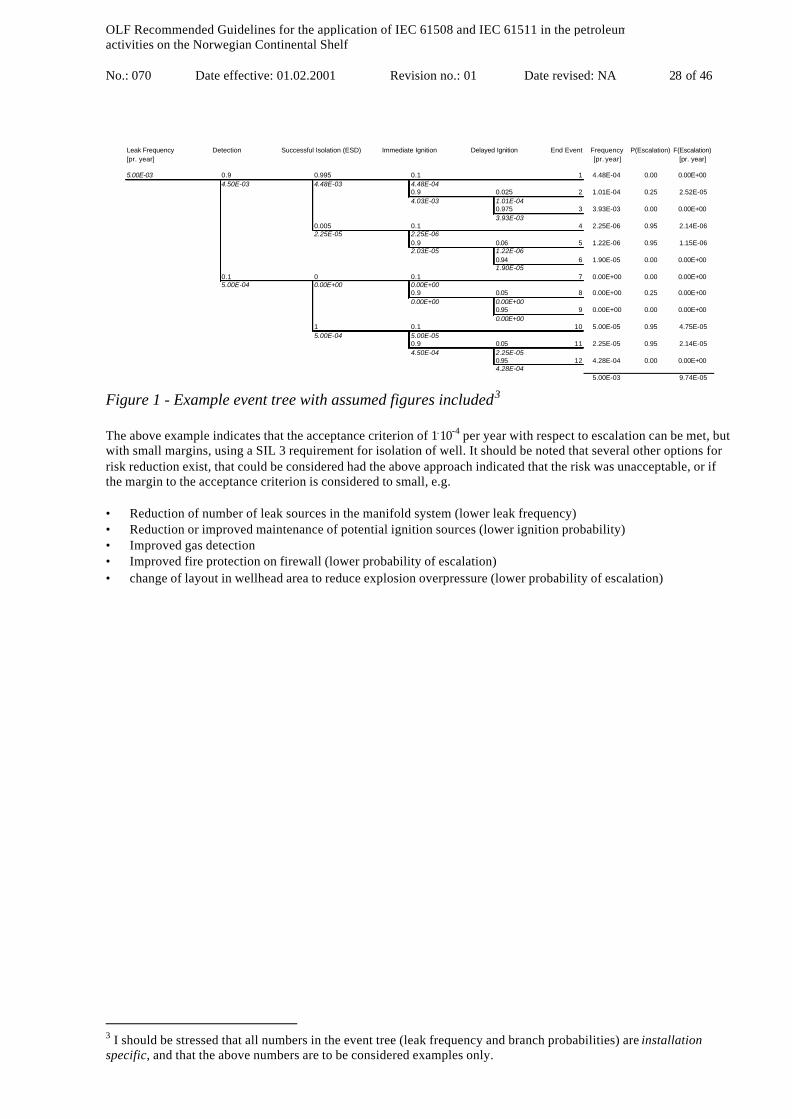
In order to produce a quantitative example using the above event tree, the following input is used:
• A leak in the production manifold (or associated piping) is assumed to occur with a frequency of, say, 5.10-3
pr. year1.
• The likelihood of immediate ignition of the leak is assumed to be in the order of 10%, with a 2.5% and 5%likelihood of delayed ignition for scenarios with successful and unsuccessful ESD, respectively2.
• The manifold area is assumed covered by a sufficient amount of gas detectors
• With “isolation of well” being a SIL 3 function, the probability of failure to isolate one or more well in awellhead area with five producing wells can be approximated by (1-0.999) x 5 = 0.005.
Using the above data and assumptions in the example event tree, the quantitative example will be as indicated in C.4below.
1 This example considers one release scenario only. It should be noted that available data indicate that the majority ofleaks will be of a very limited size and can be considered not to have a significant escalation potential (naturally, thiswill depend on the layout of the installation).2 Here, a detailed QRA would take into account ignition sources in the wellhead area and possibly use a time-dependent ignition model to determine installation-specific ignition probabilities.
OLF Recommended Guidelines for the application of IEC 61508 and IEC 61511 in the petroleumactivities on the Norwegian Continental Shelf
No.: 070 Date effective: 01.02.2001 Revision no.: 01 Date revised: NA 28 of 46
Leak Frequency End Event Frequency P(Escalation) F(Escalation)[pr. year] [pr. year] [pr. year]
5.00E-03 0.9 0.995 0.1 1 4.48E-04 0.00 0.00E+004.50E-03 4.48E-03 4.48E-04
0.9 0.025 2 1.01E-04 0.25 2.52E-054.03E-03 1.01E-04
0.975 3 3.93E-03 0.00 0.00E+003.93E-03
0.005 0.1 4 2.25E-06 0.95 2.14E-062.25E-05 2.25E-06
0.9 0.06 5 1.22E-06 0.95 1.15E-062.03E-05 1.22E-06
0.94 6 1.90E-05 0.00 0.00E+001.90E-05
0.1 0 0.1 7 0.00E+00 0.00 0.00E+005.00E-04 0.00E+00 0.00E+00
0.9 0.05 8 0.00E+00 0.25 0.00E+000.00E+00 0.00E+00
0.95 9 0.00E+00 0.00 0.00E+000.00E+00
1 0.1 10 5.00E-05 0.95 4.75E-055.00E-04 5.00E-05
0.9 0.05 11 2.25E-05 0.95 2.14E-054.50E-04 2.25E-05
0.95 12 4.28E-04 0.00 0.00E+004.28E-04
5.00E-03 9.74E-05
Detection Successful Isolation (ESD) Immediate Ignition Delayed Ignition
Figure 1 - Example event tree with assumed figures included3
The above example indicates that the acceptance criterion of 1.10-4 per year with respect to escalation can be met, butwith small margins, using a SIL 3 requirement for isolation of well. It should be noted that several other options forrisk reduction exist, that could be considered had the above approach indicated that the risk was unacceptable, or ifthe margin to the acceptance criterion is considered to small, e.g.
• Reduction of number of leak sources in the manifold system (lower leak frequency)• Reduction or improved maintenance of potential ignition sources (lower ignition probability)• Improved gas detection• Improved fire protection on firewall (lower probability of escalation)• change of layout in wellhead area to reduce explosion overpressure (lower probability of escalation)
3 I should be stressed that all numbers in the event tree (leak frequency and branch probabilities) are installationspecific, and that the above numbers are to be considered examples only.

OLF Recommended Guidelines for the application of IEC 61508 and IEC 61511 in the petroleumactivities on the Norwegian Continental Shelf
No.: 070 Date effective: 01.02.2001 Revision no.: 01 Date revised: NA 29 of 46
APPENDIX D Estimation of probability of failure on demand
D.1 Relation between PFD used in the IEC-standards and CSU used in the PDS-model
First, we give the following definitions, related to safety unavailability (SU) as defined in the PDS method (cf. refs./1/ and /2/):
CSU = Critical Safety Unavailability. The probability that the safety system due to an unrevealed fault will fail toautomatically carry out a successful safety action on the occurrence of a hazardous/accidental event. Using thenotation of IEC this parameter includes contributions both from random hardware failures (in particularundetectable dangerous failures) and systematic failures (cf. TIF).
NCU = Non-Critical Unavailability. The probability that the safety system due to a revealed fault or inhibitionwill fail to automatically carry out a successful safety action on the occurrence of a hazardous/accidentalevent. In PDS there are two contributions to NCU: 1) Failures that are detected cause unavailability due torepair, 2) Inhibition due to functional testing being carried out. Thus we may write NCU = NCU1 + NCU2
TIF = The probability of Test Independent Failures. This is the probability that a component that has just beenfunctionally tested will fail on demand (applies to FTO failures only). Essentially, TIF represents aquantification of what in IEC 61508 is referred to as systematic failures.
CSU1 = Critical safety unavailability due to unrevealed hardware failures. This is the part of CSU which is notrelated to systematic failures, and so depends on the period of functional testing, τ ; (e.g. for a single system,CSU1 = λ ⋅ τ / 2). The notation CSU1 is introduced here and was not used in PDS.
Thus, in PDS there are three contributors to SU, see Fig. D1. In this method the main measure for SU is CSU = CSU1
+ TIF, while NCU is a "secondary" measure. In IEC 61508 the parameter PFD is used as a measure for SU:
PFD = Probability of Failure on Demand. Includes unavailability both to unrevealed failures (cf. CSU) and torevealed failure (cf. NCU). However, there are limitations: PFD does not include contributions fromsystematic failures (cf. TIF) and from inhibition during functional testing (cf. NCU2).
So PFD is quite different from CSU used in PDS. The PFD will not include contribution from systematic failures(TIF), and we may write:
PFD = CSU1 + NCU1
So CSU1 is the common part of CSU and PFD. To get a good overview of the safety performance of your system weclaim that all above elements of SU should be quantified separately. Now, the following topics should beinvestigated:
1. How are failures classified in IEC and PDS? What is the difference?2. How is CSU1 quantified in PDS and IEC, respectively?3. How should NCU be quantified?4. What are he arguments for quantifying the TIF probability, also when IEC 61508 is applied?5. What is the recommended synthesis of IEC and PDS? That is, what is the recommended approach for SU
quantification, adhering to IEC, but at the same time not losing the aspects of the PDS method, that are importantfor a realistic evaluation of safety systems?

OLF Recommended Guidelines for the application of IEC 61508 and IEC 61511 in the petroleumactivities on the Norwegian Continental Shelf
No.: 070 Date effective: 01.02.2001 Revision no.: 01 Date revised: NA 30 of 46
Figure D.1 Relation between CSU (used in PDS) and PFD (used in IEC 61508)
These topics are treated below. It is attempted to adhere to the IEC method and notation. The standard gives rathercomplex (but approximate) formulas for PFD (without providing proper arguments for these). When the expressionsfor PFD in IEC are split to give separate expressions for CSU1 and NCU1 we do not agree on all the formulasobtained. So the expressions for CSU1 and NCU1 presented below, will differ somewhat from those that can bederived from the IEC standard.
Further, the presentation below apply β -factors and not p-factors (as used in PDS). We restrict so far to treat thevoting logics 1oo1, 1oo2, 2oo2 and 2oo3.
The following notation apply:
MTTR: Mean Time To Repair for a componentτ : Time interval between proof tests (denoted T1 in IEC 61508)λ : Component failure rateβ : beta-factor for common cause failures (IEC)
The component failure rate is split as follows:
IEC notation PDSnotation
Description
λD = λDU +λDD λFTO Rate of dangerous failures (fail-to-operate failures) per hr,FTOun
FTOdetλλ = + FTO
detλ
λS = λSU + λSD λSO Rate of safe failures (spurious operation failures) per hr,SOun
SOdetλλ = + SO
detλ
λDU FTOun detλ
Rate of undetected dangerous failures per hr (i.e. rate of failureswhich lie outside the coverage of the diagnostic tests)
λDD FTOdetλ
Rate of detected dangerous failures per hr (i.e. rate of failures whichare detected by the diagnostic tests)
λSU SOun detλ
Rate of undetected safe failures per hr (i.e. rate of failures which lieoutside the coverage of the diagnostic tests)
λSD SOdetλ
Rate of detected safe failures per hr (i.e. rate of failures which aredetected by the diagnostic tests)
NCU2
NCU1
Safety unavailability concepts
TIF
CSU1
PFD(used in
IEC)
CSU(used in
PDS)
OLF Recommended Guidelines for the application of IEC 61508 and IEC 61511 in the petroleumactivities on the Norwegian Continental Shelf
No.: 070 Date effective: 01.02.2001 Revision no.: 01 Date revised: NA 31 of 46
Note 1:The formulas given below will follow (as closely as possible) the "spirit" of the IEC; in particular by applying the β-factor model, and considering both CSU1 and NCU1. However, the formulas provided in Appendix B of IEC 61508-6are rather complex and are not well documented. Thus in Table D1 below new formulas are provided, for CSU1
following the PDS handbook /1/, (but replacing p-factors with β-s).
Note 2:For NCU1 the handbook /1/ does not provide results. However, the formulas for a kooN-voting given in Table D2below are rather simple, just expressing the probability of all N "lines" being unavailable due to repair of a dangerousfailure. The decision to restrict to dangerous failures again follows the IEC standard. However, it is a questionwhether also the unavailability due to repair of safe detected (SD) should be included. Often, the detection of thesefailures will prevent a shut-down and the repair also for these are online, and thus contributing to the NCU1.
Note 3:As already stated, the IEC approach does not include unavailability due to functional testing. This seems inconsistent,as the unavailability due to repair is included. However, following IEC, we ignore unavailability due to testing informulas below. This contribution could easily be added to NCU as ∆/τ, where ∆ is the inhibition period forfunctional testing of the system; (this contribution to SU would usually be added to the function not to eachelement?).
Note 4:The formulas below assume degraded operation by detection/repair of failures. So for instance when a failure isdetected on a duplicated system, this failure is repaired on-line, and the system is degraded to a 1oo1 system. On linerepair is carried out also on a single system.
Note 5:All formulas are actually approximations, valid when τ is not too big. For instance a main term, like λDU ⋅ τ /2 isactually an approximation for (1 - exp(-λDU ⋅ τ ) ) / (λDU ⋅ τ ) .
D.2 Failure classification.
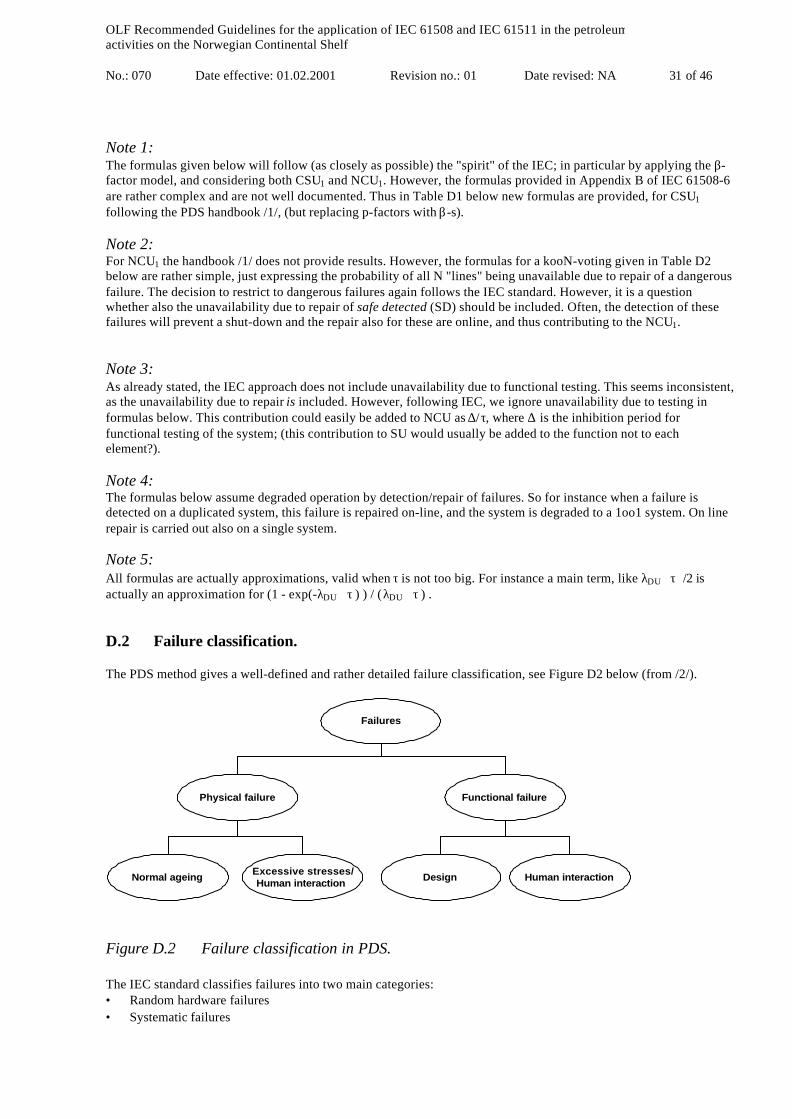
The PDS method gives a well-defined and rather detailed failure classification, see Figure D2 below (from /2/).
Failures
Functional failure
Human interactionDesign
Physical failure
Normal ageing Excessive stresses/Human interaction
Figure D.2 Failure classification in PDS.
The IEC standard classifies failures into two main categories:• Random hardware failures• Systematic failures
OLF Recommended Guidelines for the application of IEC 61508 and IEC 61511 in the petroleumactivities on the Norwegian Continental Shelf
No.: 070 Date effective: 01.02.2001 Revision no.: 01 Date revised: NA 32 of 46
The definitions are not so detailed. However, it is the impression that "random hardware failures" is more or lessidentical to "physical failures", and that "systematic failures" is more or less identical to "functional failures". The SUcaused by the first category (Random hardware failures) is quantified in IEC (by PFD), while the SU caused bysystematic failures is not quantified here. Thus, the PFD will not include unavailability due to e.g.:
• Failure of detector to react due to "wrong" location of detector• Failure of detector to discriminate between true and false alarm• Failure due to software error• Unavailability of system due to erroneous inhibition
To make the definitions of safety unavailability in PDS and IEC respectively compatible, and to avoid too muchconfusion, we here specify TIF to entirely relate to functional failures (=systematic failures) and CSU1 entirely torelate to physical failures (=random hardware failures), see Fig. D2 above.
Observe that a category that we could call "Maintenance induced hardware failures" (during periodic testing) fallsoutside this classification. These are physical failures, but will not be covered by the CSU1 - formula, as the rate ofmaintenance induced failures increases with increasing test frequency.
D.3 Calculation of CSU1
The contribution CSU1 comes from dangerous undetected (DU) failures that occur with rate λDU (and are detected inmanual tests with interval τ). For redundant systems we also have a contribution to CSU1 where one unit isunavailable due to a repair. According to the IEC formulas we restrict to Dangerous failures (with rate λD). However,we should rather include also some Safe failures as these also may result in an on-line repair(?) The formulas forCSU1 are given in Table D1.
Table D1 Formulas for CSU1. The approximate PDS formula corresponds to the term inbold. However, in the PDS method, p-factors are used instead of a β -factor.
Voting Formula for CSU1 Comment
1oo1 λDU ⋅ τ /2 Agrees with PDS
1oo2 β ⋅ λDU ⋅ τ /2 + [(1-β )⋅ λDU⋅ τ ]2/3+
2⋅(1-β)2⋅ λDU ⋅ (τ/2) ⋅λD ⋅ MTTR
The approximate PDS formula only applies thefirst term, caused by common cause DU failures(with p-factors instead of β). The 2nd termcorresponds to two independent DU failures, andthe 3rd term represents that one unit has a D(being repaired), and the other has a DU failure.
2oo2 [β + 2 ⋅ (1-β )] ⋅ λDU ⋅ τ /2 +
2⋅ (1-β)2⋅ λDU ⋅ (τ /2) ⋅ λD ⋅ MTTR
The approximate PDS formula only applies thefirst term, caused by DU failures (with p-factorsinstead of β). The 2nd term represents that oneunit has a D and the other a DU failure.
2oo3 β ⋅ λDU ⋅ τ /2 + [(1-β)⋅λDU ⋅ τ]2 +
6⋅ (1-β)2 λDU ⋅ (τ/2) ⋅ λD ⋅ MTTR
The approximate PDS formula only applies thefirst term, caused by common cause DU failures(with p-factors instead of β). The 2nd termcorresponds to two independent DU failures, andthe 3rd term represents that one unit has a D andanother a DU failure.
D.4 Calculation of NCU
When maintenance activity is done while the plant is operating, the safety system is set in the off-line state. The timethat the safety system is in off-line state is in IEC included as a part of total PFD, and this contribution can becomesignificant if shorter time interval between proof tests is practised.
OLF Recommended Guidelines for the application of IEC 61508 and IEC 61511 in the petroleumactivities on the Norwegian Continental Shelf
No.: 070 Date effective: 01.02.2001 Revision no.: 01 Date revised: NA 33 of 46
Table D2 Formulas for NCU1. Main term in bold
Voting Formula for NCU1 (notidentical to formulas in IEC )
Comment
1oo1 λD ⋅ MTTR Component repaired
1oo2 β ⋅ λD ⋅ MTTR +
[(1-β ) ⋅ λD ⋅ MTTR]2
Repair of both components, either due to acommon cause failure or both having anindependent failure.
2oo2 β ⋅ λD ⋅ MTTR +
[(1-β) ⋅ λD ⋅ MTTR]2
Repair of both components, due to a commoncause failure or both having an independentfailure.
2oo3 β ⋅ λD ⋅ MTTR +
[(1-β) ⋅ λD ⋅ MTTR]3
Repair of all three components, due to acommon cause failure or all three having anindependent failure.
Table D2 presents formulas for the unavailability due to repair (NCU1). As stated above NCU2 = ∆ /τ could be usedas a formula for unavailability during testing. Here ∆ is the inhibition time during testing.
D.5 Why should we quantify TIF?
In the PDS - projects it was well documented that unavailability of most safety functions are caused by "systematicfailures", i.e.
• Failure of detector to react due to "wrong" location of detectors• Failure of detector to discriminate between true and false alarm• Insufficient functional test procedure• Human error during functional test:
- leave in by-pass- wrong calibration
• Failure due to software error
These are the main elements of the TIF-probability. In the PDS it was strongly argued that it is not very sensible toquantify the contribution of hardware failures, leaving out the major contributor to the SU. It is true that it may bemore difficult to quantify the TIF-probability. However, the PDS project succeeded in providing generic values, andfor the TIF of gas detectors an approach for obtaining "plant specific" TIF was also developed, see /3/. It is alsopossible to establish simpler approaches, e.g. along the lines of obtaining "plant-specific" β's as presented in IEC61508.
Regarding the quantification of TIF, we observe that
1. the TIF probability is closely linked to the application ("plant"), and2. objective data for TIF is often lacking, so that quantification to a larger extent must be based on "subjective"
data,
Hence, there are strong arguments for quantifying the TIF probability separately, and not just give the "total" CSU. Itis much more informative to have both CSU1 and TIF, than just having the sum CSU.
D.6 Recommended approach for quantification of SU when IEC 61508 is used
Four elements of SU were identified in Section D1. Below we give the "short version" of the definitions:
• CSU1 = Safety unavailability due to unrevealed "random hardware failures"• CSU2= TIF = Safety unavailability due to (unrevealed) "systematic failures". We actually assume all systematic
failures by definition to be unrevealed.
OLF Recommended Guidelines for the application of IEC 61508 and IEC 61511 in the petroleumactivities on the Norwegian Continental Shelf
No.: 070 Date effective: 01.02.2001 Revision no.: 01 Date revised: NA 34 of 46
• NCU1= Safety unavailability due to revealed "random hardware failures", i.e. safety unavailability due to repair(of detected failures)
• NCU2= Safety unavailability due to functional testing.
Below, some recommendations regarding the approach for quantification of SU for safety systems are summarised:
1) Dependence on operating philosophyThe operating philosophy (degraded operation, on-line repair, etc) should be explicitly stated. The present formulasare based on the assumption that on -line repair is always carried out; also for a single (1oo1) safety system.Additional formulas should be used when other assumptions apply.
2) Data requirementsThe quantifications require data on failure rates (split on dangerous/safe and undetected/detected), coverage, β-factorand test interval τ. As far as possible the data should be "plant specific", cf. the IEC approach for obtaining the β-factor.
3) Dependent failuresRegarding the handling of common cause failure (dependent failures), the use of the β-factor model was rejected inPDS. The reason is that this model is very bad for comparing say 1oo2, 1oo3 and 2oo3 votings. For instance fromTable D1it is seen that the main (bold) term for the 1oo2 and 2oo3 votings are identical! If the comparison betweenthese voting logics shall in any way be meaningful, there should be different β's for each voting. So either a modelwith p-factors should be used, or, alternatively and approach using β-values that depend on the voting logic! Thispoint is illustrated in Section D.7 below.
As stated above, the IEC approach to find "plant-specific" β-factors is a good principle, and should be adopted in thefuture. Note that there is no problem in adopting this approach also to p-factors, (cf. theme of PDS-forum 2000, see/4/).
4) Various contributions to SUAs discussed above there are various contributions to SU. Which of these should be quantified?
As a minimum CSU1 should always be quantified. However, the importance of systematic failures is well documented(cf. Section D5). The IEC approach of not including the quantification of this contribution to SU, will represent asignificant step backwards, as compared to the present practise (PDS-method). Just a qualitative evaluation ofsystematic failures necessarily means that there will be less focus on these essential contributions. However,providing separate values for CSU1 and CSU2= TIF, and not only giving the sum CSU (as in PDS), seems a goodidea.
So, in conclusion, it is recommended that all the four above elements of SU should be calculated as part of an overallevaluation of the safety system. Then also PFD (as defined in IEC today) is directly found by adding two of thesecontributions. However, it is considered unfortunate that PFD mixes the unavailability due to revealed and unrevealedfailures, and in the long run this should be changed.
5) Quantification formulasThe formulas for quantification of PFD given in IEC are very complex. "All" such formulas are actuallyapproximations. However, it is strongly suspected that the IEC formulas are by no means the most sensibleapproximations. The formulas presented above (Sections D3-D4) are significantly simpler, and are recommended as asounder basis for the quantifications. Whether only the main term corresponding to dependent failures (as used inPDS) or also the contributions from independent failures should be included, must be decided for each application,based on the data.
In the quantification of unavailability due to repair, not only the rate, λD but also (part of) the rate of safe failures, λS
will often apply. This will require a modification of the formulas given above.
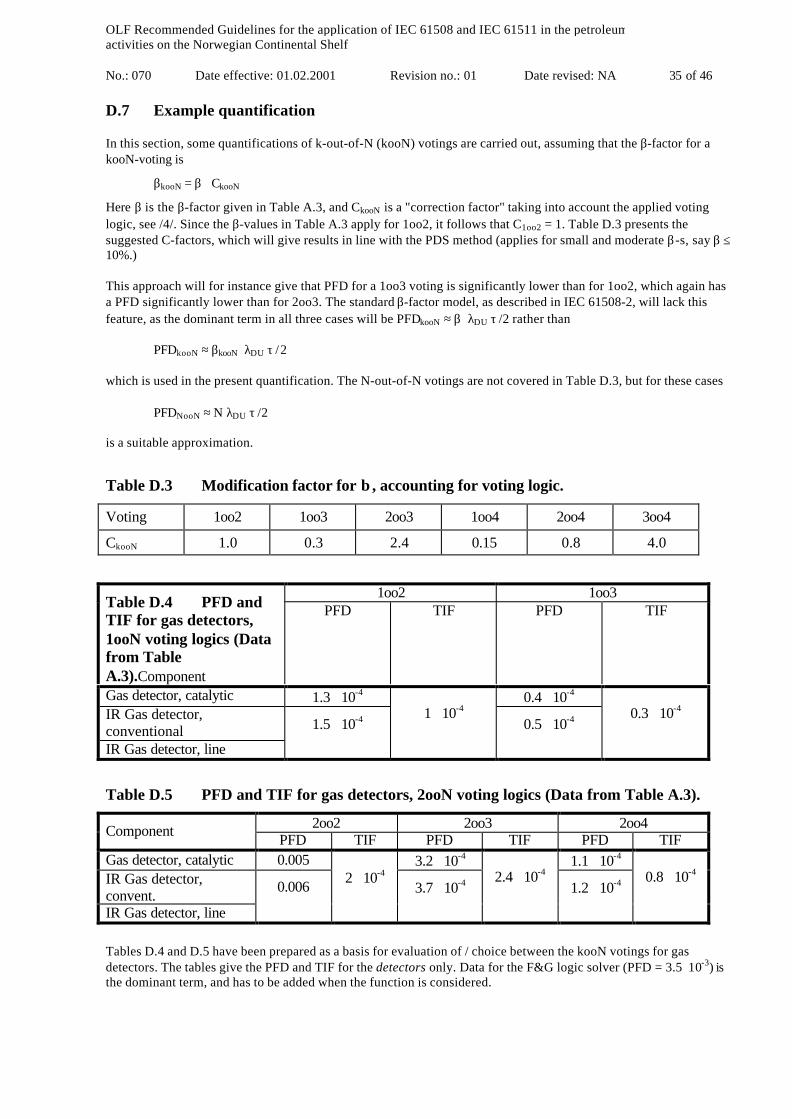
OLF Recommended Guidelines for the application of IEC 61508 and IEC 61511 in the petroleumactivities on the Norwegian Continental Shelf
No.: 070 Date effective: 01.02.2001 Revision no.: 01 Date revised: NA 35 of 46
D.7 Example quantification
In this section, some quantifications of k-out-of-N (kooN) votings are carried out, assuming that the β-factor for akooN-voting is
βkooN = β ⋅ CkooN
Here β is the β-factor given in Table A.3, and CkooN is a "correction factor" taking into account the applied votinglogic, see /4/. Since the β-values in Table A.3 apply for 1oo2, it follows that C1oo2 = 1. Table D.3 presents thesuggested C-factors, which will give results in line with the PDS method (applies for small and moderate β-s, say β ≤10%.)
This approach will for instance give that PFD for a 1oo3 voting is significantly lower than for 1oo2, which again hasa PFD significantly lower than for 2oo3. The standard β-factor model, as described in IEC 61508-2, will lack thisfeature, as the dominant term in all three cases will be PFDkooN ≈ β ⋅λDU⋅τ /2 rather than
PFDkooN ≈ βkooN ⋅λDU⋅τ /2
which is used in the present quantification. The N-out-of-N votings are not covered in Table D.3, but for these cases
PFDNooN ≈ N⋅λDU⋅τ /2
is a suitable approximation.
Table D.3 Modification factor for β , accounting for voting logic.
Voting 1oo2 1oo3 2oo3 1oo4 2oo4 3oo4
CkooN 1.0 0.3 2.4 0.15 0.8 4.0
1oo2 1oo3Table D.4 PFD andTIF for gas detectors,1ooN voting logics (Datafrom TableA.3).Component
PFD TIF PFD TIF
Gas detector, catalytic 1.3 ⋅ 10-4 0.4 ⋅ 10-4
IR Gas detector,conventionalIR Gas detector, line
1.5 ⋅ 10-4 1 ⋅ 10-4
0.5 ⋅ 10-4 0.3 ⋅ 10-4
Table D.5 PFD and TIF for gas detectors, 2ooN voting logics (Data from Table A.3).
2oo2 2oo3 2oo4Component PFD TIF PFD TIF PFD TIFGas detector, catalytic 0.005 3.2 ⋅ 10-4 1.1 ⋅ 10-4
IR Gas detector,convent.IR Gas detector, line
0.006 2 ⋅ 10-4
3.7 ⋅ 10-4 2.4 ⋅ 10-4
1.2 ⋅ 10-4 0.8 ⋅ 10-4
Tables D.4 and D.5 have been prepared as a basis for evaluation of / choice between the kooN votings for gasdetectors. The tables give the PFD and TIF for the detectors only. Data for the F&G logic solver (PFD = 3.5⋅ 10-3) isthe dominant term, and has to be added when the function is considered.

OLF Recommended Guidelines for the application of IEC 61508 and IEC 61511 in the petroleumactivities on the Norwegian Continental Shelf
No.: 070 Date effective: 01.02.2001 Revision no.: 01 Date revised: NA 36 of 46
D.8 References
/1/ Reliability Prediction Handbook; Computer-Based Process Safety Systems. SINTEF report STF75 A89023.
/2/ Reliability Quantification of Computer-Based Safety Systems. An Introduction to PDS.SINTEF report STF38A97434.
/3/ Reliability Data for Control and Safety Systems. 1998 edition. SINTEF report STF38 A98445.
/4/ Beta-factor model in IEC61508 and p-factors in PDS. SINTEF report. In preparation.
OLF Recommended Guidelines for the application of IEC 61508 and IEC 61511 in the petroleumactivities on the Norwegian Continental Shelf
No.: 070 Date effective: 01.02.2001 Revision no.: 01 Date revised: NA 37 of 46
APPENDIX E Lifecycle phases for a typical offshore project
INVESTMENT STUDIES
The Feasibility PhaseThe Feasibility phase is the first phase after the decision is made to establish a field development project.
The Concept PhaseThis phase starts when a decision is made to substantiate further field development and ends when a decision is madewhether or not to prepare a plan for development and operation (PDO).
The Pre-Execution Phase (PDO-phase)This phase starts when one field development concept is selected and the decision is made to prepare the PDO. It iscompleted when the PDO is sent to the authorities, the main contractor is selected.
INVESTMENT PROJECT EXECUTION
Detail Engineering and Construction PhaseThis part of Project Execution starts with the final decision to execute the project and by the award of the maincontract(s), and ends when the facilities are mechanically complete (pre-commissioning).
The Final Commissioning and Start-up PhaseThis part of Project Execution starts when systems or parts of systems are mechanically completed (pre-commissioning), and is concluded when all systems are handed over to Operations and finally accepted by theCustomer.
OPERATION AND DE-COMMISSIONING
The Operational PhaseThis phase starts when the installation is handed over and accepted by Operations.
The De-commissioning PhaseThis phase starts with the decision to shut down the field and remove the installation.
OLF Recommended Guidelines for the application of IEC 61508 and IEC 61511 in the petroleumactivities on the Norwegian Continental Shelf
No.: 070 Date effective: 01.02.2001 Revision no.: 01 Date revised: NA 38 of 46
Lifecycle phases as described in IEC 61511 with reference to typical offshore project
Risk Analysis and Protection Layer DesignThis activity will start in the concept phase and continue during start of detail engineering. Concludes with a riskanalyses report. When major modification, the report to be updated.
A new risk analyses will normally be conducted when the installation have been some years in operation.
Allocation of Safety Functions to Protection LayersThis activity starts in the pre-execution phase and concluded with a report (specification) in the detail engineeringphase.
Safety Requirements Specification for the Safety Instrumented SystemThis activity starts in the pre-execution phase and concluded with a report (specification) in the detail engineeringphase.
Design and Engineering of Safety Instrumented SystemThis activity starts in the pre-execution phase and concludes in the detail engineering phase.
Installation, Commissioning and ValidationThis activity starts in the construction phase and concludes with the final commissioning.Operation and MaintenanceThis activity is taking part in the operational phase.
ModificationThis activity is taking part in the operational phase.
DecommissioningThis activity is taking part in the decommissioning phase
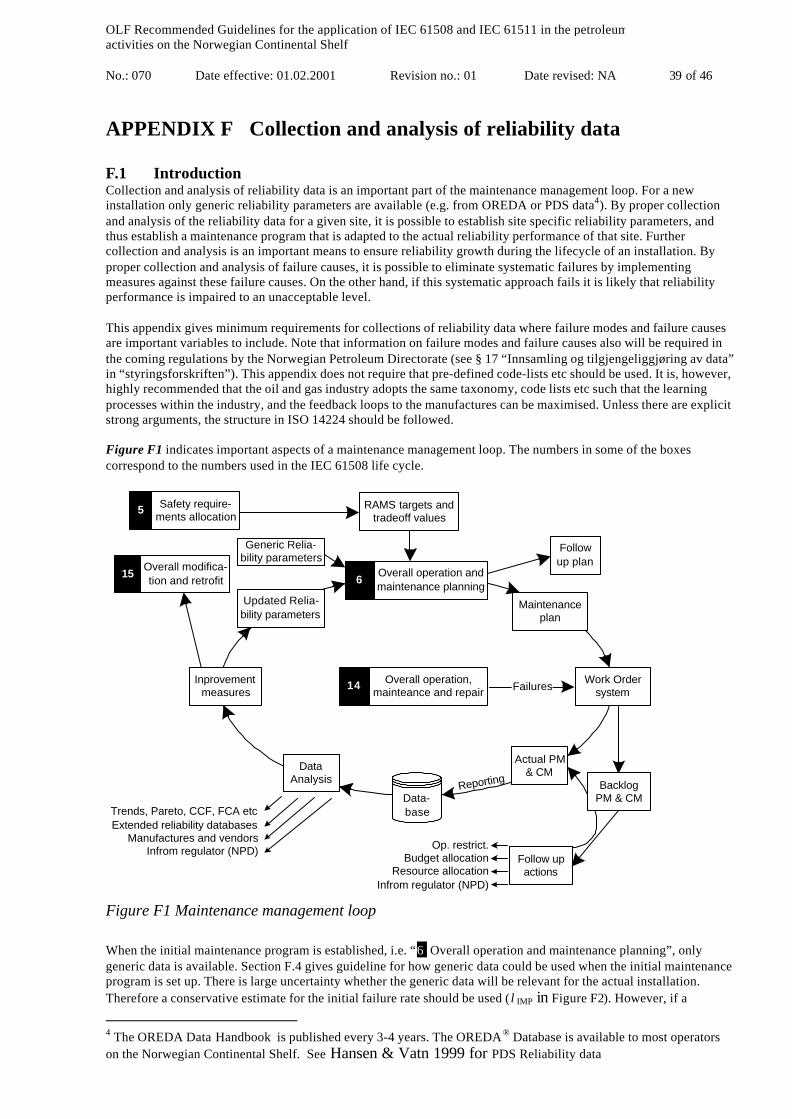
OLF Recommended Guidelines for the application of IEC 61508 and IEC 61511 in the petroleumactivities on the Norwegian Continental Shelf
No.: 070 Date effective: 01.02.2001 Revision no.: 01 Date revised: NA 39 of 46
APPENDIX F Collection and analysis of reliability data
F.1 IntroductionCollection and analysis of reliability data is an important part of the maintenance management loop. For a newinstallation only generic reliability parameters are available (e.g. from OREDA or PDS data4). By proper collectionand analysis of the reliability data for a given site, it is possible to establish site specific reliability parameters, andthus establish a maintenance program that is adapted to the actual reliability performance of that site. Furthercollection and analysis is an important means to ensure reliability growth during the lifecycle of an installation. Byproper collection and analysis of failure causes, it is possible to eliminate systematic failures by implementingmeasures against these failure causes. On the other hand, if this systematic approach fails it is likely that reliabilityperformance is impaired to an unacceptable level.
This appendix gives minimum requirements for collections of reliability data where failure modes and failure causesare important variables to include. Note that information on failure modes and failure causes also will be required inthe coming regulations by the Norwegian Petroleum Directorate (see § 17 “Innsamling og tilgjengeliggjøring av data”in “styringsforskriften”). This appendix does not require that pre-defined code-lists etc should be used. It is, however,highly recommended that the oil and gas industry adopts the same taxonomy, code lists etc such that the learningprocesses within the industry, and the feedback loops to the manufactures can be maximised. Unless there are explicitstrong arguments, the structure in ISO 14224 should be followed.
Figure F1 indicates important aspects of a maintenance management loop. The numbers in some of the boxescorrespond to the numbers used in the IEC 61508 life cycle.
Safety require-ments allocation
5
Overall operation andmaintenance planning
6
RAMS targets andtradeoff values
Updated Relia-bility parameters
Followup plan
Maintenanceplan
Work Ordersystem
Overall operation,mainteance and repair
14
Actual PM& CM
Follow upactions
Op. restrict.Budget allocation
Resource allocationInfrom regulator (NPD)
Data-base
DataAnalysis
Overall modifica-tion and retrofit
15
Reporting
Generic Relia-bility parameters
Trends, Pareto, CCF, FCA etcExtended reliability databases
Manufactures and vendorsInfrom regulator (NPD)
Inprovementmeasures Failures
BacklogPM & CM
Figure F1 Maintenance management loop
When the initial maintenance program is established, i.e. “6 Overall operation and maintenance planning”, onlygeneric data is available. Section F.4 gives guideline for how generic data could be used when the initial maintenanceprogram is set up. There is large uncertainty whether the generic data will be relevant for the actual installation.Therefore a conservative estimate for the initial failure rate should be used (λIMP in Figure F2). However, if a
4 The OREDA Data Handbook is published every 3-4 years. The OREDA® Database is available to most operatorson the Norwegian Continental Shelf. See Hansen & Vatn 1999 for PDS Reliability data

OLF Recommended Guidelines for the application of IEC 61508 and IEC 61511 in the petroleumactivities on the Norwegian Continental Shelf
No.: 070 Date effective: 01.02.2001 Revision no.: 01 Date revised: NA 40 of 46
systematic failure cause analysis is performed it is possible to argue that the new installation will expire a lowerfailure (λ’IMP in Figure F2), and hence maintenance intervals could be increased. The loop in Figure F1 also illustratesthat reliability data should be collected and analysed to improve the overall performance. Based on a proper failurecause analysis, it will be possible to implement measures to eliminate some of these failure causes. But a systematicfailure cause analysis could also be used to argue improved reliability performance (λUP2 in Figure F2) at an earlierstage than what is possible with only “statistical evidence” (λUP1 in Figure F2). The exact procedures for estimatingthese parameters are shown later on, but the principal issues are shown in Figure F2.
Initial reliability parameters
λ
Time
λIMP
λGEN
SD
λ'IMP
Updated reliability parameters
Proper failure causeanalysis
λUP1
λUP2
Uncertainty in genericreliability parameters
Figure F2 Failure rate estimates in different situations
F.2 5 Safety requirements allocationThis activity is covered in the main part of this guidelines.
F.3 RAMS targets and trade-off valuesInput to this stage is the SIL requirements from “ 5 safety requirements allocation”. The SIL requirements aredefined at a very generic level, and installation specific conditions are not taken into account. In order to use the SILrequirement for maintenance optimisation it is necessary to introduce a SIL correction factor: CFSIL. The followingparameters should at least be considered:∆f: change in demand rate for the safety function∆C: change in consequence of a safety function failure on demandIASIL: Inappropriate SIL value. When the SIL was selected in the first place, the interval levels of 10 may give
unreasonable results
Table F1 shows proposed values for the correction factor in different situations.
Table F1 Correction factors for SIL requirements
CFSIL Conditions for adjustment0.2 Two or more factors significant negative0.4 One factor significant negative1 No significant factors, or cancelling effects of factors3 One factor significant positive5 Two or more factors significant positive
For a given SIL requirement, i.e. SIL N, the PFD value to use in maintenance optimisation is given by
PFDA = CFSIL × 10-N (F1)

OLF Recommended Guidelines for the application of IEC 61508 and IEC 61511 in the petroleumactivities on the Norwegian Continental Shelf
No.: 070 Date effective: 01.02.2001 Revision no.: 01 Date revised: NA 41 of 46
F.4 Generic reliability parameters used in the definition of initial maintenance programAppendix D presents the formulas for calculating the PFD for a given set of reliability parameters. This section givesa procedure for selecting appropriate initial values for the failure rate. The presentation is for a general failure rate,say λ, and does not consider specifically the various elements, i.e. λDD, λDU, λSD and λSU.
Since a generic failure rate represents an “average” installation, the actual failure rate is expected to deviate from thegeneric failure rate. Now introduce:
λGen = Generic failure rate, i.e. found in OREDA, or PDS dataSDλ = Standard deviation, i.e. the standard deviation in the population from which the generic failure rate isestimated.λIMP = failure rate to use in establishing the initial maintenance program
Situation 1: No special analysis of the generic failure rate:In this situation we add the standard deviation to the generic failure rate:
λIMP = λGen + SDλ (F2)
Situation 2: Failure causes are taken into account:Assume that information about the failure causes’ contribution to the generic failure rate is available, i.e. based on theavailable information we may write:
λGen = λ1+λ2+…+λn (F3)
where the index i = 1,2,…,n runs through the n different failure causes. Further assume, that we have plant specificinformation that relates to the failure causes we may expect for the new installation, we may then adjust the genericfailure rate according to equation (F4):
λ’Gen = γ1 λ1+γ2 λ2+…+γnλn (F4)
where γi, i = 1,…,n are correction factors obtained from Table F2.
Table F2 Correction factors, γ based on failure cause analysis
γ Explanation/situation0.1 The failure cause is eliminated, or not relevant0.5 Measures to prevent the failure cause are implemented1.0 No specific conditions indicate that anything is changed for the failure cause1.5 Failure cause not considered2 The situation indicate that the conditions are extra bad for this failure cause5 The situation is significant worse with respect to this failure cause
The failure rate to use in the initial maintenance program is then:
λIMP = λ’Gen + λ’Gen SDλ/λGen (F5)
F.5 6 Overall operation and maintenance planningA maintenance program shall be established, which includes written procedures for maintaining, testing, andrepairing the SIS to maintain the required integrity level. This program shall be designed to reveal faults that are notautomatically detected by the SIS. Consideration needs to be given to non-availability during routine testing and theeffect of mean time to repair on the overall availability of the system. SIS maintenance shall include, but not belimited to, the following:• Regularly scheduled functional testing of the SIS;• Regular inspection of field equipment to ensure that there is no observable deterioration, for example: corrosion
or mechanical damage, damaged cabling or terminations, ineffective heat tracing, blockage of fire and gasdetectors etc.;
• Regularly scheduled preventative maintenance, as required (e.g., replacement of ventilation filters, lubrication,battery replacement, calibration, etc.);
• Repair of detected faults, with appropriate testing after repair.
OLF Recommended Guidelines for the application of IEC 61508 and IEC 61511 in the petroleumactivities on the Norwegian Continental Shelf
No.: 070 Date effective: 01.02.2001 Revision no.: 01 Date revised: NA 42 of 46
Several approaches and methods exist for establishing a maintenance program. Among these are RCM, RBI andTPM.
Vendor manuals that describe the SIS maintenance and testing requirements (e.g., battery maintenance, fusereplacement, etc.) may be included in the maintenance procedures.
For the following discussion, it is important to identify the type of preventive maintenance, and frequency ofmaintenance actions. We will only consider the situation with safety systems activated with a “low” demand rateaccording to IEC 61508. Further we consider the situation of functional testing with time between tests equal to τ, seeAppendix D. From Appendix D, we also find the relation between PFD and the parameters λ, β and τ, i.e.
PFD = PFD(λ, β ,τ) (F6)
To fulfil the acceptance criteria, we therefore must satisfy:
PFDA = PFD(λ, β ,τ) (F7)
Solving equation (F7) with respect to τ gives the maintenance interval.
Note that maintenance planning usually focuses on establishing type and amount of preventive maintenance. It is,however, strongly recommended that the anticipated corrective maintenance is planned with respect to the need forspare parts, procedures for work permit, required skill of maintenance staff, etc.
F.6 Maintenance planThe main results of the “ 6 Overall operation and maintenance planning” activity is a set of proposed maintenanceactivities, and recommended intervals between these activities. A necessary basis for implementing these results isthat the organisational and technical maintenance support functions are available. A major issue is therefore to ensurethe availability of the maintenance support functions. The maintenance actions are typically grouped intomaintenance packages, each package describing what to do, and when to do it.
Experience has showed that many accidents are related to maintenance work. When implementing a maintenanceprogram it is therefore of vital importance to consider the risk associated with the execution of the maintenance work.Checklists could be used to identify potential risk involved with maintenance work:• Can maintenance people be injured during the maintenance work?• Is work permit required for execution of the maintenance work?• Are means taken to avoid problems related to re-routing, by-passes etc.?• Can failures be introduced during maintenance work?• etc.Task analysis, see e.g. Kirwan & Ainsworth (1992), may be used to reveal the risk involved with each maintenancejob. The result of these analyses should be documented as a part of the maintenance plan.
If a SIS function needs to be bypassed while the process is in a hazardous state, administrative controls and writtenprocedures shall be provided to maintain the safety of the process. Particular attention should be put on resetting anyinhibits or overrides that may be necessary during testing, inspection and maintenance of the SIS.
Functional testing procedures:A documented functional test procedure, describing each step to be performed, shall be provided for each SIS.
The functional testing procedures shall include, but not be limited to, verifying the following:• Operation of all input devices including primary sensors and SIS input modules;• Logic associated with each input device;• Logic associated with combined inputs;• Trip initiating values (set-points) of all inputs;• Alarm functions;• Speed of response of the SIS when necessary;• Operating sequence of the logic program;• Function of all final control elements and SIS output modules;• Computational functions performed by the SIS;• Timing and speed of output devices;• Function of the manual trip to bring the system to its safe state;• Function of user diagnostics;• Complete system functionality;
OLF Recommended Guidelines for the application of IEC 61508 and IEC 61511 in the petroleumactivities on the Norwegian Continental Shelf
No.: 070 Date effective: 01.02.2001 Revision no.: 01 Date revised: NA 43 of 46
• The SIS is operational after testing.
F.7 Follow-up planThe follow-up plan should as a minimum cover the following items:
• Safety aspects of maintenance work;– Who is responsible for following up the results from e.g. task analysis– Methods for following up, e.g. formal review, arbitrary checks etc– Frequency for follow up actions– Budget for follow up actions
• Identification of database concept for collecting and analysing reliability data (also includes data about thetechnical condition of the equipment);– Who is responsible for development and maintenance of the database system– What system for quality assurance of the reporting is used, and who is responsible– Budget for reporting and quality assurance
• System for following up the “backlog”;– Who is responsible– What should trigger immediate actions (e.g. number of critical PM jobs exceeds a predefined number)– The frequency of ordinary investigation into the “backlog”
• Data analysis;– Who is responsible for the analysis– What type of analyses– Frequency of analysis– Budget for analysis
• Continuos improvement;– Who is responsible for systematic improvement work– Who is responsible for treating ad-hoc suggestions, and event-based need for improvement measures– Budget for evaluating proposed measures– Responsible for resource allocation when measures are to be implemented
• Updating maintenance plan;– Who is responsible updating the maintenance plan (intervals, etc)– Frequency of updating the plan
F.8 Work Order systemThe work order system is the mean for making the maintenance plan operational. In addition to implementing themaintenance plan, the Work Order system should also handle corrective maintenance.
F.9 Actual PM & CMIn principle, the work order system defines the maintenance the maintenance to be exceeded, and when to do it. Theactual maintenance being carried out is, however, another story.
F.10 Backlog PM & CMIn this context we will use the term ‘backlog’ for all scheduled preventive and corrective maintenance that is notperformed at due date. It does not exist a unique expression for measuring the backlog. In Figure F1 the “backlog”box is a “virtual” entity, and the measurable backlog is defined within the “work order system”.
F.11 Follow-up actions (backlog)It is of outmost importance to define the responsible persons or organisation units for the backlog follow-up. Thereare two main sources for action:• Automatic triggering from the “backlog system”, e.g. number of critical PM jobs exceeds a predefined number• Systematic analysis of the backlog at predefined intervals
Independent of the source, the following items should be considered:• Any operational restrictions, e.g. shut down of part of operation, restrictions on “hot work”, etc.;• Whether the regulator should be informed;
OLF Recommended Guidelines for the application of IEC 61508 and IEC 61511 in the petroleumactivities on the Norwegian Continental Shelf
No.: 070 Date effective: 01.02.2001 Revision no.: 01 Date revised: NA 44 of 46
• What are the causes for the large backlog, e.g. lack of money, lack of adequate personnel, pressure fromproduction unit to postpone maintenance work, organisational problems etc.;
• What could be done to overcome these problems;• A plan, responsible persons, and due dates for bringing the backlog under control.
F.12 ReportingAll maintenance work (functional testing, preventive maintenance, and corrective maintenance) shall be reported intoan electronic maintenance database. The information to report depends on the type of maintenance work, i.e.
Verification report for functional testing shall include• Date of inspection;• Name of the person who performed the test or inspection;• Serial number or other unique identifier of equipment (loop number, tag number, equipment number, user
approved number, etc.);• Results of inspection/test (“as-found” and “as-left” condition);• Details of any faults found and a link to the corresponding corrective maintenance report;• Any identification of erroneous test procedures, increased risk during inspection etc, should be reported.
Preventive maintenance report (PM) shall include• Date of PM;• Name of the person(s) who performed the PM work;• Serial number or other unique identifier of equipment (loop number, tag number, equipment number, user
approved number, etc.);• Maintenance activity;• Any need for corrective maintenance work.
Corrective maintenance report (CM) shall include• Date of failure detection;• Date of CM;• Name of the person(s) who performed the CM work;• Serial number or other unique identifier of equipment (loop number, tag number, equipment number, user
approved number, etc.);• Failure mode, i.e. Safe detected (SD), Safe undetected (SU), Dangerous detected (DD) and Dangerous undetected
(DU);• Failed part;• Failure cause;• Method of detection, e.g. PM, functional testing, inspection, self test etc.;• Corrective action;• Recommended action to eliminate the failure cause.
F.13 DatabaseThe database used in Figure F1 is a conceptual term. A reliability database may be realised as a part of the work ordersystem. It is essential that the database system allows for storing the information as required in this appendix.
F.14 Data AnalysisIt is essential that the scope of the data analysis is agreed upon. As a minimum the analysis should include:• A proper failure cause analysis (FCA);• Investigation into the failure reports to identify common cause problems (CCF);• Updated reliability data, see Appendix F.18 below. If assumption about reliability performance (e.g. SIL
requirements) are not met, this shall be formally treated.
The analysis group should also identify the need and relevance of:• Reporting to the regulator;• Feedback to the manufactures and vendors;• Reporting to generic databases, e.g. company specific, or OREDA.
F.15 Improvement measuresBased on the systematic failure cause analysis, improvement measures should be identified. Improvement measuresshould be evaluated in a cost-benefit setting as long as the SIL requirements could be met. If the actual reliabilityperformance threatens the SIL requirements, implementation of improvement measures are mandatory. Each
OLF Recommended Guidelines for the application of IEC 61508 and IEC 61511 in the petroleumactivities on the Norwegian Continental Shelf
No.: 070 Date effective: 01.02.2001 Revision no.: 01 Date revised: NA 45 of 46
improvement measure should be evaluated wrt whether it should be treated as a “modification or retrofit” accordingto the IEC 61508 lifecycle or not.
F.16 15 Overall modification and retrofitIf an improvement measure is classified as a “modification” or “retrofit”, the IEC 61508 life cycle process should befollowed.
F.17 Updated reliability parametersThis section present methods for updating reliability data in the lifecycle of a product. The principal situation is asfollows:
• Only the failure rate, λ, is considered in this presentation. Similar approaches could be developed for e.g. the βfactor;
• From the generic data, or previous updates of the failure rate, we have an uncertainty distribution for the failurerate. This distribution is either expressed by a mean and a standard deviation, or by the two parameters α and ξ inthe Gamma distribution (se below);
• Since the last update of the failure rate we have observed one or several components over a period of time equalto t. In this period we have observed totally X failures (with the failure mode of interest). In some situations wehave also implemented measures to eliminate one or more failure causes.
Expressing the uncertainty distribution of the failure rateAt any point of time in the life cycle of a product it will be uncertainty about what the “actual” value of the failurerate is. We want to quantify this uncertainty. There are three situations.
1. The uncertainty is given by the parameters α and ξ in the Gamma distribution. In this situation we observe thatthe expected value of the failure rate is E = α /ξ and the standard deviation is given by SD = α ½/ξ..
2. The uncertainty is given by the mean value E, and the standard deviation SD. In this situation we may obtain“corresponding” α and ξ by letting ξ = E/SD2, and α = ξ× E.
3. We have estimates for the mean, E, and “upper” and “lower” bounds, i.e. λU, and λL. In this situation wecalculate Log10(λU/λL), and obtain α from Table F33, and ξ = α/E.
Table F3 Estimates for α in the uncertainty distribution
Log10(λU/λL) 0.4 0.5 0.6 0.8 1 1.5 2 2.5 3 3.5 4α 10 8.5 6 3.7 2.4 1.25 0.85 0.7 0.5 0.45 0.4
Thus, we are able to express the uncertainty distribution of the failure rate by the parameters α and ξ in all situationsabove.
Updating the failure rate when failure causes are not availableIf information about failure causes are not available, the failure rate is updated using a simple method, e.g.
tX
++
=ξ
αλ̂ (F8)
where α and ξ are the parameters in the uncertainty distribution, X the number of failures in the observation period,and t is the exposure time. The uncertainty parameters could also be updated by
α = α + Xξ = ξ + t (F9)
and the new parameters α and ξ could be used for the next update of the failure rate.
Updating the failure rate when failure causes are analysed, and compensating measures against thefailure causes are implemented
OLF Recommended Guidelines for the application of IEC 61508 and IEC 61511 in the petroleumactivities on the Norwegian Continental Shelf
No.: 070 Date effective: 01.02.2001 Revision no.: 01 Date revised: NA 46 of 46
In situations where failure cases are analysed, and appropriate measures are implemented we could take credit of thisas indicated below.
Now, assume that the failures are classified according to the failure cause, and assume that we could group in i =1,…,n different failure causes. Prior to any measures we then have:
X = X1 + X2 +…+Xn (F10)
If compensating measures are implemented we could estimate a future “equivalent” to this number by:
X’ = γ1 X1 + γ2X2 +…+γnXn (F11)
Where γi, i = 1,…,n are correction factors due to the anticipated effect of implemented measure.The values of the parameters γi could be obtained from Table F4.
Table F4 Adjusting the number of future failures when means are implemented
γ Explanation/situation0.75 The measure is expected to have a certain effect on the given failure cause0.5 The measure is expected to have a significant effect on the given failure cause0.25 The measure is expected to have a significant effect on the given failure cause, and we
are able to explicit describe the content of the measure, and the anticipated effect0.1 The measure is expected to eliminate the failure cause. For such a judgement the
measure should be documented complete, and it should be explained how the measurewill eliminate the actual failure cause
When the different measures are implemented, a best estimate for the future failure rate is given by equation (F12):
tX
++=
ξαλ 'ˆ (F12)
Note that equation (F12) will give a lower failure rate estimate than equation (F8). However, in order to use equation(F12) it is required an explicit judgement of the failure causes, and how implemented measures could eliminate orreduce the failure cause. This will also require a certain quality level of the collection and analysis of reliability data.The uncertainty parameters could also be updated by equation (13):
α = α + X’ξ = ξ + t (F13)
and the new parameters α and ξ could be used for the next update of the failure rate.
Note that in this section we recommend to use the “best estimate” for the failure rate as input to the maintenanceoptimisation, where as in the initial phase we “added” one standard deviation to the failure rate.
F.18 ReferencesG. K. Hansen and J. Vatn. Reliability Data for Control and Safety Systems. 1998 Edition. Technical Report STF38A98445, SINTEF Industrial Management, N-7465 Trondheim, Norway, 1998.ISO 14224. Petroleum and natural gas industries - Collection and exchange of reliability and maintanance data forequipment. International Standards Organisation, 1999.B. Kirwan and L. K. Ainsworth. A Guide to Task Analysis. Taylor & Francis, London, 1992.OREDA-97. Offshore Reliability Data. Distributed by Det Norske Veritas, P.O.Box 300, N-1322 Høvik, Norway, 3edition, 1997. Prepared by SINTEF Industrial Management. N-7465 Trondheim, Norway