Guideline Air Interface Capacity Optimization 17-02-2009
61
1/61 Gerson Mann Capability Development A ir Interface Capacity Optimization Guideline, 17. February, 2009 17. February, 2009 Capability Development, ty Development, GSM/EDGE Air Interface Capacity Optimization Guideline Dimensioning Guideline, Capability Development, for internal use only, 17. February 2009 Air Interface Capacity Air Interface Capacity Optimization and Extension Guideline Optimization and Extension Guideline BR 10.0 BR 10.0 Version: 17.02.2009 Version: 17.02.2009 Version Version Date Date Author Author Approved by Approved by 1.01 17.02.2009 G. Mann
Transcript of Guideline Air Interface Capacity Optimization 17-02-2009
1/61 Gerson Mann Capability Development
Air Interface Capacity Optimization Guideline, 17. February, 2009
17. February, 2009
Capability Development, ty Development,
GSM/EDGE Air Interface Capacity Optimization Guideline Dimensioning Guideline, Capability Development, for internal use only, 17. February 2009
Air Interface Capacity Air Interface Capacity Optimization and Extension Guideline Optimization and Extension Guideline BR 10.0 BR 10.0
Version: 17.02.2009 Version: 17.02.2009
Version Version Date Date Author Author Approved by Approved by
1.01 17.02.2009 G. Mann
2/61 Gerson Mann Capability Development
Air Interface Capacity Optimization Guideline 17.02. 2009
Revision History
Issue Number
Date of Issue Reason for Update
1.0 21.01.2009 First release
1.01 17.02.2009 First PDF version
Authors The following persons have collaborated on this document:
Name Department
G. Mann Capability Development
3/61 Gerson Mann Capability Development
Air Interface Capacity Optimization Guideline, 17.02.2009
Table of Contents
0. Executive Summery....................................................................................................................................................6
1. Capacity Optimization Process ...............................................................................................................................7
2. Identifying the need for Capacity Optimization...................................................................................................8
2.1 Introduction to traffic measurements .................................................................................................................8 2.2 Tool Support..........................................................................................................................................................8 2.3 KPI to identify the Need for Capacity Optimization .........................................................................................9 2.5 Example: Management Summery Report.......................................................................................................11
3. Methods for Capacity Optimization at the Air Interface..................................................................................12
3.1 GSM – UMTS – LTE Multi Standard Networks..............................................................................................12 3.2 GSM Dual Band Networks 900 MHz – 1800 MHz.........................................................................................12 3.3 Software Features to handle Congestion Situations .....................................................................................13 3.4 Priority Concepts ................................................................................................................................................16 3.5 Capacity Optimization – Fast growing markets .............................................................................................16 3.6 Capacity Optimization – Low cost....................................................................................................................16 3.7 Capacity Optimization – High performance ....................................................................................................16 3.8 Classic Capacity Optimization Methods..........................................................................................................17 3.9 Conclusions .........................................................................................................................................................23
4. Estimating the Offered Load by Analyzing Traffic Measurements .............................................................24
4.1 Estimating the Offered Load - Signaling .........................................................................................................24 4.2 Estimating the Offered Load - Voice................................................................................................................26 4.3 Estimating the Offered Load – (E)GPRS ........................................................................................................27 4.4 The Combined Time Slot Occupation Rate ....................................................................................................28
5. Estimating the Theoretical Maximum Cell Capacity ........................................................................................29
5.1 Computer Simulations, Dimensioning Guidelines and Tools.......................................................................29 5.2 Frequency Reuse Considerations ...................................................................................................................31
5.2.1 Frequency Reuse for BCCH style TRX ......................................................................................................32 5.2.2 Frequency Reuse for (E)GPRS style TRX .................................................................................................33 5.2.3 Frequency Reuse for TCH style TRX .........................................................................................................34
5.3 Signaling – Theoretical Cell Capacity ............................................................................................................37 5.3.1 CS Signaling Channels .................................................................................................................................37 5.3.2 PS Signaling Channels..................................................................................................................................41
5.4 Voice –Theoretical Cell Capacity .....................................................................................................................43 5.4.1 Hard Blocking Considerations......................................................................................................................43 5.4.2 Soft Blocking Considerations .......................................................................................................................44 5.4.3 Dimensioning Examples, Bandwidth 5.0 MHz ...........................................................................................44 5.4.3 Dimensioning Examples, Bandwidth 7.5 MHz ...........................................................................................46
5.5 (E)GPRS – Theoretical Cell Capacity .............................................................................................................47 UT

4/61 Gerson Mann Capability Development
Air Interface Capacity Optimization Guideline 17.02. 2009
5.5.1 Priority concepts in GSM / (E)GPRS Networks .........................................................................................47 5.5.2 Mixed Voice and (E)GPRS capacity ...........................................................................................................48 5.5.3 Additional (E)GPRS capacity .......................................................................................................................49
6. Channel Creation and Configuration ...................................................................................................................50
7. Long Term Expansion Planning............................................................................................................................59
8. Annex ...........................................................................................................................................................................60
8.1 Annex A: Air Interface Dimensioning Tools ....................................................................................................60 8.2 Annex A: Air Interface Dimensioning Guidelines ...........................................................................................61
5/61 Gerson Mann Capability Development
Air Interface Capacity Optimization Guideline, 17.02.2009
References [1] Telephone Traffic Theory Tables and Charts, Siemens AG 1981, ISBN 3-8009-1343-7
[2] BR10.0 Customer documentation, issue 2, file: omnbscnetconfb.pdf, BSC Radio Network Configuration basics
[3] BR10.0 Customer documentation, issue 2, file: sbspmscounter.pdf, Counter
[4] BR10.0 Customer documentation, issue 2, file: kpi.pdf, KPI
[5] BR10.0 Customer documentation, issue 2, file: dimsdcch.pdf, SDCCH dimensioning
[6] BR10.0 Customer documentation, issue 2, file: dimran.pdf, RAN dimensioning
[7] BR10.0 Customer documentation, issue 2, file: dimair.pdf, Air interface dimensioning
[8] Air Interface Dimensioning, BR 10.0, PMN-0 Planning Manual, Network Engineering
[9] Access Network Dimensioning CS, BR 10.0, PMN-0 Planning Manual, Network Engineering
[10] Access Network Dimensioning PS, BR 10.0, PMN-0 Planning Manual, Network Engineering
[11] Dimensioning Guideline, Air Interface Dimensioning CS Capacity, Network Engineering
[12] Dimensioning Guideline, Air Interface Dimensioning PS Capacity, Network Engineering
[13] Dimensioning Guideline, Radio & Access, Network Engineering
[14] Breaking Through AMR Voice Capacity Limits due to Dropped Calls by Control Channel Improvements in GERAN Networks, K. Ivanov, Conference Proceedings
[15] Simple Model of Service Dependent Channel Allocation in Mobile Networks MÜLLNER, BALL, IVANOV, and other, ICT-MobileSummit 2008 Conference Proceedings Paul Cunningham and Miriam Cunningham (Eds) IIMC International Information Management Corporation, 2008 ISBN: 978-1-905824-08-3
[16] T. Halonen, GSM, GPRS and EDGE Performance, 2002, John Wiley & Sons, LTD,
ISBN 0470844574
[17] BR10.0 Customer documentation, issue 2, file: gprs.de, GPRS
[18] BR10.0 Database Engineering Manual, Feature Complex Manuals
6/61 Gerson Mann Capability Development
Air Interface Capacity Optimization Guideline 17.02. 2009
0. Executive Summery The introduction of the Mobile Internet, new Hot-Spots, like a shopping centre, a growth of the subscriber base, or seasonal variations may cause the need to optimize or to extend the capacity of a network. As long as enough capacity is available, signaling, voice- and data calls can be processed. A shortage of capacity will result in blocked signaling messages and blocked voice calls. Data calls will be downgraded to lower bitrates or even entirely blocked. A detailed study on the load situation is recommended on a regular basis. One of the challenges is that the capacity demand can change between the seasons, between working days and weekends, and also during the time of the day. A cell that is serving a ski resort may only carry high traffic during the winter time, and only on the weekends. As a consequence, Base Stations may need different periods of time to achieve the return on investment. The objective of this guideline is to introduce simplified engineering models that allow estimating the needed number of transceivers (TRX) in a radio cell and the appropriate number of base stations (BTS) in a geographical area. Once the number of TRX and BTS that are connected to a BSC has changed, or the service mix has changed, the capacity of all other interfaces in the network such as A-sub, A-bis, A, Gb, ... may need to be revised. A separate (Re-) dimensioning guideline is provided for the Access network [6]. A number of software features [2] allow an improved utilization of the installed hardware resources and can provide temporary relieve in certain overload situations. The selection and configuration of these features depends on the operator’s philosophy. A separate description for system features and their configuration is available [2], [17], [18].
7/61 Gerson Mann Capability Development
Air Interface Capacity Optimization Guideline, 17.02.2009
1. Capacity Optimization Process Capacity planning for a new, Greenfield network: The simplest model for a new, Greenfield network assumes hexagonal shaped radio cells, an equal number of subscribers in all radio cells and the same voice traffic load for each subscriber. The “Offered Load per cell” would be:
subscriberErlangsubscriberperLoadOfferedErlangcellperLoadOffered ]*#[___][___ =
The number of TRX needed in a radio cell can be looked up from the Erlang table [traffic book]. The “Theoretical Maximum Cell Capacity” is furthermore determined by the available frequency spectrum, the considered software features, the maximum number of TRX per cell and the considered service mix between the different voice codecs, (E)GPRS services and signaling. Capacity optimization for an operational network: The need for capacity optimization can be identified by analyzing traffic measurements that can be taken from the operational, live network. Blocking on signaling channels, blocking on voice channels, low throughput or even blocking of data calls can indicate that the “Offered Load” is not equally distributed like in a theoretical, hexagonal shaped network model. The “Offered Load per cell” can be estimated by analyzing traffic measurements and be compared against the “Theoretical Maximum Cell Capacity”. Than the most appropriate optimization method can be selected. The guideline provides information on:
• How to estimate the “Offered Load per cell” by analyzing traffic measurements
• How to estimate the “Theoretical Maximum Cell Capacity”
• Selection of Capacity Optimization Methods Missing capacity can be provided by:
• Software Re-configuration
• Hardware reshuffling program
• Installation of additional, new hardware components
The most appropriate optimization method can be different for every network and for every radio cell. The success of the applied capacity optimization method can be verified by traffic measurements. Traffic measurements for optimized radio will indicate lower blocking for signaling channels and voice calls, for data calls the blocking and the throughput will indicate better values.
8/61 Gerson Mann Capability Development
Air Interface Capacity Optimization Guideline 17.02. 2009
2. Identifying the need for Capacity Optimization 2.1 Introduction to traffic measurements Mobile subscribers initiate voice- and data calls at random and independently from each other, make calls of variable length and transmit varying data volumes [1]. As a consequence the number of time slots that are occupied in a radio cell will always fluctuate. Periodical regularities that depend on seasonal factors can be observed as well as variations that depend on the different days of the week. The strongest changes can be observed during the course of a day. There could be high demand for capacity during day time and low demand for capacity during night time. The highest demand is observed during the “Busy Hour” (BH). Every radio cell in a network may have the BH at a different point of time. Telecommunication systems can be designed so that even at the busiest times the traffic can be handled smoothly and to the satisfaction of the subscriber. Base Stations (BTS) that are located in densely populated areas can achieve the return on investment in a comparatively short period of time. BTS installations that serve a ski resort in some remote areas may need many years until the return on investment is achieved. The Counter and Key Performance Indicators (KPI) that can be used to analyze the (Over-) load situation are described in great detail in [3], [4].
2.2 Tool Support All traffic measurements need to be activated at the Radio Commander by trained engineers. Than the base station system will generate a file with measurement results and store the file on the hard disk of the BSC. This file contains measurement data for all BTS that are connected to the BSC. The Measurement files can be uploaded from the BSC to the Radio Commander and send from there by E-Mail to the Planning and Optimization Office. A number of tools are available to translate the text files with traffic measurements into more readable tables or diagrams. The following tools are frequently used:
• Measurement Viewer (Included in the Radio Commander)
• Enhanced measurement Viewer (Radio Commander, new in RC10.0)
• SPOTS (Carrier Grade Tool, for usage at the Operation and Maintenance Centre, OMC)
• AnatomN (Light Engineering Tool, to be used also on standalone notebook computers)
• Batrana
Traffic measurement results can be displayed in charts or tables. In a table each line would contain measurements for one radio cell and the columns show the values for different counter and KPI.
9/61 Gerson Mann Capability Development
Air Interface Capacity Optimization Guideline, 17.02.2009
2.3 KPI to identify the Need for Capacity Optimization Blocking on signaling, voice- and data channels can indicate the need to optimize the capacity resources at the air interface. The below Key Performance Indicator (KPI) can be used to conduct measurements in BR10.0 [4]: KPI to analyze Blocking on Signaling Channels: KPI_BR10.0_10.1.4 SDCCH Blocking Rate Blocking Rate on SDCCH Signaling Channels KPI_BR10.0_11.5 PCH Loss Rate Blocking Rate on PCH Signaling Channels KPI_BR10.0_11.6 AGCH Loss Rate Blocking Rate on AGCH Signaling Channels KPI_BR10.0_12.5 PPCH Loss Rate Blocking Rate on PPCH Signaling Channels KPI_BR10.0_12.6 PAGCH Loss Rate Blocking Rate on PAGC Signaling Channels Benchmark: Often a value of 1% is accepted signaling channels KPI to analyze Blocking on Voice Channels: KPI_BR10_9.1.6 TCH Loss Rate: Blocking Rate on TCH voice channels, all codecs Benchmark: Often a value of 2% is accepted for all voice codecs KPI_BR10_9.1.9 DMA Loss Rate Soft Blocking Indicator (DMA layer) KPI to analyze Throughput and Blocking on (E)GPRS Channels Shortage of resources, reduced number of PDCH assignments: KPI_BR10.0__18.1.6 Rate for TBF establishment with reduced PDCH assignment This indicator provides the mean rate of successful TBF establishment where only a reduced number of PDCHs was assigned to the mobile due to lack of resources. "Degraded assignment" means that the allocation assigned to a MS does not correspond to best configuration possible fitting with the ABQP/QoS/Multislot class combination. The indicator distinguishes uplink and downlink direction. Shortage of resources, Multiple TBF needs to be multiplexed on a PDCH: KPI_BR10.0_18.2.11 Mean number of TBFs multiplexed on same PDCH This indicator provides the mean number of TBFs multiplexed on the same PDCH (horizontal allocation) for the uplink and downlink direction. In MSC-9 the maximum throughput is 59.2 kBit/s. If 2 or more TBF need to share a time slot, the user throughput will be reduced.
10/61 Gerson Mann Capability Development
Air Interface Capacity Optimization Guideline 17.02. 2009
Shortage of resources, TBF needs entirely to be blocked: KPI_BR10.0_18.1.5 TBF establishment failure rate (TBF loss rate, a,b,c,d) TBFLossRate = 100 * (REJPDASS / NUCATCL) This indicator provides the TBF establishment failure rate per cause considering uplink and downlink directions. User Throughput on radio interface per cell: KPI_BR10.0_18.2.2 User Throughput on radio interface per cell This indicator provides the mean LLC throughput on the air interface per cell. Retransmissions are excluded; therefore only the amount of data transmitted on behalf of the application layer (here LLC) is considered. The uplink/downlink directions are separated.
The KPI does not indicate the packet throughput experienced by a single subscriber. Instead the KPI refers to the mean user packet load of a whole cell according to the following model: The user packet volume transmitted for a cell is accumulated over the whole granularity period and afterwards divided by the length of granularity period.
Benchmark: The throughput on (E)GPRS time slots is determined by a large variety of parameters. For (E)GPRS coding scheme MSC-9 a maximum theoretical throughput of 59,2 kbit/s per time slot can be achieved for C/I values that can usually be found in close proximity to the BTS. Towards the cell boarder C/I may deteriorate, a more robust coding scheme may need to be chosen by the system and the throughput per time slot can decrease to zero due to interference. Also the load situation in the network can influence. In a very well optimized, real network the average throughput per time slot can exceed 30 or 40 kbit/s per time slot if the necessary number of BTX and TRX are installed. Potential interference problems: KPI_BR10.0_18.1.20 Link adaptation frequency An unusual high number of link adaptations could indicate potential interference problems which can cause low throughput in a radio cell. KPI to analyze the combined time slot occupation rate for CS and PO traffic in a radio cell: KPI_BR10_9.2.1: Combined time slot occupation rate for CS and PO Traffic Benchmark: In a fast growing market a benchmark could be defined to identify, when the next BTS needs to be installed. Example: For a cell with 1 TRX, voice FR only, 70% utilization corresponds to approximately 20% blocking of voice calls. The situation changes when half rate is enabled or more TRX are installed in the cell.
11/61 Gerson Mann Capability Development
Air Interface Capacity Optimization Guideline, 17.02.2009
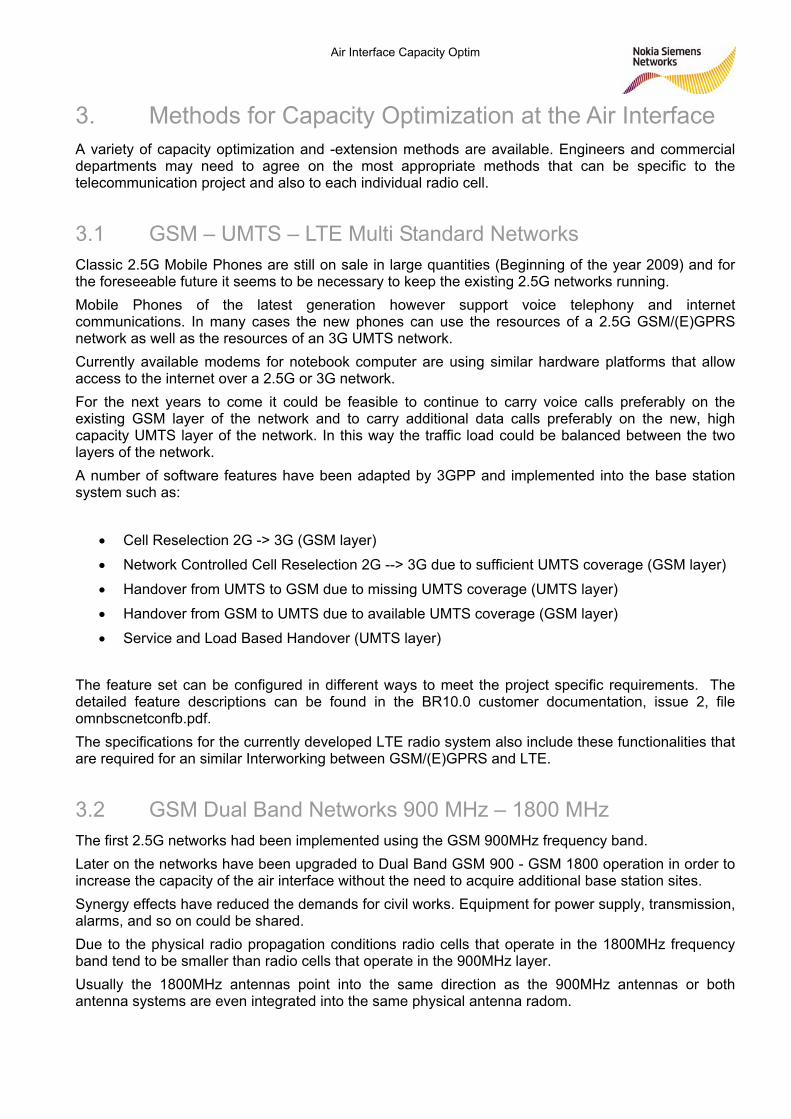
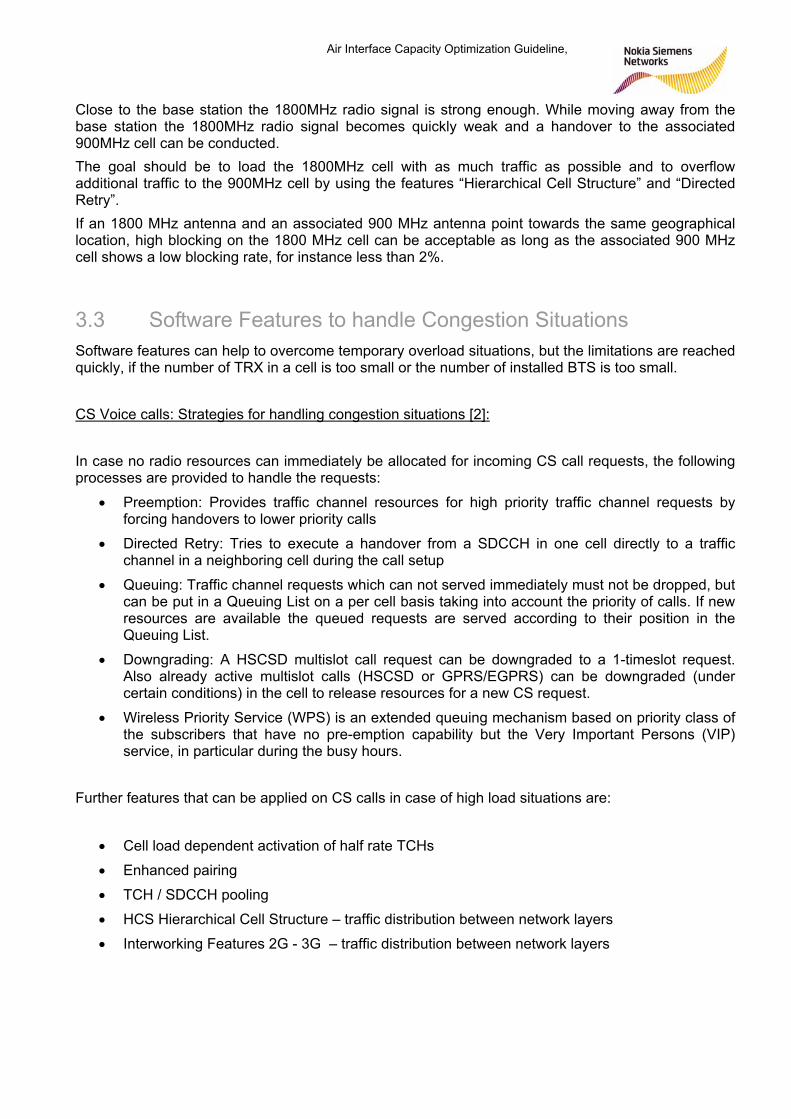
2.5 Example: Management Summery Report The management could be interested to receive frequently a report on the system status. A simple report on voice traffic channel congestion and signaling channel congestion could be prepared based on system statistics as indicated in fig. 2.1 and fig. 2.2.
Voice Traffic Cannel Congestion Number of radio cells
< 2% 682
2% … 10% 536
> 10% 417
Fig. 2.1: Example report on traffic channel congestion Fig. 2.2: Example charts on traffic channel and signaling channel congestion Radio cell number 0 to radio cell number 1634 in the network is represented by one point in the chart. The demand for capacity optimization and capacity extensions can clearly be identified. Voice calls can be given priority over (E)GPRS calls. It is therefore clear from the above chars, that in addition to high blocking of voice calls also (E)GPRS calls are suffering from a lack of resources. It is also possible to introduce additionally (E)GPRS measurements considering the above mentioned KPIs.
12/61 Gerson Mann Capability Development
Air Interface Capacity Optimization Guideline 17.02. 2009
3. Methods for Capacity Optimization at the Air Interface A variety of capacity optimization and -extension methods are available. Engineers and commercial departments may need to agree on the most appropriate methods that can be specific to the telecommunication project and also to each individual radio cell.
3.1 GSM – UMTS – LTE Multi Standard Networks Classic 2.5G Mobile Phones are still on sale in large quantities (Beginning of the year 2009) and for the foreseeable future it seems to be necessary to keep the existing 2.5G networks running. Mobile Phones of the latest generation however support voice telephony and internet communications. In many cases the new phones can use the resources of a 2.5G GSM/(E)GPRS network as well as the resources of an 3G UMTS network. Currently available modems for notebook computer are using similar hardware platforms that allow access to the internet over a 2.5G or 3G network. For the next years to come it could be feasible to continue to carry voice calls preferably on the existing GSM layer of the network and to carry additional data calls preferably on the new, high capacity UMTS layer of the network. In this way the traffic load could be balanced between the two layers of the network. A number of software features have been adapted by 3GPP and implemented into the base station system such as:
• Cell Reselection 2G -> 3G (GSM layer)
• Network Controlled Cell Reselection 2G --> 3G due to sufficient UMTS coverage (GSM layer)
• Handover from UMTS to GSM due to missing UMTS coverage (UMTS layer)
• Handover from GSM to UMTS due to available UMTS coverage (GSM layer)
• Service and Load Based Handover (UMTS layer) The feature set can be configured in different ways to meet the project specific requirements. The detailed feature descriptions can be found in the BR10.0 customer documentation, issue 2, file omnbscnetconfb.pdf. The specifications for the currently developed LTE radio system also include these functionalities that are required for an similar Interworking between GSM/(E)GPRS and LTE.
3.2 GSM Dual Band Networks 900 MHz – 1800 MHz The first 2.5G networks had been implemented using the GSM 900MHz frequency band. Later on the networks have been upgraded to Dual Band GSM 900 - GSM 1800 operation in order to increase the capacity of the air interface without the need to acquire additional base station sites. Synergy effects have reduced the demands for civil works. Equipment for power supply, transmission, alarms, and so on could be shared. Due to the physical radio propagation conditions radio cells that operate in the 1800MHz frequency band tend to be smaller than radio cells that operate in the 900MHz layer. Usually the 1800MHz antennas point into the same direction as the 900MHz antennas or both antenna systems are even integrated into the same physical antenna radom.
13/61 Gerson Mann Capability Development
Air Interface Capacity Optimization Guideline, 17.02.2009
Close to the base station the 1800MHz radio signal is strong enough. While moving away from the base station the 1800MHz radio signal becomes quickly weak and a handover to the associated 900MHz cell can be conducted. The goal should be to load the 1800MHz cell with as much traffic as possible and to overflow additional traffic to the 900MHz cell by using the features “Hierarchical Cell Structure” and “Directed Retry”. If an 1800 MHz antenna and an associated 900 MHz antenna point towards the same geographical location, high blocking on the 1800 MHz cell can be acceptable as long as the associated 900 MHz cell shows a low blocking rate, for instance less than 2%.
3.3 Software Features to handle Congestion Situations Software features can help to overcome temporary overload situations, but the limitations are reached quickly, if the number of TRX in a cell is too small or the number of installed BTS is too small. CS Voice calls: Strategies for handling congestion situations [2]: In case no radio resources can immediately be allocated for incoming CS call requests, the following processes are provided to handle the requests:
• Preemption: Provides traffic channel resources for high priority traffic channel requests by forcing handovers to lower priority calls
• Directed Retry: Tries to execute a handover from a SDCCH in one cell directly to a traffic channel in a neighboring cell during the call setup
• Queuing: Traffic channel requests which can not served immediately must not be dropped, but can be put in a Queuing List on a per cell basis taking into account the priority of calls. If new resources are available the queued requests are served according to their position in the Queuing List.
• Downgrading: A HSCSD multislot call request can be downgraded to a 1-timeslot request. Also already active multislot calls (HSCSD or GPRS/EGPRS) can be downgraded (under certain conditions) in the cell to release resources for a new CS request.
• Wireless Priority Service (WPS) is an extended queuing mechanism based on priority class of the subscribers that have no pre-emption capability but the Very Important Persons (VIP) service, in particular during the busy hours.
Further features that can be applied on CS calls in case of high load situations are:
• Cell load dependent activation of half rate TCHs
• Enhanced pairing
• TCH / SDCCH pooling
• HCS Hierarchical Cell Structure – traffic distribution between network layers
• Interworking Features 2G - 3G – traffic distribution between network layers
14/61 Gerson Mann Capability Development
Air Interface Capacity Optimization Guideline 17.02. 2009
PS data calls: Preemption and priority concept for packet switched calls [2]: GPRS/EGPRS downgrading: The downgrade of multislot packet resources is executed as follows:
• The BSC looks if there are channels in the cell used as PDCHs for (E)GPRS services.
• The PDCHs not-reserved as GPRS/EGPRS channels are downgraded in order to free resources to be used by CS services.
Configuration of the downgrading strategy: To avoid GPRS/EGPRS downgrading, the user can use the GMANPRES attribute. The following downgrade strategies on active multislot calls are possible and can be set via the DGRSTRGY (“downGradeStrategy”) attribute:
• Downgrade of HSCSD calls first
• Downgrade of GPRS/EGPRS calls first
• Downgrade of HSCSD calls only
• Downgrade of GPRS/EGPRS calls only
• No Downgrade
When downgrading of (E)GPRS/HSCSD calls is performed, the following rules are obeyed:
• For the HSCSD service the downgrade is executed only if the number of used timeslots is greater than one (i.e. at least one timeslot must remain allocated for HSCSD calls).
• For the GPRS/EGPRS service there are two possibilities: o If no channels of the cell are statically reserved to GPRS/EGPRS, the downgrade
can reduce the number of used timeslots to zero. o If any channel is statically defined for GPRS/EGPRS, the downgrade can reduce
the number of used timeslots to the number of channels reserved to (E)GPRS. Before downgrading a GPRS/EGPRS call on a TRX where CS calls are preferred, a free channel on TRXs not preferred for CS calls is searched first; independently on the value of the attribute: DGRSTRGY, if there are some empty channels (for example PDCHs for which the PDCH empty timer is running), they are used to serve the CS call; if no empty channels exists, then the rules defined by the attribute: DGRSTRGY are followed to free resources for the CS call. The downgrade of the PDCHs is applied, until the number of the reserved channels for PS services is reached in the cell (reserved PS channels cannot be downgraded). A preemption and priority concept for packet-switched call requests in case of congestion of radio resources is implemented by the Allocation Retention Priority feature (ARP).
15/61 Gerson Mann Capability Development
Air Interface Capacity Optimization Guideline, 17.02.2009
Reserved PDCH in a cell: In a radio cell a number of time slots can be reserved to ensure a minimum availability of resources for (E)GPRS even in situations of high congestion. These time slots are exclusively reserved for (E)GPRS services and can not be used for voice services. The number of reserved PDCH in a cell is determined by the parameters:
• GMANPRESPRM: Number of reserved GPRS PDCHs in the primary area of the cell
• GMANPRESCOM: Number of reserved GPRS PDCHs in the complementary area of the cell. In case of a standard cell, only GMANPRESPRM is meaningful.
• EMANPRESPRM: Number of reserved EDGE PDCHs in the primary area of the cell
• EMANPRESCOM: Number of reserved EDGE PDCHs in the complementary area of the cell. In case of a standard cell, only EMANPRESPRM is meaningful.
Dynamic Allocation of Time Slots between Voice- and (E)GPRS services in a radio cell: The parameter GPDPDTCHA (“gprsPercentageOfDynamicPdtchAvailable“), (range: 0..100), (default=100) indicates the percentage of shared CS/PS radio channels which can be dynamically allocated to (E)GPRS calls. Further features that can influence the throughput of PS data calls:
• Allocation Retention Priority
• Horizontal / Vertical time slot allocation (High (E)GPRS performance -> Horizontal, Save resources ->Vertical)
• Reserved time slots for (E)GPRS strategies the user can adopt different strategies to configure packet switched data services in a cell; for
example he/she can: a) Reserve at least one static timeslot for GPRS/EGPRS specific signaling, and configure other dynamic timeslots (shared with circuit switched services) for GPRS/EGPRS data; b) Reserve at least one timeslot for GPRS/EGPRS specific signaling, and configure other static timeslots (shared with circuit switched services) for GPRS/EGPRS data; c) Not reserve any timeslot for GPRS/EGPRS specific signaling, and configure some static timeslots for GPRS/EGPRS data; d) Not reserve any timeslot for GPRS/EGPRS specific signaling, and configure some dynamic timeslots for GPRS/EGPRS data;
e) Not reserve any timeslot for GPRS/EGPRS specific signaling, and configure both some static and some dynamic timeslots.
• (E)GPRS radio resource management enhancements regarding QoS support
• Control of the number of allocated timeslots
• Control of the allocated coding scheme, dependent on interference situation
16/61 Gerson Mann Capability Development
Air Interface Capacity Optimization Guideline 17.02. 2009
3.4 Priority Concepts As long as enough resources are available in a radio cell, signaling, voice- and data calls can be processed. A shortage of resources will result in blocked signaling messages and blocked voice calls. Data calls can be downgraded to lower bitrates and, if necessary, entirely blocked. In high load situations priority can be given to voice calls and (E)GPRS calls can be downgraded to a minimum throughput equivalent to 1/16 of a single time slot (Downlink) before the data call will be entirely blocked [2]. This mechanism allows introducing three basic concepts for the optimization of the air interface resources in 2.5G GSM / (E)GPRS networks:
3.5 Capacity Optimization – Fast growing markets As soon as the KPI “Combined Time Slot Utilization” for signaling, voice and data exceeds in a radio cell a certain threshold of, for instance, 70%, a new base station (BTS) could be taken out of the store and being installed immediately. Note: For a cell with 1 TRX, voice FR only, 70% utilization corresponds to approximately 20% blocking of voice calls. The situation changes when half rate is enabled and more TRX are installed. This method could be applied in very fast growing markets. There is a risk of over investing and delayed return on investment if the traffic does not grow as expected.
3.6 Capacity Optimization – Low cost The radio cells would be re-engineered to accommodate during the most busy hour the offered voice traffic with a blocking rate of 2%. According to the Erlang theory, some time slots will in average remain unused for voice service. These time slots can temporarily carry (E)GPRS traffic. Voice calls can be given priority over (E)GPRS data calls. As a consequence it must be accepted, that in high load situations (E)GPRS calls could be down graded to lower throughput or entirely be blocked. Outside the cells busy hour the system can assign more time slots for (E)GPRS services. The reduced performance requirements translate directly into lower investments and into better return on investment. Voice Calls: A high utilization of the frequency spectrum, a high number of installed TRX per cell and high percentage of Half Rate Calls may reduce the voice quality but requires installing less BTS.
3.7 Capacity Optimization – High performance The re-engineering of the radio cell would target to have even during the cells busy hour sufficient radio resources available for voice, signaling and GPRS/EDGE. This translates into more hardware, higher investments but also into better performance. First the radio cells would be re-engineered to accommodate the offered voice traffic. Additional capacity would be added to accommodate (E)GPRS data calls. Voice Calls: A low utilization of the frequency spectrum, a low number of installed TRX per cell and low percentage of Half Rate Calls may improve the voice quality but requires installing more BTS. Data call related capacity upgrades can be done with (E)GPRS or UMTS technology.
17/61 Gerson Mann Capability Development
Air Interface Capacity Optimization Guideline, 17.02.2009
3.8 Classic Capacity Optimization Methods Interference Immunity and changing Performance Objectives: Engineers translate the commercial- and technical requirements into the physical network implementation by the provision of BTS sites, TRX and other equipment. The key aspect is the selection and the design of BTS sites that impacts directly the ability to satisfy the different performance objectives. While the network grows from a startup network towards maturity different objectives dominate. The main stages of network maturation are indicated in table 3.1 as well as the difficulties to satisfy each of the different performance objectives. % Startup Network Mature Network Radio Coverage High Priority Medium Priority Interference Immunity and Capacity Low Priority High Priority
Table 3.1: Stages of network maturation and changing performance objectives In early stages of a network rollout radio coverage is the top priority. BTS sites with very high antennas are sometimes chosen to achieve maximum radio coverage as soon as possible with a low number of BTS. In later stages of a network rollout more capacity is needed. More TRX per radio cell and more BTS need to be installed and interference becomes the limiting factor for the cell capacity. An unfortunate consequence of this priority flip is that the criteria for selecting a BTS site for coverage, is exactly the opposite to the criteria for interference immunity that would allow installing a high number of TRX in a cell. A BTS site with very high antennas provides maximum radio coverage; a BTS site with very low antenna height provides maximum interference immunity and maximum capacity. To avoid interference, poor speech quality and dropped calls in later stages of the network live cycle, the early installed BTS antennas may need to be tilted, lowered or even de-commissioned. In the best of all circumstances the early installed, high rising BTS sites, can be used as umbrella cells with only 1 TRX to fill coverage holes. Furthermore these sites could be used as microwave relay stations and BSC sites. On one hand the operator could be interested to install all BSC in one location to simplify maintenance. If the price for transmission lines is very high, the operator could be interested to use such sites as a traffic concentrator and to install the BSC at such locations. Radio planning tools such as “ACORN” or “ACTIX Radio Planner” allow performing automatic calculation to optimize antenna azimuths and antenna tilts in a mobile communication network. The “Golden Rule” to achieve high cell capacity seems to be:
• Try to implement a regular, hexagonal shaped cell layout as far as possible
• The BTS antenna must be as high as necessary but as low as possible.
Lowering the antenna heights, optimizing all antenna azimuths and antenna tilts may not only allow reducing the influence of interference. In the best of all circumstances the network can be operated with a lower number of frequencies and the free frequencies would allow installing more TRX per radio cell.
18/61 Gerson Mann Capability Development
Air Interface Capacity Optimization Guideline 17.02. 2009
Comparing the Planned- against the Installed Capacity: A first step in optimizing the air interface capacity could be to verify whether or not the number of TRX that has been planned to be available in each radio cell is indeed installed and working. There could be a mismatch due to a variety of reasons. If the number of installed- and planned TRX is not the same, capacity, interference- and other performance problems could disturb normal network operations. Planning Data are available from a number of databases such as:
• Radio Planning Tool Net-Act
• BSC database (Backup)
• a specific database Data on the Installed capacity can be identified by analyzing:
• BSC database (Upload of a live database)
• System statistics (KPI and Counter)
The following KPI [4] and counter [3] are available in BR10.0:
• KPI_BR10_17.1 Transceiver_Availability
• KPI_BR10_17.3 TCH Availability
• KPI_BR10_17.4 SDCCH Availability
• BR10.0_Counter_4.16.1_TRANAVTI (11,1): Transceiver Available Time This measurement provides the total time a specified TRX has been available
• BR10.0_Counter_4.2.2.1_ NDESDCCH (1,42): Number of Defined SDCCHs This measurement provides the number of SDCCHs which were defined period.
• BR10.0_Counter_4.2.1.1_ NRDEFTCH (1,41): Number of Defined TCHs This measurement provides the number of TCHs which were defined
• BR10.0_Counter_4.2.3.1_NDFTCHSD (1,46): Number of Defined TCH/SD This measurement provides the number of TCH/SD channels which were defined
• BR10.0_Counter_4.7.1.1 NDEFPDCH (9,23): Number of Defined PDCHs per cell This measurement provides the number of reserved PDCHs per cell.
19/61 Gerson Mann Capability Development
Air Interface Capacity Optimization Guideline, 17.02.2009
Verification of time slot assignments: The time slots in a radio cell can be assigned to different services. A possible working task in the framework of capacity optimization could be to compare the planned time slot assignments against the settings in the BSC database and also against the readings that can be taken from the system statistics. The objective would be to ensure that the planned time slot assignment strategy is also implemented in the network. Verification of the frequency plan: The frequency plan for the network will usually be prepared with a radio planning tool such as NetAct-Planner and than be implemented into the BSC database. The following tool chain will typically be used for data processing: NetAct-Radio-Planner <-> Manual Data Transfer <-> Caddie/CM* <-> BSC database Caddie/CM* can conduct in the BR10.0 version 864 different cross-table checks on the parameter consistency. In case that a BCCH frequency will be changed, the frequency must also be changes in all neighbor cells. This is one of the tests that CM*Caddie can conduct automatically. It could be the case that the full tool chain is not always available when upgrades or replacements need to be done. Therefore a possible working task in the framework of capacity optimization could be to compare the frequency plan as it is available in NetAct-Planner against the frequency plan as it is implemented in the BSC – database. The goal would be to ensure that:
• The frequency in NetAct-Planner is the same as in the BSC database
• The same number of TRX are present in NetAct Planner and the BSC database A consolidation between planned and implemented:
• number of TRX per cell and
• proper parameter settings can help to solve interference and capacity issues.
20/61 Gerson Mann Capability Development
Air Interface Capacity Optimization Guideline 17.02. 2009
Load Balancing between Neighbor Cells: If a radio cell is highly congested and the neighbor cells carry low traffic, the traffic load in the congested cell could be lowered and some traffic could be transferred to the more moderate loaded neighbor cells. For the congested cell the antennas could be tilted or lower the transmission power could be reduced by some dB (Siemens BTS database, object TRX, parameter: PWRRED) if the neighbor cells can provide sufficient radio coverage. Cell Load dependent activation of Half Rate Speech Codecs: The first GSM networks implementations have utilized full rate (FR) speech codecs. A FR speech codec requires a full time slot (TS) on a TRX. Half rate (HR) speech codecs need half of a time slot. In this case 2 voice calls can share a time slot. In theory, the cell capacity can almost be doubled. HR and AMR-HR speech codecs require better C/I values than FR and AMR-FR speech codecs. If the number of available frequencies is limited, HR and AMR-HR speech codecs will preferably be used in geographical locations close to the base station where interference tends to be low. Closer to the cell boarders, where interference is more likely, FR and AMR-FR speech codes would be automatically activated by the system. For a planning exercise a certain mix of FR and HR channels could be assumed, for instance 50%. If sufficient frequency bandwidth is available, the share of HR channels could become almost 100%. Voice Capacity Enhancement Features: The features can mitigate the effects of interference, reduce the bit error rates and allow a better utilization of the available frequency spectrum [8]. This can translate into:
• Better voice quality or • More TRX per cell
The following Voice Capacity Enhancement Features are available:
• Power Control • Discontinues Transmission / Voice Activity Detection • Synthesized Frequency Hopping • Single Antenna Interference Calculation (Optional feature for Mobile Stations) • Advanced Multirate Speech Codec • Dynamic Maio Allocation (Voice support only)
The AMR speech codecs are more robust against interference and allow a higher loading of the frequency spectrum. If more TRX are being installed in a radio cell, the quality of the voice channels would not be the limiting factor anymore, but the performance of the signaling channels. The subscriber could experience dropped calls, while the speech quality is still excellent. A number of features have been developed to adapt the performance of the signaling channels to the improved performance of the AMR voice codecs [8], [2]. The features to reduce the call drop rate are:
• Compressed Handover Command • Service Type dependent setting of Radio Link Timeout • Temporary Overpower (TOP) • Repeated FACCH • Repeated SACCH
21/61 Gerson Mann Capability Development
Air Interface Capacity Optimization Guideline, 17.02.2009
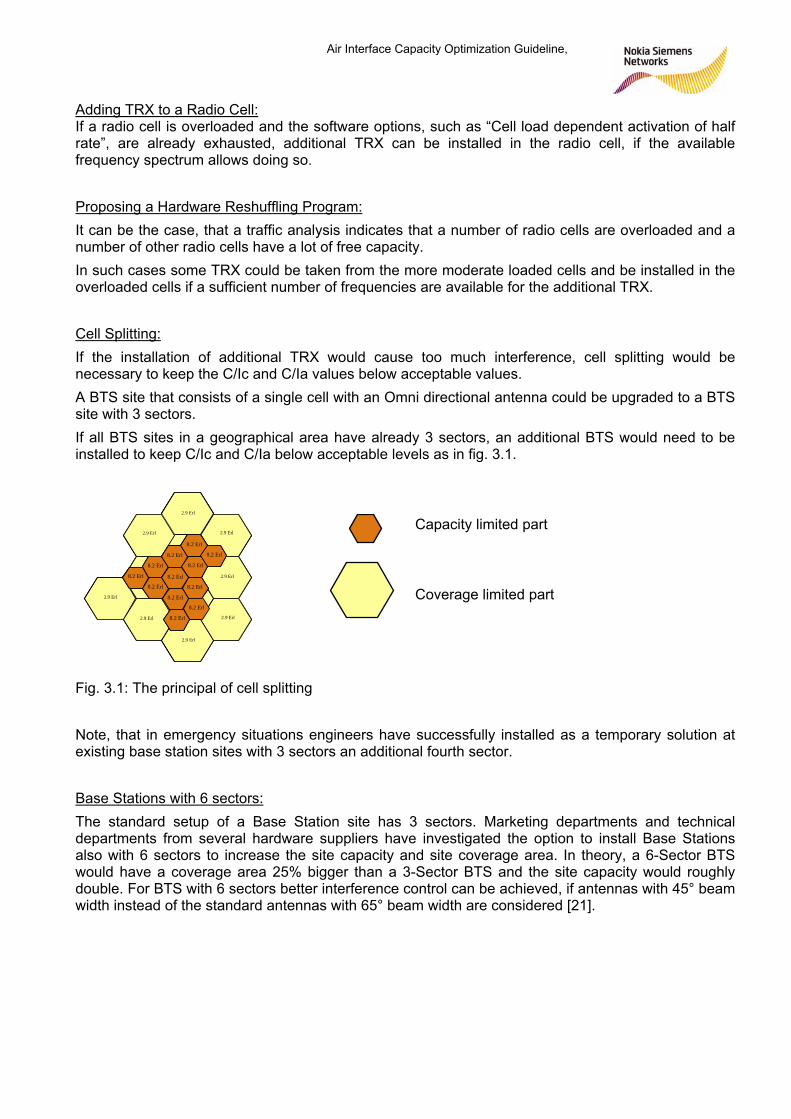
Adding TRX to a Radio Cell: If a radio cell is overloaded and the software options, such as “Cell load dependent activation of half rate”, are already exhausted, additional TRX can be installed in the radio cell, if the available frequency spectrum allows doing so. Proposing a Hardware Reshuffling Program: It can be the case, that a traffic analysis indicates that a number of radio cells are overloaded and a number of other radio cells have a lot of free capacity. In such cases some TRX could be taken from the more moderate loaded cells and be installed in the overloaded cells if a sufficient number of frequencies are available for the additional TRX. Cell Splitting: If the installation of additional TRX would cause too much interference, cell splitting would be necessary to keep the C/Ic and C/Ia values below acceptable values. A BTS site that consists of a single cell with an Omni directional antenna could be upgraded to a BTS site with 3 sectors. If all BTS sites in a geographical area have already 3 sectors, an additional BTS would need to be installed to keep C/Ic and C/Ia below acceptable levels as in fig. 3.1.
Capacity limited part Coverage limited part
8.2 Erl
Fig. 3.1: The principal of cell splitting Note, that in emergency situations engineers have successfully installed as a temporary solution at existing base station sites with 3 sectors an additional fourth sector. Base Stations with 6 sectors: The standard setup of a Base Station site has 3 sectors. Marketing departments and technical departments from several hardware suppliers have investigated the option to install Base Stations also with 6 sectors to increase the site capacity and site coverage area. In theory, a 6-Sector BTS would have a coverage area 25% bigger than a 3-Sector BTS and the site capacity would roughly double. For BTS with 6 sectors better interference control can be achieved, if antennas with 45° beam width instead of the standard antennas with 65° beam width are considered [21].
8.2 E l8.2 E l
8.2 E l2. l
r
8.2 Erl
8.2 Erl
8.2 Erl
8.2 Erl8.2 Erl
r
8.2 Erl
r
8.2 Erl
8.2 Erl 2.9 Erl
2.9 Erl
2.9 Erl
2.9 Erl
9 Er
9 Er
2.9 Erl
9 Er 2. l2. l
8.2 Erl
r
8.2 Erl
8.2 Erl
8.2 Erl
8.2 Erl8.2 Erl
r
8.2 Erl
r
8.2 Erl
8.2 Erl 2.9 Erl
2.9 Erl
2.9 Erl
2.9 Erl
9 Er
9 Er
2.9 Erl
9 Er 2. l2. l
8.2 E l8.2 E l
8.2 E l2. l
22/61 Gerson Mann Capability Development
Air Interface Capacity Optimization Guideline 17.02. 2009
Installing additional Base Station: When all other methods for optimizing- and extending the cell capacity are exhausted, the installation of additional TRX would not provide additional capacity but deteriorate the interference situation. To keep the C/I below acceptable levels, additional Base Stations need to be installed. Installing additional Base Station could the most expensive way of adding capacity. Therefore it would be reasonable to verify first, if other options could be chosen to provide the needed capacity. Indoor solutions: In the city centre of big cities high rising buildings with 20 floors, 30 floors or more can be found. The outer hull of these buildings is often made of coated glass that is a good shield for electromagnetic waves. On one hand there is high demand for capacity inside these buildings and on the other hand it could be difficult for the radio waves to penetrate the building due to the high indoor penetration losses. One possible solution to the problem would be the installation of a BTS inside the building including a distributed antenna system.
23/61 Gerson Mann Capability Development
Air Interface Capacity Optimization Guideline, 17.02.2009
3.9 Conclusions A large variety of options could be considered to optimize the capacity at the air interface. Minor capacity issues could be solved by activating and configuring appropriate software features. When these options are exhausted additional hardware needs to be installed. Engineers would need to study the project specific situation in great detail to work out an appropriate solution that can be different for every BTS site and for every geographical area. Additional subscriber, a shift of the capacity demand between several geographical locations and new services may always change the capacity demand in certain geographical locations. Capacity Optimization can therefore be considered as an ongoing working task during the entire live cycle of a mobile network. Financial-, Marketing- and Engineering departments need to work in close cooperation to provide appropriate short term- and long term capacity solutions.
24/61 Gerson Mann Capability Development
Air Interface Capacity Optimization Guideline 17.02. 2009
4. Estimating the Offered Load by Analyzing Traffic Measurements4.1 Estimating the Offered Load - Signaling The number of time slots that need to be configured in a radio cell for signaling depends on the number of TRX per cell and the traffic model. The below methods could be used to determine the number of timeslots that are needed for signaling:
• The “Offered Load” could be estimated for the SDCCH by analyzing traffic measurements. The number of SDCCH needed could be looked up in the Erlang-B table by using the estimated “Offered Load”.
• A Default Model could be considered for a new BTS or in case of TRX upgrades
• A Customized Model could be used, if the capacity demand for signaling capacity is higher and traffic measurements indicate blocking on signaling channels in some radio cells. In this case more time slots can be configured in the database for signaling
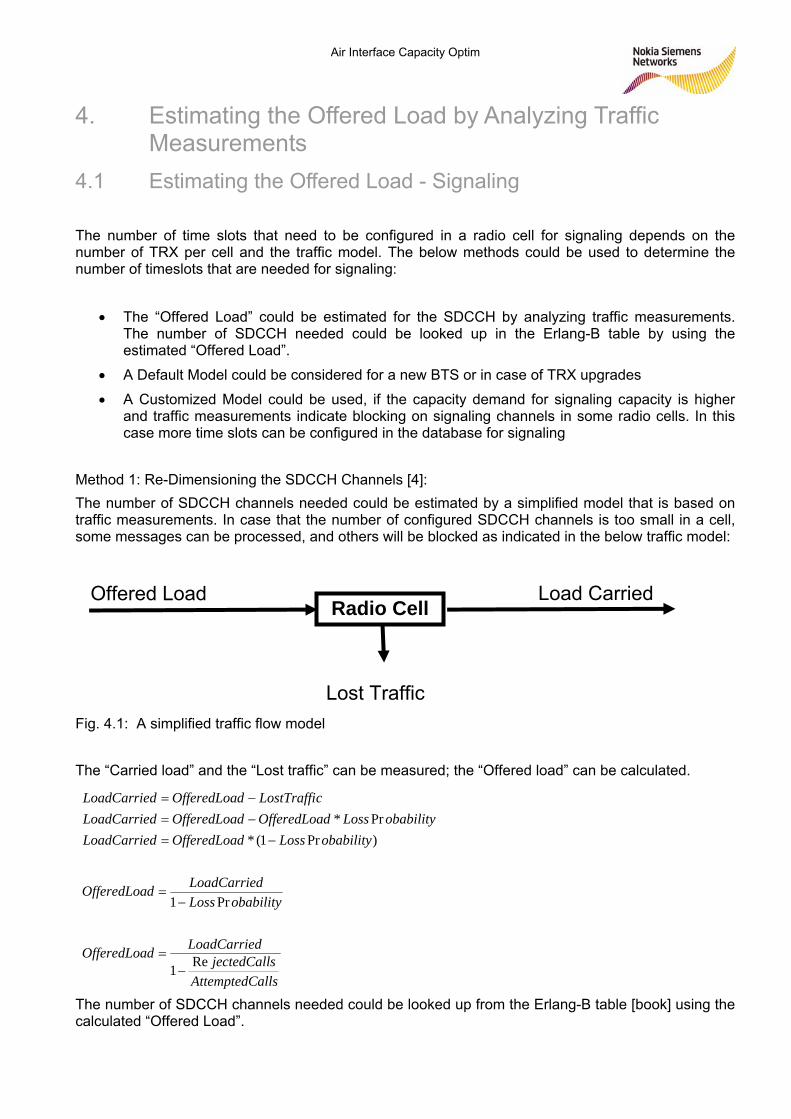
Method 1: Re-Dimensioning the SDCCH Channels [4]: The number of SDCCH channels needed could be estimated by a simplified model that is based on traffic measurements. In case that the number of configured SDCCH channels is too small in a cell, some messages can be processed, and others will be blocked as indicated in the below traffic model:
Radio Cell Offered Load Load Carried
Lost Traffic Fig. 4.1: A simplified traffic flow model The “Carried load” and the “Lost traffic” can be measured; the “Offered load” can be calculated.
allsAttemptedCsjectedCall
dLoadCarried The number of SDCCH channels needed could be looked up from the Erlang-B table [book] using the calculated “Offered Load”.
OfferedLoa
obabilityLossdLoadCarrieOfferedLoa
obabilityLossdOfferedLoadLoadCarrieobabilityLossdOfferedLoadOfferedLoadLoadCarrie
cLostTraffidOfferedLoadLoadCarrie
Re1
Pr1
)Pr1(*Pr*
−=
−=
−=−=−=
d
25/61 Gerson Mann Capability Development
Air Interface Capacity Optimization Guideline, 17.02.2009
Available KPI in BR10.0 [4]:
• KPI_BR10.0_10.1.4: SDCCH Blocking Rate
• KPI_BR10.0_10.1.2: SDCCH Traffic Carried
• KPI_BR10.0_10.1.1: SDCCH Traffic Offered The “KPI_BR10.0_10.1.1: SDCCH Traffic Offered” displays directly the estimated “Offered Load” on SDCCH channels. The estimated “Offered Load” and an accepted value for “Blocking” (For instance 1% Blocking) could be used to look up the number of SDCCH channels needed from the ErlangB table. Tool support: Known tools for the analysis of traffic measurements are SPOTS, ANATOM, BATRANA.
26/61 Gerson Mann Capability Development
Air Interface Capacity Optimization Guideline 17.02. 2009
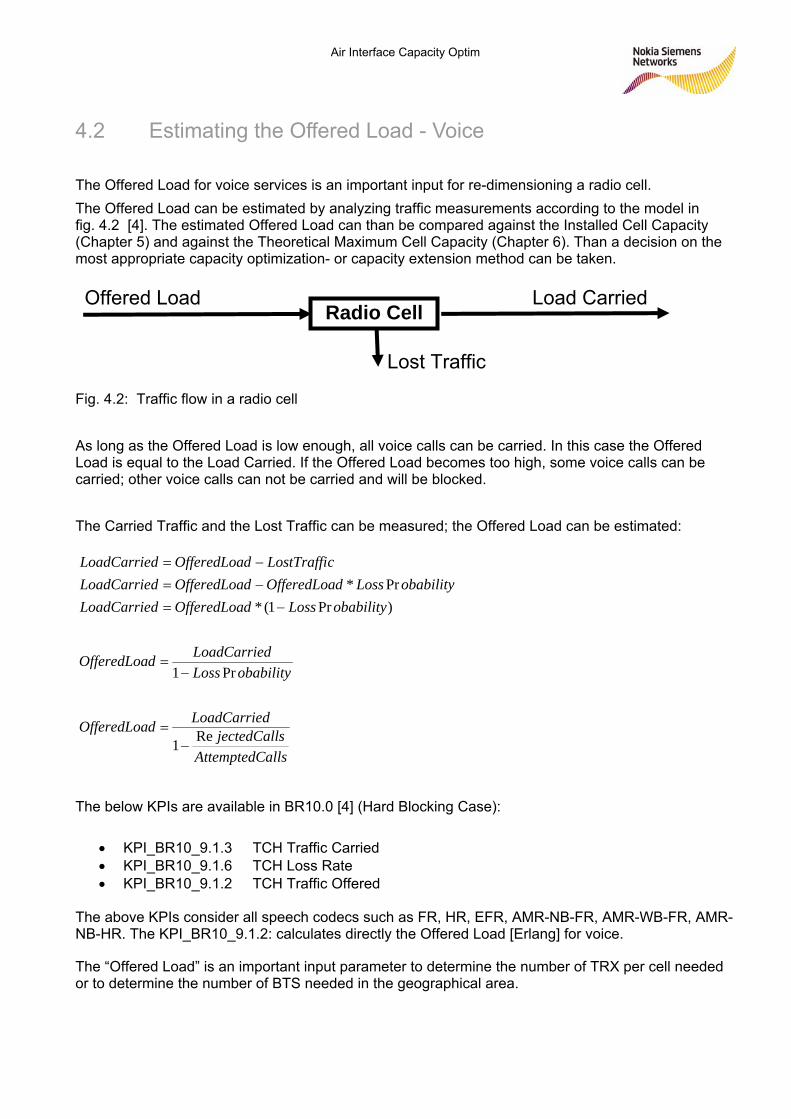
4.2 Estimating the Offered Load - Voice The Offered Load for voice services is an important input for re-dimensioning a radio cell. The Offered Load can be estimated by analyzing traffic measurements according to the model in fig. 4.2 [4]. The estimated Offered Load can than be compared against the Installed Cell Capacity (Chapter 5) and against the Theoretical Maximum Cell Capacity (Chapter 6). Than a decision on the most appropriate capacity optimization- or capacity extension method can be taken.
Radio Cell Offered Load Load Carried
Lost Traffic
Fig. 4.2: Traffic flow in a radio cell As long as the Offered Load is low enough, all voice calls can be carried. In this case the Offered Load is equal to the Load Carried. If the Offered Load becomes too high, some voice calls can be carried; other voice calls can not be carried and will be blocked. The Carried Traffic and the Lost Traffic can be measured; the Offered Load can be estimated:
The below KPIs are available in BR10.0 [4] (Hard Blocking Case):
• KPI_BR10_9.1.3 TCH Traffic Carried • KPI_BR10_9.1.6 TCH Loss Rate • KPI_BR10_9.1.2 TCH Traffic Offered
The above KPIs consider all speech codecs such as FR, HR, EFR, AMR-NB-FR, AMR-WB-FR, AMR-NB-HR. The KPI_BR10_9.1.2: calculates directly the Offered Load [Erlang] for voice.
The “Offered Load” is an important input parameter to determine the number of TRX per cell needed or to determine the number of BTS needed in the geographical area.
allsAttemptedCsjectedCall
dLoadCarriedOfferedLoa
obabilityLossdLoadCarried
obabilityLossdOfferedLoadobabilityLossdOfferedLoadOfferedLoadLoadCarrie
cLostTraffidOfferedLoadLoadCarrie
Re1
Pr1
)Pr1(*Pr*
−=
−=
−=−=−=
LoadCarrie
OfferedLoa
27/61 Gerson Mann Capability Development
Air Interface Capacity Optimization Guideline, 17.02.2009
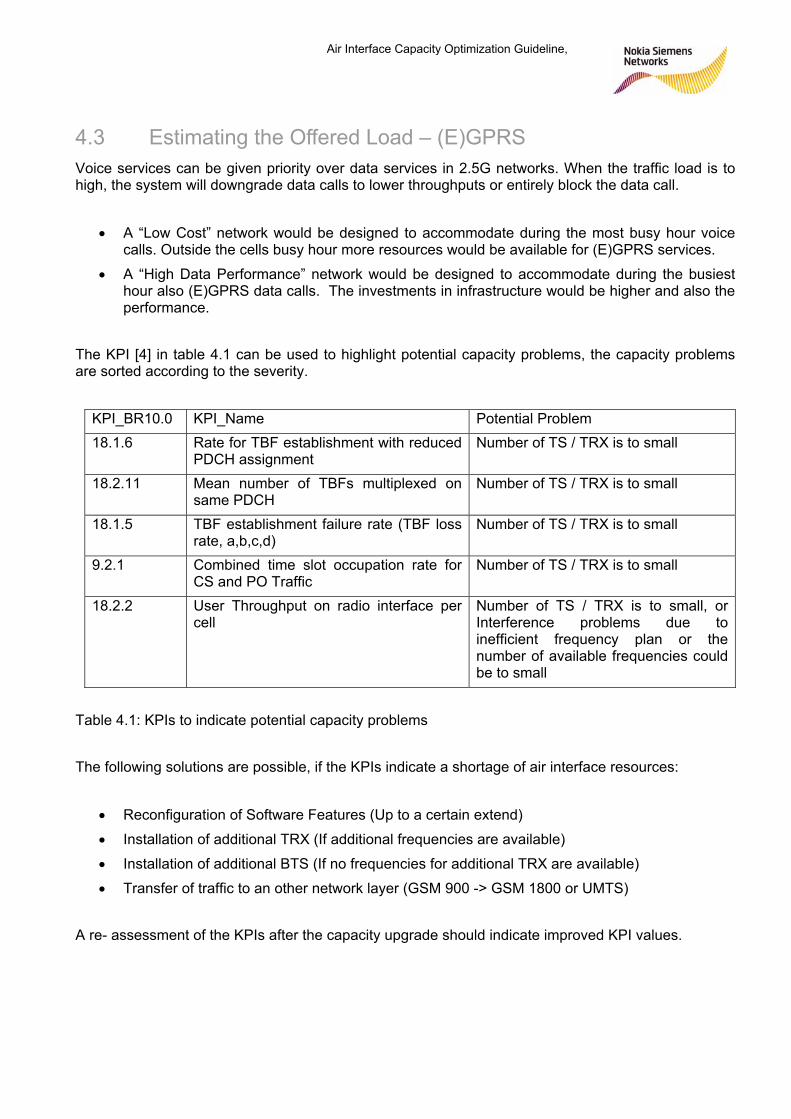
4.3 Estimating the Offered Load – (E)GPRS Voice services can be given priority over data services in 2.5G networks. When the traffic load is to high, the system will downgrade data calls to lower throughputs or entirely block the data call.
• A “Low Cost” network would be designed to accommodate during the most busy hour voice calls. Outside the cells busy hour more resources would be available for (E)GPRS services.
• A “High Data Performance” network would be designed to accommodate during the busiest hour also (E)GPRS data calls. The investments in infrastructure would be higher and also the performance.
The KPI [4] in table 4.1 can be used to highlight potential capacity problems, the capacity problems are sorted according to the severity.
KPI_BR10.0 KPI_Name Potential Problem 18.1.6 Rate for TBF establishment with reduced
PDCH assignment Number of TS / TRX is to small
18.2.11 Mean number of TBFs multiplexed on same PDCH
Number of TS / TRX is to small
18.1.5 TBF establishment failure rate (TBF loss rate, a,b,c,d)
Number of TS / TRX is to small
9.2.1 Combined time slot occupation rate for CS and PO Traffic
Number of TS / TRX is to small
18.2.2 User Throughput on radio interface per cell
Number of TS / TRX is to small, or Interference problems due to inefficient frequency plan or the number of available frequencies could be to small
Table 4.1: KPIs to indicate potential capacity problems The following solutions are possible, if the KPIs indicate a shortage of air interface resources:
• Reconfiguration of Software Features (Up to a certain extend)
• Installation of additional TRX (If additional frequencies are available)
• Installation of additional BTS (If no frequencies for additional TRX are available)
• Transfer of traffic to an other network layer (GSM 900 -> GSM 1800 or UMTS) A re- assessment of the KPIs after the capacity upgrade should indicate improved KPI values.
28/61 Gerson Mann Capability Development
Air Interface Capacity Optimization Guideline 17.02. 2009
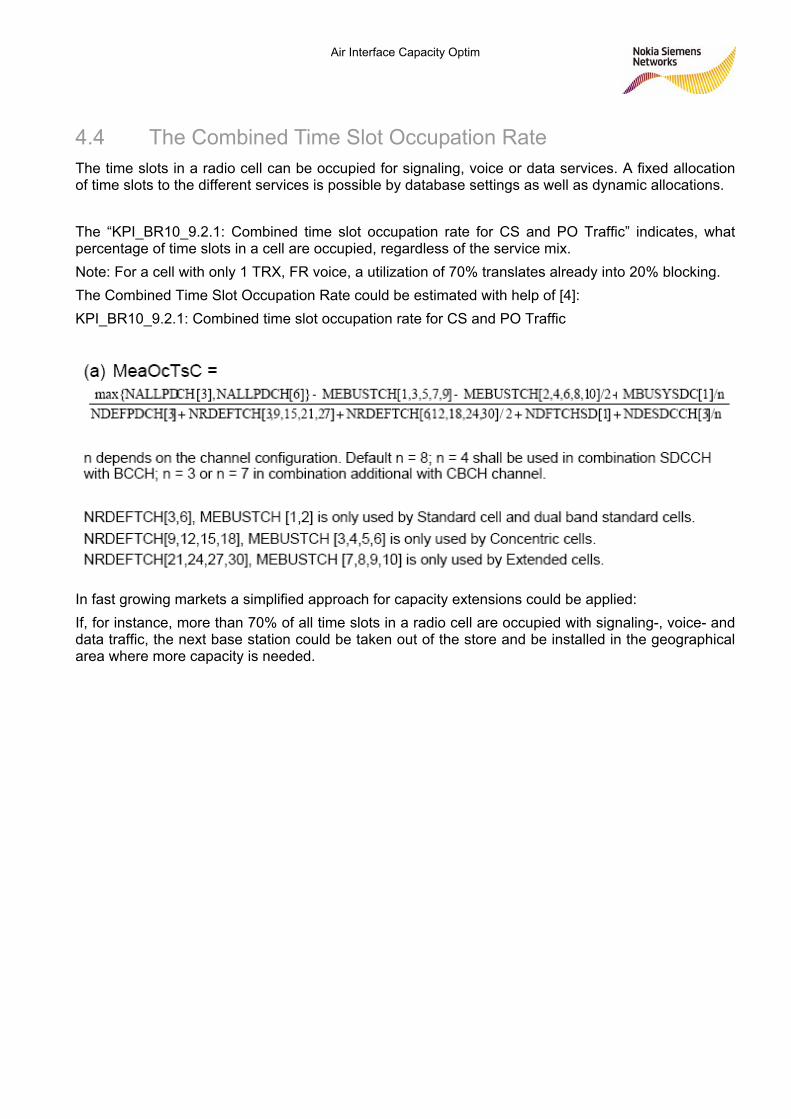
4.4 The Combined Time Slot Occupation Rate The time slots in a radio cell can be occupied for signaling, voice or data services. A fixed allocation of time slots to the different services is possible by database settings as well as dynamic allocations. The “KPI_BR10_9.2.1: Combined time slot occupation rate for CS and PO Traffic” indicates, what percentage of time slots in a cell are occupied, regardless of the service mix. Note: For a cell with only 1 TRX, FR voice, a utilization of 70% translates already into 20% blocking. The Combined Time Slot Occupation Rate could be estimated with help of [4]: KPI_BR10_9.2.1: Combined time slot occupation rate for CS and PO Traffic In fast growing markets a simplified approach for capacity extensions could be applied: If, for instance, more than 70% of all time slots in a radio cell are occupied with signaling-, voice- and data traffic, the next base station could be taken out of the store and be installed in the geographical area where more capacity is needed.
29/61 Gerson Mann Capability Development
Air Interface Capacity Optimization Guideline, 17.02.2009
5. Estimating the Theoretical Maximum Cell Capacity 5.1 Computer Simulations, Dimensioning Guidelines and Tools Computer simulations: Radio Design Engineers maintain a model of the radio network inside a radio planning tool such as NetAct-Planner. The computer model comprises for instance a
• digital terrain database with height profile, clutter- and vector data
• BTS models
• Radio propagation models The radio coverage can be predicted and a frequency plan can be developed. Scientific computer simulations, which are conducted for instance in University departments and Research & Development departments of equipment vendors can add to the above computer model the full software for the base stations and for mobile telephones, that may move inside the computer model and conduct virtual phone calls. Inside the computer model certain software features can be switched on and tested. The bit error rates, throughput curves and call drop events can be recorded for each virtual phone call. Statistical values can be obtained that indicate the influence of the tested features to the network performance. Nokia Siemens Networks presented related information on public conferences [14], [15]. Furthermore the simulation results are used in the air interface dimensioning guidelines and tools. Dimensioning guidelines: Planning Manuals for Air Interface Dimensioning as well as guidelines are available for internal usage including the capacity planning process:
• Planning Manual: PMN-0 Air Interface Dimensioning BR10.0 https://sharenet-ims.inside.nokiasiemensnetworks.com/Open/398436362 Further guidelines are available such as:
• Radio & Access Dimensioning Guideline BR10.0 and BSS14 https://sharenet-ims.inside.nokiasiemensnetworks.com/Open/396708417
• Air Interface Dimensioning Guideline CS Capacity: https://sharenet-ims.inside.nokiasiemensnetworks.com/Download/390582558
• Air Interface Dimensioning Guideline PS Capacity: https://sharenet-ims.inside.nokiasiemensnetworks.com/Download/390578500
The Customer Documentation includes Planning Manuals for the Air Interface, SDCCH dimensioning and dimensioning of the Radio Access network.
30/61 Gerson Mann Capability Development
Air Interface Capacity Optimization Guideline 17.02. 2009
Dimensioning tools: Nokia Siemens Networks has developed for internal use a number of tools to dimension the 2.5G air interface and to estimate the capacity of a radio cell under certain conditions:
• RNT_2G_DimTool v4.0.1 The tool covers all calculation steps that are relevant for air interface dimensioning process: coverage, CS capacity, PS capacity. Project specific requirements assuming coverage quality, capacity to be offered, traffic model, etc. are taken into account during analysis. The tool in an automatic way considers various network and HW configurations in order to speed-up calculation time and make the dimensioning fast and efficient. Both product lines: BR and BSS are supported https://sharenet-ims.inside.nokiasiemensnetworks.com/Open/390581006
For several reasons it could be an advantage to conduct a detailed study separately for the link budget, CS- and PS capacity planning. A number of Excel tools are provided for these purposes:
• Link Budget tool v1.3.4 The tool covers complex LB calculations considering: Power Budget and Coverage analysis. BR & BSS supported. https://sharenet-ims.inside.nokiasiemensnetworks.com/Open/390582399
• Air Interface Dimensioning CS Capacity Stand alone Excel tool to estimate the cell capacity for CS services https://sharenet-ims.inside.nokiasiemensnetworks.com/Open/390582398
• Air Interface Dimensioning PS Capacity Stand alone Excel tool to estimate the cell capacity for PS services https://sharenet-ims.inside.nokiasiemensnetworks.com/Open/390578500
31/61 Gerson Mann Capability Development
Air Interface Capacity Optimization Guideline, 17.02.2009
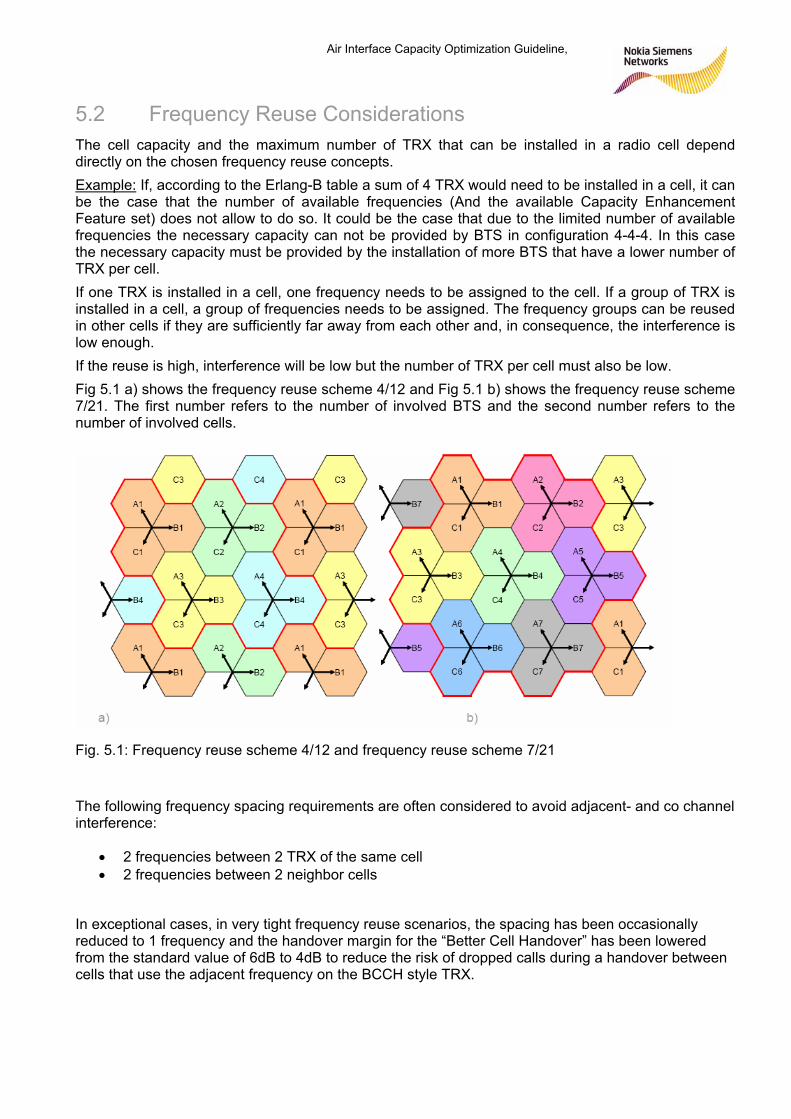
5.2 Frequency Reuse Considerations The cell capacity and the maximum number of TRX that can be installed in a radio cell depend directly on the chosen frequency reuse concepts. Example: If, according to the Erlang-B table a sum of 4 TRX would need to be installed in a cell, it can be the case that the number of available frequencies (And the available Capacity Enhancement Feature set) does not allow to do so. It could be the case that due to the limited number of available frequencies the necessary capacity can not be provided by BTS in configuration 4-4-4. In this case the necessary capacity must be provided by the installation of more BTS that have a lower number of TRX per cell. If one TRX is installed in a cell, one frequency needs to be assigned to the cell. If a group of TRX is installed in a cell, a group of frequencies needs to be assigned. The frequency groups can be reused in other cells if they are sufficiently far away from each other and, in consequence, the interference is low enough. If the reuse is high, interference will be low but the number of TRX per cell must also be low. Fig 5.1 a) shows the frequency reuse scheme 4/12 and Fig 5.1 b) shows the frequency reuse scheme 7/21. The first number refers to the number of involved BTS and the second number refers to the number of involved cells. Fig. 5.1: Frequency reuse scheme 4/12 and frequency reuse scheme 7/21
The following frequency spacing requirements are often considered to avoid adjacent- and co channel interference:
• 2 frequencies between 2 TRX of the same cell • 2 frequencies between 2 neighbor cells
In exceptional cases, in very tight frequency reuse scenarios, the spacing has been occasionally reduced to 1 frequency and the handover margin for the “Better Cell Handover” has been lowered from the standard value of 6dB to 4dB to reduce the risk of dropped calls during a handover between cells that use the adjacent frequency on the BCCH style TRX.
32/61 Gerson Mann Capability Development
Air Interface Capacity Optimization Guideline 17.02. 2009
5.2.1 Frequency Reuse for BCCH style TRX Computer simulations [14], [15] often consider a reuse of 12 frequencies for the BCCH.
Network operators tend to assign to the BCCH layer not only 12 frequencies, but 15 frequencies, 18 frequencies or even more to achieve a good network performance and a low call drop rate.
The recently introduced AMR speech codecs are more resilient against interference and allow a higher loading of the frequency spectrum. If more TRX are being installed in a radio cell, the quality of the voice channels would not be the limiting factor anymore, but the performance of the signaling channels. The subscriber could experience dropped calls, while the speech quality is still excellent. A number of features have been developed to adapt the performance of the signaling channels to the improved performance of the AMR voice codecs [2], [8], [14] and to lower the call drop rate in case of high load scenarios. The features are:
• Compressed HANDOVER COMMAND message BR8.0 Optimized encoding of the ‘Frequency List’ IE reduces the size of the channel assignment messages (HO CMD, ASS CMD).
• Service Type dependent setting of Radio Link Timeout BR8.0 Different robustness of services against interference can be reflected in service group specific settings of the ‘Radio Link Timeout‘ Parameters.
• Temporary Overpower (TOP), new feature in BR9.0 Under critical radio conditions DL signaling messages are boosted by 2dB or 4dB (possible only if static power reduction is applied).
• Repeated FACCH (R-FACCH), new feature in BR9.0 Under critical radio conditions DL FACCH messages are sent twice in short succession to allow joint decoding on the MS side.
• Repeated SACCH (R-SACCH), new feature in BR10.0 Under critical radio conditions DL SACCH messages are sent twice in short succession to allow joint decoding on the MS side.
33/61 Gerson Mann Capability Development
Air Interface Capacity Optimization Guideline, 17.02.2009
5.2.2 Frequency Reuse for (E)GPRS style TRX In early implementations only some time slots on the BCCH style TRX have been used for (E) GPRS services. The frequency reuse for (E)GPRS was determined by the frequency reuse that was chosen for the BCCH layer. When the demand for (E)GPRS service increases and can not be fulfilled anymore with the time slots available on the BCCH style TRX, alternatives must be considered. Computer simulations [15] suggest considering a reuse of 12 frequencies for the BCCH style TRX and also a frequency reuse of 12 frequencies if additional TRX need to be assigned exclusively for (E)GPRS services. A lower number of frequencies would lead to more interference and lower user throughput. Feature “Dual Carrier Downlink”: Dual Carrier Downlink is an optional feature for Mobile Stations (MS) that comply to 3GPP Release 5. The Mobile Stations have two receivers. The theoretical peak throughput per MS is determined by the formula:
skBitTimeslotskBitceiver
TimeslotsceiverMSperTroughputPeaklTheoretica /592//2,59*Re
5*Re2____ ==
The user throughput could be optimized, if both TRX would operate at similar interference levels. Therefore it seems to be an advantage to operate both (E)GPRS style TRX with the same frequency reuse scheme. The feature is supported by the network starting from BR10.01 / BSS14 / RG 10. The BTS can transmit data in downlink on 2 TRX at the same time, on up to 5 time slots of both TRX at the same time. According to [15] for each of the two TRX that are assigned to (E)GPRS services 12 frequencies shall be considered to achieve good throughput values. Than the frequency assignments could be: TRX 0 BCCH 12 frequencies or more TRX 1 (E)GPRS 12 frequencies TRX 2 (E)GPRS 12 frequencies TRX 3, 4,.. Voice depending on the capacity enhancement feature set Especially in the 900 MHz band frequencies are a scare resource and it could be difficult to assign that many frequencies. Alternative scenarios can be considered: TRX 0 BCCH/(E)GPRS 12 frequencies or more (Up to 5 TS for (E)GPRS) TRX 1 (E)GPRS 12 frequencies or more TRX 2, 3 … Voice depending on the capacity enhancement feature set
34/61 Gerson Mann Capability Development
Air Interface Capacity Optimization Guideline 17.02. 2009
5.2.3 Frequency Reuse for TCH style TRX
Classic Cell Layout:
In the early days of mobile communications a frequency reuse of 12 frequencies was often recommended for those TRX that carry voice traffic.
Example 1: In a network, that has radio cells with one BCCH style TRX and one TCH style TRX, a minimum of 12 frequencies or more would need to be assigned to the BCCH style TRX layer and 12 additional frequencies would need to be assigned to the TCH style TRX layer.
TRX 0 BCCH/(E)GPRS 12 frequencies or more TRX 1 TCH voice 12 frequencies
Example 2: In a network, that has radio cells with one BCCH style TRX and two TCH style TRX, a minimum of 12 frequencies would need to be assigned to the BCCH style TRX layer. To the first TCH style TRX layer additional 12 frequencies would need to be assigned. To the second TCH style TRX layer another 12 frequencies would need to be assigned. Overall at least 36 frequencies would be needed to run the network with 3 installed 3 TRX for each radio cell.
TRX 0 BCCH/(E)GPRS 12 frequencies or more TRX 1 TCH voice 12 frequencies TRX 2 TCH voice 12 frequencies
Voice Capacity Enhancement Features: The features can mitigate the effects of interference, reduce the bit error rates and allow a better utilization of the available frequency spectrum [2], [8], [11], [14]. This can translate into:
• Better voice quality or • Lower frequency reuse for voice channels or • More TRX per cell with the same number of available frequencies
The following Voice Capacity Enhancement Features are available in BR10.0:
• Power Control • Discontinues Transmission / Voice Activity Detection • Synthesized Frequency Hopping • Adaptive Multirate Speech Codec • Single Antenna Interference Calculation (Mobile Station) • Dynamic Maio Allocation
The following features have been introduced to adapt the interference immunity of the signaling channels to the improved interference immunity of the AMR voice channels and to lower the “Call Drop Rate”:
• Compressed Handover Command • Service Type dependent setting of Radio Link Timeout • Temporary Overpower (TOP) • Repeated FACCH • Repeated SACCH
35/61 Gerson Mann Capability Development
Air Interface Capacity Optimization Guideline, 17.02.2009
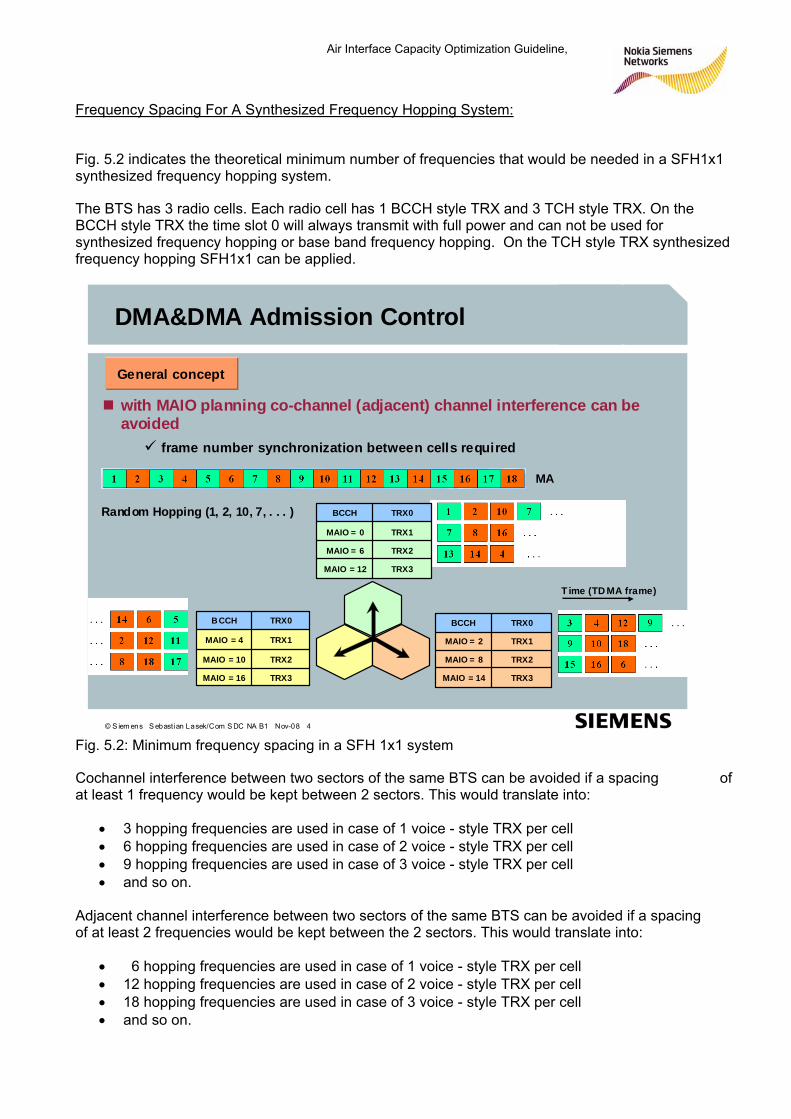
Frequency Spacing For A Synthesized Frequency Hopping System:
Fig. 5.2 indicates the theoretical minimum number of frequencies that would be needed in a SFH1x1 synthesized frequency hopping system.
The BTS has 3 radio cells. Each radio cell has 1 BCCH style TRX and 3 TCH style TRX. On the BCCH style TRX the time slot 0 will always transmit with full power and can not be used for synthesized frequency hopping or base band frequency hopping. On the TCH style TRX synthesized frequency hopping SFH1x1 can be applied.
© S iem ens S ebastian Lasek/Com S DC NA B1 Nov-08 4
D
MA&DMA Admission Control
TRX3MAIO = 16
TRX2MAIO = 10
TRX1MAIO = 4
TRX0BCCH
TRX3MAIO = 14
TRX2MAIO = 8
TRX1MAIO = 2
TRX0BCCH
General concept
with MAIO planning co-channel (adjacent) channel interference can be avoided
frame number synchronization between cells required
MA
TRX3MAIO = 12
TRX2MAIO = 6
TRX1MAIO = 0
TRX0BCCHRandom Hopping (1, 2, 10, 7, . . . )
T ime (TD MA frame)
Fig. 5.2: Minimum frequency spacing in a SFH 1x1 system
Cochannel interference between two sectors of the same BTS can be avoided if a spacing of at least 1 frequency would be kept between 2 sectors. This would translate into:
• 3 hopping frequencies are used in case of 1 voice - style TRX per cell • 6 hopping frequencies are used in case of 2 voice - style TRX per cell • 9 hopping frequencies are used in case of 3 voice - style TRX per cell • and so on.
Adjacent channel interference between two sectors of the same BTS can be avoided if a spacing of at least 2 frequencies would be kept between the 2 sectors. This would translate into:
• 6 hopping frequencies are used in case of 1 voice - style TRX per cell • 12 hopping frequencies are used in case of 2 voice - style TRX per cell • 18 hopping frequencies are used in case of 3 voice - style TRX per cell • and so on.
36/61 Gerson Mann Capability Development
Air Interface Capacity Optimization Guideline 17.02. 2009
Than the theoretical minimum frequency assignments to the radio cells could be:
TRX 0 BCCH/EDGE 12 or more frequencies TRX 1 TCH voice 6 or more frequencies for SFH1x1 TRX 2 TCH voice 6 or more frequencies for SFH1x1
The 6+6 frequencies that are assigned to the two TCH style TRX would be used as one pool.
In an attempt to reduce the number of needed frequencies even further (And to deploy more TRX per radio cell with the available number of frequencies) some software features have been developed:
• Dynamic Maio Allocation (Siemens) • Dynamic Frequency and Channel Allocation (Nokia)
It is clear from the Erlang theory, that not all time slots can be busy at all times if a reasonable hard blocking rate (For instance 2%) should be achieved. Therefore it is not necessary to assign a frequency to all time slots at every point of time. The feature Dynamic Maio Allocation is based on this considerations.
Advanced computer simulations have assumed an average of less than 3 frequencies per TRX layer for ideal hexagonal shaped networks [14], [15]. It is clear, that in a real network lower bit error rates can be achieved, if more frequencies than the theoretical minimum would be used for the synthesized frequency hopping system.
The more the implemented network deviates from an ideal, hexagon shaped geometry and the more the antennas are elevated irregularly above see level, the more frequencies would be needed to achieve a reasonable interference situation.
37/61 Gerson Mann Capability Development
Air Interface Capacity Optimization Guideline, 17.02.2009
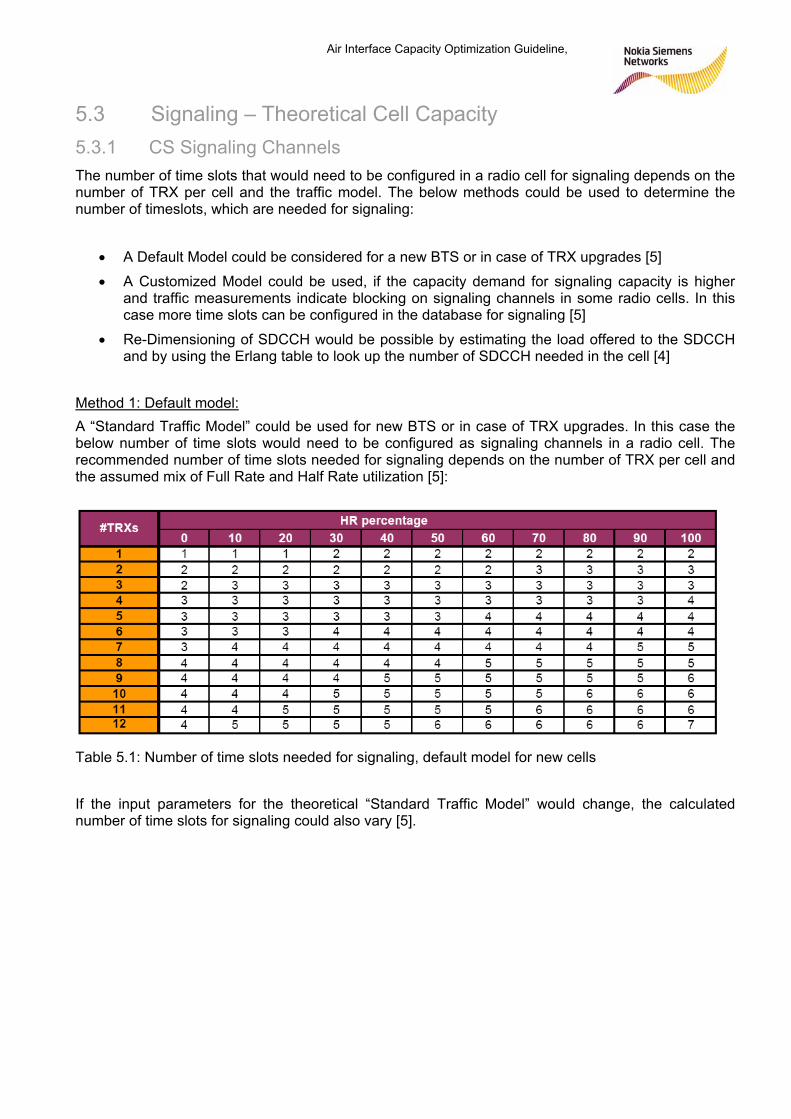
5.3 Signaling – Theoretical Cell Capacity 5.3.1 CS Signaling Channels The number of time slots that would need to be configured in a radio cell for signaling depends on the number of TRX per cell and the traffic model. The below methods could be used to determine the number of timeslots, which are needed for signaling:
• A Default Model could be considered for a new BTS or in case of TRX upgrades [5]
• A Customized Model could be used, if the capacity demand for signaling capacity is higher and traffic measurements indicate blocking on signaling channels in some radio cells. In this case more time slots can be configured in the database for signaling [5]
• Re-Dimensioning of SDCCH would be possible by estimating the load offered to the SDCCH and by using the Erlang table to look up the number of SDCCH needed in the cell [4]
Method 1: Default model: A “Standard Traffic Model” could be used for new BTS or in case of TRX upgrades. In this case the below number of time slots would need to be configured as signaling channels in a radio cell. The recommended number of time slots needed for signaling depends on the number of TRX per cell and the assumed mix of Full Rate and Half Rate utilization [5]: Table 5.1: Number of time slots needed for signaling, default model for new cells If the input parameters for the theoretical “Standard Traffic Model” would change, the calculated number of time slots for signaling could also vary [5].
38/61 Gerson Mann Capability Development
Air Interface Capacity Optimization Guideline 17.02. 2009
Method 2: Customized model: The Standard Traffic Model may not be applicable for all cells. The demand for signaling capacity could for instance be higher in cells that serve a motor way or the entrance of a metro tunnel. It is possible that many handover and location updates are executed in such cells. Traffic measurements will indicate blocking on certain signaling channels, if the number of configured signaling channels is too small. The below KPI can be used to identify, if signaling channels are overloaded [3], [4]: KPI_BR10.0_10.1.4 SDCCH Blocking Rate KPI_BR10.0_11.5 PCH Loss Rate KPI_BR10.0_11.6 AGCH Loss Rate KPI_BR10.0_12.5 PPCH Loss Rate KPI_BR10.0_12.6 PAGCH Loss Rate In case of blocking on signaling channels the capacity for signaling can be increased by converting one or more than one TCH style time slot into a signaling time slot by a modification of the database settings.
39/61 Gerson Mann Capability Development
Air Interface Capacity Optimization Guideline, 17.02.2009
The following combinations of logical channel types are possible [2]: In the following list “...CH/F” means that Full Rate channels are supported, “...CH/FH” means that Full Rate and Half Rate channels are supported. 1. BCCH + FCCH + SCH + CCCH This configuration carries all common control channels and is used in timeslot 0 of the BCCH carrier (Figure 19 shows the multiplexing scheme). 2. BCCH + FCCH + SCH + CCCH + SDCCH/4 (0..3) + SACCH/2 (0,1) This configuration carries all the common control channels plus SDCCHs and SACCHs. It is used in timeslot 0 of the BCCH carrier, principally in small cells. SDCCH/4 means 4 SDCCH blocks, i.e. 16 frames, in one 51-multiframe; SACCH/2 means 2 SACCH blocks accordingly. 3. FCCH + SCH + BCCH +CCCH + SDCCH/4 + SACCH/2 + CBCH This configuration is identical to the configuration 2 but also supports cell broadcast service. It is used in timeslot 0 of the BCCH carrier, principally in small cells. 4. BCCH + CCCH This channel configuration is always used in conjunction with Configuration1 and can be configured in even-numbered timeslots (2, 4 and 6) of the BCCH carrier. It is used in high capacity BTS where the signaling capacity of Configuration 1 is no longer sufficient. 5. SDCCH + SACCH This configuration carries additional SDCCHs with their associated SACCHs. Its usage is permitted in any timeslot of any carrier except timeslot 0 of the BCCH carrier (Figure 19 shows the multiplexing scheme). 6. SDCCH + SACCH + CBCH Identical to configuration 5, with an additional CBCH as subchannel No. 2 of SDCCH. Its usage is permitted in any timeslot of any carrier except timeslot 0 of the BCCH carrier. 7. TCH/F + FACCH/F + SACCH/F This combination represents the configuration for a standard full rate traffic channel. 24 frames of a 26-multiframe are occupied by TCHs, the 13. frame is for SACCH, the 26. frame is idle, FACCH is multiplexed on the TCHs (stolen from the TCHs). 8. TCH/FH + FACCH/FH + SACCH/FH This is the configuration supporting full rate and half rate traffic channels. 9. SDCCH/8 + SACCH/2 + TCH/H(0,1) + FACCH/H(0,1) + SACCH/H(0,1) or TCH/F + FACCH/F + SACCH/F Method 3: Re-Dimensioning the SDCCH Channels
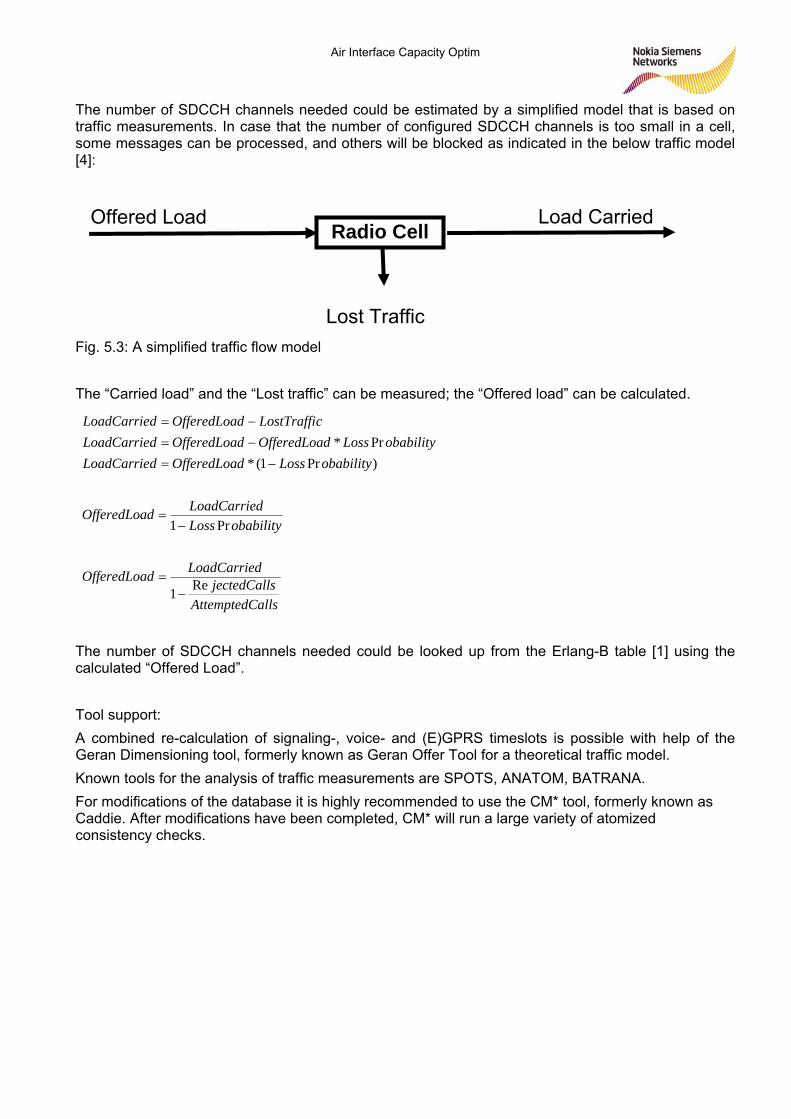
40/61 Gerson Mann Capability Development
Air Interface Capacity Optimization Guideline 17.02. 2009
The number of SDCCH channels needed could be estimated by a simplified model that is based on traffic measurements. In case that the number of configured SDCCH channels is too small in a cell, some messages can be processed, and others will be blocked as indicated in the below traffic model [4]:
Radio Cell Offered Load Load Carried
Lost Traffic Fig. 5.3: A simplified traffic flow model The “Carried load” and the “Lost traffic” can be measured; the “Offered load” can be calculated.
allsAttemptedCsjectedCall
dLoadCarried The number of SDCCH channels needed could be looked up from the Erlang-B table [1] using the calculated “Offered Load”. Tool support: A combined re-calculation of signaling-, voice- and (E)GPRS timeslots is possible with help of the Geran Dimensioning tool, formerly known as Geran Offer Tool for a theoretical traffic model. Known tools for the analysis of traffic measurements are SPOTS, ANATOM, BATRANA. For modifications of the database it is highly recommended to use the CM* tool, formerly known as Caddie. After modifications have been completed, CM* will run a large variety of atomized consistency checks.
OfferedLoa
obabilityLossdLoadCarrieOfferedLoa
obabilityLossdOfferedLoadLoadCarrieobabilityLossdOfferedLoadOfferedLoadLoadCarrie
cLostTraffidOfferedLoadLoadCarrie
Re1
Pr1
)Pr1(*Pr*
−=
−=
−=−=−=
d
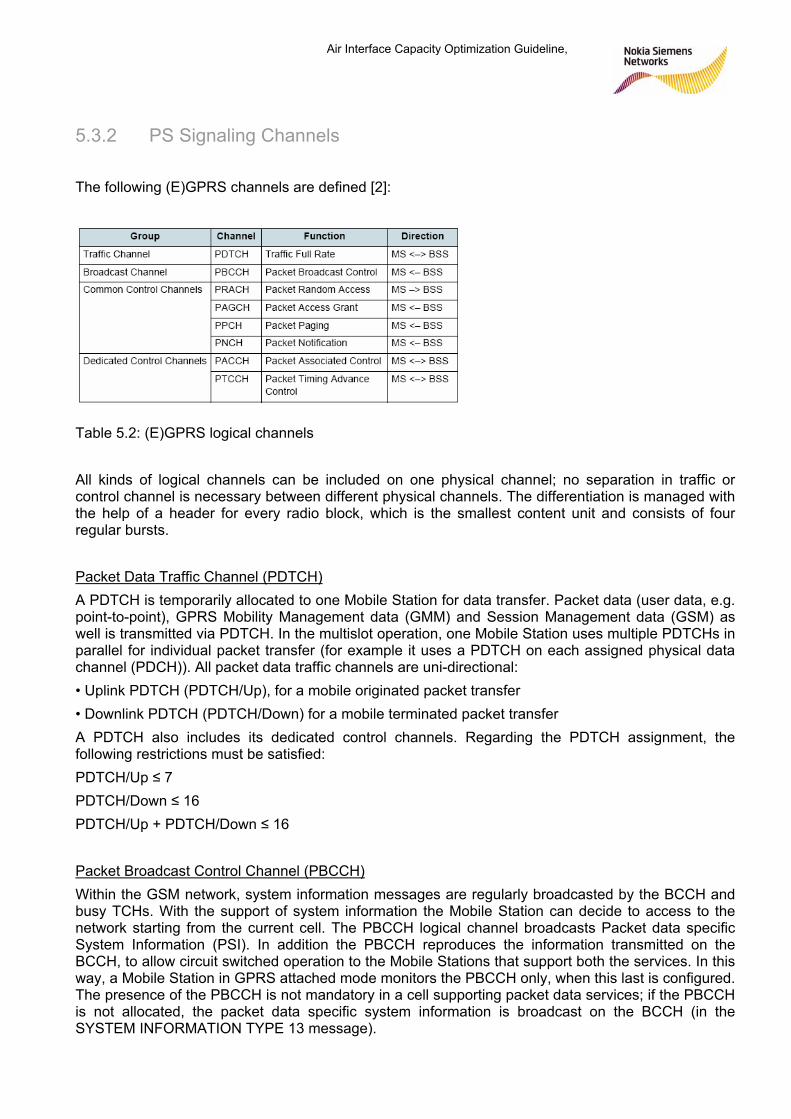
41/61 Gerson Mann Capability Development
Air Interface Capacity Optimization Guideline, 17.02.2009
5.3.2 PS Signaling Channels The following (E)GPRS channels are defined [2]:
Table 5.2: (E)GPRS logical channels All kinds of logical channels can be included on one physical channel; no separation in traffic or control channel is necessary between different physical channels. The differentiation is managed with the help of a header for every radio block, which is the smallest content unit and consists of four regular bursts. Packet Data Traffic Channel (PDTCH) A PDTCH is temporarily allocated to one Mobile Station for data transfer. Packet data (user data, e.g. point-to-point), GPRS Mobility Management data (GMM) and Session Management data (GSM) as well is transmitted via PDTCH. In the multislot operation, one Mobile Station uses multiple PDTCHs in parallel for individual packet transfer (for example it uses a PDTCH on each assigned physical data channel (PDCH)). All packet data traffic channels are uni-directional: • Uplink PDTCH (PDTCH/Up), for a mobile originated packet transfer • Downlink PDTCH (PDTCH/Down) for a mobile terminated packet transfer A PDTCH also includes its dedicated control channels. Regarding the PDTCH assignment, the following restrictions must be satisfied: PDTCH/Up ≤ 7 PDTCH/Down ≤ 16 PDTCH/Up + PDTCH/Down ≤ 16 Packet Broadcast Control Channel (PBCCH)
Within the GSM network, system information messages are regularly broadcasted by the BCCH and busy TCHs. With the support of system information the Mobile Station can decide to access to the network starting from the current cell. The PBCCH logical channel broadcasts Packet data specific System Information (PSI). In addition the PBCCH reproduces the information transmitted on the BCCH, to allow circuit switched operation to the Mobile Stations that support both the services. In this way, a Mobile Station in GPRS attached mode monitors the PBCCH only, when this last is configured. The presence of the PBCCH is not mandatory in a cell supporting packet data services; if the PBCCH is not allocated, the packet data specific system information is broadcast on the BCCH (in the SYSTEM INFORMATION TYPE 13 message).
42/61 Gerson Mann Capability Development
Air Interface Capacity Optimization Guideline 17.02. 2009
Packet Common Control Channels (PCCCHs) The GPRS/EGPRS common signaling is carried out either on already existing CCCHs for usual GSM (shared CCCH) or on CCCHs allocated for GPRS/EGPRS only. These channels are defined as PCCCHs.
• The Packet Paging Channel (PPCH) is used in downlink direction to page a Mobile Station.
• The Packet Random Access Channel (PRACH) is used in uplink direction to initiate packet transfer, used by the network to derive the initial estimation of the Timing Advance.
• The Packet Access Grant Channel (PAGCH) is used in downlink direction to assign resources to the Mobile Station on the Um interface.
• The Packet Notification Channel (PNCH) is used for notification of an MS group for Point-to-multipoint (PTM) multicast (which is not yet supported in the current software version).
Packet Dedicated Control Channels (PDCCHs) Two types of packet dedicated control channels support the GPRS/EGPRS services:
• Packet Associated Control Channel (PACCH): The PACCH conveys signaling information related to a given Mobile Station. The signaling information includes for example acknowledgements and power control information. The PACCH also carries resource assignment and re-assignment messages, comprising the assignment of resources for PDTCHs and for further occurrences of the PACCH.
• Packet Timing Advance Control Channel (PTCCH): This type of channel is used in the timing advance update procedure. The PTCCH/Up is used to transmit the random access burst to allow the estimation of the timing advance for one Mobile Station in packet transfer mode; the PTCCH/Down is used to transmit timing advance information updates to several Mobile Stations.
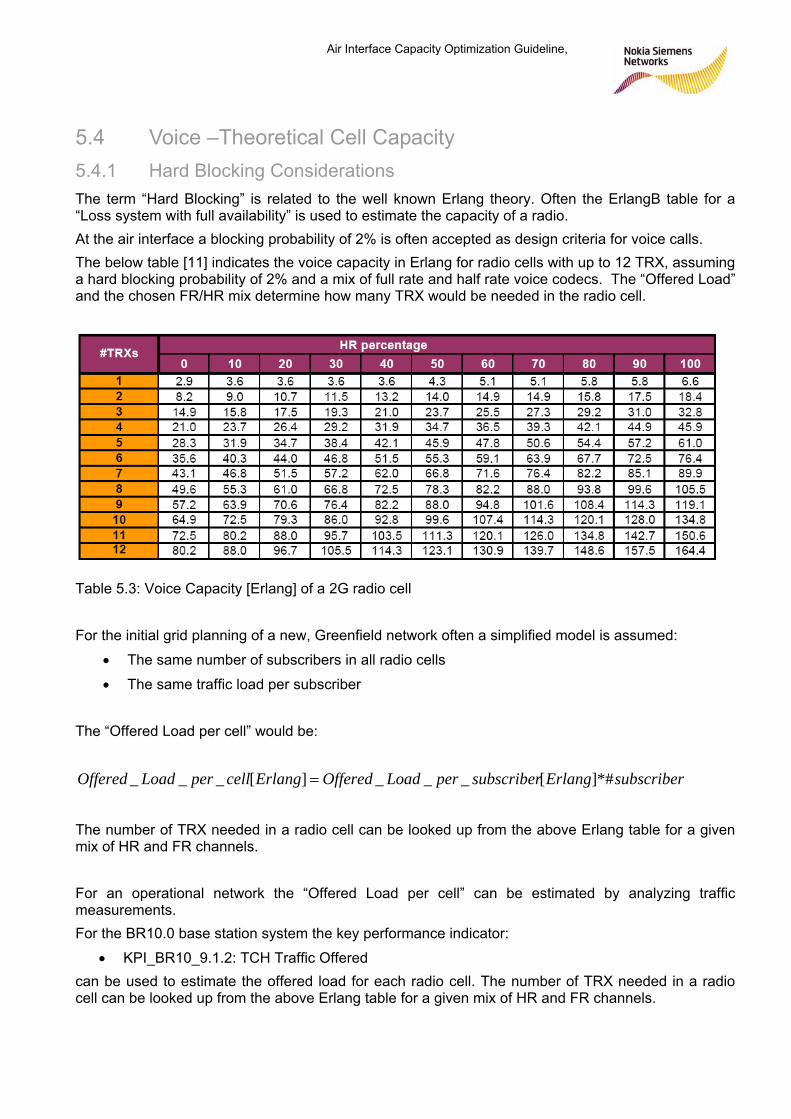
43/61 Gerson Mann Capability Development
Air Interface Capacity Optimization Guideline, 17.02.2009
5.4 Voice –Theoretical Cell Capacity 5.4.1 Hard Blocking Considerations The term “Hard Blocking” is related to the well known Erlang theory. Often the ErlangB table for a “Loss system with full availability” is used to estimate the capacity of a radio. At the air interface a blocking probability of 2% is often accepted as design criteria for voice calls. The below table [11] indicates the voice capacity in Erlang for radio cells with up to 12 TRX, assuming a hard blocking probability of 2% and a mix of full rate and half rate voice codecs. The “Offered Load” and the chosen FR/HR mix determine how many TRX would be needed in the radio cell.
Table 5.3: Voice Capacity [Erlang] of a 2G radio cell For the initial grid planning of a new, Greenfield network often a simplified model is assumed:
• The same number of subscribers in all radio cells
• The same traffic load per subscriber The “Offered Load per cell” would be:
subscriberErlangsubscriberperLoadOfferedErlangcellperLoadOffered ]*#[___][___ =
The number of TRX needed in a radio cell can be looked up from the above Erlang table for a given mix of HR and FR channels. For an operational network the “Offered Load per cell” can be estimated by analyzing traffic measurements. For the BR10.0 base station system the key performance indicator:
• KPI_BR10_9.1.2: TCH Traffic Offered can be used to estimate the offered load for each radio cell. The number of TRX needed in a radio cell can be looked up from the above Erlang table for a given mix of HR and FR channels.

44/61 Gerson Mann Capability Development
Air Interface Capacity Optimization Guideline 17.02. 2009
5.4.2 Soft Blocking Considerations If the C/I ratio is becoming too low, free time slots in a radio cell can not be used anymore due to the high bit error rate. The phenomenon is referred to as “Soft Blocking”. The effects of Soft Blocking are described in detail for instance in the in the Air Interface Planning Manual [7]. Capacity Enhancement Features can partly reduce the effects of Soft Blocking. These features are also considered in the Air Interface Dimensioning Tools for hexagonal shaped, theoretical network models. The “Offered Load”, which can be processed in a radio cell, depends mainly on the:
• Number of installed TRX
• Available frequency bandwidth
• Assumed share of Full Rate- and Half Rate channels
• Capacity Enhancement Feature Set
Project specific dimensioning examples can be calculated with the “Geran CS Capacity Calculator”, for ideal, hexagonal shaped, theoretical networks. In real networks, the achievable capacity values will be lower due to interference considerations. For an available frequency bandwidth of 5.0 MHz and 7.5 MHz a number of dimensioning examples are presented below. A more aggressive selection of parameter settings for:
• The share of half rate traffic
• Capacity enhancement feature sets would lead to higher calculation results for the theoretical maximum cell capacity (Offered Load). Geran CS Capacity Calculator in IMS: https://sharenet-ims.inside.nokiasiemensnetworks.com/Open/390582398 RNT_2G_DimTool v4.0.1
Alternatively the RNT_2G_DimTool could be used. It covers all calculation steps that are relevant for air interface dimensioning process: coverage, CS capacity, PS capacity. Project specific requirements assuming coverage quality, capacity to be offered, traffic model, etc. are taken into account during analysis. The tool in an automatic way considers various network and HW configurations in order to speed-up calculation time and make the dimensioning fast and efficient. Both product lines: BR and BSS are supported
https://sharenet-ims.inside.nokiasiemensnetworks.com/Open/390581006
5.4.3 Dimensioning Examples, Bandwidth 5.0 MHz
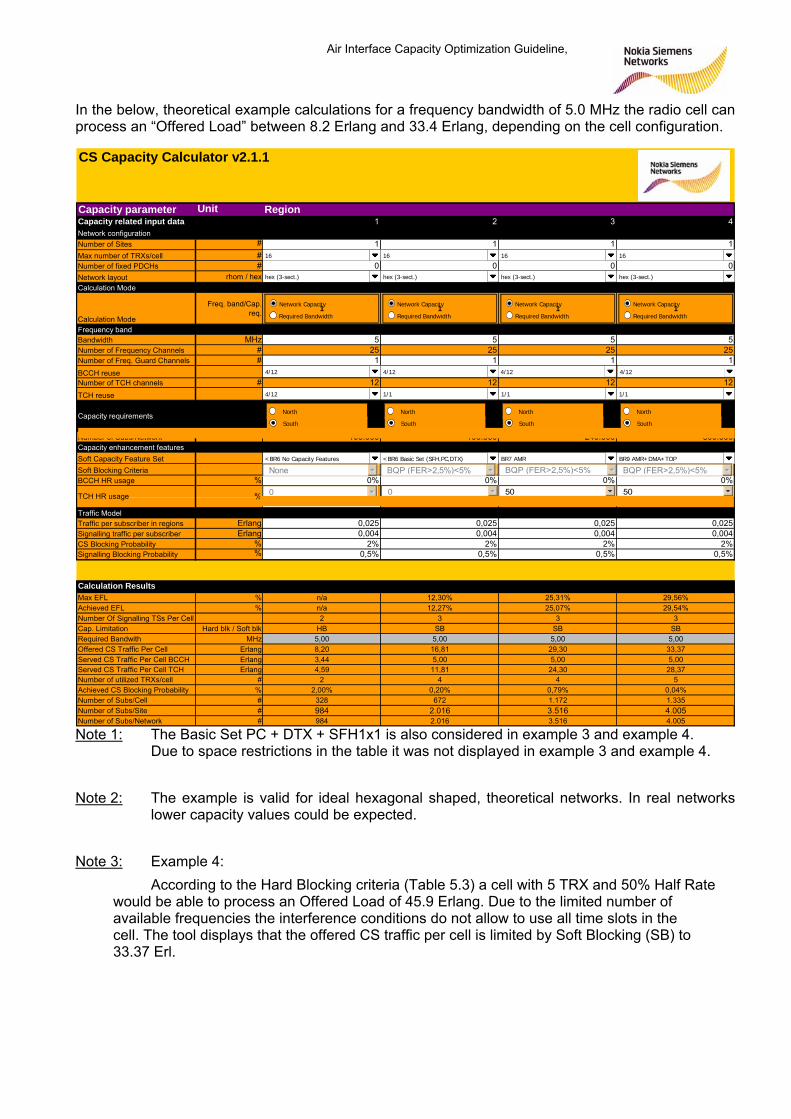
45/61 Gerson Mann Capability Development
Air Interface Capacity Optimization Guideline, 17.02.2009
In the below, theoretical example calculations for a frequency bandwidth of 5.0 MHz the radio cell can process an “Offered Load” between 8.2 Erlang and 33.4 Erlang, depending on the cell configuration.
CS Capacity Calculator v2.1.1
Capacity parameter Unit RegionCapacity related input data 1 2 3 4Network configuration
ber of Sites # 1 1 1 1Max number of TRXs/cell # 16 16 16 16
ber of fixed PDCHs # 0 0 0 0Network layout rhom / hex 2 2 2 2Calculation Mode
alculation Mode
Freq. band/Cap. req. 1 1 1 1
Frequency bandndwidth MHz 5 5 5 5
Number of Frequency Channels # 25 25 25 25ber of Freq. Guard Channels # 1 1 1 1H reuse 1 1 1 1ber of TCH channels # 12 12 12 12
TCH reuse 3 1 1 1
Capacity requirements
ber of Subs/Network 100.000 100.000 240.000 800.000Capacity enhancement features
ft Capacity Feature Set 1 2 3 7ft Blocking Criteria None BQP (FER>2,5%)<5% BQP (FER>2,5%)<5% BQP (FER>2,5%)<5%
CCH HR usage % 0% 0% 0% 0%
Traffic Modelraffic per subscriber in regions Erlang 0,025 0,025 0,025 0,025
lling traffic per subscriber Erlang 0,004 0,004 0,004 0,004king Probability % 2% 2% 2% 2%
lling Blocking Probability % 0,5% 0,5% 0,5% 0,5%
Calculation Results EFL % n/a 12,30% 25,31% 29,56%
hieved EFL % n/a 12,27% 25,07% 29,54%ber Of Signalling TSs Per Cell 2 3 3 3
Cap. Limitation Hard blk / Soft blk HB SB SB SBuired Bandwith MHz 5,00 5,00 5,00 5,00
ffered CS Traffic Per Cell Erlang 8,20 16,81 29,30 33,37rved CS Traffic Per Cell BCCH Erlang 3,44 5,00 5,00 5,00rved CS Traffic Per Cell TCH Erlang 4,59 11,81 24,30 28,37
ber of utilized TRXs/cell # 2 4 4 5hieved CS Blocking Probability % 2,00% 0,20% 0,79% 0,04%
ber of Subs/Cell # 328 672 1.172 1.335ber of Subs/Site # 984 2.016 3.516 4.005ber of Subs/Network # 984 2.016 3.516 4.005
CH HR usage %
Num
Num
C
Ba
Num
BCCNum
2 2 2 2Num
SoSoB
0 0 50 500% 0% 0% 0%
TSignaCS BlocSigna
MaxAcNum
ReqOSeSeNumAcNumNumNum
T
hex (3-sect.) hex (3-sect.) hex (3-sect.) hex (3-sect.)
4/12 4/12 4/12 4/12
4/12 1/1 1/1 1/1
<BR6 Basic Set (SFH,PC,DTX) BR7 AMR BR9 AMR+DMA+TOP
00 00 50 50
Network Capacity
Required Bandwidth
Network Capacity
Required Bandwidth
Network Capacity
Required Bandwidth
Network Capacity
Required Bandwidth
<BR6 No Capacity Features
16 16 16 16
North
South
North
South
North
South
North
South
NoneNone BQP (FER>2,5%)<5%BQP (FER>2,5%)<5% BQP (FER>2,5%)<5%BQP (FER>2,5%)<5% BQP (FER>2,5%)<5%BQP (FER>2,5%)<5%
Note 1: The Basic Set PC + DTX + SFH1x1 is also considered in example 3 and example 4. Due to space restrictions in the table it was not displayed in example 3 and example 4. Note 2: The example is valid for ideal hexagonal shaped, theoretical networks. In real networks lower capacity values could be expected. Note 3: Example 4: According to the Hard Blocking criteria (Table 5.3) a cell with 5 TRX and 50% Half Rate would be able to process an Offered Load of 45.9 Erlang. Due to the limited number of available frequencies the interference conditions do not allow to use all time slots in the cell. The tool displays that the offered CS traffic per cell is limited by Soft Blocking (SB) to 33.37 Erl.
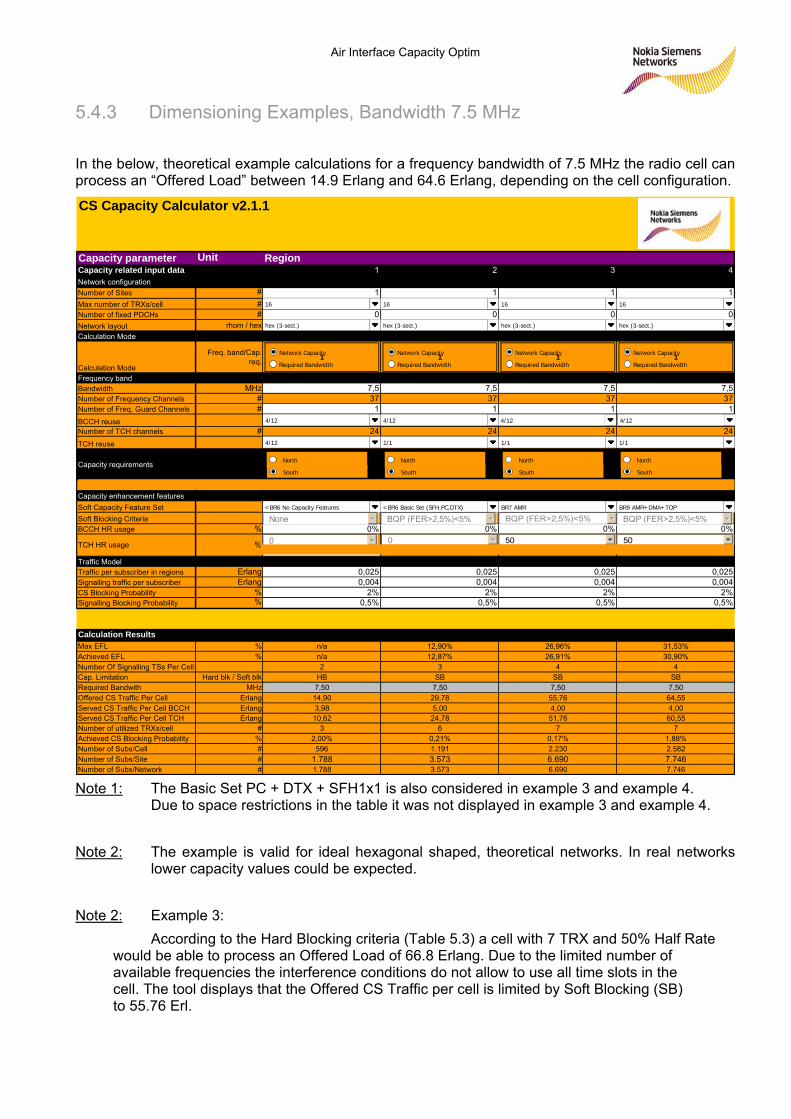
46/61 Gerson Mann Capability Development
Air Interface Capacity Optimization Guideline 17.02. 2009
5.4.3 Dimensioning Examples, Bandwidth 7.5 MHz In the below, theoretical example calculations for a frequency bandwidth of 7.5 MHz the radio cell can process an “Offered Load” between 14.9 Erlang and 64.6 Erlang, depending on the cell configuration.
CS Capacity Calculator v2.1.1
Capacity parameter Unit RegionCapacity related input data 1 2 3 4Network configuration
ber of Sites # 1 1 1 1 number of TRXs/cell # 16 16 16 16ber of fixed PDCHs # 0 0 0 0ork layout rhom / hex 2 2 2 2
Calculation Mode
alculation Mode
Freq. band/Cap. req. 1 1 1 1
Frequency bandndwidth MHz 7,5 7,5 7,5 7,5
ber of Frequency Channels # 37 37 37 37ber of Freq. Guard Channels # 1 1 1 1H reuse 1 1 1 1ber of TCH channels # 24 24 24 24
CH reuse 3 1 1 1
Capacity requirements
ber of Subs/Network 100.000 100.000 240.000 800.000Capacity enhancement features
ft Capacity Feature Set 1 2 3 7Soft Blocking Criteria None BQP (FER>2,5%)<5% BQP (FER>2,5%)<5% BQP (FER>2,5%)<5%
CCH HR usage % 0% 0% 0% 0%
Traffic Modelraffic per subscriber in regions Erlang 0,025 0,025 0,025 0,025
lling traffic per subscriber Erlang 0,004 0,004 0,004 0,004king Probability % 2% 2% 2% 2%
lling Blocking Probability % 0,5% 0,5% 0,5% 0,5%
Calculation Results EFL % n/a 12,90% 26,96% 31,53%
hieved EFL % n/a 12,87% 26,91% 30,90%ber Of Signalling TSs Per Cell 2 3 4 4
. Limitation Hard blk / Soft blk HB SB SB SBuired Bandwith MHz 7,50 7,50 7,50 7,50
ffered CS Traffic Per Cell Erlang 14,90 29,78 55,76 64,55rved CS Traffic Per Cell BCCH Erlang 3,98 5,00 4,00 4,00rved CS Traffic Per Cell TCH Erlang 10,62 24,78 51,76 60,55
Number of utilized TRXs/cell # 3 6 7 7hieved CS Blocking Probability % 2,00% 0,21% 0,17% 1,88%
ber of Subs/Cell # 596 1.191 2.230 2.582ber of Subs/Site # 1.788 3.573 6.690 7.746ber of Subs/Network # 1.788 3.573 6.690 7.746
CH HR usage %
NumMaxNumNetw
C
BaNumNum
BCCNum
T
2 2 2 2Num
So
B0 0 50 50
0% 0% 0% 0%
TSignaCS BlocSigna
MaxAcNumCapReqOSeSe
AcNumNumNum
T
hex (3-sect.) hex (3-sect.) hex (3-sect.) hex (3-sect.)
4/12 4/12 4/12 4/12
4/12 1/1 1/1 1/1
<BR6 Basic Set (SFH,PC,DTX) BR7 AMR BR9 AMR+DMA+TOP
00 00 50 50
Network Capacity
Required Bandwidth
Network Capacity
Required Bandwidth
Network Capacity
Required Bandwidth
Network Capacity
Required Bandwidth
<BR6 No Capacity Features
16 16 16 16
North
South
North
South
North
South
North
South
NoneNone BQP (FER>2,5%)<5%BQP (FER>2,5%)<5% BQP (FER>2,5%)<5%BQP (FER>2,5%)<5% BQP (FER>2,5%)<5%BQP (FER>2,5%)<5%
Note 1: The Basic Set PC + DTX + SFH1x1 is also considered in example 3 and example 4. Due to space restrictions in the table it was not displayed in example 3 and example 4. Note 2: The example is valid for ideal hexagonal shaped, theoretical networks. In real networks lower capacity values could be expected. Note 2: Example 3: According to the Hard Blocking criteria (Table 5.3) a cell with 7 TRX and 50% Half Rate would be able to process an Offered Load of 66.8 Erlang. Due to the limited number of available frequencies the interference conditions do not allow to use all time slots in the cell. The tool displays that the Offered CS Traffic per cell is limited by Soft Blocking (SB) to 55.76 Erl.
47/61 Gerson Mann Capability Development
Air Interface Capacity Optimization Guideline, 17.02.2009
5.5 (E)GPRS – Theoretical Cell Capacity 5.5.1 Priority concepts in GSM / (E)GPRS Networks As long as enough resources are available in a radio cell, signaling, voice- and data calls can be processed. A shortage of resources will result in blocked signaling messages and blocked voice calls. Data calls can be downgraded to lower bitrates and, if necessary, entirely blocked. In a 2.5G radio cell Voice services can have priority over (E)GPRS services [2]. In high load situations priority can be given to voice calls and (E)GPRS calls can be downgraded to a minimum throughput equivalent to 1/16 of a single time slot (Downlink) before the data call will be entirely blocked. This mechanism allows introducing three basic approaches for the optimization of the air interface resources in 2.5G GSM / (E)GPRS networks: Capacity Optimization – Fast growing markets: As soon as the combined time slot utilization for signaling, voice and data exceeds in a radio cell a certain threshold of, for instance, 70%, a new base station (BTS) could be taken out of the store and being installed immediately. Note: For a cell with 1 TRX, voice FR only, 70% utilization corresponds to approximately 20% blocking of voice calls. The situation changes when half rate is enabled and more TRX are installed. This method could be applied in very fast growing markets. There is a risk of over investing and delayed return on investment if the traffic does not grow as expected. Capacity Optimization – Low cost: The radio cells would be re-engineered to accommodate the offered voice traffic. During the cells busy hour, voice calls can be given priority over (E)GPRS data calls. As a consequence it must be accepted, that in high load situations (E)GPRS calls are down graded to lower throughput or entirely blocked. Outside the cells busy hour the system can assign more time slots for (E)GPRS services. The reduced performance requirements translate directly into lower investments and into better return on investment. Voice Calls: A high number of installed TRX per cell, a high percentage of Half Rate Calls and a high utilization of the frequency spectrum may reduce the voice quality but keeps the number of installed BTS lower. Capacity Optimization – High performance: The re-engineering of the radio cell would target to have even during the cells busy hour sufficient radio resources available for voice, signaling and GPRS/EDGE. This translates into more hardware, higher investments but also into better performance. First the radio cells would be re-engineered to accommodate the offered voice traffic. Additional capacity would be added to accommodate (E)GPRS data calls.
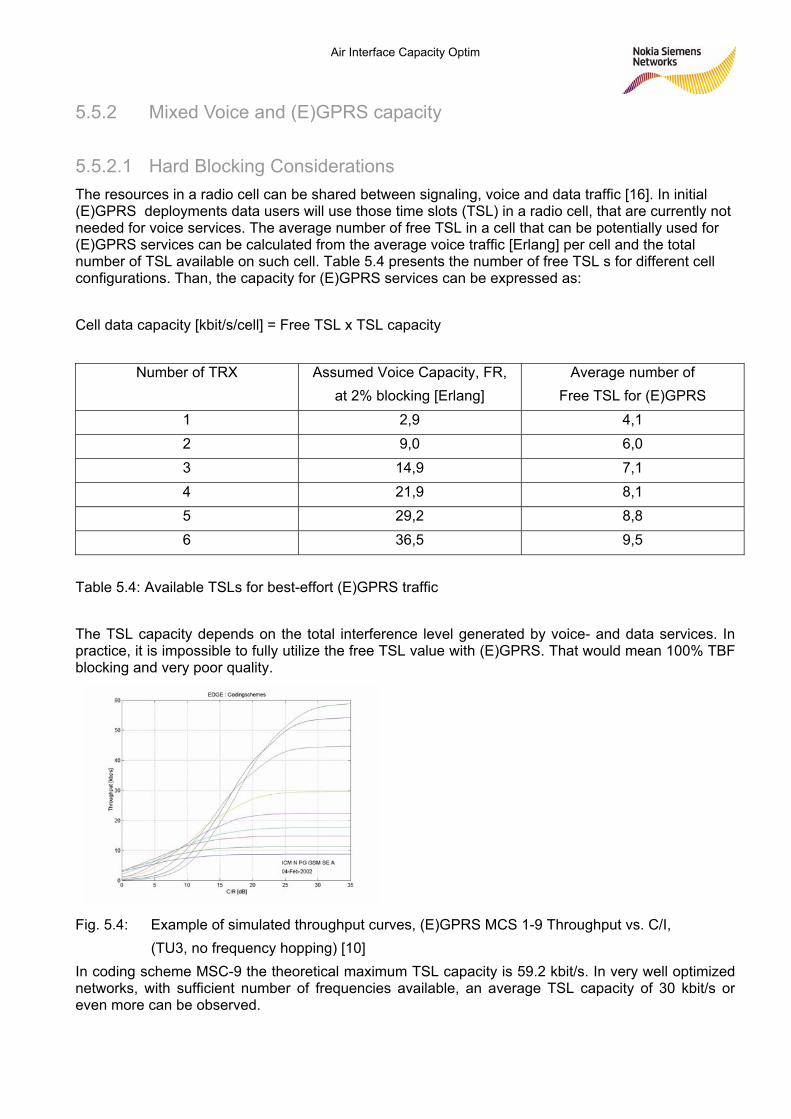
48/61 Gerson Mann Capability Development
Air Interface Capacity Optimization Guideline 17.02. 2009
5.5.2 Mixed Voice and (E)GPRS capacity
5.5.2.1 Hard Blocking Considerations The resources in a radio cell can be shared between signaling, voice and data traffic [16]. In initial (E)GPRS deployments data users will use those time slots (TSL) in a radio cell, that are currently not needed for voice services. The average number of free TSL in a cell that can be potentially used for (E)GPRS services can be calculated from the average voice traffic [Erlang] per cell and the total number of TSL available on such cell. Table 5.4 presents the number of free TSL s for different cell configurations. Than, the capacity for (E)GPRS services can be expressed as: Cell data capacity [kbit/s/cell] = Free TSL x TSL capacity
Number of TRX Assumed Voice Capacity, FR, at 2% blocking [Erlang]
Average number of Free TSL for (E)GPRS
1 2,9 4,1 2 9,0 6,0 3 14,9 7,1 4 21,9 8,1 5 29,2 8,8 6 36,5 9,5
Table 5.4: Available TSLs for best-effort (E)GPRS traffic The TSL capacity depends on the total interference level generated by voice- and data services. In practice, it is impossible to fully utilize the free TSL value with (E)GPRS. That would mean 100% TBF blocking and very poor quality. Fig. 5.4: Example of simulated throughput curves, (E)GPRS MCS 1-9 Throughput vs. C/I, (TU3, no frequency hopping) [10] In coding scheme MSC-9 the theoretical maximum TSL capacity is 59.2 kbit/s. In very well optimized networks, with sufficient number of frequencies available, an average TSL capacity of 30 kbit/s or even more can be observed.
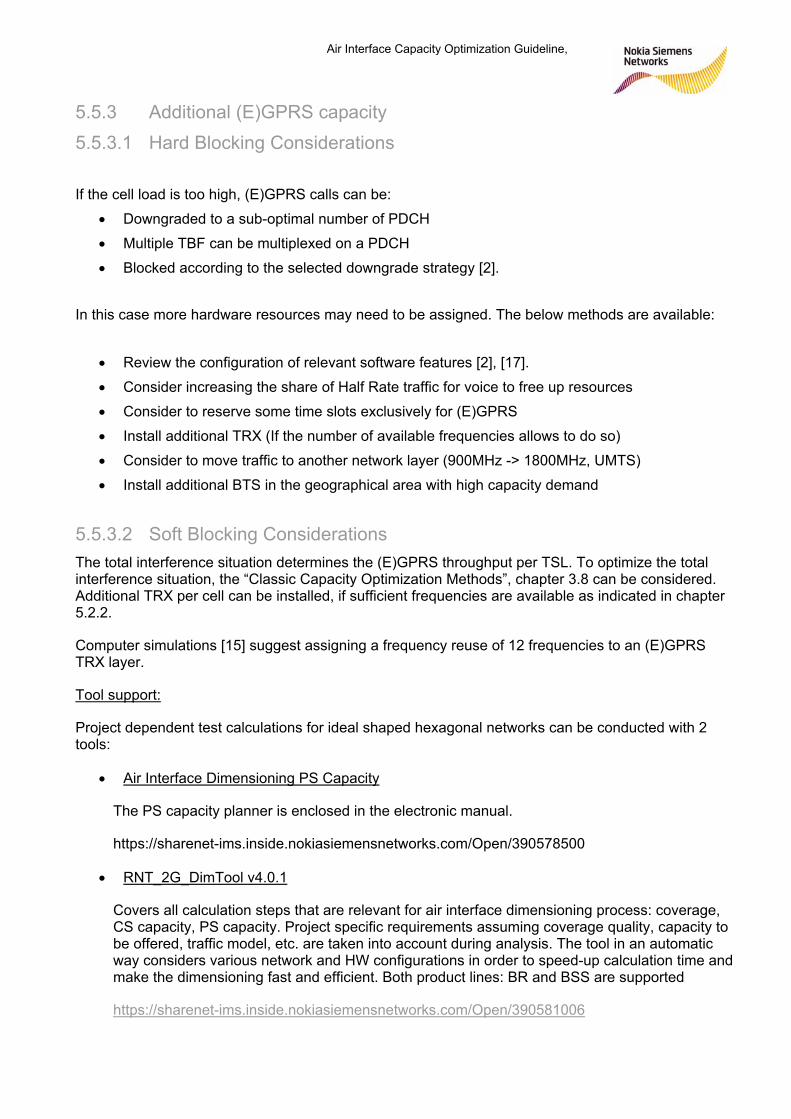
49/61 Gerson Mann Capability Development
Air Interface Capacity Optimization Guideline, 17.02.2009
5.5.3 Additional (E)GPRS capacity 5.5.3.1 Hard Blocking Considerations
If the cell load is too high, (E)GPRS calls can be:
• Downgraded to a sub-optimal number of PDCH
• Multiple TBF can be multiplexed on a PDCH
• Blocked according to the selected downgrade strategy [2]. In this case more hardware resources may need to be assigned. The below methods are available:
• Review the configuration of relevant software features [2], [17].
• Consider increasing the share of Half Rate traffic for voice to free up resources
• Consider to reserve some time slots exclusively for (E)GPRS
• Install additional TRX (If the number of available frequencies allows to do so)
• Consider to move traffic to another network layer (900MHz -> 1800MHz, UMTS)
• Install additional BTS in the geographical area with high capacity demand
5.5.3.2 Soft Blocking Considerations The total interference situation determines the (E)GPRS throughput per TSL. To optimize the total interference situation, the “Classic Capacity Optimization Methods”, chapter 3.8 can be considered. Additional TRX per cell can be installed, if sufficient frequencies are available as indicated in chapter 5.2.2.
Computer simulations [15] suggest assigning a frequency reuse of 12 frequencies to an (E)GPRS TRX layer.
Tool support:
Project dependent test calculations for ideal shaped hexagonal networks can be conducted with 2 tools:
• Air Interface Dimensioning PS Capacity
The PS capacity planner is enclosed in the electronic manual.
https://sharenet-ims.inside.nokiasiemensnetworks.com/Open/390578500
• RNT_2G_DimTool v4.0.1
Covers all calculation steps that are relevant for air interface dimensioning process: coverage, CS capacity, PS capacity. Project specific requirements assuming coverage quality, capacity to be offered, traffic model, etc. are taken into account during analysis. The tool in an automatic way considers various network and HW configurations in order to speed-up calculation time and make the dimensioning fast and efficient. Both product lines: BR and BSS are supported
https://sharenet-ims.inside.nokiasiemensnetworks.com/Open/390581006
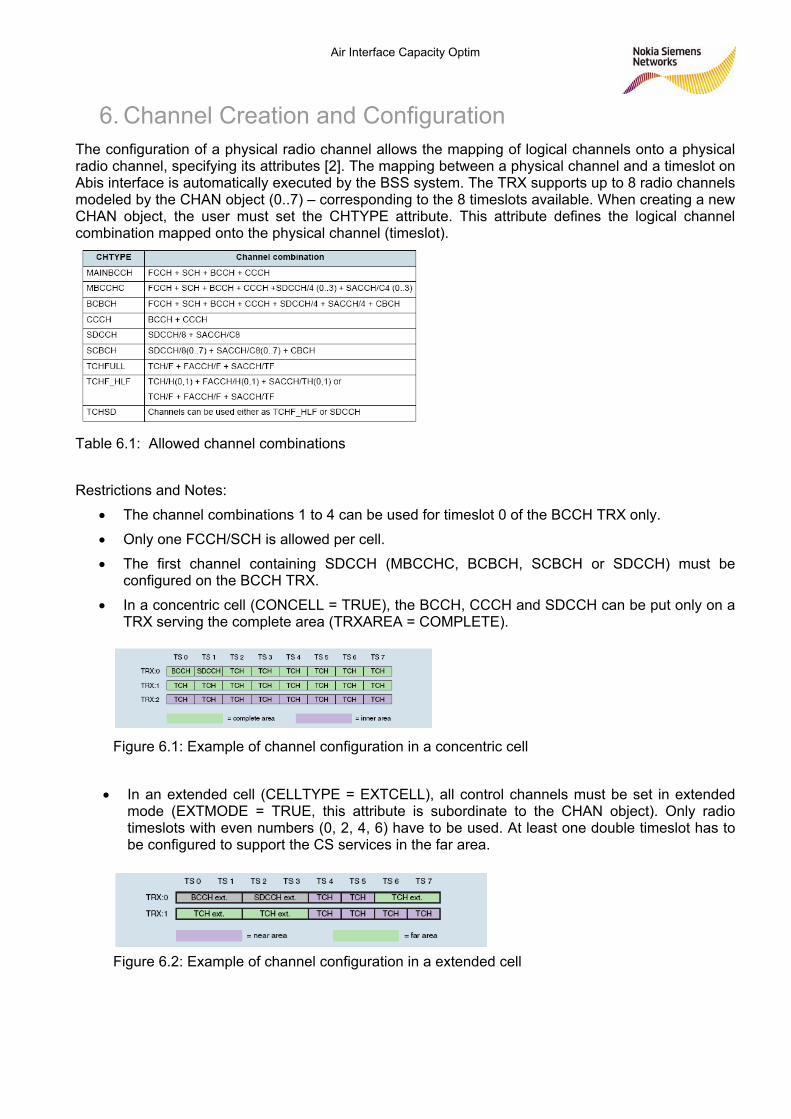
50/61 Gerson Mann Capability Development
Air Interface Capacity Optimization Guideline 17.02. 2009
6. Channel Creation and Configuration The configuration of a physical radio channel allows the mapping of logical channels onto a physical radio channel, specifying its attributes [2]. The mapping between a physical channel and a timeslot on Abis interface is automatically executed by the BSS system. The TRX supports up to 8 radio channels modeled by the CHAN object (0..7) – corresponding to the 8 timeslots available. When creating a new CHAN object, the user must set the CHTYPE attribute. This attribute defines the logical channel combination mapped onto the physical channel (timeslot).
Table 6.1: Allowed channel combinations Restrictions and Notes:
• The channel combinations 1 to 4 can be used for timeslot 0 of the BCCH TRX only.
• Only one FCCH/SCH is allowed per cell.
• The first channel containing SDCCH (MBCCHC, BCBCH, SCBCH or SDCCH) must be configured on the BCCH TRX.
• In a concentric cell (CONCELL = TRUE), the BCCH, CCCH and SDCCH can be put only on a TRX serving the complete area (TRXAREA = COMPLETE).
Figure 6.1: Example of channel configuration in a concentric cell
• In an extended cell (CELLTYPE = EXTCELL), all control channels must be set in extended mode (EXTMODE = TRUE, this attribute is subordinate to the CHAN object). Only radio timeslots with even numbers (0, 2, 4, 6) have to be used. At least one double timeslot has to be configured to support the CS services in the far area.
Figure 6.2: Example of channel configuration in a extended cell
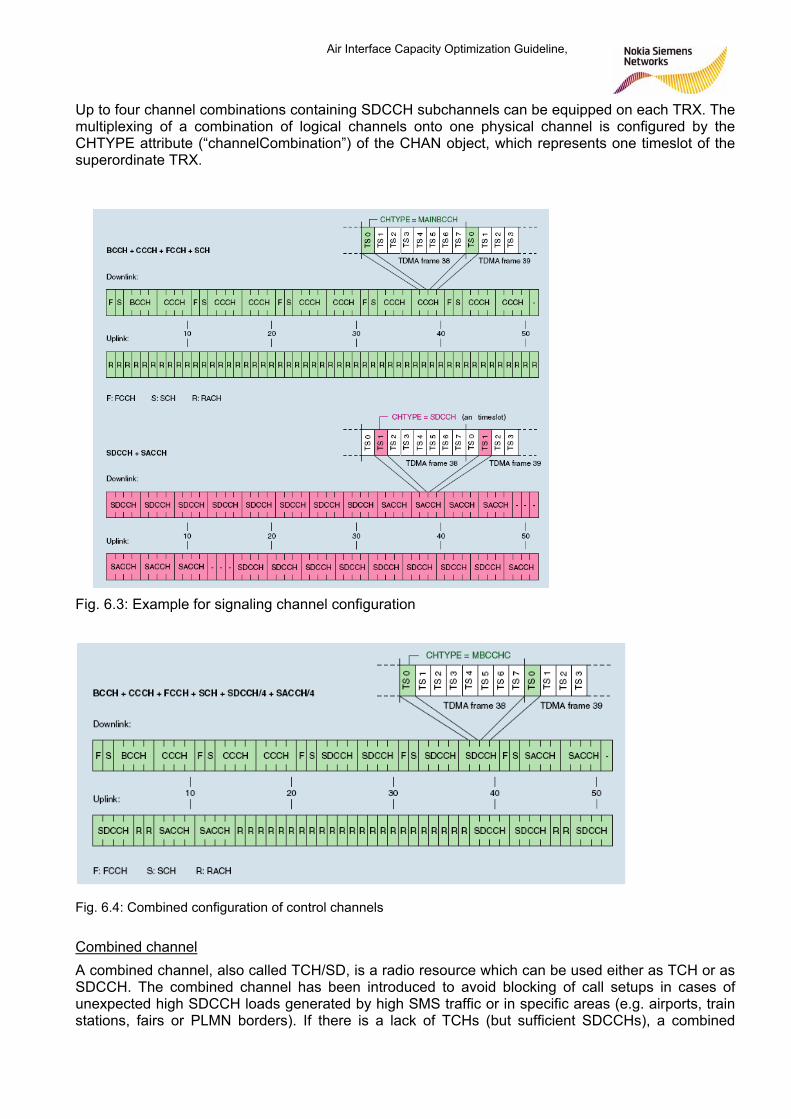
51/61 Gerson Mann Capability Development
Air Interface Capacity Optimization Guideline, 17.02.2009
Up to four channel combinations containing SDCCH subchannels can be equipped on each TRX. The multiplexing of a combination of logical channels onto one physical channel is configured by the CHTYPE attribute (“channelCombination”) of the CHAN object, which represents one timeslot of the superordinate TRX. Fig. 6.3: Example for signaling channel configuration Fig. 6.4: Combined configuration of control channels Combined channel A combined channel, also called TCH/SD, is a radio resource which can be used either as TCH or as SDCCH. The combined channel has been introduced to avoid blocking of call setups in cases of unexpected high SDCCH loads generated by high SMS traffic or in specific areas (e.g. airports, train stations, fairs or PLMN borders). If there is a lack of TCHs (but sufficient SDCCHs), a combined
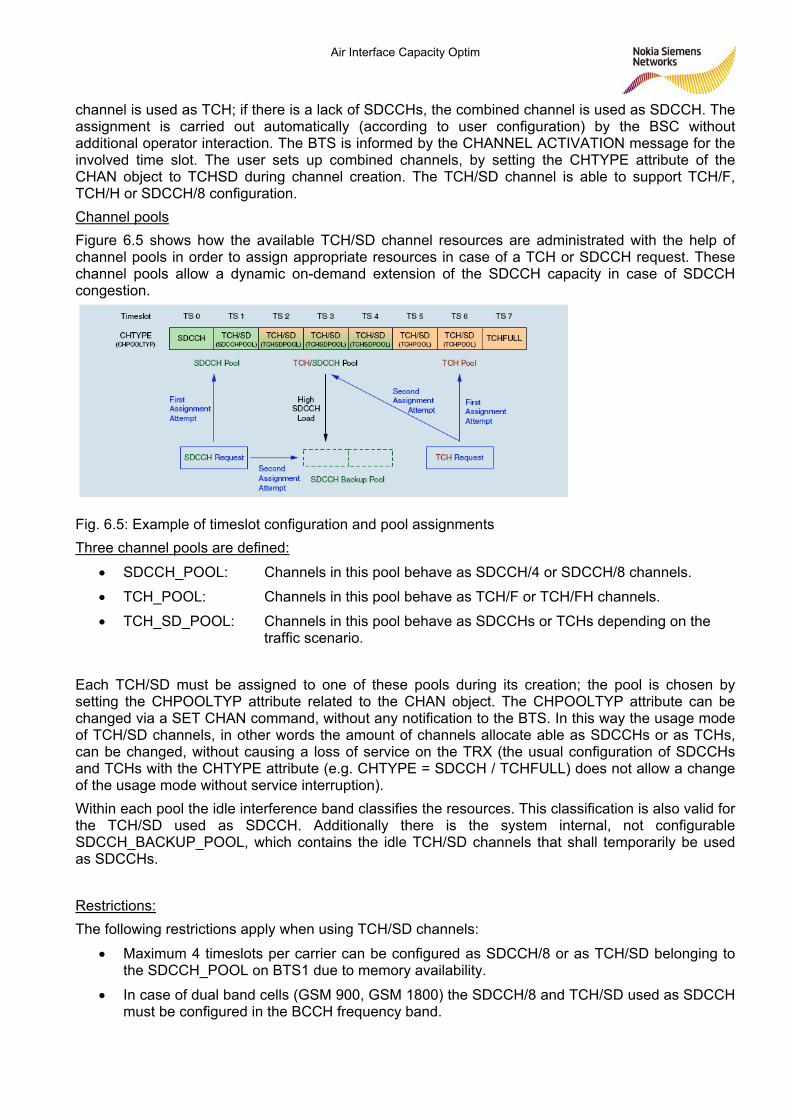
52/61 Gerson Mann Capability Development
Air Interface Capacity Optimization Guideline 17.02. 2009
channel is used as TCH; if there is a lack of SDCCHs, the combined channel is used as SDCCH. The assignment is carried out automatically (according to user configuration) by the BSC without additional operator interaction. The BTS is informed by the CHANNEL ACTIVATION message for the involved time slot. The user sets up combined channels, by setting the CHTYPE attribute of the CHAN object to TCHSD during channel creation. The TCH/SD channel is able to support TCH/F, TCH/H or SDCCH/8 configuration. Channel pools Figure 6.5 shows how the available TCH/SD channel resources are administrated with the help of channel pools in order to assign appropriate resources in case of a TCH or SDCCH request. These channel pools allow a dynamic on-demand extension of the SDCCH capacity in case of SDCCH congestion. Fig. 6.5: Example of timeslot configuration and pool assignments Three channel pools are defined:
• SDCCH_POOL: Channels in this pool behave as SDCCH/4 or SDCCH/8 channels.
• TCH_POOL: Channels in this pool behave as TCH/F or TCH/FH channels.
• TCH_SD_POOL: Channels in this pool behave as SDCCHs or TCHs depending on the traffic scenario.
Each TCH/SD must be assigned to one of these pools during its creation; the pool is chosen by setting the CHPOOLTYP attribute related to the CHAN object. The CHPOOLTYP attribute can be changed via a SET CHAN command, without any notification to the BTS. In this way the usage mode of TCH/SD channels, in other words the amount of channels allocate able as SDCCHs or as TCHs, can be changed, without causing a loss of service on the TRX (the usual configuration of SDCCHs and TCHs with the CHTYPE attribute (e.g. CHTYPE = SDCCH / TCHFULL) does not allow a change of the usage mode without service interruption). Within each pool the idle interference band classifies the resources. This classification is also valid for the TCH/SD used as SDCCH. Additionally there is the system internal, not configurable SDCCH_BACKUP_POOL, which contains the idle TCH/SD channels that shall temporarily be used as SDCCHs. Restrictions: The following restrictions apply when using TCH/SD channels:
• Maximum 4 timeslots per carrier can be configured as SDCCH/8 or as TCH/SD belonging to the SDCCH_POOL on BTS1 due to memory availability.
• In case of dual band cells (GSM 900, GSM 1800) the SDCCH/8 and TCH/SD used as SDCCH must be configured in the BCCH frequency band.
53/61 Gerson Mann Capability Development
Air Interface Capacity Optimization Guideline, 17.02.2009
• A configuration change from TCH to TCH/SD or vice versa (and from SDCCH to TCH/SD or vice versa) implies deletion of the channel (DELETE command) and its re-creation.
• Using Concentric (or Extended) Cells, the assignment of a TCH/SD channel to the TCH_SD_POOL is possible only on the Complete (or Far) Area.
• In order to prevent Cell Barring, at least one TCH/SD channel must be belong to the SDCCH_POOL.
TCH/SD channel assignment: The BSC searches for a SDCCH and assigns appropriate resources according to the following rules:
• In case the SDCCH_POOL is not empty, a SDCCH request is satisfied by assignment of a resource from the SDCCH_POOL.
• In case of high SDCCH load, a TCH/SD channel configured for usage both as SDCCH and TCH is moved to the SDCCH_BACKUP_POOL, thus increasing the number of available candidates for SDCCH allocation; this process is executed, when the SDCCH subchannel occupation (calculated by the sum of busy channels from the SDCCH_POOL and SDCCH_BACKUP_POOL) exceeds the threshold SDCCHCONGTH (“sdcchCongestionThreshold”) for a time period of more than 2 s.
• If a new SDCCH request arrives and the SDCCH_POOL is empty, the request is satisfied by a resource from the SDCCH_BACKUP_POOL – if this pool is not empty (in case of empty SDCCH_BACKUP_POOL an IMMEDIATE ASSIGNMENT REJECT message is sent to the BTS).
In case of a TCH request the BSC assigns a channel according to the following rules:
• In case the TCH_POOL is not empty, the TCH request is satisfied by assignment of a resource from the TCH_POOL.
• In case no TCH is available from the TCH_POOL, a new TCH can be assigned from the TCH_SD_POOL.
Release of SDCCHs: SDCCHs which have become idle are returned to the pool where they are taken from in the assignment step:
• If the sub-channel to be released belongs to the SDCCH_POOL, it is returned to that pool.
• If the sub-channel to be released belongs to the SDCCH_BACKUP_POOL, it is returned to that pool.
When all the sub-channels of a radio timeslot belonging to the SDCCH_BACKUP_POOL are idle, the BSC checks the BSC TGUARDTCHSD attribute. If its value is SEC00, the timeslot is immediately moved to the TCH_SD_POOL. Otherwise a timer (set to TGUARDTCHSD) is started; if the timeslot is still idle on timer expiration, it will be moved to the TCH_SD_POOL. Attributes: The following parameters have to be configured for the combined channels:
• CHTYPE (“channelCombination”) This attribute of the CHAN object defines the logical channel combination mapped onto the physical channel (timeslot). The attribute value TCHSD indicates a common channel. For more information about CHTYPE see 3.4 Creation and configuration of radio channels.
• CHPOOLTYP (“channelPoolType”)
54/61 Gerson Mann Capability Development
Air Interface Capacity Optimization Guideline 17.02. 2009
This attribute of the CHAN object assigns a TCH/SD channel to one of the three possible pools of channels: TCH_SD_POOL,TCH_POOL or SDCCH_POOL. The CHPOOLTYP attribute is not effective for other than TCH/SD channels.
• SDCCHCONGTH (“sdcchCongestionThreshold”) This threshold is set on a per cell basis (its a subordinate object of the BTS object) and triggers the moving of sub-channels from the TCH_SD_POOL to the SDCCH_BACKUP_POOL.
• TGUARDTCHSD (“timerGuardTchsd”) This timer is an attribute of the BSC object and is used in the SDCCH release procedure which moves the IDLE sub-channels from the SDCCH_BACKUP_POOL to the TCH_SD_POOL.
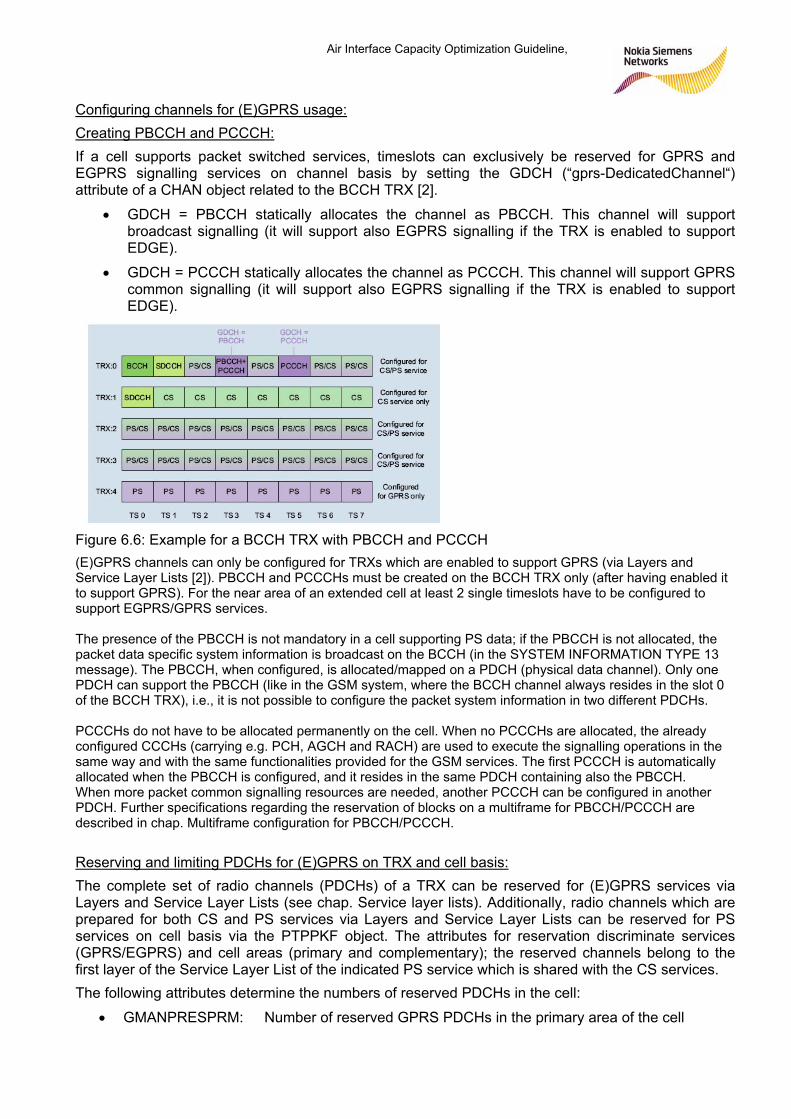
55/61 Gerson Mann Capability Development
Air Interface Capacity Optimization Guideline, 17.02.2009
Configuring channels for (E)GPRS usage: Creating PBCCH and PCCCH: If a cell supports packet switched services, timeslots can exclusively be reserved for GPRS and EGPRS signalling services on channel basis by setting the GDCH (“gprs-DedicatedChannel“) attribute of a CHAN object related to the BCCH TRX [2].
• GDCH = PBCCH statically allocates the channel as PBCCH. This channel will support broadcast signalling (it will support also EGPRS signalling if the TRX is enabled to support EDGE).
• GDCH = PCCCH statically allocates the channel as PCCCH. This channel will support GPRS common signalling (it will support also EGPRS signalling if the TRX is enabled to support EDGE).
Figure 6.6: Example for a BCCH TRX with PBCCH and PCCCH (E)GPRS channels can only be configured for TRXs which are enabled to support GPRS (via Layers and Service Layer Lists [2]). PBCCH and PCCCHs must be created on the BCCH TRX only (after having enabled it to support GPRS). For the near area of an extended cell at least 2 single timeslots have to be configured to support EGPRS/GPRS services. The presence of the PBCCH is not mandatory in a cell supporting PS data; if the PBCCH is not allocated, the packet data specific system information is broadcast on the BCCH (in the SYSTEM INFORMATION TYPE 13 message). The PBCCH, when configured, is allocated/mapped on a PDCH (physical data channel). Only one PDCH can support the PBCCH (like in the GSM system, where the BCCH channel always resides in the slot 0 of the BCCH TRX), i.e., it is not possible to configure the packet system information in two different PDCHs. PCCCHs do not have to be allocated permanently on the cell. When no PCCCHs are allocated, the already configured CCCHs (carrying e.g. PCH, AGCH and RACH) are used to execute the signalling operations in the same way and with the same functionalities provided for the GSM services. The first PCCCH is automatically allocated when the PBCCH is configured, and it resides in the same PDCH containing also the PBCCH. When more packet common signalling resources are needed, another PCCCH can be configured in another PDCH. Further specifications regarding the reservation of blocks on a multiframe for PBCCH/PCCCH are described in chap. Multiframe configuration for PBCCH/PCCCH. Reserving and limiting PDCHs for (E)GPRS on TRX and cell basis: The complete set of radio channels (PDCHs) of a TRX can be reserved for (E)GPRS services via Layers and Service Layer Lists (see chap. Service layer lists). Additionally, radio channels which are prepared for both CS and PS services via Layers and Service Layer Lists can be reserved for PS services on cell basis via the PTPPKF object. The attributes for reservation discriminate services (GPRS/EGPRS) and cell areas (primary and complementary); the reserved channels belong to the first layer of the Service Layer List of the indicated PS service which is shared with the CS services. The following attributes determine the numbers of reserved PDCHs in the cell:
• GMANPRESPRM: Number of reserved GPRS PDCHs in the primary area of the cell
56/61 Gerson Mann Capability Development
Air Interface Capacity Optimization Guideline 17.02. 2009
• GMANPRESCOM: Number of reserved GPRS PDCHs in the complementary area of the cell. In case of a standard cell, only GMANPRESPRM is meaningful.
• EMANPRESPRM: Number of reserved EDGE PDCHs in the primary area of the cell
• EMANPRESCOM: Number of reserved EDGE PDCHs in the complementary area of the cell. In case of a standard cell, only EMANPRESPRM is meaningful.
The GPDPDTCHA (“gprsPercentageOfDynamicPdtchAvailable“) attribute (range: 0..100) allows a weighting between PS and CS load: It indicates the percentage of shared CS/PS radio channels which can be dynamically allocated to (E)GPRS calls. Example: In a cell, 3 TRXs are configured for CS and PS services including the BCCH TRX (see Figure 5.8 TRX:0, TRX:2 and TRX:3). 1 channel among these 3 TRXs is occupied as BCCH, 1 as SDCCH (the SDCCH of TRX:1 is not affected since this TRX is for CS services only) and 2 as PBCCH and PCCCH, so 20 channels remain which are shared for CS and PS traffic. The GPRS parameters related to traffic shall be set as follows:
• GPDPDTCHA = 50 (i.e. 50%);
• GMANPRESPRM = 1, EMANPRESPRM = 1 (2 timeslots reserved for PDCHs) Then, the resulting maximum number N of GPRS/EGPRS channels shared with CS services is: N = (Number of shared timeslots for traffic – Number of reserved timeslots for traffic) · GPDPDTCHA/100 = (20 – 2) · 50/100 N = 9 Multiframe configuration for PBCCH/PCCCH If a channel is configured as PBCCH (GDCH = PBCCH), the radio blocks of the related multiframe (52 TDMA frames) are used/shared for several subchannels: In DL direction:
• PBCCH (e.g. PACKET SYSTEM INFORMATION messages)
• PAGCH (PACKET ACCESS GRANT REQUEST messages)
• PACCH
• PPCH (PACKET PAGING REQUEST messages)
• PDTCH (data transfer) In UL direction:
• PRACH
• PACCH
• PDTCH A channel configured as PCCCH (GDCH = PCCCH) is shared for the same subchannels except for PBCCH. The following attributes of the PTPPKF managed object specify the numbers of blocks reserved for certain subchannels:
• BSPBBLK (“bsPbcchBlocks“): This attribute indicates the number of blocks allocated to the PBCCH in a PBCCH multiframe in DL direction.
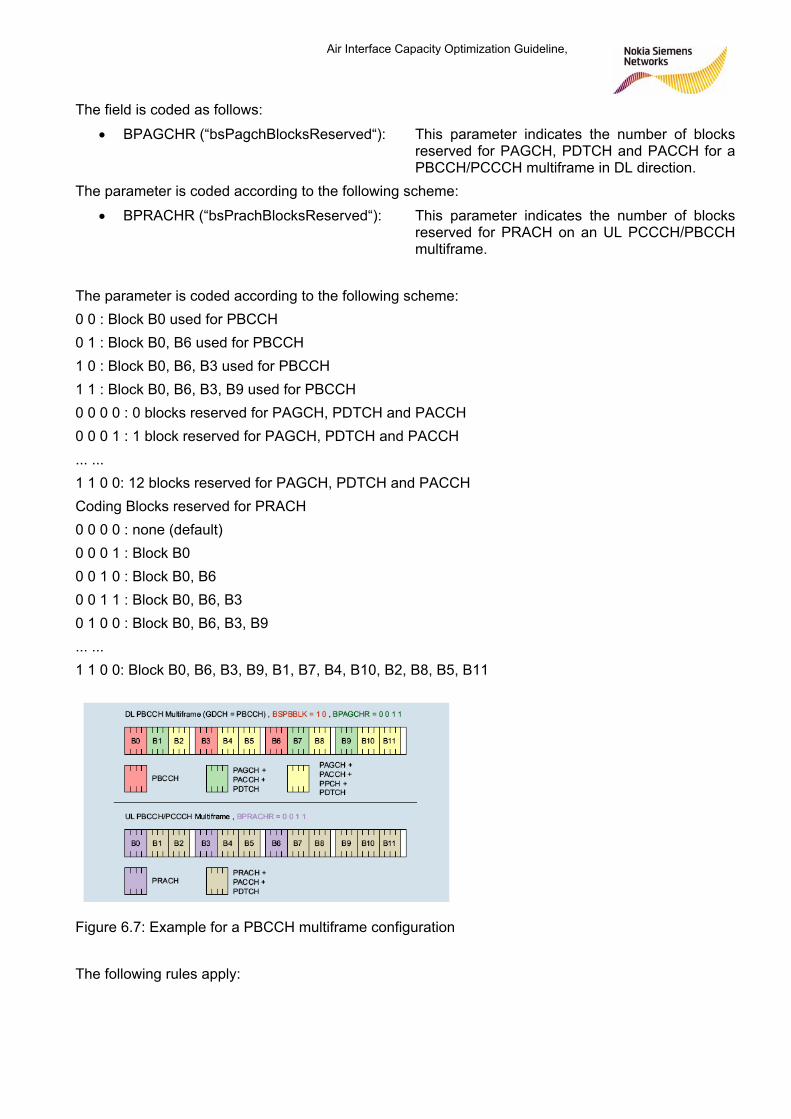
57/61 Gerson Mann Capability Development
Air Interface Capacity Optimization Guideline, 17.02.2009
The field is coded as follows:
• BPAGCHR (“bsPagchBlocksReserved“): This parameter indicates the number of blocks reserved for PAGCH, PDTCH and PACCH for a PBCCH/PCCCH multiframe in DL direction.
The parameter is coded according to the following scheme:
• BPRACHR (“bsPrachBlocksReserved“): This parameter indicates the number of blocks reserved for PRACH on an UL PCCCH/PBCCH multiframe.
The parameter is coded according to the following scheme: 0 0 : Block B0 used for PBCCH 0 1 : Block B0, B6 used for PBCCH 1 0 : Block B0, B6, B3 used for PBCCH 1 1 : Block B0, B6, B3, B9 used for PBCCH 0 0 0 0 : 0 blocks reserved for PAGCH, PDTCH and PACCH 0 0 0 1 : 1 block reserved for PAGCH, PDTCH and PACCH ... ... 1 1 0 0: 12 blocks reserved for PAGCH, PDTCH and PACCH Coding Blocks reserved for PRACH 0 0 0 0 : none (default) 0 0 0 1 : Block B0 0 0 1 0 : Block B0, B6 0 0 1 1 : Block B0, B6, B3 0 1 0 0 : Block B0, B6, B3, B9 ... ... 1 1 0 0: Block B0, B6, B3, B9, B1, B7, B4, B10, B2, B8, B5, B11 Figure 6.7: Example for a PBCCH multiframe configuration The following rules apply:

58/61 Gerson Mann Capability Development
Air Interface Capacity Optimization Guideline 17.02. 2009
1. The values of the BSPBBLK and BPAGCHR attributes have to be set in such way to have at least one block of any type: PBCCH, PPCH and PAGCH. For instance if BSPBBLK is set to 1 the maximum value for BPAGCHR is 9.
• The system does not refuse entering senseless values which may cause blocking of the PBCCH functionality itself (e.g. reserving 12 PAGCH blocks leaving no PPCH blocks).
2. The attribute BPRACHR has to be set to a value greater than 0 (which is guaranteed by the default value).
• Also for this parameter the system does not refuse entering senseless values which may cause blocking of the PBCCH functionality itself (e.g. reserving 0 PRACH blocks allows no more packet accesses in the cell).
For more details on the BSPBBLK, BPAGCHR, BPRACHR attributes, see the BSC commands and eBSC commands manuals. Tool Support: For modifications of the BSC database it is highly recommended to use the tool CM*/Caddie. The tool can fill tables with default values; the tool does not allow entering values that are out of range. After establishing the database, CM*/Caddie conducts can Parameter Assessment for data consistency according to 864 predefined rules for channel configuration, frequency assignments across the network, parameter consistency and so on.
CM*Caddie: Parameter Assessment Example: Automatically identified wrong BCCH frequency ( Within 300.780 neighbour relations )
Nr. of BSCs= 84 73xcBSC,1xeBSC
Nr. of cells= 10.026
Nr. of TRX=40.104 (4xTRX per cell)
Nr. of ADJCs:= 300.780 (2G), = 10.439 (3G)
Wrong frequency identified automatically by Caddie within 300.780 neighbors
Fig. 6.8: Screenshot CM*Caddie
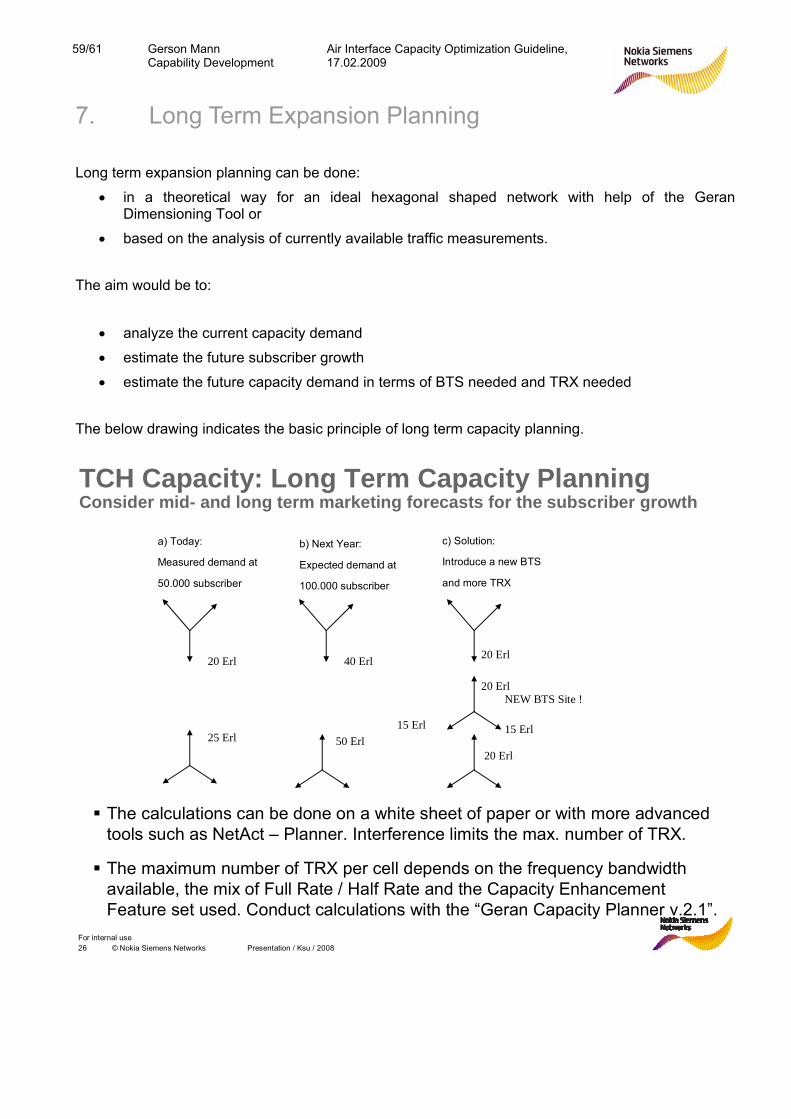
59/61 Gerson Mann Capability Development
Air Interface Capacity Optimization Guideline, 17.02.2009
7. Long Term Expansion Planning Long term expansion planning can be done:
• in a theoretical way for an ideal hexagonal shaped network with help of the Geran Dimensioning Tool or
• based on the analysis of currently available traffic measurements. The aim would be to:
• analyze the current capacity demand
• estimate the future subscriber growth
• estimate the future capacity demand in terms of BTS needed and TRX needed
The below drawing indicates the basic principle of long term capacity planning.
26 © Nokia Siemens Networks Presentation / Ksu / 2008For internal use
TCH Capacity: Long Term Capacity Planningonsider mid- and long term marketing forecasts for the subscriber growth
C
20 Erl
25 Erl
40 Erl
50 Erl
20 Erl
20 Erl
20 Erl
NEW BTS Site !
15 Erl15 Erl
a) Today:
Measured demand at
50.000 subscriber
b) Next Year:
Expected demand at
100.000 subscriber
c) Solution:
Introduce a new BTS
and more TRX
The c lculations can be done on a white sheet of paper or with more advanced tools uch as NetAct – Planner. Interference limits the max. number of TRX.
The maximum number of TRX per cell depends on the frequency bandwidth available, the mix of Full Rate / Half Rate and the Capacity Enhancement Feature set used. Conduct calculations with the “Geran Capacity Planner v.2.1”.
a s
60/61 Gerson Mann Capability Development
Air Interface Capacity Optimization Guideline 17.02. 2009
8. Annex 8.1 Annex A: Air Interface Dimensioning Tools
1. RNT_2G_DimTool v4.0.1
Covers all calculation steps that are relevant for air interface dimensioning process: coverage, CS capacity, PS capacity. Project specific requirements assuming coverage quality, capacity to be offered, traffic model, etc. are taken into account during analysis. The tool in an automatic way considers various network and HW configurations in order to speed-up calculation time and make the dimensioning fast and efficient. Both product lines: BR and BSS are supported
https://sharenet-ims.inside.nokiasiemensnetworks.com/Open/390581006
2. Link Budget tool v1.3.4
Covers complex LB calculations considering: Power Budget and Coverage analysis. BR & BSS supported.
https://sharenet-ims.inside.nokiasiemensnetworks.com/Open/390582399
3. Voice Capacity Calculator v2.1.1
Covers cell capacity dimensioning taking into account Circuit Switched traffic. BR & BSS supported.
https://sharenet-ims.inside.nokiasiemensnetworks.com/Open/390582398
4. Air Interface Dimensioning PS Capacity
The PS capacity planner is enclosed in the electronic manual.
https://sharenet-ims.inside.nokiasiemensnetworks.com/Open/390578500
61/61 Gerson Mann Capability Development
Air Interface Capacity Optimization Guideline, 17.02.2009
8.2 Annex A: Air Interface Dimensioning Guidelines
1. Air Interface Dimensioning Link Budget
https://sharenet-ims.inside.nokiasiemensnetworks.com/Open/390582137
2. Air Interface Dimensioning CS Capacity
https://sharenet-ims.inside.nokiasiemensnetworks.com/Open/390582558
3. Air Interface Dimensioning PS Capacity
https://sharenet-ims.inside.nokiasiemensnetworks.com/Open/390578500
4. Radio & Access Dimensioning Guideline
https://sharenet-ims.inside.nokiasiemensnetworks.com/Open/396708417