

Guided_Tour_on_Wind_Energy.pdf
289
Guided Tour on Wind Energy Welcome to your own guided tour on wind energy. Each of the nine tours is a self-contained unit, so you may take the tours in any order. We suggest, however, that after the introduction you start with the first section on Wind Energy Resources, since it makes it much easier to understand the other sections. Please respect that we have exclusive copyright on all of this web site. You may quote us, giving proper attribution to the Danish Wind Turbine Manufacturers Association web site www.windpower.dk, but it is illegal to reuse any picture, plot, graphics or programming on any other web site or in any commercial or non commercial medium, printed, electronic or otherwise. Introduction 1. Wind Energy Resources Where does Wind Energy Come From? 1. The Coriolis Force 2. Global Winds 3. Geostrophic Wind 4. Local Winds: Sea Breezes 5. Local Winds: Mountain Winds 6. The Energy in the Wind: Air Density and Rotor Area 7. Wind Turbines Deflect the Wind 8. The Power of the Wind: Cube of Wind Speed 9. Wind Speed Measurement: Anemometers 10. Wind Speed Measurement in Practice 11. The Wind Rose 12. Wind Rose Plotter Programme (requires Netscape 4, or IE 4) 13. Roughness and Wind Shear 14. Wind Speed Calculator (requires Netscape 3, 4, or IE 4) 15. Wind Shear and Escarpments 16. The Roughness Rose 17. Wind Speed Variability 18. Turbulence 19. Wind Obstacles 20. Wind Shade 21. Guide to the Wind Shade Calculator 22. Wind Shade Calculator (requires Netscape 3, 4, or IE 4) 23. Wake Effect 24. Park Effect 25. Speed Up Effects: Tunnel Effect 26. Speed Up Effects: Hill Effect 27. Selecting a Wind Turbine Site 28. Offshore Wind Conditions 29. Wind Map of Western Europe 30. Wind Map of Denmark 31. 2. Computing Wind Turbine Energy Output Describing Wind Variations: Weibull Distribution 1. Weibull Distribution Plotter Programme (requires Netscape 2. 3.
-
Upload
sabeeh-faruqui -
Category
Documents
-
view
14 -
download
1
description
Guided_Tour_on_Wind_Energy
Transcript of Guided_Tour_on_Wind_Energy.pdf

Guided Tour on Wind EnergyWelcome to your own guided tour on wind energy.
Each of the nine tours is a self-contained unit, so you may take the tours inany order.
We suggest, however, that after the introduction you start with the firstsection on Wind Energy Resources, since it makes it much easier tounderstand the other sections.
Please respect that we have exclusive copyright on all of this web site. You may quote us,giving proper attribution to the Danish Wind Turbine Manufacturers Association web sitewww.windpower.dk, but it is illegal to reuse any picture, plot, graphics or programming onany other web site or in any commercial or non commercial medium, printed, electronic orotherwise.
Introduction1.
Wind Energy ResourcesWhere does Wind Energy Come From?1.
The Coriolis Force2.
Global Winds3.
Geostrophic Wind4.
Local Winds: Sea Breezes5.
Local Winds: Mountain Winds6.
The Energy in the Wind: Air Density and Rotor Area7.
Wind Turbines Deflect the Wind8.
The Power of the Wind: Cube of Wind Speed9.
Wind Speed Measurement: Anemometers10.
Wind Speed Measurement in Practice11.
The Wind Rose12.
Wind Rose Plotter Programme (requires Netscape 4, or IE 4)13.
Roughness and Wind Shear14.
Wind Speed Calculator (requires Netscape 3, 4, or IE 4)15.
Wind Shear and Escarpments16.
The Roughness Rose17.
Wind Speed Variability18.
Turbulence19.
Wind Obstacles20.
Wind Shade21.
Guide to the Wind Shade Calculator22.
Wind Shade Calculator (requires Netscape 3, 4, or IE 4)23.
Wake Effect24.
Park Effect25.
Speed Up Effects: Tunnel Effect26.
Speed Up Effects: Hill Effect27.
Selecting a Wind Turbine Site28.
Offshore Wind Conditions29.
Wind Map of Western Europe30.
Wind Map of Denmark31.
2.
Computing Wind Turbine Energy OutputDescribing Wind Variations: Weibull Distribution1.
Weibull Distribution Plotter Programme (requires Netscape2.
3.

3, 4, or IE 4)
The Average Bottle Fallacy3.
Mean (Average) Power of the Wind4.
Betz' Law5.
Power Density Function6.
Power Curve of a Wind Turbine7.
The Power Coefficient8.
Guide to the Wind Turbine Power Calculator9.
Wind Turbine Power Calculator (requires Netscape 3, 4, orIE 4)
10.
Annual Energy Output from a Wind Turbine11.
How Does a Wind Turbine Work?Wind Turbine Components1.
Aerodynamics of Wind Turbines - Lift2.
Aerodynamics of Wind Turbines - Stall and Drag3.
Adding Wind Speeds and Directions4.
Rotor Aerodynamics5.
Rotor Blades6.
Power Control of Wind Turbines7.
The Wind Turbine Yaw Mechanism8.
Wind Turbine Towers9.
Wind Turbine Generators10.
Synchronous Generators11.
Changing Generator Rotational Speed12.
Asynchronous (Induction) Generators13.
Changing the Number of Generator Poles14.
Variable Slip Generators for Wind Turbines15.
Indirect Grid Connection of Wind Turbines16.
Gearboxes for Wind Turbines17.
The Electronic Wind Turbine Controller18.
Controlling Power Quality from Wind Turbines19.
Size of Wind Turbines20.
Wind Turbine Safety21.
Wind Turbine Occupational Safety22.
4.
Designing Wind TurbinesBasic Load Considerations1.
Wind Turbines: Horizontal or Vertical Axis Machines?2.
Wind Turbines: Upwind or Downwind?3.
Wind Turbines: How Many Blades?4.
Optimising Wind Turbines5.
Designing for Low Mechanical Noise from Wind Turbines6.
Designing for Low Aerodynamic Noise from Wind Turbines7.
5.
Manufacturing and Installing Wind TurbinesManufacturing Wind Turbine Nacelles (QTVR panoramarequires QuickTime plugin)
1.
Testing Wind Turbine Rotor Blades NEW2.
Manufacturing Wind Turbine Towers3.
Welding Turbine Towers4.
Installing and Assembling Wind Turbine Towers5.
6.

Research and Development in Wind EnergyResearch and Development in Wind Energy1.
Offshore Wind Power Research2.
Offshore Wind Turbine Foundations3.
Offshore Foundations: Traditional Concrete4.
Offshore Foundations: Gravitation + Steel5.
Offshore Foundations: Mono Pile6.
Offshore Foundations: Tripod7.
7.
Wind Turbines in the Electrical GridWind Energy Variations1.
Seasonal Variation in Wind Energy2.
Wind Turbines and Power Quality Issues3.
Grid Connection of Offshore Wind Parks4.
8.
Wind Energy and the EnvironmentWind Turbines in the Landscape1.
Sound from Wind Turbines2.
Measuring and Calculating Sound Levels3.
Sound Map Calculator (requires Netscape 3, 4, or IE 4)4.
Wind Turbine Sound Calculator (requires Netscape 3, 4, orIE 4)
5.
Energy Payback Period for Wind Turbines6.
Birds and Wind Turbines7.
Birds and Offshore Wind Turbines8.
Shadow Casting from Wind Turbines9.
Calculating Shadows from Wind Turbines10.
Refining Shadow Calculations for Wind Turbines11.
Shadow Variations from Wind Turbines12.
Guide to the Wind Turbine Shadow Calculator13.
Wind Turbine Shadow Calculator (requires Netscape 3, 4, orIE 4)
14.
9.
Wind Energy EconomicsWhat does a Wind Turbine Cost?1.
Installation Costs for Wind Turbines2.
Operation and Maintenance Costs3.
Income from Wind Turbines4.
Wind Energy and Electrical Tariffs5.
Basic Economics of Investment6.
Wind Energy Economics7.
Guide to the Wind Energy Economics Calculator8.
Wind Energy Economics Calculator (requires Netscape 3, 4,or IE 4)
9.
The Economics of Offshore Wind Energy10.
Wind Energy and Employment11.
10.
Modern Wind Turbine History (Pictures)
The Wind Energy Pioneer: Poul la Cour1.
The Wind Energy Pioneers - 1940-19502.
The Wind Energy Pioneers - The Gedser Wind Turbine3.
Wind Turbines From the 1980s4.
The California Wind Rush5.
11.

Modern Wind Turbines6.
Offshore Wind Turbines7.
Megawatt-Sized Wind Turbines8.
Multi-Megawatt Wind Turbines9.
We keep adding pages to this guided tour. We'll e-mail you when they areready, if you register with our Mailing List.
| Home | FAQs | Quiz | Manufacturers | Articles | Publications | Pictures | News | MailingList | Find | Links | About Us | Reference Manual | E-Mail | Map&Guide | Download |
© Copyright 2001 Soren Krohn. All rights reserved.Updated 4 January 2001
http://www.windpower.dk/tour/index.htm

Read about Wind EnergyMore than 100 animated pagesand calculators on windresources, wind turbinetechnology, economics, andenvironmental aspects of windenergy in the Guided Toursection.
NEW Annual Report The Danish Wind Turbine ManufacturersAssociation Annual Report 2000-2001 is now available. Click here todownload.
Go Get It! You may download this web site (about 7 MB) in about 20minutes with a 56 kB modem, so that you can read it at your own pace,without worrying about phone bills or slow Internet connections.
Try our search engine page, or type your query here, and click
Seek:
Danish Wind Turbine Manufacturers Association - Vester Voldgade 106 - DK-1552 Copenhagen V, DenmarkPhone: +45 3373 0330 - Fax: +45 3373 0333 - E-Mail: [email protected]
| Home | Guided tour | FAQs | Quiz | Manufacturers | Articles | Statistics | Pictures|| News | Mailing List | Find | Links | About Us | Reference Manual | E-Mail | Map&Guide | Download |
The calculators and plotter programmes in this web site require a Netscape 4.x, or Internet Explorer 4.x, or later browser to work, but you may read the text and the examples in anycase. If you are using Navigator 3 or later or Internet Explorer 4 or later, and you see this message, you need to enable JavaScript. In Netscape, choose Options | Network Preferences,
choose the Languages tab, and click Enable JavaScript. Then click reload on your browser. In Internet Explorer, choose Edit | Preferences | Java, and enable Java, select the Microsoftvirtual machine, and enable the "Just in time compiler". Then click reload on your browser.
© Copyright 2001 Danish Wind Turbine Manufacturers Association and other copyright ownersUpdated 4 May 2001
http://www.windpower.org/core.htm
Keywords: wind energy, wind power, windpower, wind turbines, windmills, renewable energy, danish wind turbine manufacturers association, denmark, energie eolienne, énergieéolienne, bonus, nordtank, neg micon, vestas, nordex, enercon, tacke, hsw, nedwind, gamesa, ecotechnia, mitsubishi, lagerwey, weg, wind world, wincon, zond, enron, flowind, kvaerner,
lm glasfiber, vergnet, windenergy, windturbines, wind mills

Introduction to theGuided Tours on Wind Energy
If You Want to Know a LotThese guided tours are written for people who want to know a lot aboutwind energy, short of becoming wind engineers. They also answer most ofthe questions which students ask us - without going into difficult details ofmath and physics.
Even so, we also explore some of the challenging frontiers of wind energytechnology. We are mostly concerned with commercial, large, gridconnected turbines 100 kW and up.
If You Want to Know a LittleTake a look at the Frequently Asked Questions about wind energy and theWind Energy Pictures.
If You just Want a Wind TurbineYou do not have to be an expert on thermodynamics to start a car engine anddrive a car.
With a wind turbine it is even simpler: You don't have to buy fuel. It'sthere for free. If you want to know about the practical issues, like where doyou place it, and what does it cost, then look at the following pages:Frequently Asked QuestionsSelecting a Wind Turbine SiteWind Energy EconomicsWind Energy PicturesManufacturers
Offshore TourIf you already know a lot about wind energy, you may wish to getacquainted with the new territory of offshore wind energy. In that case,follow the signposts: to visit these eleven
pages:
Offshore Wind ConditionsOffshore Wind Power ResearchWind Turbine Offshore FoundationsOffshore Foundations: Traditional ConcreteOffshore Foundations: Gravitation + SteelOffshore Foundations: Mono PileOffshore Foundations: TripodGrid Connection of Offshore Wind ParksThe Economics of Offshore Wind EnergyBirds and Offshore Wind Turbines

Offshore Wind Turbine PicturesYou will return to this point after the Offshore Tour.
Other Tour ResourcesAfter the tour, you might like to test your skills answering the quiz on windenergy.
In case you want to see unit definitions and other hard information, youmay find it in the Reference Manual. In the Manual's Glossary page youmay find Danish, German, Spanish, and French translations of specialistterms used in this guided tour, and references to where they are explained.Please note that this web site also exists in Danish and German.
You may use the links below or on the top to navigate forward or back inthe guided tour. You will return to the table of contents at the end of eachone of the tours.
| Home | FAQs | Quiz | Manufacturers | Articles | Publications | Pictures | News | MailingList | Find | Links | About Us | Reference Manual | E-Mail | Map&Guide |
Animations may be stopped anytime using the stop button on your browser.These pages are designed for Netscape 4 or IE 4
© Copyright 2000 Soren Krohn. All rights reserved.Updated 29 August 2000
http://www.windpower.org/tour/intro/index.htm

Where does Wind Energy comeFrom?All renewable energy (except tidal and geothermal power), and even theenergy in fossil fuels, ultimately comes from the sun. The sun radiates100,000,000,000,000 kilowatt hours of energy to the earth per hour. In otherwords, the earth receives 10 to the 18th power of watts of power.
About 1 to 2 per cent of the energy coming from the sun is converted intowind energy. That is about 50 to 100 times more than the energy convertedinto biomass by all plants on earth.
Temperature Differences Drive Air CirculationThe regions around equator, at0° latitude are heated moreby the sun than the rest of theglobe. These hot areas areindicated in the warm colours,red, orange and yellow in thisinfrared picture of sea surfacetemperatures (taken from aNASA satellite, NOAA-7 inJuly 1984).
Hot air is lighter than cold air and will rise into the sky until it reachesapproximately 10 km (6 miles) altitude and will spread to the North and theSouth. If the globe did not rotate, the air would simply arrive at the NorthPole and the South Pole, sink down, and return to the equator.
| Back | Home | Forward |© Copyright 2000 Soren Krohn. All rights reserved.
Updated 6 August 2000http://www.windpower.org/tour/wres/index.htm

The Coriolis ForceSince the globe is rotating, any movement on the Northern hemisphere isdiverted to the right, if we look at it from our own position on the ground.(In the southern hemisphere it is bent to the left). This apparent bendingforce is known as the Coriolis force. (Named after the Frenchmathematician Gustave Gaspard Coriolis 1792-1843).
It may not be obvious to you that aparticle moving on the northernhemisphere will be bending towardsthe right.
Consider this red cone movingsouthward in the direction of the tipof the cone.
The earth is spinning, while wewatch the spectacle from a camerafixed in outer space. The cone ismoving straight towards the south.
Below, we show the same imagewith the camera locked on to theglobe.
Look at the same situation as seenfrom a point above the North Pole.We have fixed the camera, so that itrotates with the earth.
Watch closely, and you will noticethat the red cone is veering in a curvetowards the right as it moves. Thereason why it is not following thedirection in which the cone ispointing is, of course, that we asobservers are rotating along with theglobe.
Below, we show the sameimage,with the camera fixed in outerspace, while the earth rotates.

The Coriolis force is a visible phenomenon. Railroad tracks wear out fasteron one side than the other. River beds are dug deeper on one side than theother. (Which side depends on which hemisphere we are in: In the Northernhemisphere moving particles are bent towards the right).
In the Northern hemisphere the wind tends to rotate counterclockwise (asseen from above) as it approaches a low pressure area. In the Southernhemisphere the wind rotates clockwise around low pressure areas.
On the next page we shall see how the Coriolis force affects the winddirections on the globe.
| Back | Home | Forward |© Copyright 1998 Soren Krohn. All rights reserved.
Updated 6 August 2000http://www.windpower.org/tour/wres/coriolis.htm

Wind Energy Resources: GlobalWinds
How the Coriolis Force Affects Global Winds
The wind rises from the equator andmoves north and south in the higherlayers of the atmosphere.
Around 30° latitude in bothhemispheres the Coriolis force preventsthe air from moving much farther. At thislatitude there is a high pressure area, asthe air begins sinking down again.
As the wind rises from the equator therewill be a low pressure area close toground level attracting winds from the
North and South.At the Poles, there will be high pressure due to the cooling of the air.Keeping in mind the bending force of the Coriolis force, we thus have the
following general results for the prevailing wind direction:
Prevailing Wind Directions
Latitude 90-60°N 60-30°N 30-0°N 0-30°S 30-60°S 60-90°S
Direction NE SW NE SE NW SE
The size of the atmosphere is grossly exaggerated in the picture above(which was made on a photograph from the NASA GOES-8 satellite). Inreality the atmosphere is only 10 km thick, i.e. 1/1200 of the diameter of theglobe. That part of the atmosphere is more accurately known as thetroposphere. This is where all of our weather (and the greenhouse effect)occurs.
The prevailing wind directions are important when siting wind turbines,since we obviously want to place them in the areas with least obstacles fromthe prevailing wind directions. Local geography, however, may influence thegeneral results in the table above, cf. the following pages.
| Back | Home | Forward |© Copyright 2000 Soren Krohn. All rights reserved.
Updated 6 August 2000http://www.windpower.org/tour/wres/globwin.htm


The Geostrophic Wind
The Atmosphere (Troposphere)
The atmosphere around the globe is avery thin layer. The globe has adiameter of 12,000 km. Thetroposphere, which extends to about 11km (36,000 ft.) altitude, is where all ofour weather, and the greenhouse effectoccurs. On the picture you can see atstretch of islands 300 km (200 miles)across, and the approximate height ofthe troposphere. To look at it at adifferent scale: If the globe were a ballwith a diameter of 1.2 metres (4 ft.), theatmosphere would only be 1 mm (1/25")thick.
The Geostrophic WindThe winds we have been considering on the previous pages on global windsare actually the geostrophic winds. The geostrophic winds are largelydriven by temperature differences, and thus pressure differences, and are notvery much influenced by the surface of the earth. The geostrophic wind isfound at altitudes above 1000 metres (3300 ft.) above ground level.
The geostrophic wind speed may be measured using weather balloons.
Surface WindsWinds are very much influenced by the ground surface at altitudes up to 100metres. The wind will be slowed down by the earth's surface roughness andobstacles, as we will learn in a moment. Wind directions near the surfacewill be slightly different from the direction of the geostrophic wind becauseof the earth's rotation (cf. the Coriolis force).
When dealing with wind energy, we are concerned with surface winds, andhow to calculate the usable energy content of the wind.
| Back | Home | Forward |© Copyright 1999 Soren Krohn. All rights reserved.
Updated 6 August 2000http://www.windpower.org/tour/wres/geostro.htm

Local Winds: Sea BreezesAlthough global winds are important in determining the prevailing winds ina given area, local climatic conditions may wield an influence on the mostcommon wind directions.
Local winds are always superimposed upon the larger scale wind systems,i.e. the wind direction is influenced by the sum of global and local effects.When larger scale winds are light, local winds may dominate the windpatterns.
Sea BreezesLand masses are heated by the sunmore quickly than the sea in thedaytime. The air rises, flows outto the sea, and creates a lowpressure at ground level whichattracts the cool air from the sea.This is called a sea breeze. Atnightfall there is often a period ofcalm when land and seatemperatures are equal.
At night the wind blows in theopposite direction. The landbreeze at night generally haslower wind speeds, because thetemperature difference betweenland and sea is smaller at night.
The monsoon known from South-East Asia is in reality a large-scale formof the sea breeze and land breeze, varying in its direction between seasons,because land masses are heated or cooled more quickly than the sea.
| Back | Home | Forward |© Copyright 1998 Soren Krohn. All rights reserved.
Updated 9 September 2000http://www.windpower.org/tour/wres/localwin.htm

Local Winds: Mountain Winds
Mountain regions display many interesting weather patterns.One example is the valley wind which originates on south-facing slopes
(north-facing in the southern hemisphere). When the slopes and theneighbouring air are heated the density of the air decreases, and the airascends towards the top following the surface of the slope. At night the winddirection is reversed, and turns into a downslope wind.
If the valley floor is sloped, the air may move down or up the valley, as acanyon wind.
Winds flowing down the leeward sides of mountains can be quitepowerful: Examples are the Foehn in the Alps in Europe, the Chinook in theRocky Mountains, and the Zonda in the Andes.
Examples of other local wind systems are the Mistral flowing down theRhone valley into the Mediterranean Sea, the Scirocco, a southerly windfrom Sahara blowing into the Mediterranean sea.
| Back | Home | Forward |© Copyright 1998 Soren Krohn. All rights reserved.
Updated 6 August 2000http://www.windpower.org/tour/wres/mount.htm

The Energy in the Wind:Air Density and Rotor Area
A wind turbine obtains its power inputby converting the force of the wind intoa torque (turning force) acting on therotor blades. The amount of energywhich the wind transfers to the rotordepends on the density of the air, therotor area, and the wind speed.
The cartoon shows how a cylindricalslice of air 1 metre thick moves throughthe 1,500 m2 rotor of a typical 600kilowatt wind turbine.
With a 43 metre rotor diameter eachcylinder actually weighs 1.9 tonnes, i.e.1,500 times 1.25 kilogrammes.
Density of AirThe kinetic energy of a moving body isproportional to its mass (or weight). Thekinetic energy in the wind thus dependson the density of the air, i.e. its mass per
unit of volume.In other words, the "heavier" the air, the more energy is received by the
turbine.At normal atmospheric pressure and at 15° Celsius air weighs some 1.225
kilogrammes per cubic metre, but the density decreases slightly withincreasing humidity.
Also, the air is denser when it is cold than when it is warm. At highaltitudes, (in mountains) the air pressure is lower, and the air is less dense.
Rotor AreaA typical 600 kW wind turbine has a rotor diameter of 43-44 metres, i.e. arotor area of some 1,500 square metres. The rotor area determines how muchenergy a wind turbine is able to harvest from the wind.
Since the rotor area increases with the square of the rotor diameter, aturbine which is twice as large will receive 22 = 2 x 2 = four times as muchenergy. The page on the size of wind turbines gives you more details.
| Back | Home | Forward |© Copyright 1999 Soren Krohn. All rights reserved.
Updated 6 August 2000http://www.windpower.org/tour/wres/enerwind.htm


Wind Turbines Deflect the Wind
The image on the previous page on the energy in the wind is a bit simplified.In reality, a wind turbine will deflect the wind, even before the wind reachesthe rotor plane. This means that we will never be able to capture all of theenergy in the wind using a wind turbine. We will discuss this later, when weget to Betz' Law.
In the image above we have the wind coming from the right, and we use adevice to capture part of the kinetic energy in the wind. (In this case we usea three bladed rotor, but it could be some other mechanical device).
The Stream TubeThe wind turbine rotor must obviously slow down the wind as it captures itskinetic energy and converts it into rotational energy. This means that thewind will be moving more slowly to the left of the rotor than to the right ofthe rotor.
Since the amount of air entering through the swept rotor area from theright (every second) must be the same as the amount of air leaving the rotorarea to the left, the air will have to occupy a larger cross section (diameter)behind the rotor plane.
In the image above we have illustrated this by showing an imaginary tube,a so called stream tube around the wind turbine rotor. The stream tubeshows how the slow moving wind to the left in the picture will occupy alarge volume behind the rotor.
The wind will not be slowed down to its final speed immediately behindthe rotor plane. The slowdown will happen gradually behind the rotor, untilthe speed becomes almost constant.
The Air Pressure Distribution in Front of andBehind the Rotor

The graph to the left shows the airpressure plotted vertically, while thehorizontal axis indicates thedistance from the rotor plane. Thewind is coming from the right, andthe rotor is in the middle of the
graph.As the wind approaches the rotor from the right, the air pressure increases
gradually, since the rotor acts as a barrier to the wind. Note, that the airpressure will drop immediately behind the rotor plane (to the left). It thengradually increases to the normal air pressure level in the area.
What Happens Farther Downstream?If we move farther downstream the turbulence in the wind will cause theslow wind behind the rotor to mix with the faster moving wind from thesurrounding area. The wind shade behind the rotor will therefore graduallydiminish as we move away from the turbine. We will discus this further onthe page about the park effect.
Why not a Cylindrical Stream Tube?Now, you may object that a turbine would be rotating, even if we placed itwithin a normal, cylindrical tube, like the one below. Why do we insist thatthe stream tube is bottle-shaped?
Of course you would be right that the turbine rotor could turn if it wereplaced in a large glass tube like the one above, but let us consider whathappens:
The wind to the left of the rotor moves with a lower speed than the wind tothe right of the rotor. But at the same time we know that the volume of airentering the tube from the right each second must be the same as the volumeof air leaving the tube to the left. We can therefore deduce that if we havesome obstacle to the wind (in this case our rotor) within the tube, then someof the air coming from the right must be deflected from entering the tube(due to the high air pressure in the right ende of the tube).
So, the cylindrical tube is not an accurate picture of what happens to thewind when it meets a wind turbine. This picture at the top of the page is the

correct picture.
| Back | Home | Forward |© Copyright 1999 Danish Wind Turbine Manufacturers Association
Updated 6 August 2000http://www.windpower.org/tour/wres/tube.htm

The Power of the Wind:Cube of Wind SpeedThe wind speed is extremely important for the amount of energy a windturbine can convert to electricity: The energy content of the wind varies withthe cube (the third power) of the average wind speed, e.g. if the wind speedis twice as high it contains 23 = 2 x 2 x 2 = eight times as much energy.
Now, why does the energy in the wind vary with the third power of windspeed? Well, from everyday knowledge you may be aware that if youdouble the speed of a car, it takes four times as much energy to brake itdown to a standstill. (Essentially this is Newton's second law of motion).
In the case of the windturbine we use theenergy from braking thewind, and if we doublethe wind speed, we gettwice as many slices ofwind moving through therotor every second, andeach of those slicescontains four times asmuch energy, as welearned from theexample of braking acar.
The graph shows thatat a wind speed of 8metres per second we geta power (amount ofenergy per second) of314 Watts per squaremetre exposed to thewind (the wind iscoming from a directionperpendicular to the swept rotor area).
At 16 m/s we get eight times as much power, i.e. 2509 W/m2. The table inthe Reference Manual section gives you the power per square metre exposedto the wind for different wind speeds.

| Back | Home | Forward |© Copyright 2000 Soren Krohn. All rights reserved.
Updated 6 August 2000http://www.windpower.org/tour/wres/enrspeed.htm
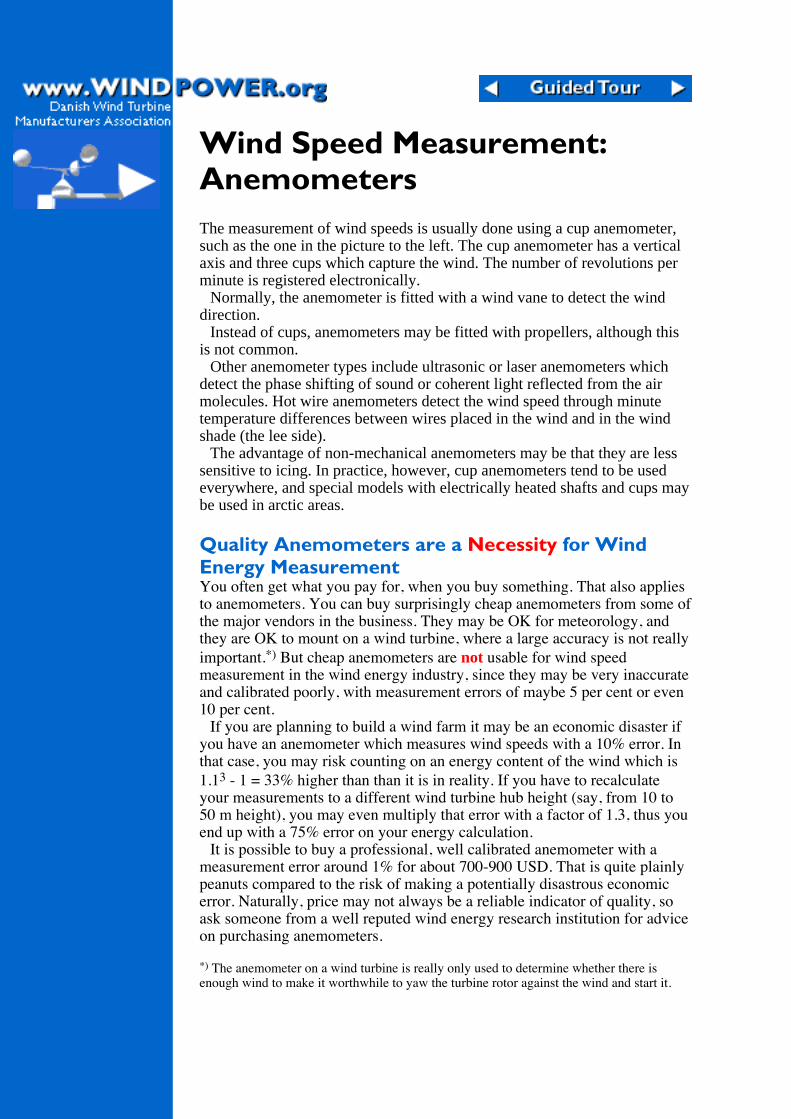
Wind Speed Measurement:AnemometersThe measurement of wind speeds is usually done using a cup anemometer,such as the one in the picture to the left. The cup anemometer has a verticalaxis and three cups which capture the wind. The number of revolutions perminute is registered electronically.
Normally, the anemometer is fitted with a wind vane to detect the winddirection.
Instead of cups, anemometers may be fitted with propellers, although thisis not common.
Other anemometer types include ultrasonic or laser anemometers whichdetect the phase shifting of sound or coherent light reflected from the airmolecules. Hot wire anemometers detect the wind speed through minutetemperature differences between wires placed in the wind and in the windshade (the lee side).
The advantage of non-mechanical anemometers may be that they are lesssensitive to icing. In practice, however, cup anemometers tend to be usedeverywhere, and special models with electrically heated shafts and cups maybe used in arctic areas.
Quality Anemometers are a Necessity for WindEnergy MeasurementYou often get what you pay for, when you buy something. That also appliesto anemometers. You can buy surprisingly cheap anemometers from some ofthe major vendors in the business. They may be OK for meteorology, andthey are OK to mount on a wind turbine, where a large accuracy is not reallyimportant.*) But cheap anemometers are not usable for wind speedmeasurement in the wind energy industry, since they may be very inaccurateand calibrated poorly, with measurement errors of maybe 5 per cent or even10 per cent.
If you are planning to build a wind farm it may be an economic disaster ifyou have an anemometer which measures wind speeds with a 10% error. Inthat case, you may risk counting on an energy content of the wind which is1.13 - 1 = 33% higher than than it is in reality. If you have to recalculateyour measurements to a different wind turbine hub height (say, from 10 to50 m height), you may even multiply that error with a factor of 1.3, thus youend up with a 75% error on your energy calculation.
It is possible to buy a professional, well calibrated anemometer with ameasurement error around 1% for about 700-900 USD. That is quite plainlypeanuts compared to the risk of making a potentially disastrous economicerror. Naturally, price may not always be a reliable indicator of quality, soask someone from a well reputed wind energy research institution for adviceon purchasing anemometers.
*) The anemometer on a wind turbine is really only used to determine whether there isenough wind to make it worthwhile to yaw the turbine rotor against the wind and start it.

| Back | Home | Forward |© Copyright 2000 Soren Krohn. All rights reserved.
Updated 6 August 2000http://www.windpower.org/tour/wres/wndspeed.htm

Wind Speed Measurement inPracticeThe best way of measuring wind speeds at aprospective wind turbine site is to fit ananemometer to the top of a mast which hasthe same height as the expected hub heightof the wind turbine to be used. This wayone avoids the uncertainty involved inrecalculating the wind speeds to a differentheight.
By fitting the anemometer to the top ofthe mast one minimises the disturbances ofairflows from the mast itself. Ifanemometers are placed on the side of themast it is essential to place them in theprevailing wind direction in order tominimise the wind shade from the tower.
Which Tower?Guyed, thin cylindrical poles are normallypreferred over lattice towers for fitting windmeasurement devices in order to limit thewind shade from the tower.
The poles come as kits which are easilyassembled, and you can install such a mastfor wind measurements at (future) turbinehub height without a crane.
Anemometer, pole and data logger(mentioned below) will usually costsomewhere around 5,000 USD.
Data LoggingThe data on both wind speeds and wind directions from the anemometer(s)are collected on electronic chips on a small computer, a data logger, whichmay be battery operated for a long period.
An example of such a data logger is shown to the left. Once a month or soyou may need to go to the logger to collect the chips and replace them withblank chips for the next month's data. (Be warned: The most commonmistake by people doing wind measurements is to mix up the chips andbring the blank ones back!)
Arctic ConditionsIf there is much freezing rain in the area, or frost from clouds in mountains,you may need a heated anemometer, which requires an electrical gridconnection to run the heater.

NRG data loggerPhotograph © 1998by Soren Krohn
10 Minute AveragesWind speeds are usually measured as 10 minute averages, in order to becompatible with most standard software (and literature on the subject). Theresult for wind speeds are different, if you use different periods foraveraging, as we'll see later.
| Back | Home | Forward |© Copyright 1998 Soren Krohn. All rights reserved.
Updated 6 August 2000http://www.windpower.org/tour/wres/wndsprac.htm

Wind rose from Brest,France, taken from the
European Wind Atlas, RisøNational Laboratory,
Denmark.
The Wind RoseYou will notice that strong windsusually come from a particulardirection, as discussed in the WindEnergy Resource section.
To show the information about thedistributions of wind speeds, and thefrequency of the varying winddirections, one may draw a so-calledwind rose on the basis ofmeteorological observations of windspeeds and wind directions.
The picture shows the wind rose forBrest, on the Atlantic coast of France.
We have divided the compass into 12 sectors, one for each 30 degrees ofthe horizon. (A wind rose may also be drawn for 8 or 16 sectors, but 12sectors tend to be the standard set by the European Wind Atlas, from whichthis image was taken).
The radius of the 12 outermost, wide wedges gives the relative frequencyof each of the 12 wind directions, i.e. how many per cent of the time is thewind blowing from that direction.
The second wedge gives the same information, but multiplied by theaverage wind speed in each particular direction. The result is thennormalised to add up to 100 per cent. This tells you how much each sectorcontributes to the average wind speed at our particular location.
The innermost (red) wedge gives the same information as the first, butmultiplied by the cube of the wind speed in each particular location. Theresult is then normalised to add up to 100 per cent. This tells you how mucheach sector contributes to the energy content of the wind at our particularlocation.
Remember, that the energy content of the wind varies with the cube of thewind speed, as we discussed in the page on The Energy in the Wind. So thered wedges are really the most interesting ones. They tell us where to findthe most power to drive our wind turbines.
In this case we can see that the prevailing wind direction is Southwest, justas we would have predicted from the page on Global Winds.
A wind rose gives you information on the relative wind speeds in differentdirections, i.e.each of the three sets of data (frequency, mean wind speed,and mean cube of wind speed) has been multiplied by a number whichensures that the largest wedge in the set exactly matches the radius of theoutermost circle in the diagram.
Wind Roses Vary

Wind roses vary from one location tothe next. They actually are a form ofmeteorological fingerprint.
As an example, take a look at thiswind rose from Caen, France, onlyabout 150 km (100 miles) North ofBrest. Although the primary winddirection is the same, Southwest, youwill notice that practically all of thewind energy comes from West andSouthwest, so on this site we need notconcern ourselves very much aboutother wind directions.
Wind roses from neighbouring areasare often fairly similar, so in practice it may sometimes be safe to interpolate(take an average) of the wind roses from surrounding observations. If youhave complex terrain, i.e. mountains and valleys running in differentdirections, or coastlines facing in different directions, it is generally not safeto make simple assumptions like these.
The wind rose, once again, only tells you the relative distribution of winddirections, not the actual level of the mean wind speed.
How to Use the Wind RoseA look at the wind rose is extremely useful for siting wind turbines. If alarge share of the energy in the wind comes from a particular direction, thenyou will want to have as few obstacles as possible, and as smooth a terrainas possible in that direction, when you place wind turbines in the landscape.
In these examples most of the energy comes from the Southwest. Wetherefore need not be very concerned about obstacles to the East orSoutheast of wind turbines, since practically no wind energy would comefrom those directions.
You should note, however, that wind patterns may vary from year to year,and the energy content may vary (typically by some ten per cent) from yearto year, so it is best to have observations from several years to make acredible average. Planners of large wind parks will usually rely on one yearof local measurements, and then use long-term meteorological observationsfrom nearby weather stations to adjust their measurements to obtain areliable long term average.
Since this wind rose comes from the European Wind Atlas we arereasonably confident that we can rely on it. The European Wind Atlascontains a description of each of the measurement stations, so we may bewarned about possible local disturbances to the airflow. On the page onselecting a wind turbine site, we return to the pitfalls in using meteorologydata.
| Back | Home | Forward |© Copyright 2000 Soren Krohn. All rights reserved.
Updated 6 August 2000http://www.windpower.org/tour/wres/rose.htm

Windfrequency
Meanwindspeed
Wind Rose PlotterProgrammePlot your own wind rose
This calculator requires a Netscape 4 or IE 4 or later browser to work. If youare using Navigator 4 or later or Internet Explorer 4 or later, and you see thismessage, you need to enable JavaScript. In Netscape, choose Options |Network Preferences, choose the Languages tab, and click Enable JavaScript.Then click reload on your browser. In Internet Explorer, choose Edit |Preferences | Java, and enable Java, select the Microsoft virtual machine, andenable the "Just in time compiler". Then click reload on your browser. Do notoperate the form until this page and its programme have loaded completely.
The explanation of the wind rose may be found on the previous page. TheWind Frequency is the percentage of the time the wind is coming from aparticular direction. The first row in the table to the left corresponds toNorth (the top wedge). The subsequent rows correspond to the sectors ofthe wind rose in a clockwise direction.
Use Sectors. Fill wedges. to Copenhagen data.
Show wind frequency.
Show wind speed.
Show wind energy.
For each of the sectorsthe outermost (blue)wedges show the windfrequency distribution.
The middle (black)wedges show thedistribution of theproduct of the twocolumns, i.e. the windspeeds times theirfrequency.
The innermost (red)wedges show thedistribution of the windspeeds cubed (i.e. theenergies) multiplied bytheir frequencies.
| Back | Home | Forward |© Copyright 1999 Soren Krohn. All rights reserved.
Updated 9 September 2000http://www.windpower.org/tour/wres/roseplot.htm

Roughness and Wind Shear High above ground level, at a height of about 1 kilometre, the wind is hardlyinfluenced by the surface of the earth at all. In the lower layers of theatmosphere, however, wind speeds are affected by the friction against thesurface of the earth. In the wind industry one distinguishes between theroughness of the terrain, the influence from obstacles, and the influencefrom the terrain contours, which is also called the orography of the area.We shall be dealing with orography, when we investigate so called speed upeffects, i.e. tunnel effects and hill effects, later.
RoughnessIn general, the more pronounced the roughness of the earth's surface, themore the wind will be slowed down.
Forests and large cities obviously slow the wind down considerably, whileconcrete runways in airports will only slow the wind down a little. Watersurfaces are even smoother than concrete runways, and will have even lessinfluence on the wind, while long grass and shrubs and bushes will slow thewind down considerably.
Roughness Classes and Roughness LengthsIn the wind industry, people usually referto roughness classes or roughnesslengths, when they evaluate windconditions in a landscape. A highroughness class of 3 to 4 refers tolandscapes with many trees andbuildings, while a sea surface is inroughness class 0.
Concrete runways in airports are inroughness class 0.5. The same applies tothe flat, open landscape to the left whichhas been grazed by sheep.
The proper definition of roughnessclasses and roughness lengths may befound in the Reference Manual. The term
roughness length is really the distance above ground level where the windspeed theoretically should be zero.

Sheep are a wind turbine'sbest friend. In this picture
from Akaroa Spit, NewZealand, the sheep keep theroughness of the landscape
down through their grazing.Photograph © 1998
Soren Krohn
Wind Shear
This graph was plotted with the wind speed calculator on the next page. Itshows you how wind speeds vary in roughness class 2 (agricultural landwith some houses and sheltering hedgerows with some 500 m intervals), ifwe assume that the wind is blowing at 10 m/s at a height of 100 metres.
The fact that the wind profile is twisted towards a lower speed as we movecloser to ground level, is usually called wind shear. Wind shear may also beimportant when designing wind turbines. If you consider a wind turbine witha hub height of 40 metres and a rotor diameter of 40 metres, you will noticethat the wind is blowing at 9.3 m/s when the tip of the blade is in itsuppermost position, and only 7.7 m/s when the tip is in the bottom position.This means that the forces acting on the rotor blade when it is in its topposition are far larger than when it is in its bottom position.
| Back | Home | Forward |© Copyright 1999 Soren Krohn. All rights reserved.
Updated 6 August 2000http://www.windpower.org/tour/wres/shear.htm

Wind Speed CalculatorThis calculator requires a Netscape 3, IE 4, or later browser to work, but you may read the text and theexamples in any case. If you are using Navigator 3, IE 4, or later and you see this message, you need to enableJavaScript. Choose Options | Network Preferences, choose the Languages tab, and click Enable JavaScript.Then click reload on your browser. Do not operate the form until this page and its programme have loadedcompletely.
Enter your wind speed measurement in any column at the appropriate height, e.g. 10 metres. Then clickoutside the field, click Submit, or use the tab key. The programme will then calculate wind speeds for otherheights. You may plot your results in a separate window by clicking on Plot in the appropriate column. (If theplot window disappears, it is probably hidden behind this window).
Roughness- class
- length m0.0
0.00020.5
0.00241.0
0.031.5
0.0552.00.1
3.00.4
4.01.6
100 m
90 m
80 m
70 m
60 m
50 m
40 m
30 m
20 m
10 m
Plot Plot Plot Plot Plot Plot Plot
Average wind speeds are often available frommeteorological observations measured at a heightof 10 metres. Hub heights of modern 600 to 1,500kW wind turbines are usually 40 to 80 metres,however. The spreadsheet will calculate averagewind speeds at different heights and roughnessclasses. Just enter a wind speed measured at acertain height for a given roughness class and clickthe Submit button.
Please note, that the results are not strictly valid ifthere are obstacles close to the wind turbine (or thepoint of meteorological measurement) at or abovethe specified hub height. ["close" means anythingup to one kilometre]. Take a look at the examplebelow the table to make sure you understand how itworks, before you start entering your data. Moreaccurate and extensive roughness definitions maybe found in the units section.
An Example

As an example, have a look at the spreadsheetabove. We have already entered 10 m/s at 100metre height. You will notice that the wind speeddeclines as you approach ground level. You willalso notice that it declines more rapidly in roughterrain.
Remember, that the energy content of the windvaries with the third power of the wind speed. Ifyou look at the column with roughness class 2, youwill see that wind speeds declines 10 per cent goingfrom 100 metres to 50 metres. But the power of thewind declines to 0.93 = 0.73, i.e. by 27 per cent.(From 613 to 447 W/m2).
If you compare the wind speeds below 100 m inroughness class 2 with roughness class 1,
you will notice that for a given height the windspeeds are lower everywhere in roughness class 2.
If you have a wind turbine in roughness class 2,you may consider whether it is worthwhile to invest15,000 USD extra to get a 60 metre tower insteadof a 50 metre tower. In the table you can see that itwill give you 2.9 per cent more wind, and you cancalculate, that it will give you 9 per cent more windenergy.
You can solve this problem once you havelearned how the turbine electricity productionvaries with the available wind energy. We willreturn to that question when you have learned touse the power density calculator and the windenergy economics calculator.
Now, try the calculator for yourself.
| Back | Home | Forward |© Copyright 2000 Soren Krohn. All rights reserved.
Updated 9 September 2000http://www.windpower.org/tour/wres/calculat.htm

Aerial photograph© 1999 Soren Krohn
Wind Shear and Escarpments
Do not Include the Altitude of Your Terrain in WindShear CalculationsThe aerial photograph above shows a good site for wind turbines along ashoreline with the turbines standing on a cliff which is about 10 m (30 ft.)tall. It is a common mistake to believe that in this case one may add theheight of the cliff to the height of the wind turbine tower to obtain theeffective height of the wind turbine, when one is doing wind speedcalculations, at least when the wind is coming from the sea.
This is patently wrong. The cliff in the front of the picture will createturbulence, and brake the wind even before it reaches the cliff. It is thereforenot a good idea to move the turbines closer to the cliff. That would mostlikely lower energy output, and cause a lower lifetime for the turbines, dueto more tear and wear from the turbulence.
If we had the choice, we would much rather have a nicely rounded hill inthe direction facing the sea, rather than the escarpment you see in thepicture. In case of a rounded hill, we might even experience a speed upeffect, as we explain later when we get to the page on the hill effect.
| Back | Home | Forward |© Copyright 1999 Soren Krohn
Updated 6 August 2000http://www.windpower.org/tour/wres/escarp.htm


The Roughness RoseIf we have measured the wind speed exactly at hub height over a long periodat the exact spot where a wind turbine will be standing we can make veryexact predictions of energy production. Usually, however, we have torecalculate wind measurements made somewhere else in the area. Inpractice, that can be done with great accuracy, except in cases with verycomplex terrain (i.e. very hilly, uneven terrain).
Just like we use a wind rose to map the amount of wind energy comingfrom different directions, we use a roughness rose to describe the roughnessof the terrain in different directions from a prospective wind turbine site.
Normally, the compass is divided into 12 sectors of 30 degrees each, likein the picture to the left, but other divisions are possible. In any case, theyshould match our wind rose, of course.
For each sector we make an estimate of the roughness of the terrain, usingthe definitions from the Reference Manual section. In principle, we couldthen use the wind speed calculator on the previous page to estimate for eachsector how the average wind speed is changed by the different roughness ofthe terrain.
Averaging Roughness in Each SectorIn most cases, however, the roughness will not fall neatly into any of theroughness classes, so we'll have to do a bit of averaging. We have to be veryconcerned with the roughness in the prevailing wind directions. In thosedirections we look at a map to measure how far away we have unchangedroughness.
Accounting for Roughness Changes Within EachSector

Let us imagine that we have a sea orlake surface in the western sector (i.e.roughness class 0) some 400 m fromthe turbine site, and 2 kilometresaway we have a forested island. Ifwest is an important wind direction,we will definitely have to account for the change in roughness class from 1to 0 to 3.
This requires more advanced models and software than what we haveshown on this web site. It is also useful to be able to use the software tomanage all our wind and turbine data, so at a future update of this site we'llexplain how professional wind calculation software works.
Meanwhile, you may look at the Links page to find the link to Risoe's WAsP model andEnergy & Environmental Data's WindPro Windows-based software.
Accounting for Wind ObstaclesIt is extremely important to account for local wind obstacles in theprevailing wind direction near the turbine (closer than 700 m or so), if onewants to make accurate predictions about energy output. We return to thatsubject after a couple of pages.
| Back | Home | Forward |© Copyright 2000 Soren Krohn. All rights reserved.
Updated 9 September 2000http://www.windpower.org/tour/wres/rrose.htm

Wind Speed Variability
Short Term Variability of the WindThe wind speed is alwaysfluctuating, and thus theenergy content of the wind isalways changing.
Exactly how large thevariation is depends both onthe weather and on localsurface conditions andobstacles.
Energy output from a windturbine will vary as the windvaries, although the most rapidvariations will to some extentbe compensated for by theinertia of the wind turbinerotor.
Diurnal (Night and Day) Variations of the Wind
In most locations around the globeit is more windy during thedaytime than at night. The graph tothe left shows how the wind speedat Beldringe, Denmark varies by 3hour intervals round the clock.(Information from the EuropeanWind Atlas).
This variation is largely due tothe fact that temperaturedifferences e.g. between the sea
surface and the land surface tend to be larger during the day than at night.The wind is also more turbulent and tends to change direction morefrequently during the day than at night.
From the point of view of wind turbine owners, it is an advantage thatmost of the wind energy is produced during the daytime, since electricityconsumption is higher than at night. Many power companies pay more forthe electricity produced during the peak load hours of the day (when there isa shortage of cheap generating capacity). We will return to this subject in thesection on Wind Turbines in the Electrical grid.
Seasonal Variations of the WindWe treat this subject in the section on Wind Turbines in the Electrical grid.

| Back | Home | Forward |© Copyright 1999 Soren Krohn. All rights reserved.
Updated 6 August 2000http://www.windpower.org/tour/wres/variab.htm

TurbulenceYou have probablyexperienced how hailstorms orthunderstorms in particular,are associated with frequentgusts of wind which bothchange speed and direction.
In areas with a very uneventerrain surface, and behindobstacles such as buildingsthere is similarly created a lotof turbulence, with veryirregular wind flows, often inwhirls or vortexes in theneighbourhood.
You can see an example ofhow turbulence increases thefluctuations in the wind speedin the image, which you maycompare with the image on the previous page.
Turbulence decreases the possibility of using the energy in the windeffectively for a wind turbine. It also imposes more tear and wear on thewind turbine, as explained in the section on fatigue loads. Towers for windturbines are usually made tall enough to avoid turbulence from the windclose to ground level.
| Back | Home | Forward |© Copyright 1999 Soren Krohn. All rights reserved.
Updated 6 August 2000http://www.windpower.org/tour/wres/turb.htm

Wind Obstacles
This movie was shot at a coastal wind site with the wind coming from theright side of the picture. It shows an interesting phenomenon:
We would really expect the wind turbine to the right (which is facing thewind directly) to be the one to start first when the wind starts blowing. Butyou can see, that the wind turbine to the right will not start at the low windspeeds which are sufficient to drive the other two wind turbines. The reasonis the small wood in front of the wind turbines which shelters the rightmostturbine in particular. In this case, the annual production of these windturbines is probably reduced by some 15 per cent on average, and even morein case of the rightmost turbine.
(The turbines are located some five rotor diameters apart, and the wood islocated at a similar distance from the first wind turbine. The reason why theturbines look like they are standing very close together, is that the moviewas shot from about a mile away with the equivalent of a 1200 mm lens fora 35 mm camera).
Side view of wind flowaround an obstacle.
Note the pronouncedturbulent airflow
downstream
Obstacles to the wind such as buildings, trees, rock formations etc. candecrease wind speeds significantly, and they often create turbulence in theirneighbourhood.
As you can see from this drawing of typical wind flows around anobstacle, the turbulent zone may extend to some three time the height of the

obstacle. The turbulence is more pronounced behind the obstacle than infront of it.
Therefore, it is best to avoid major obstacles close to wind turbines,particularly if they are upwind in the prevailing wind direction, i.e. "in frontof" the turbine.
Top view of wind flowaround an obstacle.
Shelter Behind ObstaclesObstacles will decrease the wind speed downstream from the obstacle. Thedecrease in wind speed depends on the porosity of the obstacle, i.e. how"open" the obstacle is. (Porosity is defined as the open area divided by thetotal area of the object facing the wind).
A building is obviously solid, and has no porosity, whereas a fairly opentree in winter (with no leaves) may let more than half of the wind through. Insummer, however, the foliage may be very dense, so as to make the porosityless than, say one third.
The slowdown effect on the wind from an obstacle increases with theheight and length of the obstacle. The effect is obviously more pronouncedclose to the obstacle, and close to the ground.
When manufacturers or developers calculate the energy production forwind turbines, they always take obstacles into account if they are close to theturbine - say, less than 1 kilometre away in one of the more important winddirections.
| Back | Home | Forward |© Copyright 1999 Soren Krohn. All rights reserved.
Updated 23 January 2001http://www.windpower.org/tour/wres/obst.htm

Wind Shade
This graph gives you an estimate of how wind speeds decrease behind ablunt obstacle, i.e. an obstacle which is not nicely streamlined. In this casewe use a seven story office building, 20 metres tall and 60 metres wideplaced at a distance of 300 m from a wind turbine with a 50 m hub height.You can quite literally see the wind shade as different shades of grey. Theblue numbers indicate the wind speed in per cent of the wind speed withoutthe obstacle.
At the top of the yellow wind turbine tower the wind speed has decreasedby some 3 per cent to 97 per cent of the speed without the obstacle. Youshould note that this means a loss of wind energy of some 10 per cent, i.e.1.033 - 1, as you may see in the graph at the bottom of this page.
If you have a reasonably fast computer (or a bit of patience with a slowerone) you can plot tables and graphs like this one using the wind shadecalculator in a couple of pages.

| Back | Home | Forward |© Copyright 2000 Soren Krohn. All rights reserved.
Updated 9 September 2000http://www.windpower.org/tour/wres/shade.htm

Guide to the Wind ShadeCalculatorEven if you do not have a Netscape 3 or Internet Explorer 4 browser, this page will giveyou a lot of useful knowledge on how obstacles affect the energy in the wind.
The calculator will quickly give you the result at hub height at the distancefrom the obstacle you specify. If you use the plot facility, your computerwill also calculate 620 different measurement points at different heights anddistances from your obstacle.
Turbine Hub HeightThe higher you are above the top of the obstacle, the less wind shade. Thewind shade, however, may extend to up to five times the height of theobstacle at a certain distance.
If the obstacle is taller than half the hub height, the results are moreuncertain, because the detailed geometry of the obstacle, (e.g. differingslopes of the roof on buildings) will affect the result. In that case theprogramme will put a warning in the text box below the results.
Distance Between Obstacle and TurbineThe distance between the obstacle and the turbine is very important for theshelter effect. In general, the shelter effect will decrease as you move awayfrom the obstacle, just like a smoke plume becomes diluted as you moveaway from a smokestack. In terrain with very low roughness (e.g. watersurfaces) the effect of obstacles (e.g. an island) may be measurable up to 20km away from the obstacle.
If the turbine is closer to the obstacle than five times the obstacle height,the results will be more uncertain, because they will depend on the exactgeometry of the obstacle. In that case the programme will put a warning inthe text box below the results.
Roughness Length or Roughness ClassThe roughness of the terrain between the obstacle and the wind turbine hasan important influence on how much the shelter effect is felt. Terrain withlow roughness will allow the wind passing outside the obstacle to mix moreeasily in the wake behind the obstacle, so that it makes the wind shaderelatively less important.
It may be a bit confusing at first, that we both deal with the roughness ofthe terrain, and with individual obstacles. A good rule of thumb is that wedeal with individual obstacles which are closer than about 1000 metres fromthe wind turbine in the prevailing wind directions. The rest we deal with aschanges in roughness classes.
Obstacle HeightThe taller the obstacle, the larger the wind shade.
As we have mentioned above, if the turbine is closer to the obstacle than

five times the obstacle height, or if the obstacle is taller than half the hubheight, the results will be more uncertain, because they will depend on theexact geometry of the obstacle. In that case the programme will put awarning in the text box below the results.
Obstacle WidthThe obstacle calculation model works on the basis of the assumption thatobstacles are infinitely long, and that they are placed at a right angle(perpendicular) to the wind direction.
A very narrow object will of course cast a far smaller wind shade than alarge one. For practical reasons we assume that we investigate the horizonaround the wind turbine in twelve 30 degree sections.
At the bottom of the drawing on the right side of the wind shade calculatorwe illustrate (in 10 per cent steps) how much space the obstacle take up insuch a 30 degree section. You may adjust the width of the obstacle in 10 percent steps by clicking on the squares at the bottom of the graph.
You may also type the exact length of the obstacle (as seen from the windturbine) directly, or you may enter the percentage of the sector width that theobject fills up.
Porosity = 0% = 30% = 50% = 70%
A tree without leaves will brake the wind far less than a building. Trees withdense foliage will have a braking effect somewhere in between. In general,the wind shade will be proportional to (one minus the porosity of theobstacle).
The porosity of an obstacle is a percentage indication of how open anobstacle is, i.e. how easily the wind can pass through it. A buildingobviously has a zero porosity. A group of buildings with some spacebetween them with have a porosity equal to (the area of the open space)divided by (the total area of both buildings and the open space in between,as seen from the wind turbine).
You may either specify the porosity directly in the calculator, click on oneof the buttons with the symbols shown above, or use the pop up menu forsuggested settings for different objects.
Control ButtonsSubmit calculates your latest input. You may use the tab key or just clickoutside the field you change instead.
Plot Wind Speed gives you a graph and a table of the percentage of theremaining wind speed at a number of heights and distances up to 1.5 timesthe height and distance of your wind turbine hub. The turbine tower isshown in yellow. The calculations are quite complex, so be patient if yourcomputer is slow.
Plot Wind Energy gives you a graph and a table of the percentage of theremaining wind energy at a number of heights and distances up to 1.5 timesthe height and distance of your wind turbine hub. The turbine tower isshown in yellow. The calculations are quite complex, so be patient if yourcomputer is slow.
Plot Speed Profile gives you a plot of the wind speed profile at differentheights up to 100 m at the distance where you have placed your turbine. Youcan see directly on the red curve how the obstacle makes the wind speed

drop. You can enter any wind speed you like for the hub height. (The shapeof the curve remains the same, which is should, since obstacles cause arelative change in wind speed). The curve corresponds to the curves drawnby the wind speed calculator.
ResultsThe result line in the calculator tells you how many per cent the wind speedwill decline due to the presence of the obstacle. You may plot the change inwind speeds for a number of distances and heights up to 1.5 times yourpresent distance and height by clicking the Plot Wind Speed button.
(If you are working with a specific Weibull distribution describing the wind in thisparticular sector, the change in wind speed corresponds to a change in the scale factor A. Ifyou use the results of these calculations to find a Weibull distribution, you can just adjustthe scale factor, A, with this change. The shape factor, k, remains unchanged. You will getto the Weibull distribution later in this Guided Tour, when we explore how to compute theenergy output from a wind turbine).
The result line also tells you the loss of wind energy due to the presence ofthe obstacle. You may plot the change in wind energy for a number ofdistances and heights up to 1.5 times your present distance and height byclicking the Plot Wind Speed button.
More Complex Obstacle CalculationsObstacles may not be perpendicular to the centreline in the sector, and theremay be several rows of obstacles. Although you can still use the basicmethods in the calculator, you would probably want to use a professionalwind assessment programme such as WindPro® or WAsP® to manage yourdata in such cases.
The methods used in the wind calculator are based on the European Wind Atlas. If youread chapter 8, however, you should note that there is a misprint in formula 8.25.
| Back | Home | Forward |© Copyright 1998 Soren Krohn. All rights reserved.
Updated 12 August 2000http://www.windpower.org/tour/wres/shelter/guides.htm

Wind Shade CalculatorThis calculator requires a Netscape 3.01 or IE 4 or later browser to work. If you are using Navigator 3.01or later or Internet Explorer 4 or later, and you see this message, you need to enable JavaScript. InNetscape, choose Options | Network Preferences, choose the Languages tab, and click Enable JavaScript.Then click reload on your browser. In Internet Explorer, choose Edit | Preferences | Java, and enable Java,select the Microsoft virtual machine, and enable the "Just in time compiler". Then click reload on yourbrowser.Do not operate the form until this page and its programme have loaded completely. If you aretoo fast, the programme will complain about missing data, and you will have to click reload.
This calculator shows the shelter effect (wind shade) of blunt obstacles (buildings, trees) in any 30degree sector near a wind turbine. You can change any number, except the results which are labelled with*. If the obstacle is too tall (more than half the hub height of your turbine) - or too close (less than fivetimes the height of the obstacle) the programme will warn you that the results are uncertain, because thedetailed geometry of the obstacle and the angle of the wind will have an important influence on theresulting effect.
Please note that you only have to consider the percentage of wind energy coming from this direction cf.the wind rose, because the obstacle obviously only affects your turbine's energy output when the wind iscoming from this particular direction.
If you have a fast computer or some patience you may plot the wind speed or wind energy profile behindthe obstacle. (If the plot window disappears, it is probably hidden behind another window).
You should have read about obstacles, roughness and porosity before using the calculator.
Turbine hub height m
Click in grey squares to insert or remove obstacles
Energy in per cent of undisturbed airflow
70 75 80 85 90 95 100
Select obstacle porosity:
Distance between obstacle and turbine
m
Roughness length m
= roughness class
Obstacle height m
Obstacle width m
= % of sector width
Porosity
%
for m/s hub height windspeed

0%= 30%= 50%= 70%=Result: % wind speeddecrease*
= % energy loss in this sector*
*
| Back | Home | Forward |© Copyright 1998 Soren Krohn. All rights reserved.
Updated 6 August 2000http://www.windpower.org/tour/wres/shelter/index.htm

Wake Effect
Wake effect from windturbine
Picture © Risø NationalLaboratory, Denmark
Since a wind turbine generateselectricity from the energy inthe wind, the wind leaving theturbine must have a lowerenergy content than the windarriving in front of the turbine.This follows directly from thefact that energy can neither becreated nor consumed. If thissounds confusing, take a lookat the definition of energy inthe Reference Manual.
A wind turbine will alwayscast a wind shade in thedownwind direction.
In fact, there will be a wakebehind the turbine, i.e. a longtrail of wind which is quite
turbulent and slowed down, when compared to the wind arriving in front ofthe turbine. (The expression wake is obviously derived from the wakebehind a ship).
You can actually see the wake trailing behind a wind turbine, if you addsmoke to the air passing through the turbine, as was done in the picture.(This particular turbine was designed to rotate in a counterclockwisedirection which is somewhat unusual for modern wind turbines).
Wind turbines in parks are usually spaced at least three rotor diametersfrom one another in order to avoid too much turbulence around the turbinesdownstream. In the prevailing wind direction turbines are usually spacedeven farther apart, as explained on the next page.
| Back | Home | Forward |© Copyright 1998 Soren Krohn. All rights reserved.
Updated 6 August 2000http://www.windpower.org/tour/wres/wake.htm

Park EffectAs we saw in the previous section on the wake effect, each wind turbine willslow down the wind behind it as it pulls energy out of the wind and convertsit to electricity.
Ideally, we would therefore like to space turbines as far apart as possible inthe prevailing wind direction. On the other hand, land use and the cost ofconnecting wind turbines to the electrical grid would tell us to space themcloser together.
Park LayoutAs a rule of thumb,turbines in windparks are usuallyspaced somewherebetween 5 and 9 rotordiameters apart in theprevailing winddirection, andbetween 3 and 5diameters apart in thedirectionperpendicular to theprevailing winds.
In this picture wehave placed threerows of five turbineseach in a fairlytypical pattern.
The turbines (thewhite dots) areplaced 7 diametersapart in the prevailing wind direction, and 4 diameters apart in the directionperpendicular to the prevailing winds.
Energy Loss from the Park EffectWith knowledge of thewind turbine rotor, the wind rose, the Weibulldistribution and the roughness in the different directions manufacturers ordevelopers can calculate the energy loss due to wind turbines shading oneanother.
Typically, the energy loss will be somewhere around 5 per cent.
| Back | Home | Forward |© Copyright 2000 Soren Krohn. All rights reserved.
Updated 6 August 2000http://www.windpower.org/tour/wres/park.htm


Speed Up Effects: Tunnel Effect
If you push an ordinary bicycle air pump, (just point to the image with aNetscape 3 or 4 Browser, do not click) you will notice that the air leavingthe nozzle moves much faster than the speed with which you are pushing.The reason, of course, is that the nozzle is much narrower than the cylinderin the pump.
Tunnel Effect
If you take a walk between tall buildings, or in a narrow mountain pass, youwill notice that the same effect is working:
The air becomes compressed on the windy side of the buildings ormountains, and its speed increases considerably between the obstacles to thewind. This is known as a "tunnel effect".
So, even if the general wind speed in open terrain may be, say, 6 metresper second, it can easily reach 9 metres per second in a natural "tunnel".
Placing a wind turbine in such a tunnel is one clever way of obtaininghigher wind speeds than in the surrounding areas.
To obtain a good tunnel effect the tunnel should be "softly" embedded inthe landscape. In case the hills are very rough and uneven, there may be lotsof turbulence in the area, i.e. the wind will be whirling in a lot of different(and rapidly changing) directions.
If there is much turbulence it may negate the wind speed advantagecompletely, and the changing winds may inflict a lot of useless tear and wearon the wind turbine.

| Back | Home | Forward |© Copyright 2000 Soren Krohn. All rights reserved.
Updated 6 August 2000http://www.windpower.org/tour/speedup.htm

The wind in passing thesummits of mountainsbecomes swift and denseand as it blows beyond themountains it becomes thinand slow, like water thatissues from a narrowchannel into the wide sea.
Notebooks ofLeonardo da Vinci(1452-1519)
Speed Up Effects: Hill Effect
A common way of siting wind turbines is to place them on hills or ridgesoverlooking the surrounding landscape. In particular, it is always anadvantage to have as wide a view as possible in the prevailing winddirection in the area.
On hills, one may also experience that wind speeds are higher than in thesurrounding area. Once again, this is due to the fact that the wind becomescompressed on the windy side of the hill, and once the air reaches the ridgeit can expand again as its soars down into the low pressure area on the leeside of the hill.
You may notice that the wind in the picture starts bending some time beforeit reaches the hill, because the high pressure area actually extends quitesome distance out in front of the hill.
Also, you may notice that the wind becomes very irregular, once it passesthrough the wind turbine rotor.
As before, if the hill is steep or has an uneven surface, one may getsignificant amounts of turbulence, which may negate the advantage ofhigher wind speeds.
| Back | Home | Forward |© Copyright 1998 Soren Krohn. All rights reserved.
Updated 6 August 2000http://www.windpower.org/tour/hill.htm


Selecting a Wind Turbine Site
Photograph© 1997 Soren Krohn
Wind ConditionsLooking at nature itself is usually anexcellent guide to finding a suitable windturbine site.
If there are trees and shrubs in the area,you may get a good clue about theprevailing wind direction, as you do inthe picture to the left.
If you move along a rugged coastline,you may also notice that centuries oferosion have worked in one particulardirection.
Meteorology data, ideally in terms of awind rose calculated over 30 years is probably your best guide, but thesedata are rarely collected directly at your site, and here are many reasons tobe careful about the use of meteorology data, as we explain in the nextsection.
If there are already wind turbines in the area, their production results are anexcellent guide to local wind conditions. In countries like Denmark andGermany where you often find a large number of turbines scattered aroundthe countryside, manufacturers can offer guaranteed production results onthe basis of wind calculations made on the site.
Look for a viewAs you have learned from the previous pages, we would like to have as wideand open a view as possible in the prevailing wind direction, and we wouldlike to have as few obstacles and as low a roughness as possible in that samedirection. If you can find a rounded hill to place the turbines, you may evenget a speed up effect in the bargain.
Grid ConnectionObviously, large wind turbines have to be connected to the electrical grid.
For smaller projects, it is therefore essential to be reasonably close to a10-30 kilovolt power line if the costs of extending the electrical grid are notto be prohibitively high. (It matters a lot who has to pay for the power lineextension, of course).
The generators in large, modern wind turbines generally produceelectricity at 690 volts. A transformer located next to the turbine, or insidethe turbine tower, converts the electricity to high voltage (usually 10-30kilovolts).
Grid ReinforcementThe electrical grid near the wind turbine(s) should be able to receive theelectricity coming from the turbine. If there are already many turbinesconnected to the grid, the grid may need reinforcement, i.e. a larger cable,perhaps connected closer to a higher voltage transformer station. Read the

section on Electrical Grid Issues for further information.
Soil ConditionsBoth the feasibility of building foundations of the turbines, and roadconstruction to reach the site with heavy trucks must be taken into accountwith any wind turbine project.
Pitfalls in Using Meteorology DataMeteorologists already collect wind data for weather forecasts and aviation,and that information is often used to assess the general wind conditions forwind energy in an area.
Precision measurement of wind speeds, and thus wind energy is not nearlyas important for weather forecasting as it is for wind energy planning,however.
Wind speeds are heavily influenced by the surface roughness of thesurrounding area, of nearby obstacles (such as trees, lighthouses or otherbuildings), and by the contours of the local terrain.
Unless you make calculations which compensate for the local conditionsunder which the meteorology measurements were made, it is difficult toestimate wind conditions at a nearby site. In most cases using meteorologydata directly will underestimate the true wind energy potential in an area.
We'll return to how the professionals do their wind speed calculations onthe following pages.
| Back | Home | Forward |© Copyright 1998 Soren Krohn. All rights reserved.
Updated 6 August 2000http://www.windpower.org/tour/wres/siting.htm

Offshore Wind Conditions
500 kW offshore windturbine at Tunø Knob,
Denmark.Photograph © 1996
Vestas Wind Systems A/S
Wind Conditions at SeaThe surfaces of seas and lakes are obviously very smooth,thus the roughness of a seascape is very low (at constant windspeeds). With increasing wind speeds some of the energy inthe wind is used to build waves, i.e. the roughness increases.Once the waves have been built up, the roughness decreasesagain. We thus have a surface with varying roughness, (justas you have it in areas covered with more or less snow).
Generally speaking, however, the roughness of the watersurface is very low, and obstacles to the wind are few. Whendoing wind calculations we have to account for islands,lighthouses etc. just like you would account for upwindobstacles or changes in roughness on land.
Low Wind Shear Means Lower HubHeightWith low roughness, wind shear at sea is very low, i.e. thewind speed does not change very much with changes in thehub height of wind turbines. It may therefore be mosteconomic to use fairly low towers of perhaps 0.75 times the
rotor diameter for wind turbines located at sea, depending upon localconditions. (Typically towers on land sites are about the size of the rotordiameter, or taller).
Low Turbulence Intensity = Longer Lifetime forTurbinesThe wind at sea is generally less turbulent than on land. Wind turbineslocated at sea may therefore be expected to have a longer lifetime than landbased turbines.
The low turbulence at sea is primarily due to the fact that temperaturevariations between different altitudes in the atmosphere above the sea aresmaller than above land. Sunlight will penetrate several metres below the seasurface, whereas on land the radiation from the sun only heats the uppermostlayer of the soil, which thus becomes much warmer.
Consequently the temperature difference between the surface and the airwill be smaller above sea than above land. This is the reason for lowerturbulence.
Wind Shade Conditions at SeaThe conventional WAsP model used for onshore wind modelling is in theprocess of being modified for offshore wind conditions, according to itsdeveloper, Risø National Laboratory.
The different production results obtained from the experience of the firstmajor offshore wind park at Vindeby, Denmark, and the subsequently builtwind park at Tunø Knob, Denmark, has led to new investigations with

anemometer masts being placed offshore in a number of locations in Danishwaters since 1996.
The preliminary results indicate that wind shade effects from land may bemore important, even at distances up to 20 kilometres, than was previouslythought.
On the other hand, it appear that the offshore wind resource may be some 5to 10 per cent higher than was previously estimated.
| Back | Home | Forward |© Copyright 1999 Soren Krohn. All rights reserved.
Updated 6 August 2000http://www.windpower.org/tour/wres/offshore.htm

Wind Map of Western Europe

Wind Resources at 50 (45) m Above Ground Level
Colour Sheltered terrain Open plain At a sea coast Open sea Hills and ridges
How to Read the Wind Map of Western EuropeThis wind map of Western Europe was originally published as part of theEuropean Wind Atlas. The details on how to interpret the colours are givenin the legend above. Please note that the data for Norway, Sweden andFinland are from a later study, and are calculated for 45 m height aboveground level, and assume an open plain.
The purple zones are the areas with the strongest winds while the bluezones have the weakest winds. The dividing lines between the differentzones are not as sharp as they appear on the map. In reality, the areas tend toblend smoothly into one another.
You should note, however, that the colours on the map assume that theglobe is round without obstacles to the wind, speed up effects, or varyingroughness of the terrain. You may therefore easily find good, windy sites forwind turbines on hills and ridges in, say the yellow or green areas of themap, while you have little wind in sheltered terrain in the purple areas.
The Power of the WindIn case you cannot explain why the calculated mean power of the wind inthe table is approximately twice the power of the wind at the given meanwind speed, you should read the four to six pages starting with the WeibullDistribution.
Reality is More ComplicatedActual local differences in the terrain will mean that the picture will bemuch more complicated, if we take a closer look. As an example, we willnow take a closeup view of Denmark on the next page.
| Back | Home | Forward |© Copyright 1999 Soren Krohn
Updated 6 August 2000http://www.windpower.org/tour/wres/euromap.htm

Wind Map of Denmark

How to Read the Wind Map of DenmarkThis unique map of Danish wind speeds takes local terrain(speed up effects) and roughness into account. It shows amuch more detailed picture of wind conditions than wesaw on the previous page. We can clearly see that Westand Southwest are the prevailing wind direction inDenmark, since West and Southwest facing coastal siteshave by far the highest energy content of the wind (the redand yellow areas).
The map is actually a very high resolution map, wherethe area of the whole country (44,000 km2 area) was divided into 1.1 millionsquares 200 by 200 m each (220 by 220 yards), and the mean wind speedwas calculated for each square. You may download the map in variousresolutions from the web site of Energy & Environmental Data in Denmark,if you wish (it is also available on CD-ROM).
Using the Wind Map for PlanningThis wind map was developed to assist the Danish municipalities in theirplanning (zoning) work for wind turbines. Each municipality in Denmark isresponsible for allocating suitable areas for wind turbines in order that theGovernment may fulfill its plans to supply 50% of the country's electricityconsumption by wind energy in 2030.
Using the Wind Map for Wind ProspectingThe map is obviously also a gift to wind project developers, who can see the(probable) best wind fields in the country directly. One could thereforehardly imagine it being financed and published by any other institution thana government.
The map, however, is not sufficient for actually locating a wind turbine,since it was generated mechanically, without detailed verification in theterrain. In order to make proper calculation of annual electricity output onewould have to go to the prospective site and verify e.g. the roughness andlocate obstacles and check for new buildings, trees etc.
State of the Art Methods of Wind AssessmentThis map was produced for the Danish Energy Agency by Energy &Environmental Data, a wind energy software and consultancy firm incollaboration with the Wind Energy Department of Risoe NationalLaboratory, which developed the basic fluid dynamics software used for thewind calculations, the WAsP programme.
Calculating such a detailed wind map of a large area is actually anenormous task: The map was made on the basis of extremely detailed digitalmaps at the scale of 1:25000. The maps in reality consist of 7 layers, withone layer representing altitude contours (orography), another forests andfences (and even individual large trees), a third layer buildings, a fourthlayer lakes and rivers etc. The programme that generates roughness data forthe WAsP programme determines terrain contours and contiguous areas offorests, lakes, cities etc. in neighbouring squares of each square out to adistance of 20,000 m in all wind directions.

The results were subsequently recalibrated using statistics from severalhundred wind turbines scattered throughout the country for which energyoutput data are available. Thus it has been possible to compensate for thefact that the mean wind speeds in Denmark tend to decrease, as we movetowards the East.
| Back | Home | Forward |© Copyright 2000 Soren Krohn
Updated 6 August 2000http://www.windpower.org/tour/wres/dkmap.htm

Describing Wind Variations:Weibull Distribution
The General Pattern of Wind Speed VariationsIt is very important for the wind industry to be able to describe the variationof wind speeds. Turbine designers need the information to optimise thedesign of their turbines, so as to minimise generating costs. Turbineinvestors need the information to estimate their income from electricitygeneration.
If you measure wind speeds throughout a year, you will notice that in mostareas strong gale force winds are rare, while moderate and fresh winds arequite common.
The wind variation for a typical site is usually described using theso-called Weibull distribution, as shown in the image. This particular sitehas a mean wind speed of 7 metres per second, and the shape of the curve isdetermined by a so called shape parameter of 2.
Statistical Description of Wind SpeedsPeople who are familiar with statistics will realise that the graph shows aprobability density distribution. The area under the curve is alwaysexactly 1, since the probability that the wind will be blowing at some windspeed including zero must be 100 per cent.
Half of the blue area is to the left of the vertical black line at 6.6 metres persecond. The 6.6 m/s is called the median of the distribution. This means thathalf the time it will be blowing less than 6.6 metres per second, the otherhalf it will be blowing faster than 6.6 metres per second.
You may wonder then, why we say that the mean wind speed is 7 metresper second. The mean wind speed is actually the average of the wind speed

observations we will get at this site.As you can see, the distribution of wind speeds is skewed, i.e. it is not
symmetrical. Sometimes you will have very high wind speeds, but they arevery rare. Wind speeds of 5.5 metres per second, on the other hand, are themost common ones. 5.5 metres is called the modal value of the distribution.If we multiply each tiny wind speed interval by the probability of gettingthat particular wind speed, and add it all up, we get the mean wind speed.
The statistical distribution of wind speeds varies from place to placearound the globe, depending upon local climate conditions, the landscape,and its surface. The Weibull distribution may thus vary, both in its shape,and in its mean value.
If the shape parameter is exactly 2, as in the graph on this page, thedistribution is known as a Rayleigh distribution. Wind turbinemanufacturers often give standard performance figures for their machinesusing the Rayleigh distribution.
Balancing the Weibull DistributionAnother way of finding the mean wind speed isto balance the pile of blue bricks to the right,which shows exactly the same as the graphabove. Each brick represents the probability thatthe wind will be blowing at that speed during 1per cent of the time during the year. 1 m/s windspeeds are in the pile to the far left, 17 m/s is tothe far right.
The point at which the whole pile will balance exactly will be at the 7thpile, i.e. the mean wind speed is 7 m/s.
Try This!If you have a Netscape 3, 4 or Internet Explorer 4 browser, the next pagewill let you experiment with different values for the Weibull parameters toget a grasp of what the wind speed probability distribution looks like.
| Home | Forward |© Copyright 1999 Soren Krohn. All rights reserved.
Updated 6 August 2000http://www.windpower.org/tour/wres/Weibull.htm

Weibull Distribution PlotterProgramme
(Requires Netscape 3.0)
This page will give you an idea of the way different Weibull distributionslook. The mean wind speed or the scale parameter, A, is used to indicatehow windy the site is, on average. The shape parameter, k, tells howpeaked the distibution is, i.e. if the wind speeds always tend to be very closeto a certain value, the distibution will have a high k value, and be verypeaked.
Start by clicking Weibull in the control panel below, to see the result ofour example on the previous page. Then try changing one parameter at atime, and watch what happens.
| Back | Home | Forward |© Copyright 1997 Danish Wind Turbine Manufacturers Association
Updated 6 August 2000http://www.windpower.org/tour/wres/weibull.htm
Choose between entering mean wind speed (2.0-12.0 m/s) or scale parameter A in the first box ,
then enter shape k (1.0-3.0) = After entering your data, click to draw. http://www.windpower.org/wres/weibull/index.htm

The AverageBottle FallacyWhat is the average energy content of the wind atyour wind turbine site?
Most people who are new to wind energy thinkthey could easily live without the Weibulldistribution. After all, if we know the averagewind speed, we also know the average power of the wind,don't we? So, can't we just use the power (or energy) atthe mean wind speed to figure out how much power (or energy)will hit the wind turbine?
In other words, couldn't we just say, that with an average windspeed of 7 m/s we get an average power input of 210 Watts per square metreof rotor area? (You may find that figure in the table on the power of thewind in the Reference Manual).
The answer is no! We would underestimate wind resources by almost 100per cent. If we did that, we would be victims of what we could call theAverage Bottle Fallacy: Look at the smallest and largest bottle in the picture.Both have exactly the same shape. One is 0.24 m tall, the other is 0.76 mtall. How tall is the average bottle?
If you answer 0.5 m tall, you are a victim of the Average Bottle Fallacy.Bottles are interesting because of their volume, of course. But the volumevaries with the cube (the third power) of their size. So, even though thelargest bottle is only 3.17 times larger than the small bottle, its volume isactually 3.173=32 times larger than the small bottle.
The average volume is therefore 16.5 times that of the small bottle. Thismeans that a bottle with an average volume would have to be 2.55 times theheight of the small bottle, i.e. 0.61 m tall. (Since 2.553 = 16.5).
The point we are trying to make, is that you cannot simply take an averageof wind speeds, and then use the average wind speed for your powercalculations. You have to weigh each wind speed probability with thecorresponding amount of power. On the next two pages we shall calculatethe energy in the wind. First we use the bottle example to grasp the idea,then we use simple math.
| Back | Home | Forward |© Copyright 1998 Soren Krohn. All rights reserved.
Updated 6 August 2000http://www.windpower.org/tour/wares/bottle.htm

Mean (Average) Power of theWind
Balancing the Power DistributionThe reason why we care about wind speeds is their energy content, just likewith the bottles on the previous page: We cared about their content in termsof volume. Now, the volume of a bottle varies with the cube of the size, justlike wind power varies with the cube of the wind speed.
Let us take the Weibull distribution of wind speeds, and for each speed weplace a bottle on a shelf each time we have a 1 per cent probability of gettingthat wind speed. The size of each bottle corresponds to the wind speed, sothe weight of each bottle corresponds to the amount of energy in the wind.
To the right, at 17 m/s we have some really heavy bottles, which weighalmost 5000 times as much as the bottles at 1 m/s. (At 1 m/s the wind has apower of 0.61 W/m2. At 17 m/s its power is 3009 W/m2).
Finding the wind speed at which we get the mean of the power distributionis equivalent to balancing the bookshelves. (Remember how we did thebalancing act on the Weibull distribution page?). In this case, as you can see,although high winds are rare, they weigh in with a lot of energy.
So, in this case with an average wind speed of 7 m/s, the power weightedaverage of wind speeds is 8.7 m/s. At that wind speed the power of the windis 402 W/m2, which is almost twice as much as we figured out in our naivecalculation on the top of the previous page.
On the next pages we will use a more convenient method of finding thepower in the wind than hauling bottles around...
| Back | Home | Forward |© Copyright 2000 Soren Krohn. All rights reserved.
Updated 9 September 2000http://www.windpower.org/tour/wres/shelves.htm

Betz' LawThe Ideal Braking of theWindThe more kinetic energy a windturbine pulls out of the wind, themore the wind will be slowed downas it leaves the left side of theturbine in the picture. (If youwonder about the stream tube in thepicture, you have not read the pageon how the wind turbine deflects the wind).
If we tried to extract all the energy from the wind, the air would moveaway with the speed zero, i.e. the air could not leave the turbine. In that casewe would not extract any energy at all, since all of the air would obviouslyalso be prevented from entering the rotor of the turbine.
In the other extreme case, the wind could pass though our tube abovewithout being hindered at all. In this case we would likewise not haveextracted any energy from the wind.
We can therefore assume that there must be some way of braking the windwhich is in between these two extremes, and is more efficient in convertingthe energy in the wind to useful mechanical energy. It turns out that there isa surprisingly simple answer to this: An ideal wind turbine would slowdown the wind by 2/3 of its original speed. To understand why, we have touse the fundamental physical law for the aerodynamics of wind turbines:
Betz' Law

Betz' law says that you canonly convert less than 16/27(or 59%) of the kineticenergy in the wind tomechanical energy using awind turbine.
Betz' law was firstformulated by the GermanPhysicist Albert Betz in 1919.His book "Wind-Energie"published in 1926 gives a goodaccount of the knowledge ofwind energy and wind turbinesat that moment.
It is quite surprising that onecan make such a sweeping,general statement whichapplies to any wind turbinewith a disc-like rotor.
To prove the theoremrequires a bit of math andphysics, but don't be put off bythat, as Betz himself writes inhis book. Betz' own proof ofthe theorem is included in theReference Manual on this web site.
| Back | Home | Forward |© Copyright 1999 Soren Krohn. All rights reserved.
Updated 6 August 2000http://www.windpower.org/tour/wres/betz.htm

Power Density Function
Power of the Wind
From the page on theenergy in the wind, weknow that the energypotential per second(the power) varies inproportion to the cube(the third power) ofthe wind speed, and inproportion to thedensity of the air. (Itsweight per unit ofvolume).
We may nowcombine everythingwe have learned sofar: If we multiply thepower of each windspeed with theprobability of eachwind speed from the
Weibull graph, we have calculated the distribution of wind energy atdifferent wind speeds = the power density.
Notice, that the previous Weibull curve changes shape, because the highwind speeds have most of the power of the wind.
From Power Density to Power OutputThis graph was drawn using the wind turbine power calculator on this website. The area under the grey curve (all the way to the axis at the bottom)gives us the amount of wind power per square metre wind flow we mayexpect at this particular site. In this case we have a mean wind speed of 7m/s and a Weibull k=2, so we get 402 W/m2. You should note that this isalmost twice as much power as the wind has when it is blowing constantly atthe average wind speed.
The graph consists of a number of narrow vertical columns, one for each0.1 m/s wind speed interval. The height of each column is the power(number of watts per square metre), which that particular wind speedcontributes to the total amount of power available per square metre.
The area under the blue curve tells us how much of the wind power we cantheoretically convert to mechanical power. (According to Betz' law, this is16/27 of the total power in the wind).
The total area under the red curve tells us how much electrical power acertain wind turbine will produce at this site. We will learn how to figurethat out in a moment when we get to the page on power curves.

The Important Messages in the GraphThe most important thing to notice is that the bulk of wind energy will befound at wind speeds above the mean (average) wind speed at the site.
This is not as surprising as it sounds, because we know that high windspeeds have much higher energy content than low wind speeds.
The Cut In Wind SpeedUsually, wind turbines are designed to start running at wind speedssomewhere around 3 to 5 metres per second. This is called the cut in windspeed. The blue area to the left shows the small amount of power we losedue to the fact the turbine only cuts in after, say 5 m/s.
The Cut Out Wind SpeedThe wind turbine will be programmed to stop at high wind speeds above, say25 metres per second, in order to avoid damaging the turbine or itssurroundings. The stop wind speed is called the cut out wind speed. Thetiny blue area to the right represents that loss of power.
| Back | Home | Forward |© Copyright 1999 Soren Krohn. All rights reserved.
Updated 6 August 2000http://www.windpower.org/tour/wres/powdensi.htm

The Power Curve of a WindTurbine
The power curveof a wind turbineis a graph thatindicates howlarge the electricalpower output willbe for the turbineat different windspeeds.
The graph showsa power curve fora typical Danish600 kW windturbine.
Power curvesare found by fieldmeasurements,where ananemometer isplaced on a mastreasonably close
to the wind turbine (not on the turbine itself or too close to it, since theturbine rotor may create turbulence, and make wind speed measurementunreliable).
If the wind speed is not fluctuating too rapidly, then one may use the windspeed measurements from the anemometer and read the electrical poweroutput from the wind turbine and plot the two values together in a graph likethe one to the left.
Uncertainty in Measurement of Power CurvesIn reality, one will see a swarm of points spread around the blue line, andnot the neat curve in the graph.
The reason is that in practice the wind speed always fluctuates, and onecannot measure exactly the column of wind that passes through the rotor ofthe turbine.
(It is not a workable solution just to place an anemometer in front of theturbine, since the turbine will also cast a "wind shadow" and brake the windin front of itself).
In practice, therefore, one has to take an average of the differentmeasurements for each wind speed, and plot the graph through theseaverages.
Furthermore, it is difficult to make exact measurements of the wind speeditself. If one has a 3 per cent error in wind speed measurement, then theenergy in the wind may be 9 per cent higher or lower (remember that theenergy content varies with the third power of the wind speed).

Consequently, there may be errors up to plus or minus 10 per cent even incertified power curves.
Verifying Power CurvesPower curves are based on measurements in areas with low turbulenceintensity, and with the wind coming directly towards the front of the turbine.Local turbulence and complex terrain (e.g. turbines placed on a ruggedslope) may mean that wind gusts hit the rotor from varying directions. Itmay therefore be difficult to reproduce the power curve exactly in any givenlocation.
Pitfalls in Using Power CurvesA power curve does not tell you how much power a wind turbine willproduce at a certain average wind speed. You would not even be close, ifyou used that method!
Remember, that the energy content of the wind varies very strongly withthe wind speed, as we saw in the section on the energy in the wind. So, itmatters a lot how that average came about, i.e. if winds vary a lot, or if thewind blows at a relatively constant speed.
Also, you may remember from the example in the section on the powerdensity function, that most of the wind energy is available at wind speedswhich are twice the most common wind speed at the site.
Finally, we need to account for the fact that the turbine may not be runningat standard air pressure and temperature, and consequently make correctionsfor changes in the density of air.
| Back | Home | Forward |© Copyright 2000 Soren Krohn. All rights reserved.
Updated 6 September 2000http://www.windpower.org/tour/wres/pwr.htm

The Power CoefficientThe powercoefficient tells youhow efficiently aturbine converts theenergy in the wind toelectricity. Verysimply, we justdivide the electricalpower output by thewind energy inputto measure howtechnically efficient awind turbine is.
In other words, wetake the power curve,and divide it by thearea of the rotor toget the power outputper square metre ofrotor area. For each wind speed, we then divide the result by the amount ofpower in the wind per square metre.
The graph shows a power coefficient curve for a typical Danish windturbine. Although the average efficiency for these turbines is somewhatabove 20 per cent, the efficiency varies very much with the wind speed. (Ifthere are small kinks in the curve, they are usually due to measurementerrors).
As you can see, the mechanical efficiency of the turbine is largest (in thiscase 44 per cent) at a wind speed around some 9 m/s. This is a deliberatechoice by the engineers who designed the turbine. At low wind speedsefficiency is not so important, because there is not much energy to harvest.At high wind speeds the turbine must waste any excess energy above whatthe generator was designed for. Efficiency therefore matters most in theregion of wind speeds where most of the energy is to be found.
Higher Technical Efficiency is not Necessarily theWay ForwardIt is not an aim in itself to have a high technical efficiency of a windturbine. What matters, really, is the cost of pulling kilowatt hours out of thewinds during the next 20 years. Since the fuel is free, there is no need tosave it. The optimal turbine is therefore not necessarily the turbine with thehighest energy output per year.
On the other hand, each square metre of rotor area costs money, so it is ofcourse necessary to harvest whatever energy you can - as long as you cankeep costs per kilowatt hour down. We return to that subject later on thepage about optimising wind turbines.

| Back | Home | Forward |© Copyright 2000 Soren Krohn. All rights reserved.
Updated 9 September 2000http://www.windpower.org/tour/wres/cp.htm

Guide to the Wind TurbinePower CalculatorIf you have room on your screen, you may open another browser windowwith the calculator, in order to look at it while you look at this guide. If youdo not want to read all of these instructions, please read the advice at thebottom of the page in any case.
Using the Power Curve and the Weibull distributionto Estimate Power and Energy OutputIn order to use the power curve properly, you have to combine yourknowledge of the Weibull distribution with the power curve. This is what wewill be doing using the power density calculator on the next page:
For each tiny 0.1 metre interval of wind speeds we multiply the probabilityof that wind speed interval (from the Weibull curve) with the value from thepower curve of the wind turbine.
We then take the sum of all these multiplications to get the mean (oraverage) power output.
If we multiply the power by 365.25 by 24 (the number of hours in a year)we get the total energy output for an average year.
Site DataUse the pop up menu to fill out European wind distribution dataautomatically. The data calculated for roughness classes 0, 1, 2, and 3 wastaken from the European wind atlas. If you use roughness class 1.5, weinterpolate to find the data. If you have data for other parts of the world youwould like to have included, please e-mail us.
Air Density DataAs we learned on a previous page, the energy in the wind varies inproportion to the density of air. Try changing the air temperature from, say40 degrees Celsius, to -20 degrees Celsius. There are almost 25 per centmore air molecules in a cubic metre of the cold air than in a cubic metre ofthe warm air, so watch what happens to the energy output...
If you wish to change the altitude above sea level, then start setting thetemperature at sea level first. The programme will then automaticallycompute the likely temperature and pressure at the altitude you set.
You may set the air density directly, if you know what you are doing. Theprogramme then computes a likely set of data for the other variables. (Youmay also change the air pressure, but you'd better leave it alone. Your airpressure obviously has to fit to the local altitude and temperature).
Wind Distribution DataThe Weibull shape parameter is generally around 2 in Northern Europe, butsituations vary, so you may really need a wind atlas to set this moreaccurately. You can either enter the mean wind speed, or the Weibull scaleparameter (the programme then automatically computes) the other.

The measurement height for your wind speed is very important, becausewind speeds increase with heights above ground level, cf. the page on windshear. Meteorology observations are generally made at 10 m height, butanemometer studies are often made at hub height of the wind turbine (in ourexample 50 metres).
The average roughness of the surrounding terrain is important to determinethe wind speed at turbine hub height, if it differs from the height at whichwind speed measurements were made. You may either set the roughnesslength or the roughness class, depending on the local landscape type. (Seethe Reference Manual for guidelines on roughness classes).Wind Turbine DataThis section of the calculator lets you specify the rated power of the maingenerator, the rotor diameter, the cut in wind speed, and the cut out windspeed, and the hub height of your machine. At the bottom of the page youmay then specify the power curve of your machine.
It is much easier, however, to use the first pop up menu which allows youto set all turbine specifications using a built-in table of data for typicalDanish wind turbines. We have already put data for a typical 600 kWmachine in the form for you, but you may experiment by looking at othermachines.
The second pop up menu will allow you to choose from the available hubheights for the machine you have chosen. You may also enter a hub heightof your own, if you wish.
Try experimenting a bit with different hub heights, and see how energyoutput varies. The effect is particularly noticeable if the machine is locatedin terrain with a high roughness class. (You can modify the roughness classin the wind distribution data to see for yourself).
If you modify the standard machine specifications, the text on the first popup menu changes to User example, to show that you are not dealing with astandard machine. It is safe to play with all of the variables, but it does notmake much sense to change the generator size or rotor diameter for astandard machine, unless you also change the power curve. We only use therotor diameter to show the power input, and to compute the efficiency of themachine (in terms of the power coefficient). We only use the rated power ofthe generator to compute the capacity factor.
Wind Turbine Power CurveFor practical reasons (keeping your input data and your results in view at thesame time) we have placed the listing of the turbine power curve at thebottom of the page. You can use this area to specify a turbine which is notlisted in the built-in table. The only requirement is that wind speeds beordered sequentially in ascending (increasing) order.
The programme approximates the power curve with a straight line betweeneach two successive points which have non zero values for the power output.
Note: The programme only uses wind speeds up to 40 m/s in itscalculations of the wind climate, so do not bother about fantasy machinesthat work beyond 30 m/s.
Control ButtonsCalculate recalculates the results on the form. You may also click anywhereelse or use the tab key after you have entered data to activate the calculator.Note that if you change the power curve, the machine will not recalculateyour data until you click calculate, or change other data.

Reset Data sets the data back to the user example you first encountered onyour screen.
Power Density plots the power density graph for this site and machine in aseparate window.
Power Curve plots the power curve for the machine you have selected in aseparate window.
Power Coefficient plots the power coefficient, i.e. the efficiency of themachine at different wind speeds.
Site Power Input ResultsPower input per square metre rotor area shows the amount of energy inthe wind which theoretically would flow through the circle containing therotor area, if the rotor were not present. (In reality, part of the airflow will bediverted outside the rotor area due to the high pressure area in front of therotor).
Maximum power input at x m/s shows at what wind speed we achievethe highest contribution to total power output. The figure is usually muchhigher than average wind speed, cf. the page on the power density function.
Mean hub height wind speed shows how the programme recalculatesyour wind data to the proper hub height. If you have specified a hub heightwhich is different from the height at which wind measurements were taken,the programme automatically recalculates all wind speeds in the Weibulldistribution in accordance with the roughness class (or roughness length)you have specified.
Turbine Power Output ResultsPower output per square metre of rotor area tells us how much of thepower input per square metre the machine will convert to electricity.Generally, you will find that it is cost effective to build the machine to useabout 30 per cent of the power available. (Please note, that the figure for sitepower input includes the power for wind speeds outside the cut in/cut outwind speed range, so you cannot divide by that figure to obtain the averagepower coefficient).
Energy output per square metre rotor area per year, is simply themean power output per square metre rotor area multiplied by the number ofhours in a year.
Energy output in kWh per year, tells us how much electrical energy thewind turbine will produce in an average year. That is probably the figure theowner cares more about than the rest. When the owner considers that figure,however, he will also have to take the price of the machine, its reliability,and the cost of operation and maintenance. We return to those subjects in thesection on the economics of wind energy.
The annual energy output calculated here may be slightly different fromthe real figures from the manufacturer. This is particularly the case if youvary the density of air. In that case the manufacturer will calculate differentpower curves for each density of air. The reason is, that with a pitchcontrolled turbine the pitching mechanism will automatically change thepitch angle of the blade with the change of air density, while for a stallcontrolled turbine, the manufacturer will set the angle of the blade slightlydifferently depending on the local average air density. This programme maybe up to 3.6% below the correct figure from the manufacturer for low airdensities, and up to 1.6% above the manufacturers' figures for high air

densities.Capacity factor tells us how much the turbine uses the rated capacity of
its (main) generator. You may read more on the page on annual energyoutput from a wind turbine.
Note 1: Make sure that you use the same hub height, if you wish tocompare how two machines with the same rotor diameter perform.
Note 2: If you wish to compare machines with different rotor diametersyou should look at the energy output per square metre of rotor area instead(you should still use the same hub height).
Note 3: Low wind machines (large rotor diameter relative to generatorsize) will generally perform badly at high wind sites and vice versa. Mostlow wind machines are not designed for use in high wind areas with stronggusts.
| Back | Home | Forward |© Copyright 1998 Soren Krohn. All rights reserved.
Updated 6 August 2000http://www.windpower.org/tour/wres/guidep.htm

Wind Turbine Power CalculatorThis calculator requires a Netscape 3.01 or IE 4 or later browser to work. If you are using Navigator3.01 or later or Internet Explorer 4 or later, and you see this message, you need to enable JavaScript.In Netscape, choose Options | Network Preferences, choose the Languages tab, and click EnableJavaScript. Then click reload on your browser. In Internet Explorer, choose Edit | Preferences | Java,and enable Java, select the Microsoft virtual machine, and enable the "Just in time compiler". Then clickreload on your browser. Do not operate the form until this page and its programme have loadedcompletely. If you are too fast, the programme will complain about missing data, and you'll have to clickreload. Note1: Energy output results from calculation programmes like this may differ slightly from theresults given by manufacturers. Note 2: Power curves are found by field measurements which may beuncertain. Therefore these results should be interpreted with great care, as the may be some +/-10 percent uncertainty in these measurements. Note 3: Turbine manufacturers may have site specific turbinemodels available which are not listed here. Note 4: The site data below was not chosen as beingparticularly suitable for wind turbines, but was taken directly from the anemometer locations used in theEuropean Wind Atlas. In the case of e.g. Frankfurt (D), one may e.g. find locations on neighbouring hills tothe South with twice as high an annual production as you would get at the airport where theanemometer is located. In the case of e.g. Northwestern Ireland, sites on rounded hills in the area mayyield 20-25 per cent higher energy output.
You may experiment by changing the figures in the example below. You can fill in any box, exceptthe result boxes marked with an asterisk (*). After changing data, use the tab key, click the Calculatebutton, or click anywhere on the page outside the field you have updated to see the results. Click onthe question marks for help. (If a plot windows disappears, it is probably hidden behind this window).
Site Data Air Density Data
°C temp at m altitude (= kPa pressure) kg/m3 densityWind Distribution Data for Site
Weibull shape parameter
m/s mean = Weibull scale parameter
m height, Roughness length m = class
Wind Turbine Data kW
m/s cut in wind speed, m/s cut out wind speed
m rotor diameter, m hub height

Site Power Input Results
Power input* W/m2 rotor area
Max. power input at* m/s
Mean hub ht wind speed* m/s
Turbine Power output Results
Power output* W/m2 rotor area
Energy output* kWh/m2/year
Energy output* kWh/year
Capacity factor* per cent
Wind Turbine Power Curvem/s......kW
m/s......kW
m/s......kW
Note: This calculator may be used together with the Wind Energy EconomicsCalculator. If you open the economics calculator from this page, they will both be onscreen, and this calculator will automatically feed its energy output result into theeconomics calculator.
| Back | Home | Forward |© Copyright 2000 Soren Krohn. All rights reserved.
Updated 6 August 2000http://www.windpower.org/tour/wres/pow/index.htm

Annual Energy Output from aWind TurbineWe are now ready to calculate the relationship between average wind speedsand annual energy output from a wind turbine.
To draw the graphto the right, we haveused the powercalculator on theprevious page, and thepower curve from thedefault example 600kW wind turbine. Wehave used a standardatmosphere with anair density of 1.225kg/m3.
For each of theWeibull parameters1.5, 2.0, and 2.5 wehave calculated theannual energy output for different average wind speeds at turbine hubheight.
As you can see, output may vary up to 50 per cent depending on the shapeparameter at a low average wind speed of 4.5 m/s, while it may vary some30 per cent at a very high average wind speed of 10 m/s at hub height.
Output varies almost with the cube of the windspeedNow, let us look at the red curve with k=2, which is the curve normallyshown by manufacturers:
With an average wind speed of 4.5 m/s at hub height the machine willgenerate about 0.5 GWh per year, i.e. 500,000 kWh per year. With anaverage wind speed of 9 metres per second it will generate 2.4 GWh/year =2,400,000 kWh per year. Thus, doubling the average wind speed hasincreased energy output 4.8 times.
If we had compared 5 and 10 metres per second instead, we would haveobtained almost exactly 4 times as much energy output.
The reason why we do not obtain exactly the same results in the two cases,is that the efficiency of the wind turbine varies with the wind speeds, asdescribed by the power curve. Note, that the uncertainty that applies to thepower curve also applies to the result above.
You may refine your calculations by accounting for the fact that e.g. intemperate climates the wind tends to be stronger in winter than in summer,and stronger during the daytime than at night.

The Capacity FactorAnother way of stating the annual energy output from a wind turbine is tolook at the capacity factor for the turbine in its particular location. Bycapacity factor we mean its actual annual energy output divided by thetheoretical maximum output, if the machine were running at its rated(maximum) power during all of the 8766 hours of the year.
Example: If a 600 kW turbine produces 1.5 million kWh in a year, itscapacity factor is = 1500000 : ( 365.25 * 24 * 600 ) = 1500000 : 5259600 =0.285 = 28.5 per cent.
Capacity factors may theoretically vary from 0 to 100 per cent, but inpractice they will usually range from 20 to 70 per cent, and mostly bearound 25-30 per cent.
The Capacity Factor ParadoxAlthough one would generally prefer to have a large capacity factor, it maynot always be an economic advantage. This is often confusing to peopleused to conventional or nuclear technology.
In a very windy location, for instance, it may be an advantage to use alarger generator with the same rotor diameter (or a smaller rotor diameter fora given generator size). This would tend to lower the capacity factor (usingless of the capacity of a relatively larger generator), but it may mean asubstantially larger annual production, as you can verify using the Powercalculator on this web site.
Whether it is worthwhile to go for a lower capacity factor with a relativelylarger generator, depends both on wind conditions, and on the price of thedifferent turbine models of course.
Another way of looking at the capacity factor paradox is to say, that to acertain extent you may have a choice between a relatively stable poweroutput (close to the design limit of the generator) with a high capacity factor- or a high energy output (which will fluctuate) with a low capacity factor.
| Back | Home | Forward |© Copyright 1998 Soren Krohn. All rights reserved.
Updated 6 August 2000http://www.windpower.org/tour/wres/annu.htm

The nacelle contains thekey components of thewind turbine, includingthe gearbox, and theelectrical generator.Service personnel mayenter the nacelle fromthe tower of the turbine.To the left of the nacellewe have the windturbine rotor, i.e. therotor blades and the hub.
The rotor blades capturethe wind and transfer itspower to the rotor hub.On a modern 600 kWwind turbine each rotorblade measures about 20metres (66 ft.) in lengthand is designed muchlike a wing of anaeroplane.
The hub of the rotor isattached to the lowspeed shaft of the windturbine.
The low speed shaft ofthe wind turbineconnects the rotor hub tothe gearbox. On amodern 600 kW windturbine the rotor rotatesrelatively slowly, about19 to 30 revolutions perminute (RPM). Theshaft contains pipes forthe hydraulics system toenable the aerodynamicbrakes to operate.
The gearbox has the lowspeed shaft to the left. Itmakes the high speedshaft to the right turnapproximately 50 timesfaster than the low speedshaft.
The high speed shaftrotates withapproximately. 1,500revolutions per minute(RPM) and drives theelectrical generator. It isequipped with an
Wind Turbine Components
Click on the parts of the open wind turbine to learn about the nacelle, rotorblades, hub, low speed shaft, gearbox, high speed shaft with its mechanical brake, electricalgenerator, yaw mechanism, electronic controller, hydraulics system, cooling unit, tower,anemometer and wind vane.
| Back | Home | Forward |© Copyright 2000 Danish Wind Turbine Manufacturers Association
Updated 26 September 2000http://www.windpower.org/tour/wtrb/comp/index.htm

emergency mechanicaldisc brake. Themechanical brake isused in case of failure ofthe aerodynamic brake,or when the turbine isbeing serviced.
The electrical generatoris usually a so-calledinduction generator orasynchronous generator.On a modern windturbine the maximumelectric power is usuallybetween 500 and 1,500kilowatts (kW).
The electronic controllercontains a computerwhich continuouslymonitors the conditionof the wind turbine andcontrols the yawmechanism. In case ofany malfunction, (e.g.overheating of thegearbox or thegenerator), itautomatically stops thewind turbine and callsthe turbine operator'scomputer via atelephone modem link.
The hydraulics systemis used to reset theaerodynamic brakes ofthe wind turbine.
The cooling unitcontains an electric fanwhich is used to cool theelectrical generator. Inaddition, it contains anoil cooling unit which isused to cool the oil inthe gearbox. Someturbines havewater-cooled generators.
The tower of the windturbine carries thenacelle and the rotor.Generally, it is anadvantage to have a hightower, since wind speedsincrease farther awayfrom the ground. Atypical modern 600 kWturbine will have a towerof 40 to 60 metres (132to 198 ft.) (the height of

a 13-20 story building).Towers may be either
tubular towers (such asthe one in the picture) orlattice towers. Tubulartowers are safer for thepersonnel that have tomaintain the turbines, asthey may use an insideladder to get to the topof the turbine. Theadvantage of latticetowers is primarily thatthey are cheaper.
The yaw mechanismuses electrical motors toturn the nacelle with therotor against the wind.
The yaw mechanism isoperated by theelectronic controllerwhich senses the winddirection using the windvane. The picture showsthe turbine yawing.Normally, the turbinewill yaw only a fewdegrees at a time, whenthe wind changes itsdirection.
The anemometer and thewind wane are used tomeasure the speed andthe direction of thewind.
The electronic signalsfrom the anemometerare used by the windturbine's electroniccontroller to start thewind turbine when thewind speed reachesapproximately 5 metresper second (10 knots).The computers stops thewind turbineautomatically if the

wind speed exceeds 25metres per second (50knots) in order to protectthe turbine and itssurroundings.
The wind vane signalsare used by the windturbine's electroniccontroller to turn thewind turbine against thewind, using the yawmechanism.

Aerodynamics of WindTurbines: LiftThe rotor consisting of the rotor blades and the hub are placed upwind ofthe tower and the nacelle on most modern wind turbines. This is primarilydone because the air current behind the tower is very irregular (turbulent).
What makes the rotor turn?The answer seemsobvious - the wind.
But actually, it is a bitmore complicated thanjust the air moleculeshitting the front of therotor blades. Modernwind turbines borrowtechnologies knownfrom aeroplanes andhelicopters, plus a fewadvanced tricks of theirown, because windturbines actually workin a very different environment with changing wind speeds and changingwind directions.
LiftHave a look at theanimation of the cut-offprofile (cross section) ofthe wing of an aircraft.The reason why an
aeroplane can fly is that the air sliding along the upper surface of the wingwill move faster than on the lower surface.
This means that the pressure will be lowest on the upper surface. Thiscreates the lift, i.e. the force pulling upwards that enables the plane to fly.
The lift is perpendicular to the direction of the wind. The lift phenomenonhas been well known for centuries to people who do roofing work: Theyknow from experience that roof material on the lee side of the roof (the sidenot facing the wind) is torn off quickly, if the roofing material is notproperly attached to its substructure.

| Back | Home | Forward |© Copyright 1998 Soren Krohn. All rights reserved.
Updated 6 August 2000http://www.windpower.org/tout/wtrb/lift.htm

Aerodynamics of WindTurbines: Stall and Drag
StallNow, what happens if anaircraft tilts backward in anattempt to climb higher intothe sky quickly? The lift ofthe wing will indeedincrease, as the wing is tiltedbackwards, but in the pictureyou can see that all of asudden the air flow on the
upper surface stops sticking to the surface of the wing. Instead the air whirlsaround in an irregular vortex (a condition which is also known asturbulence). All of a sudden the lift from the low pressure on the uppersurface of the wing disappears. This phenomenon is known as stall.
An aircraft wing will stall, if the shape of the wing tapers off too quickly asthe air moves along its general direction of motion. (The wing itself, ofcourse, does not change its shape, but the angle of the the wing in relation tothe general direction of the airflow (also known as the angle of attack) hasbeen increased in our picture above). Notice that the turbulence is created onthe back side of the wing in relation to the air current.
Stall can be provoked if the surface of the aircraft wing - or the windturbine rotor blade - is not completely even and smooth. A dent in the wingor rotor blade, or a piece of self-adhesive tape can be enough to start theturbulence on the backside, even if the angle of attack is fairly small.Aircraft designers obviously try to avoid stall at all costs, since an aeroplanewithout the lift from its wings will fall like a rock.
On the page on power control we shall return to the subject of how windturbine engineers deliberately make use of the stall phenomenon whendesigning rotor blades.
DragAircraft designers and rotor blade designers are not just concerned with liftand stall, however.
They are also concerned with air resistance, in technical jargon ofaerodynamics known as drag. Drag will normally increase if the area facingthe direction of motion increases.
| Back | Home | Forward |© Copyright 1998 Soren Krohn. All rights reserved.
Updated 6 August 2000http://www.windpower.org/tour/wtrb/stall.htm

Aerodynamics of Wind TurbinesAdding Wind Speeds and Directions (Wind Velocities)
The wind which hits the rotor blades of awind turbine will not come from thedirection in which the wind is blowing inthe landscape, i.e. from the front of theturbine. This is because the rotor bladesthemselves are moving.
To understand this, consider the pictureof a bicycle which is equipped with a bluebanner (or a wind vane) to indicate thedirection of the wind: If we have
completely calm weather, and the bicycles moves forwards, with, say, 7metres per second (14 knots), the bicycle will be moving through the air at 7metres per second. On the bicycle we can measure a wind speed of 7 metresper second relative to the bicycle. The banner will point straight backwards,because the wind will come directly from the front of the bicycle.
Now, let us look at the bicycle again directly from above,and let us assume that the bicycle moves forward at aconstant speed of, once again, 7 metres per second. If thewind is blowing directly from the right, also at 7 metres persecond, the banner will clearly be blown partly to the left, ata 45 degree angle relative to the bicycle. With a bit lesswind, e.g. 5 metres per second, the banner will be blownless to the left, and the angle will be some 35 degrees. Asyou can see from the picture, the direction of the wind, theresulting wind as measured from the bicycle, will changewhenever the speed of the wind changes.
What about the wind speed measured from the bicycle?The wind is, so to speak, blowing at a rate of 7 metres per
second from the front and 5 to 7 metres per second from theright. If you know a bit of geometry or trigonometry youcan work out that the wind speed measured on the bicyclewill be between 8.6 and 9.9 metres per second.
Enough about changing wind directions, now what about the wind turbinerotor?
| Back | Home | Forward |© Copyright 1998 Soren Krohn. All rights reserved.
Updated 6 August 2000http://windpower.dk/tour/wtrb/aerodyn2.htm

Rotor AerodynamicsTo study how the wind moves relative to therotor blades of a wind turbine, we have fixedred ribbons to the tip of the rotor blades ofour model wind turbine, and yellow ribbonssome 1/4 out the length of the blade from thehub. We then let the ribbons float freely inthe air (in the cartoon we abstract from theair currents created by the blades themselves,and the centrifugal force).
The two images on this page give you oneview from the side of the turbine, and anotherview from the front of the turbine.
Since most wind turbines have constantrotational speed, the speed with which the tipof the rotor blade moves through the air (thetip speed) is typically some 64 m/s, while atthe centre of the hub it is zero. 1/4 out thelength of the blade, the speed will then be
some 16 m/s.The yellow ribbons close to the hub of the rotor will be blown more
towards the back of the turbine than the red ribbons at the tips of the blades.This is obviously because at the tip of the blades the speed is some 8 timeshigher than the speed of the wind hitting the front of the turbine.
Why are Rotor Blades Twisted?Rotor blades for large wind turbines are always twisted.
Seen from the rotor blade, the wind will be coming from a much steeperangle (more from the general wind direction in the landscape), as you movetowards the root of the blade, and the centre of the rotor.
As you learned on the page on stall, a rotor blade will stop giving lift, if theblade is hit at an angle of attack which is too steep.
Therefore, the rotor blade has to be twisted, so as to acheive an optimalangle of attack throughout the length of the blade. However, in the case ofstall controlled wind turbines in particular, it is important that the blade isbuilt so that it will stall gradually from the blade root and outwards at highwind speeds.
| Back | Home | Forward |© Copyright 2000 Soren Krohn. All rights reserved.
Updated 29 August 2000http://windpower.dk/tour/wtrb/rotor.htm

Rotor Blades
Changing the Wind Speed Changes Wind DirectionRelative to the Rotor BladeIn this next picture we have taken one rotor blade from the previous page offits hub, and we look from the hub towards the tip, at the back side (the leeside) of the rotor blade. The wind in the landscape blows between, say 8 m/sand 16 m/s (from the bottom of the picture), while the tip of the blade rotatestowards the left side of the picture.
In the picture you can see how the angle of attack of the wind changesmuch more dramatically at the root of the blade (yellow line) than at the tipof the blade (red line), as the wind changes. If the wind becomes powerfulenough to make the blade stall, it will start stalling at the root of the blade.
Lift DirectionNow, let us cut the rotor blade at thepoint with the yellow line. In thenext picture the grey arrow showsthe direction of the lift at this point.The lift is perpendicular to thedirection of the wind. As you cansee, the lift pulls the blade partly inthe direction we want, i.e. to the left.It also bends the rotor bladesomewhat, however.

Rotor Blade Profiles (Cross Sections)As you can see, wind turbine rotor blades look a lot like the wings of anaircraft. In fact, rotor blade designers often use classical aircraft wingprofiles as cross sections in the outermost part of the blade.
The thick profiles in the innermost part of the blade, however, are usuallydesigned specifically for wind turbines. Choosing profiles for rotor bladesinvolves a number of compromises including reliable lift and stallcharacteristics, and the profile's ability to perform well even if there is somedirt on the surface (which may be a problem in areas where there is littlerain).
Rotor Blade MaterialsMost modern rotor blades on large wind turbines are made of glass fibrereinforced plastics, (GRP), i.e. glass fibre reinforced polyester or epoxy.
Using carbon fibre or aramid (Kevlar) as reinforcing material is anotherpossibility, but usually such blades are uneconomic for large turbines.
Wood, wood-epoxy, or wood-fibre-epoxy composites have not penetratedthe market for rotor blades, although there is still development going on inthis area. Steel and aluminium alloys have problems of weight and metalfatigue respectively. They are currently only used for very small windturbines.
| Back | Home | Forward |© Copyright 1999 Soren Krohn. All rights reserved.
Updated 6 August 2000http://windpower.dk/tour/wtrb/blades.htm

Power Control of WindTurbinesWind turbines are designed to produce electrical energy as cheaply aspossible. Wind turbines are therefore generally designed so that they yieldmaximum output at wind speeds around 15 metres per second. (30 knots or33 mph). Its does not pay to design turbines that maximise their output atstronger winds, because such strong winds are rare.
In case of stronger winds it is necessary to waste part of the excess energyof the wind in order to avoid damaging the wind turbine. All wind turbinesare therefore designed with some sort of power control. There are twodifferent ways of doing this safely on modern wind turbines.
Pitch Controlled Wind TurbinesOn a pitch controlled wind turbine the turbine'selectronic controller checks the power output of theturbine several times per second. When the poweroutput becomes too high, it sends an order to the bladepitch mechanism which immediately pitches (turns) therotor blades slightly out of the wind. Conversely, theblades are turned back into the wind whenever the winddrops again.
The rotor blades thus have to be able to turn aroundtheir longitudinal axis (to pitch) as shown in the picture.Note, that the picture is exaggerated:
During normal operation the blades will pitch a fraction of a degree at atime - and the rotor will be turning at the same time.
Designing a pitch controlled wind turbine requires some cleverengineering to make sure that the rotor blades pitch exactly the amountrequired. On a pitch controlled wind turbine, the computer will generallypitch the blades a few degrees every time the wind changes in order to keepthe rotor blades at the optimum angle in order to maximise output for allwind speeds.
The pitch mechanism is usually operated using hydraulics.
Stall Controlled Wind Turbines(Passive) stall controlled wind turbines have the rotor blades bolted onto thehub at a fixed angle.
The geometry of the rotor blade profile, however has beenaerodynamically designed to ensure that the moment the wind speedbecomes too high, it creates turbulence on the side of the rotor blade whichis not facing the wind as shown in the picture on the previous page. Thisstall prevents the lifting force of the rotor blade from acting on the rotor.
If you have read the section on aerodynamics and aerodynamics and stall,you will realise that as the actual wind speed in the area increases, the angleof attack of the rotor blade will increase, until at some point it starts to stall.
If you look closely at a rotor blade for a stall controlled wind turbine youwill notice that the blade is twisted slightly as you move along its

longitudinal axis. This is partly done in order to ensure that the rotor bladestalls gradually rather than abruptly when the wind speed reaches its criticalvalue. (Other reasons for twisting the blade are mentioned in the previoussection on aerodynamics).
The basic advantage of stall control is that one avoids moving parts in therotor itself, and a complex control system. On the other hand, stall controlrepresents a very complex aerodynamic design problem, and related designchallenges in the structural dynamics of the whole wind turbine, e.g. toavoid stall-induced vibrations. Around two thirds of the wind turbinescurrently being installed in the world are stall controlled machines.
Active Stall Controlled Wind TurbinesAn increasing number of larger wind turbines (1 MW and up) are beingdeveloped with an active stall power control mechanism.
Technically the active stall machines resemble pitch controlled machines,since they have pitchable blades. In order to get a reasonably large torque(turning force) at low wind speeds, the machines will usually beprogrammed to pitch their blades much like a pitch controlled machine atlow wind speeds. (Often they use only a few fixed steps depending upon thewind speed).
When the machine reaches its rated power, however, you will notice animportant difference from the pitch controlled machines: If the generator isabout to be overloaded, the machine will pitch its blades in the oppositedirection from what a pitch controlled machine does. In other words, it willincrease the angle of attack of the rotor blades in order to make the blades gointo a deeper stall, thus wasting the excess energy in the wind.
One of the advantages of active stall is that one can control the poweroutput more accurately than with passive stall, so as to avoid overshootingthe rated power of the machine at the beginning of a gust of wind. Anotheradvantage is that the machine can be run almost exactly at rated power at allhigh wind speeds. A normal passive stall controlled wind turbine willusually have a drop in the electrical power output for higher wind speeds, asthe rotor blades go into deeper stall.
The pitch mechanism is usually operated using hydraulics or electricstepper motors.
As with pitch control it is largely an economic question whether it isworthwhile to pay for the added complexity of the machine, when the bladepitch mechanism is added.
Other Power Control MethodsSome older wind turbines use ailerons (flaps) to control the power of therotor, just like aircraft use flaps to alter the geometry of the wings to provideextra lift at takeoff.
Another theoretical possibility is to yaw the rotor partly out of the wind todecrease power. This technique of yaw control is in practice used only fortiny wind turbines (1 kW or less), as it subjects the rotor to cyclicallyvarying stress which may ultimately damage the entire structure.

| Back | Home | Forward |© Copyright 1999 Soren Krohn. All rights reserved.
Updated 6 August 2000http://www.windpower.org/tour/wtrb/powerreg.htm

The Wind TurbineYaw MechanismThe wind turbine yaw mechanism is used toturn the wind turbine rotor against the wind.
Yaw ErrorThe wind turbine is said to have a yaw error,if the rotor is not perpendicular to the wind. Ayaw error implies that a lower share of theenergy in the wind will be running throughthe rotor area. (The share will drop to thecosine of the yaw error, for those of you whoknow math).
If this were the only thing that happened,then yaw control would be an excellent wayof controlling the power input to the wind turbine rotor. That part of therotor which is closest to the source direction of the wind, however, will besubject to a larger force (bending torque) than the rest of the rotor. On theone hand, this means that the rotor will have a tendency to yaw against thewind automatically, regardless of whether we are dealing with an upwind ora downwind turbine. On the other hand, it means that the blades will bebending back and forth in a flapwise direction for each turn of the rotor.Wind turbines which are running with a yaw error are therefore subject tolarger fatigue loads than wind turbines which are yawed in a perpendiculardirection against the wind.
Photograph© 1998 Soren Krohn
Yaw MechanismAlmost all horizontal axis windturbines use forced yawing,i.e. they use a mechanismwhich uses electric motors andgearboxes to keep the turbineyawed against the wind.
The image shows the yawmechanism of a typical 750kW machine seen from below,looking into the nacelle. Wecan see the yaw bearing
around the outer edge, and the wheels from the yaw motors and the yawbrakes inside. Almost all manufacturers of upwind machines prefer to brakethe yaw mechanism whenever it is unused. The yaw mechanism is activatedby the electronic controller which several times per second checks theposition of the wind vane on the turbine, whenever the turbine is running.

Cable Twist CounterCables carry the currentfrom the wind turbinegenerator down through thetower. The cables, however,will become more and moretwisted if the turbine byaccident keeps yawing inthe same direction for along time. The wind turbineis therefore equipped with acable twist counter whichtells the controller that it is time to untwist the cables.
Occasionally you may therefore see a wind turbine which looks like it hasgone berserk, yawing continuously in one direction for five revolutions.
Like other safety equipment in the turbine there is redundancy in thesystem. In this case the turbine is also equipped with a pull switch which isactivated if the cables become too twisted.
| Back | Home | Forward |© Copyright 1999 Soren Krohn. All rights reserved.
Updated 6 August 2000http://www.windpower.org/tour/wtrb/yaw.htm

Wind Turbine TowersWind turbine towers,
Navarra, SpainPhotograph
© 1999 Soren Krohn
The tower of the wind turbine carries the nacelle and the rotor.Towers for large wind turbines may be either tubular steel towers, lattice
towers, or concrete towers. Guyed tubular towers are only used for smallwind turbines (battery chargers etc.)
Tubular Steel TowersMost large wind turbines aredelivered with tubular steel towers,which are manufactured in sectionsof 20-30 metres with flanges ateither end, and bolted together onthe site. The towers are conical (i.e.with their diameter increasingtowards the base) in order toincrease their strength and to savematerials at the same time.Photograph © NEG-Micon A/S 1998

Lattice TowersLattice towers are manufactured using welded steelprofiles. The basic advantage of lattice towers is cost,since a lattice tower requires only half as muchmaterial as a freely standing tubular tower with asimilar stiffness. The basic disadvantage of latticetowers is their visual appearance, (although that issueis clearly debatable). Be that as it may, for aestheticreasons lattice towers have almost disappeared fromuse for large, modern wind turbines.Photograph © Nordex A/S 1998
Guyed Pole TowersMany small wind turbines are built withnarrow pole towers supported by guy wires.The advantage is weight savings, and thuscost. The disadvantages are difficult accessaround the towers which make them lesssuitable in farm areas. Finally, this type oftower is more prone to vandalism, thuscompromising overall safety.Photograph © Soren Krohn 1999
Hybrid Tower SolutionsSome towers are made in differentcombinations of the techniquesmentioned above. One example isthe three-legged Bonus 95 kWtower which you see in thephotograph, which may be said tobe a hybrid between a lattice towerand a guyed tower.Photograph © Bonus Energy A/S 1998

Cost ConsiderationsThe price of a tower for a wind turbine is generally around 20 per cent of thetotal price of the turbine. For a tower around 50 metres' height, theadditional cost of another 10 metres of tower is about 15,000 USD. It istherefore quite important for the final cost of energy to build towers asoptimally as possible.
Lattice towers are the cheapest to manufacture, since they typically requireabout half the amount of steel used for a tubular steel tower.
Aerodynamic ConsiderationsGenerally, it is an advantage to have a tall tower in areas with high terrainroughness, since the wind speeds increases farther away from the ground, aswe learned on the page about wind shear.
Lattice towers and guyed pole towers have the advantage of giving lesswind shade than a massive tower.
Structural Dynamic ConsiderationsThe rotor blades on turbines with relatively short towers will be subject tovery different wind speeds (and thus different bending) when a rotor blade isin its top and in its bottom position, which will increase the fatigue loads onthe turbine.
Choosing Between Low and Tall TowersObviously, you get more energy from a larger wind turbine than a small one,but if you take a look at the three wind turbines below, which are 225 kW,600 kW, and 1,500 kW respectively, and with rotor diameters of 27, 43, and60 metres, you will notice that the tower heights are different as well.

Clearly, we cannot sensibly fit a 60 metre rotor to a tower of less than 30metres. But if we consider the cost of a large rotor and a large generator andgearbox, it would surely be a waste to put it on a small tower, because weget much higher wind speeds and thus more energy with a tall tower. (Seethe section on wind resources). Each metre of tower height costs money, ofcourse, so the optimum height of the tower is a function of
tower costs per metre (10 metre extra tower will presently cost youabout 15,000 USD)
1.
how much the wind locally varies with the height above groundlevel, i.e. the average local terrain roughness (large roughness makesit more useful with a taller tower),
2.
the price the turbine owner gets for an additional kilowatt hour ofelectricity.
3.
Manufacturers often deliver machines where the tower height is equal to therotor diameter. aesthetically, many people find that turbines are morepleasant to look at, if the tower height is roughly equal to the rotor diameter.
Occupational Safety ConsiderationsThe choice of tower type has consequences for occupational safety: This isdiscussed in detail on the page on Wind Turbines and Occupational Safety.
| Back | Home | Forward |© Copyright 2000 Soren Krohn. All rights reserved.
Updated 9 September 2000http://www.windpower.org/tour/wtrb/tower.htm

You can see the internalcooling fan moving inside thisgenerator. It is mounted atthe end of the rotor, whichis hidden inside the shiningmagnetic steel cylinder, calledthe stator. The radiator-likesurface cools the generator.
It is hard to see the detailson a real life generator likethe one to the right.
Therefore, we'll take it apartand make some simplifiedmodels on the next pages.
Wind Turbine GeneratorsThe wind turbinegenerator convertsmechanical energyto electrical energy.
Wind turbinegenerators are a bitunusual, comparedto other generatingunits you ordinarilyfind attached to theelectrical grid. Onereason is that thegenerator has towork with a powersource (the windturbine rotor) whichsupplies very
fluctuating mechanical power (torque).These pages assumes that you are familiar with the basics of electricity,
electromagnetism, and in particular alternating current. If any of theexpressions volt (V), phase, three phase, frequency, or Hertz (Hz) soundstrange to you, you should take a look at the Reference Manual onElectricity, and read about alternating current, three phase alternatingcurrent, electromagnetism, and induction, before you proceed with thefollowing pages.
Generating Voltage (tension)On large wind turbines (above 100-150 kW) the voltage (tension) generatedby the turbine is usually 690 V three-phase alternating current (AC). Thecurrent is subsequently sent through a transformer next to the wind turbine(or inside the tower) to raise the voltage to somewhere between 10,000 and30,000 volts, depending on the standard in the local electrical grid.
Large manufacturers will supply both 50 Hz wind turbine models (for theelectrical grids in most of the world) and 60 Hz models (for the electricalgrid in America).
Cooling SystemGenerators need cooling while they work. On most turbines this isaccomplished by encapsulating the generator in a duct, using a large fan forair cooling, but a few manufacturers use water cooled generators. Watercooled generators may be built more compactly, which also gives someelectrical efficiency advantages, but they require a radiator in the nacelle toget rid of the heat from the liquid cooling system.

Starting and Stopping the GeneratorIf you connected (or disconnected) a large wind turbine generator to the gridby flicking an ordinary switch, you would be quite likely to damage both thegenerator, the gearbox and the current in the grid in the neighbourhood.
You will learn how turbine designers deal with this challenge in the pageon Power Quality Issues, later.
Design Choices in Generators and Grid ConnectionWind turbines may be designed with either synchronous or asynchronousgenerators, and with various forms of direct or indirect grid connection ofthe generator.
Direct grid connection mean that the generator is connected directly to the(usually 3-phase) alternating current grid.
Indirect grid connection means that the current from the turbine passesthrough a series of electric devices which adjust the current to match that ofthe grid. With an asynchronous generator this occurs automatically.
| Back | Home | Forward |© Copyright 2000 Soren Krohn. All rights reserved.
Updated 6 August 2000http://www.windpower.org/tour/wtrb/electric.htm
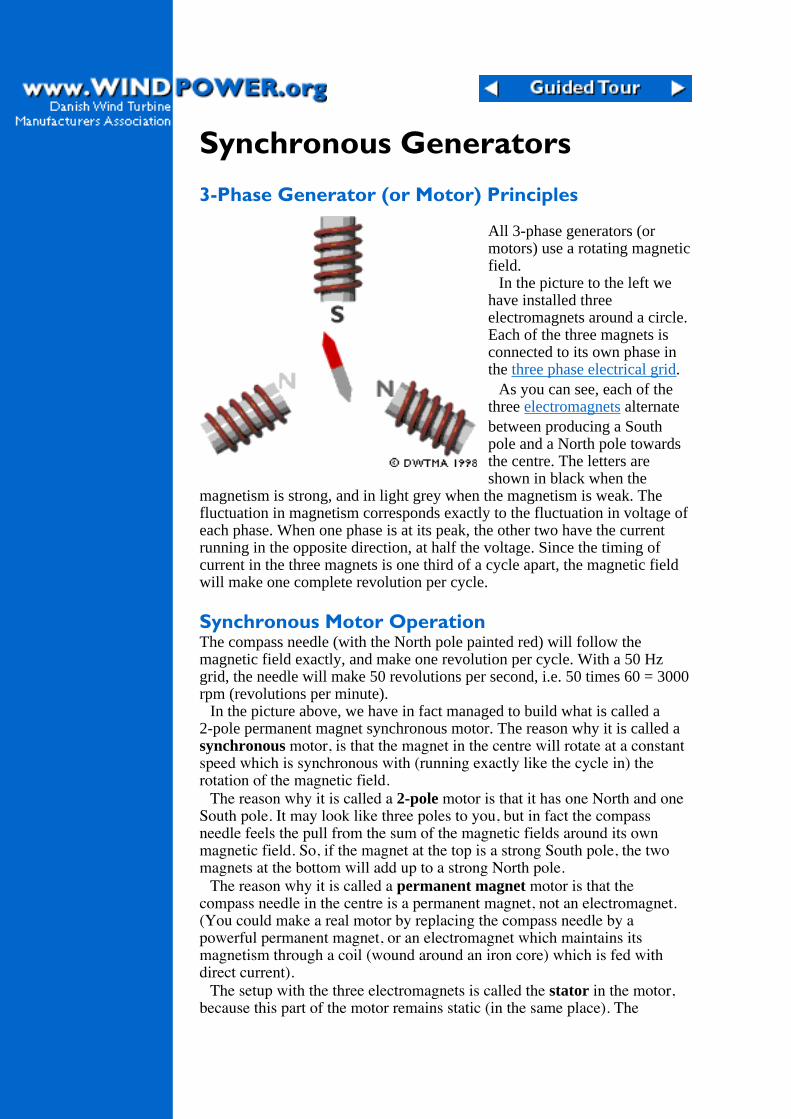
Synchronous Generators
3-Phase Generator (or Motor) Principles
All 3-phase generators (ormotors) use a rotating magneticfield.
In the picture to the left wehave installed threeelectromagnets around a circle.Each of the three magnets isconnected to its own phase inthe three phase electrical grid.
As you can see, each of thethree electromagnets alternatebetween producing a Southpole and a North pole towardsthe centre. The letters areshown in black when the
magnetism is strong, and in light grey when the magnetism is weak. Thefluctuation in magnetism corresponds exactly to the fluctuation in voltage ofeach phase. When one phase is at its peak, the other two have the currentrunning in the opposite direction, at half the voltage. Since the timing ofcurrent in the three magnets is one third of a cycle apart, the magnetic fieldwill make one complete revolution per cycle.
Synchronous Motor OperationThe compass needle (with the North pole painted red) will follow themagnetic field exactly, and make one revolution per cycle. With a 50 Hzgrid, the needle will make 50 revolutions per second, i.e. 50 times 60 = 3000rpm (revolutions per minute).
In the picture above, we have in fact managed to build what is called a2-pole permanent magnet synchronous motor. The reason why it is called asynchronous motor, is that the magnet in the centre will rotate at a constantspeed which is synchronous with (running exactly like the cycle in) therotation of the magnetic field.
The reason why it is called a 2-pole motor is that it has one North and oneSouth pole. It may look like three poles to you, but in fact the compassneedle feels the pull from the sum of the magnetic fields around its ownmagnetic field. So, if the magnet at the top is a strong South pole, the twomagnets at the bottom will add up to a strong North pole.
The reason why it is called a permanent magnet motor is that thecompass needle in the centre is a permanent magnet, not an electromagnet.(You could make a real motor by replacing the compass needle by apowerful permanent magnet, or an electromagnet which maintains itsmagnetism through a coil (wound around an iron core) which is fed withdirect current).
The setup with the three electromagnets is called the stator in the motor,because this part of the motor remains static (in the same place). The

compass needle in the centre is called the rotor, obviously because it rotates.
Synchronous Generator OperationIf you start forcing the magnet around (instead of letting the current from thegrid move it), you will discover that it works like a generator, sendingalternating current back into the grid. (You should have a more powerfulmagnet to produce much electricity). The more force (torque) you apply, themore electricity you generate, but the generator will still run at the samespeed dictated by the frequency of the electrical grid.
You may disconnect the generator completely from the grid, and start yourown private 3-phase electricity grid, hooking your lamps up to the threecoils around the electromagnets. (Remember the principle of magnetic /electrical induction from the reference manual section of this web site). Ifyou disconnect the generator from the main grid, however, you will have tocrank it at a constant rotational speed in order to produce alternating currentwith a constant frequency. Consequently, with this type of generator youwill normally want to use an indirect grid connection of the generator.
In practice, permanent magnet synchronous generators are not used verymuch. There are several reasons for this. One reason is that permanentmagnets tend to become demagnetised by working in the powerful magneticfields inside a generator. Another reason is that powerful magnets (made ofrare earth metals, e.g. Neodynium) are quite expensive, even if prices havedropped lately.
Wind Turbines With Synchronous GeneratorsWind turbines which use synchronous generators normally useelectromagnets in the rotor which are fed by direct current from theelectrical grid. Since the grid supplies alternating current, they first have toconvert alternating current to direct current before sending it into the coilwindings around the electromagnets in the rotor.
The rotor electromagnets are connected to the current by using brushes andslip rings on the axle (shaft) of the generator.
| Back | Home | Forward |© Copyright 1998 Soren Krohn. All rights reserved.
Updated 6 August 2000http://www.windpower.org/tour/wtrb/syncgen.htm

Changing Generator RotationalSpeed
A Four Pole Generator
The speed of a generator (ormotor) which is directlyconnected to a three-phase gridis constant, and dictated by thefrequency of the grid, as welearned on the previous page.
If you double the number ofmagnets in the stator, however,you can ensure that themagnetic field rotates at halfthe speed.
In the picture to the left, yousee how the magnetic field nowmoves clockwise for half arevolution before it reaches thesame magnetic pole as before.We have simply connected thesix magnets to the three phases
in a clockwise order.This generator (or motor) has four poles at all times, two South and two
North. Since a four pole generator will only take half a revolution per cycle,it will obviously make 25 revolutions per second on a 50 Hz grid, or 1500revolutions per minute (rpm).
When we double the number of poles in the stator of a synchronousgenerator we will have to double the number of magnets in the rotor, as yousee on the picture. Otherwise the poles will not match. (We could use to twobent "horseshoe" magnets in this case).
Other Numbers of PolesObviously, we could repeat what we just did, and introduce another pair ofpoles, by adding 3 more electromagnets to the stator. With 9 magnets we geta 6 pole machine, which will run at 1000 rpm on a 50 Hz grid. The generalresult is the following:

Synchronous Generator Speeds (rpm)Pole number 50 Hz 60 Hz
2 3000 36004 1500 18006 1000 12008 750 90010 600 72012 500 600
The term "synchronous generator speed" thus refers to the speed of thegenerator when it is running synchronously with the grid frequency. Itapplies to all sorts of generators, however: In the case of asynchronous(induction) generators it is equivalent to the idle speed of the generator.
High or Low Speed Generators?Most wind turbines use generators with four or six poles. The reasons forusing these relatively high-speed generators are savings on size and cost.
The maximum force (torque) a generator can handle depends on the rotorvolume. For a given power output you then have the choice between aslow-moving, large (expensive) generator, or a high-speed (cheaper) smallergenerator.
| Back | Home | Forward |© Copyright 1998 Soren Krohn. All rights reserved.
Updated 6 August 2000http://www.windpower.org/tour/wtrb/genpoles.htm

The picture to the rightillustrates the basic principlesin the asynchronousgenerator, much as we saw itpresented on the previouspages.
In reality, only the rotorpart looks different, as youwill see on the this page.
Asynchronous (Induction)Generators
Note: Before reading this page, youshould have completed the previousthree pages on Wind TurbineGenerators.
Most wind turbines in the world use aso-called three phase asynchronous(cage wound) generator, also called aninduction generator to generatealternating current. This type ofgenerator is not widely used outsidethe wind turbine industry, and in smallhydropower units, but the world has alot of experience in dealing with it
anyway:The curious thing about this type of generator is that it was really
originally designed as an electric motor. In fact, one third of the world'selectricity consumption is used for running induction motors drivingmachinery in factories, pumps, fans, compressors, elevators, and otherapplications where you need to convert electrical energy to mechanicalenergy.
One reason for choosing this type of generator is that it is very reliable,and tends to be comparatively inexpensive. The generator also has somemechanical properties which are useful for wind turbines. (Generator slip,and a certain overload capability).
The key component of theasynchronous generator isthe cage rotor.
(It used to be called asquirrel cage rotor butafter it became politicallyincorrect to exercise yourdomestic rodents in atreadmill, we only have thisless captivating name).
The Cage RotorIt is the rotor that makes theasynchronous generatordifferent from the synchronousgenerator. The rotor consistsof a number of copper oraluminium bars which areconnected electrically byaluminium end rings, as yousee in the picture to the left.
In the picture at the top ofthe page you see how the rotor
is provided with an "iron" core, using a stack of thin insulated steellaminations, with holes punched for the conducting aluminium bars. Therotor is placed in the middle of the stator, which in this case, once again, is a4-pole stator which is directly connected to the three phases of the electricalgrid.

Motor OperationWhen the current is connected, the machine will start turning like a motor ata speed which is just slightly below the synchronous speed of the rotatingmagnetic field from the stator. Now, what is happening?
If we look at the rotor barsfrom above (in the picture tothe right) we have a magneticfield which moves relative tothe rotor. This induces a verystrong current in the rotor barswhich offer very littleresistance to the current, sincethey are short circuited by theend rings.
The rotor then develops its own magnetic poles, which in turn becomedragged along by the electromagnetic force from the rotating magnetic fieldin the stator.
Generator OperationNow, what happens if we manually crank this rotor around at exactly thesynchronous speed of the generator, e.g. 1500 rpm (revolutions per minute),as we saw for the 4-pole synchronous generator on the previous page? Theanswer is: Nothing. Since the magnetic field rotates at exactly the samespeed as the rotor, we see no induction phenomena in the rotor, and it willnot interact with the stator.
But what if we increase speed above 1500 rpm? In that case the rotormoves faster than the rotating magnetic field from the stator, which meansthat once again the stator induces a strong current in the rotor. The harderyou crank the rotor, the more power will be transferred as anelectromagnetic force to the stator, and in turn converted to electricity whichis fed into the electrical grid.
Generator SlipThe speed of the asynchronous generator will vary with the turning force(moment, or torque) applied to it. In practice, the difference between therotational speed at peak power and at idle is very small, about 1 per cent.This difference in per cent of the synchronous speed, is called the generator'sslip. Thus a 4-pole generator will run idle at 1500 rpm if it is attached to agrid with a 50 Hz current. If the generator is producing at its maximumpower, it will be running at 1515 rpm.
It is a very useful mechanical property that the generator will increase ordecrease its speed slightly if the torque varies. This means that there will beless tear and wear on the gearbox. (Lower peak torque). This is one of themost important reasons for using an asynchronous generator rather than asynchronous generator on a wind turbine which is directly connected to theelectrical grid.
Automatic Pole Adjustment of the RotorDid you notice that we did not specify the number of poles in the statorwhen we described the rotor? The clever thing about the cage rotor is that itadapts itself to the number of poles in the stator automatically. The samerotor can therefore be used with a wide variety of pole numbers.

Grid Connection RequiredOn the page about the permanent magnet synchronous generator we showedthat it could run as a generator without connection to the public grid.
An asynchronous generator is different, because it requires the stator to bemagnetised from the grid before it works.
You can run an asynchronous generator in a stand alone system, however,if it is provided with capacitors which supply the necessary magnetisationcurrent. It also requires that there be some remanence in the rotor iron, i.e.some leftover magnetism when you start the turbine. Otherwise you willneed a battery and power electronics, or a small diesel generator to start thesystem).
| Back | Home | Forward |© Copyright 1998 Soren Krohn. All rights reserved.
Updated 6 August 2000http://www.windpower.org/tour/wtrb/async.htm

Very Like a WhaleIn reality, the stator of agenerator consists of a verylarge number ofelectromagnets.
Changing theNumber ofGenerator
PolesYou may be thinking that a statorwith twice as many magnets wouldbe twice as expensive, but that is notreally the case. Generators (andmotors) are usually made with avery large number of stator magnetsanyway, as you see in the picture.(We have not yet added the statorcoil windings on the iron).
The reason for this statorarrangement is that we wish tominimise the air gap between the
rotor and the stator. At the the same time we need to provide cooling of themagnets. The stator iron in reality consists of a large number of thin (0.5mm) insulated steel sheets which are stacked to form the stator iron. Thislayering is done to prevent current eddies in the stator iron from decreasingthe efficiency of the generator.
The problem of providing more generator poles on an asynchronous cagewound generator then really boils down to connecting the neighbouringmagnets differently: Either we take a bunch of magnets at a time, connectingthem to the same phase as we move around the stator, or else we change tothe next phase every time we get to the next magnet.
Two Speed, Pole Changing GeneratorsSome manufacturers fit their turbines with two generators, a small one forperiods of low winds, and a large one for periods of high winds.
A more common design on newer machines is pole changing generators,i.e. generators which (depending on how their stator magnets are connected)may run with a different number of poles, and thus a different rotationalspeed.
Some electrical generators are custom built as two-in-one, i.e. they are ableto run as e.g. either 150 kW or 600 kW generators, and at two differentspeeds. This design has become ever more widespread throughout theindustry.
Whether it is worthwhile to use a double generator or a higher number ofpoles for low winds depends on the local wind speed distribution, and theextra cost of the pole changing generator compared to the price the turbineowner gets for the electricity. (You should keep in mind that the energycontent of low winds is very small).
A good reason for having a dual generator system, however, is that you

may run your turbine at a lower rotational speed at low wind speeds. This isboth more efficient (aerodynamically), and it means less noise from the rotorblades (which is usually only a problem at low wind speeds).
Incidentally, you may have a few pole changing motors in your housewithout even knowing it: Washing machines which can also spin dry clothesusually have pole changing motors which are able to run at low speed forwashing and at high speed for spinning. Similarly, exhaust fans in yourkitchen may be built for two or three different speeds. (In the latter case witha variable speed fan, you can use what you have learned about the energy inthe wind: If you want to move twice as much air out of your house perminute using the same fan, it will cost you eight times as much electricity).
| Back | Home | Forward |© Copyright 1998 Soren Krohn. All rights reserved.
Updated 6 August 2000http://www.windpower.org/tour/wtrb/stator.htm
Variable Slip Generators forWind TurbinesManufacturers of electric motors have for many years been faced with theproblem that their motors can only run at certain almost fixed speedsdetermined by the number of poles in the motor.
As we learned on the previous page, the motor (or generator) slip in anasynchronous (induction) machine is usually very small for reasons ofefficiency, so the rotational speed will vary with around 1 per cent betweenidle and full load.
The slip, however is a function of the (DC) resistance (measured in ohms)in the rotor windings of the generator. The higher resistance, the higher theslip. so one way of varying the slip is to vary the resistance in the rotor. Inthis way one may increase generator slip to e.g. 10 per cent.
On motors, this is usually done by having a wound rotor, i.e. a rotor withcopper wire windings which are connected in a star, and connected withexternal variable resistors, plus an electronic control system to operate theresistors. The connection has usually been done with brushes and slip rings,which is a clear drawback over the elegantly simple technical design of ancage wound rotor machine. It also introduces parts which wear down in thegenerator, and thus the generator requires extra maintenance.
Opti Slip ®An interesting variation of the variable slip induction generator avoids theproblem of introducing slip rings, brushes, external resistors, andmaintenance altogether.
By mounting the external resistors on the rotor itself, and mounting theelectronic control system on the rotor as well, you still have the problem ofhow to communicate the amount of slip you need to the rotor. Thiscommunication can be done very elegantly, however, using optical fibrecommunications, and sending the signal across to the rotor electronics eachtime it passes a stationary optical fibre.
Running a Pitch Controlled Turbine at VariableSpeedAs mentioned on the next page, there are a number of advantages of beingable to run a wind turbine at variable speed.
One good reason for wanting to be able to run a turbine partially atvariable speed is the fact that pitch control (controlling the torque in ordernot to overload the gearbox and generator by pitching the wind turbineblades) is a mechanical process. This means that the reaction time for thepitch mechanism becomes a critical factor in turbine design.
If you have a variable slip generator, however, you may start increasing itsslip once you are close to the rated power of the turbine. The control strategyapplied in a widely used Danish turbine design (600 kW and up) is to run thegenerator at half of its maximum slip when the turbine is operating near therated power. When a wind gust occurs, the control mechanism signals to

increase generator slip to allow the rotor to run a bit faster while the pitchmechanism begins to cope with the situation by pitching the blades more outof the wind. Once the pitch mechanism has done its work, the slip isdecreased again. In case the wind suddenly drops, the process is applied inreverse.
Although these concepts may sound simple, it is quite a technicalchallenge to ensure that the two power control mechanisms co-operateefficiently.
Improving Power QualityYou may protest that running a generator at high slip releases more heatfrom the generator, which runs less efficiently. That is not a problem initself, however, since the only alternative is to waste the excess wind energyby pitching the rotor blades out of the wind.
One of the real benefits of using the control strategy mentioned here is thatyou get a better power quality, since the fluctuations in power output are"eaten up" or "topped up" by varying the generator slip and storing orreleasing part of the energy as rotational energy in the wind turbine rotor.
| Back | Home | Forward |© Copyright 1998 Soren Krohn. All rights reserved.
Updated 6 August 2000http://www.windpower.org/tour/wtrb/varislip.htm

Indirect Grid Connection ofWind Turbines
Generating Alternating Current (AC)at Variable FrequencyMost wind turbines run at almost constant speed with direct grid connection.With indirect grid connection, however, the wind turbine generator runs inits own, separate mini AC-grid, as illustrated in the graphic. This grid iscontrolled electronically (using an inverter), so that the frequency of thealternating current in the stator of the generator may be varied. In this way itis possible to run the turbine at variable rotational speed. Thus the turbinewill generate alternating current at exactly the variable frequency applied tothe stator.
The generator may be either a synchronous generator or an asynchronousgenerator, and the turbine may have a gearbox, as in the image above, or runwithout a gearbox if the generator has many poles, as explained on the nextpage.
Conversion to Direct Current (DC)AC current with a variable frequency cannot be handled by the publicelectrical grid. We therefore start by rectifying it, i.e. we convert it intodirect current, DC. The conversion from variable frequency AC to DC canbe done using thyristors or large power transistors.
Conversion to Fixed Frequency ACWe then convert the (fluctuating) direct current to an alternating current(using an inverter) with exactly the same frequency as the public electricalgrid. This conversion to AC in the inverter can also be done using eitherthyristors or transistors.
Thyristors or power transistors are large semiconductor switches thatoperate without mechanical parts. The kind of alternating current one getsout of an inverter looks quite ugly at first sight - nothing like the smoothsinusoidal curve we learned about when studying alternating current.Instead, we get a series of sudden jumps in the voltage and current, as yousaw in the animation above.

Filtering the ACThe rectangular shaped waves can be smoothed out, however, usingappropriate inductances and capacitors, in a so-called AC filter mechanism.The somewhat jagged appearance of the voltage does not disappearcompletely, however, as explained below.
Advantages of Indirect Grid Connection:Variable SpeedThe advantage of indirect grid connection is that it is possible to run thewind turbine at variable speed.
The primary advantage is that gusts of wind can be allowed to make therotor turn faster, thus storing part of the excess energy as rotational energyuntil the gust is over. Obviously, this requires an intelligent control strategy,since we have to be able to differentiate between gusts and higher windspeed in general. Thus it is possible to reduce the peak torque (reducingwear on the gearbox and generator), and we may also reduce the fatigueloads on the tower and rotor blades.
The secondary advantage is that with power electronics one may controlreactive power (i.e. the phase shifting of current relative to voltage in the ACgrid), so as to improve the power quality in the electrical grid. This may beuseful, particularly if a turbine is running on a weak electrical grid.
Theoretically, variable speed may also give a slight advantage in terms ofannual production, since it is possible to run the machine at an optimalrotational speed, depending on the wind speed. From an economic point ofview that advantage is so small, however, that it is hardly worth mentioning.
Disadvantages of Indirect Grid ConnectionThe basic disadvantage of indirect grid connection is cost. As we justlearned, the turbine will need a rectifier and two inverters, one to control thestator current, and another to generate the output current. Presently, it seemsthat the cost of power electronics exceeds the gains to be made in buildinglighter turbines, but that may change as the cost of power electronicsdecreases. Looking at operating statistics from wind turbines using powerelectronics (published by the the German ISET Institute), it also seems thatavailability rates for these machines tend to be somewhat lower thanconventional machines, due to failures in the power electronics.
Other disadvantages are the energy lost in the AC-DC-AC conversionprocess, and the fact that power electronics may introduce harmonicdistortion of the alternating current in the electrical grid, thus reducingpower quality. The problem of harmonic distortion arises because thefiltering process mentioned above is not perfect, and it may leave some"overtones" (multiples of the grid frequency) in the output current.
| Back | Home | Forward |© Copyright 1998 Soren Krohn. All rights reserved.
Updated 6 August 2000http://www.windpower.org/tour/wtrb/indirect.htm

Gearboxes forWind Turbines
Why Use a Gearbox?The power from the rotation of the windturbine rotor is transferred to thegenerator through the power train, i.e.through the main shaft, the gearbox and the high speed shaft, as we saw onthe page with the Components of a Wind Turbine.
But why use a gearbox? Couldn't we just drive the generator directly withthe power from the main shaft?
If we used an ordinary generator, directly connected to a 50 Hz AC(alternating current) three phase grid with two, four, or six poles, we wouldhave to have an extremely high speed turbine with between 1000 and 3000revolutions per minute (rpm), as we can see in the page on ChangingGenerator Rotational Speed. With a 43 metre rotor diameter that wouldimply a tip speed of the rotor of far more than twice the speed of sound, sowe might as well forget it.
Another possibility is to build a slow-moving AC generator with manypoles. But if you wanted to connect the generator directly to the grid, youwould end up with a 200 pole generator (i.e. 300 magnets) to arrive at areasonable rotational speed of 30 rpm.
Another problem is, that the mass of the rotor of the generator has to beroughly proportional to the amount of torque (moment, or turning force) ithas to handle. So a directly driven generator will be very heavy (andexpensive) in any case.
Less Torque, More SpeedThe practical solution, which is used in the opposite direction in lots ofindustrial machinery, and in connection with car engines is to use a gearbox.With a gearbox you convert between slowly rotating, high torque powerwhich you get from the wind turbine rotor - and high speed, low torquepower, which you use for the generator.
The gearbox in a wind turbine does not "change gears". It normally has asingle gear ratio between the rotation of the rotor and the generator. For a600 or 750 kW machine, the gear ratio is typically approximately 1 to 50.
The picture below shows a 1.5 MW gearbox for a wind turbine. Thisparticular gearbox is somewhat unusual, since it has flanges for twogenerators on the high speed side (to the right). The orange gadgets justbelow the generator attachments to the right are the hydraulically operatedemergency disc brakes. In the background you see the lower part of a nacellefor a 1.5 MW turbine.

| Back | Home | Forward |© Copyright 2000 Soren Krohn. All rights reserved.
Updated 25 October 2000http://www.windpower.org/tour/wtrb/powtrain.htm

The Electronic Wind TurbineController
The wind turbine controller consists of anumber of computers whichcontinuously monitor the condition ofthe wind turbine and collect statistics onits operation. As the name implies, thecontroller also controls a large number ofswitches, hydraulic pumps, valves, andmotors within the wind turbine.
As wind turbine sizes increase tomegawatt machines, it becomes evenmore important that they have a highavailability rate, i.e. that they functionreliably all the time.
Communicating with theOutside WorldThe controller communicates with theowner or operator of the wind turbine viaa communications link, e.g. sendingalarms or requests for service over the
telephone or a radio link. It is also possible to call the wind turbine to collectstatistics, and check its present status. In wind parks one of the turbines willusually be equipped with a PC from which it is possible to control andcollect data from the rest of the wind turbines in the park. This PC can becalled over a telephone line or a radio link.
Internal CommunicationsThere is usually a controller both at the bottom of the towerand in the nacelle. On recent wind turbine models, thecommunication between the controllers is usually doneusing fibre optics. The image to the right shows a fibreoptics communications unit. On some recent models, thereis a third controller placed in the hub of the rotor. That unitusually communicates with the nacelle unit using serialcommunications through a cable connected with slip ringsand brushes on the main shaft.
Fail Safe Mechanisms and RedundancyComputers and sensors are usually duplicated (redundant) in all safety oroperation sensitive areas of newer, large machines. The controllercontinuously compares the readings from measurements throughout thewind turbine to ensure that both the sensors and the computers themselvesare OK. The picture at the top of the page shows the controller of amegawatt machine, and has two central computers. (We removed the cover

on one of the two computers to show the electronics).
What is Monitored?It is possible to monitor or set somewhere between 100 and 500 parametervalues in a modern wind turbine. The controller may e.g. check therotational speed of the rotor, the generator, its voltage and current. Inaddition, lightning strikes and their charge may be registered. Furthermoremeasurements may be made of of outside air temperature, temperature in theelectronic cabinets, oil temperature in the gearbox, the temperature of thegenerator windings, the temperature in the gearbox bearings, hydraulicpressure, the pitch angle of each rotor blade (for pitch controlled or activestall controlled machines), the yaw angle (by counting the number of teethon yaw wheel), the number of power cable twists, wind direction, windspeed from the anemometer, the size and frequency of vibrations in thenacelle and the rotor blades, the thickness of the brake linings, whether thetower door is open or closed (alarm system).
Control StrategiesMany of the business secrets of the wind turbine manufacturers are to befound in the way the controller interacts with the wind turbine components.Improved control strategies are responsible for an important part of theincrease in wind turbine productivity in recent years.
An interesting strategy pursued by some manufacturers is to adapt theoperational strategy to the local wind climate. In this way it may e.g. bepossible to minimise uneconomic tear and wear on the machine during (rare)periods of rough weather.
| Back | Home | Forward |© Copyright 2000 Soren Krohn. All rights reserved.
Updated 6 August 2000http://www.windpower.org/tour/wtrb/control.htm

Controlling Power Quality fromWind Turbines
Most people think of the controller asthe unit which runs the wind turbine,e.g. yaws it against the wind, checksthat the safety systems are OK, andstarts the turbine.
The controller does indeed do allthese things, but it also looks after thepower quality of the current generatedby the wind turbine.
Grid Connection andPower QualityIn the section about power quality youwill learn how electricity companiesrequire that wind turbines connect"softly" to the grid, and how they havecertain requirements that thealternating current and voltage move instep with one another.
The image to the right shows the highvoltage section of a controller for a megawatt machine. This part of thecontroller operates e.g. the thyristors which ensure soft coupling to theelectrical grid.
Reactive Power ControlVoltage and current are typically measured 128 timesper alternating current cycle, (i.e. 50 x 128 times persecond or 60 x 128 times per second, depending on theelectrical grid frequency). On this basis, a so calledDSP processor calculates the stability of the gridfrequency and the active and reactive power of theturbine. (The reactive power component is basically aquestion of whether the voltage and the current are inphase or not).
In order to ensure the proper power quality, thecontroller may switch on or switch off a large numberof electrical capacitors which adjust the reactivepower, (i.e. the phase angle between the voltage andthe current). As you can see in the image to the left, theswitchable capacitor bank is quite a large control unitin itself in a megawatt sized machine.

Electromagnetic Compatibility (EMC)There are very powerfulelectromagnetic fields around powercables and generators in a wind turbine.This means that the electronics in thecontroller system has to be insensitiveto electromagnetic fields.
Conversely, the electronics shouldnot emit electromagnetic radiationwhich can inhibit the functioning ofother electronic equipment. The imageto the left shows a radiation free room
with metal walls in the laboratory of one of the largest wind turbinecontroller manufacturers. The equipment in the room is used to measureelectromagnetic emissions from the components of the controllers.
| Back | Home | Forward |© Copyright 2000 Soren Krohn. All rights reserved.
Updated 6 August 2000http://www.windpower.org/tour/wtrb/control2.htm

Size of Wind Turbines
Service crew working on a32 m rotor blade on a1.5 MW wind turbine
Photograph© 2000 Christian Kjaer
Power Output Increases with the Swept Rotor AreaWhen a farmertells you howmuch land he isfarming, he willusually state anarea in terms ofhectares or acres.With a windturbine it ismuch the samestory, thoughdoing windfarming we farma vertical areainstead of ahorizontal one.
The area of thedisc covered bythe rotor, (andwind speeds, ofcourse), determines how much energy we can harvest in a year.
The picture gives you an idea of the normal rotor sizes of wind turbines: Atypical turbine with a 600 kW electrical generator will typically have a rotordiameter of some 44 metres (144 ft.). If you double the rotor diameter, youget an area which is four times larger (two squared). This means that youalso get four times as much power output from the rotor.
Rotor diameters may vary somewhat from the figures given above,because many manufacturers optimise their machines to local windconditions: A larger generator, of course, requires more power (i.e. strong

winds) to turn at all. So if you install a wind turbine in a low wind area youwill actually maximise annual output by using a fairly small generator for agiven rotor size (or a larger rotor size for a given generator) For a 600 kWmachine rotor diameters may vary from 39 to 48 m (128 to 157 ft.) Thereason why you may get more output from a relatively smaller generator in alow wind area is that the turbine will be running more hours during the year.
Reasons for Choosing Large TurbinesThere are economies of scale in wind turbines, i.e. larger machinesare usually able to deliver electricity at a lower cost than smallermachines. The reason is that the cost of foundations, road building,electrical grid connection, plus a number of components in theturbine (the electronic control system etc.), are somewhatindependent of the size of the machine.
1.
Larger machines are particularly well suited for offshore windpower. The cost of foundations does not rise in proportion to the sizeof the machine, and maintenance costs are largely independent of thesize of the machine.
2.
In areas where it is difficult to find sites for more than a singleturbine, a large turbine with a tall tower uses the existing windresource more efficiently.
3.
You may take a look at some megawatt-sized wind turbines in the picturegallery.
Reasons for Choosing Smaller TurbinesThe local electrical grid may be too weak to handle the electricityoutput from a large machine. This may be the case in remote parts ofthe electrical grid with low population density and little electricityconsumption in the area.
1.
There is less fluctuation in the electricity output from a windpark consisting of a number of smaller machines, since windfluctuations occur randomly, and therefore tend to cancel out. Again,smaller machines may be an advantage in a weak electrical grid.
2.
The cost of using large cranes, and building a road strong enough tocarry the turbine components may make smaller machines moreeconomic in some areas.
3.
Several smaller machines spread the risk in case of temporarymachine failure, e.g. due to lightning strikes.
4.
aesthetical landscape considerations may sometimes dictate theuse of smaller machines. Large machines, however, will usually havea much lower rotational speed, which means that one large machinereally does not attract as much attention as many small, fast movingrotors. (See the section on wind turbines in the landscape).
5.

| Back | Home | Forward |© Copyright 2000 Soren Krohn. All rights reserved.
Updated 6 August 2000http://www.windpower.org/tour/wtrb/size.htm

Photograph© 1998 Soren Krohn
Wind Turbine SafetyThe components of a windturbine are designed to last20 years. This means thatthey will have to enduremore than 120,000operating hours, oftenunder stormy weatherconditions.
If you compare with anordinary automobileengine, it usually onlyoperates only some 5,000hours during its lifetime.Large wind turbines are
equipped with a number of safety devices to ensure safe operation duringtheir lifetime.
SensorsOne of the classical, and most simple safety devices in a wind turbine is thevibration sensor in the image above, which was first installed in the Gedserwind turbine. It simply consists of a ball resting on a ring. The ball isconnected to a switch through a chain. If the turbine starts shaking, the ballwill fall off the ring and switch the turbine off.
There are many other sensors in the nacelle, e.g. electronic thermometerswhich check the oil temperature in the gearbox and the temperature of thegenerator.
Rotor BladesSafety regulations for wind turbines vary between countries. Denmark is theonly country in which the law requires that all new rotor blades are testedboth statically, i.e. applying weights to bend the blade, and dynamically,i.e. testing the blade's ability to withstand fatigue from repeated bendingmore than five million times. You may read more about this on the page onTesting Wind Turbine Rotor Blades.
Overspeed ProtectionIt is essential that wind turbines stop automatically in case of malfunction ofa critical component. E.g. if the generator overheats or is disconnected fromthe electrical grid it will stop braking the rotation of the rotor, and the rotorwill start accelerating rapidly within a matter of seconds.
In such a case it is essential to have an overspeed protection system.Danish wind turbines are requited by law to have two independent fail safebrake mechanisms to stop the turbine.

Aerodynamic Braking System: Tip BrakesThe primary braking system for most modern wind turbines is theaerodynamic braking system, which essentially consists in turning therotor blades about 90 degrees along their longitudinal axis (in the case of apitch controlled turbine or an active stall controlled turbine), or in turningthe rotor blade tips 90 degrees (in the case of a stall controlled turbine).
These systems are usually spring operated, in order to work even in case ofelectrical power failure, and they are automatically activated if the hydraulicsystem in the turbine loses pressure. The hydraulic system in the turbine isused turn the blades or blade tips back in place once the dangerous situationis over.
Experience has proved that aerodynamic braking systems are extremelysafe.
They will stop the turbine in a matter of a couple of rotations, at the most.In addition, they offer a very gentle way of braking the turbine without anymajor stress, tear and wear on the tower and the machinery.
The normal way of stopping a modern turbine (for any reason) is thereforeto use the aerodynamic braking system.
Mechanical Braking SystemThe mechanical brake is used as abackup system for the aerodynamicbraking system, and as a parking brake,once the turbine is stopped in the caseof a stall controlled turbine.
Pitch controlled turbines rarely needto activate the mechanical brake(except for maintenance work), as therotor cannot move very much once therotor blades are pitched 90 degrees.
| Back | Home | Forward |© Copyright 1999 Soren Krohn. All rights reserved.
Updated 15 December 2000http://www.windpower.org/tour/wtrb/safety.htm

Wind Turbine OccupationalSafety
TowersLarge, modern wind turbinesnormally use conical tubular steeltowers. The primary advantage ofthis tower over a lattice tower is thatit makes it safer and far morecomfortable for service personnel toaccess the wind turbine for repair andmaintenance. The disadvantage iscost.
The primary danger in workingwith wind turbines is the heightabove ground during installationwork and when doing maintenancework.
New Danish wind turbines are required to have fall protection devices,i.e. the person climbing the turbine has to wear a parachutist-like set ofstraps.
The straps are connected with a steel wire to an anchoring system thatfollows the person while climbing or descending the turbine.
The wire system has to include a shock absorber, so that persons arereasonably safe in case of a fall.
Photograph© 1999 Soren Krohn
A Danish tradition (which has later beentaken up by other manufacturers), is toplace the access ladders at a certaindistance from the wall. This enablesservice personnel to climb the towerwhile being able to rest the shouldersagainst the inside wall of the tower.
In this image you see the editor of ourSpanish web site verifying that this isactually a very practical solution.
Protection from the machinery, fireprotection and electrical insulationprotection is governed by a number ofnational and international standards.During servicing it is essential that themachinery can be stopped completely. Inaddition to a mechanical brake, the rotorcan be locked in place with a pin, toprevent any movement of the mechanical
parts whatsoever.

| Back | Home | Forward |© Copyright 2000 Soren Krohn. All rights reserved.
Updated 9 September 2000http://www.windpower.org/tour/wtrb/safety2.htm

Water pumping windmill,South Australia, Photograph
© 1997 Soren Krohn
Wind TurbineDesign: BasicLoadConsiderationsWhether you are building wind turbinesor helicopters, you have to take thestrength, the dynamic behaviour, and the fatigue properties of your materialsand the entire assembly into consideration.
Extreme Loads (Forces)
Comodoro Rivadavia,Argentina (NEG Micon 750
kW turbines)Photograph
© 1998 Soren Krohn
Wind turbines are built to catch thewind's kinetic (motion) energy. Youmay therefore wonder why modernwind turbines are not built with a lot ofrotor blades, like the old "American"windmills you have seen in the Westernmovies.
Turbines with many blades or verywide blades, i.e. turbines with a verysolid rotor, however, will be subject tovery large forces, when the wind blowsat a hurricane speed. (Remember, thatthe energy content of the wind varieswith the third power (the cube) of thewind speed).
Wind turbine manufacturers have tocertify that their turbines are built, so that they can withstand extreme windswhich occur, say, during 10 minutes once every 50 years.
To limit the influence of the extreme winds turbine manufacturerstherefore generally prefer to build turbines with a few, long, narrow blades.
In order to make up for the narrowness of the blades facing the wind,turbine manufacturers prefer to let the turbines rotate relatively quickly.
Fatigue Loads (Forces)Wind turbines are subject to fluctuating winds, and hence fluctuating forces.This is particularly the case if they are located in a very turbulent windclimate.
Components which are subject to repeated bending, such as rotor blades,may eventually develop cracks which ultimately may make the componentbreak. A historical example is the huge German Growian machine (100 mrotor diameter) which had to be taken out of service after less than threeweeks of operation. Metal fatigue is a well known problem in manyindustries. Metal is therefore generally not favoured as a material for rotorblades.

When designing a wind turbine it is extremely important to calculate inadvance how the different components will vibrate, both individually, andjointly. It is also important to calculate the forces involved in each bendingor stretching of a component.
This is the subject of structural dynamics, where physicists havedeveloped mathematical computer models that analyse the behaviour of anentire wind turbine.
These models are used by wind turbine manufacturers to design theirmachines safely.
Structural Dynamics: An Example *)A 50 metre tall wind turbine tower will have a tendency to swing back andforth, say, every three seconds. The frequency with which the toweroscillates back and forth is also known as the eigenfrequency of the tower.The eigenfrequency depends on both the height of the tower, the thicknessof its walls, the type of steel, and the weight of the nacelle and rotor.
Now, each time a rotor blade passes the wind shade of the tower, the rotorwill push slightly less against the tower.
If the rotor turns with a rotational speed such that a rotor blade passes thetower each time the tower is in one of its extreme positions, then the rotorblade may either dampen or amplify (reinforce) the oscillations of thetower.
The rotor blades themselves are also flexible, and may have a tendency tovibrate, say, once per second. As you can see, it is very important to knowthe eigenfreqencies of each component in order to design a safe turbine thatdoes not oscillate out of control.
*) A very dramatic example of structural dynamic forces at work underinfluence of the wind (undampened torsion oscillations) is the famous crashof the Tacoma Bridge close to Seattle in the United States. You may find ashort movie clip (700 K) on the disaster on the Internet.
| Back | Home | Forward |© Copyright 1999 Soren Krohn. All rights reserved.
Updated 19 January 2001http://www.windpower.org/tour/design/index.htm

Wind Turbines:Horizontal or Vertical AxisMachines?
Horizontal Axis Wind TurbinesMost of the technology described on these pages is related to horizontal axiswind turbines (HAWTs, as some people like to call them).
The reason is simple: All grid-connected commercial wind turbines todayare built with a propeller-type rotor on a horizontal axis (i.e. a horizontalmain shaft).
The purpose of the rotor, of course, is to convert the linear motion of thewind into rotational energy that can be used to drive a generator. The samebasic principle is used in a modern water turbine, where the flow of water isparallel to the rotational axis of the turbine blades.
Eole C, a 4200 kW Verticalaxis Darrieus wind turbinewith 100 m rotor diameter
at Cap Chat, Québec,Canada. The machine (which
is the world's largest windturbine) is no longer
operational.
Photograph© 1997 Soren Krohn
Vertical Axis Wind TurbinesAs you will probably recall, classical waterwheels let the water arrive at a right angle(perpendicular) to the rotational axis (shaft)of the water wheel.
Vertical axis wind turbines (VAWTs assome people call them) are a bit like waterwheels in that sense. (Some vertical axisturbine types could actually work with ahorizontal axis as well, but they would hardlybe able to beat the efficiency of apropeller-type turbine).
The only vertical axis turbine which hasever been manufactured commercially at anyvolume is the Darrieus machine, namedafter the French engineer Georges Darrieuswho patented the design in 1931. (It wasmanufactured by the U.S. company FloWind
which went bankrupt in 1997). The Darrieus machine is characterised by itsC-shaped rotor blades which make it look a bit like an eggbeater. It isnormally built with two or three blades.
The basic theoretical advantages of a vertical axis machine are1) you may place the generator, gearbox etc. on the ground, and you may notneed a tower for the machine.2) you do not need a yaw mechanism to turn the rotor against the wind.
The basic disadvantages are1) Wind speeds are very low close to ground level, so although you maysave a tower, your wind speeds will be very low on the lower part of yourrotor.2) The overall efficiency of the vertical axis machines is not impressive.3) The machine is not self-starting (e.g. a Darrieus machine will need a"push" before it starts. This is only a minor inconvenience for a grid

connected turbine, however, since you may use the generator as a motordrawing current from the grid to to start the machine).4) The machine may need guy wires to hold it up, but guy wires areimpractical in heavily farmed areas.5) Replacing the main bearing for the rotor necessitates removing the rotoron both a horizontal and a vertical axis machine. In the case of the latter, itmeans tearing the whole machine down. (That is why EOLE 4 in the pictureis standing idle).
| Back | Home | Forward |© Copyright 2000 Soren Krohn. All rights reserved.
Updated 9 September 2000http://www.windpower.org/tour/design/horver.htm

Wind Turbines:Upwind or Downwind Machines?
Upwind MachinesUpwind machines have the rotor facing the wind. The basic advantage ofupwind designs is that one avoids the wind shade behind the tower. By farthe vast majority of wind turbines have this design.
On the other hand, there is also some wind shade in front of the tower, i.e.the wind starts bending away from the tower before it reaches the toweritself, even if the tower is round and smooth. Therefore, each time the rotorpasses the tower, the power from the wind turbine drops slightly.
The basic drawback of upwind designs is that the rotor needs to be maderather inflexible, and placed at some distance from the tower (as somemanufacturers have found out to their cost). In addition an upwind machineneeds a yaw mechanism to keep the rotor facing the wind.
Small downwind turbine (22kW).You may notice that therotor is "coning" away fromthe tower.Photograph© 1998 Soren Krohn
Downwind MachinesDownwind machines have the rotor placed onthe lee side of the tower. They have thetheoretical advantage that they may be builtwithout a yaw mechanism, if the rotor andnacelle have a suitable design that makes thenacelle follow the wind passively. For largewind turbines this is a somewhat doubtfuladvantage, however, since you do need cablesto lead the current away from the generator.How do you untwist the cables, when themachine has been yawing passively in thesame direction for a long period of time, if youdo not have a yaw mechanism? (Slip rings ormechanical collectors are not a very good ideaif you are working with 1000 amperecurrents).
A more important advantage is that the rotor may be made more flexible.This is an advantage both in regard to weight, and the structural dynamics ofthe machine, i.e. the blades will bend at high wind speeds, thus taking part ofthe load off the tower. The basic advantage of the downwind machine isthus, that it may be built somewhat lighter than an upwind machine.
The basic drawback is the fluctuation in the wind power due to the rotorpassing through the wind shade of the tower. This may give more fatigueloads on the turbine than with an upwind design.

| Back | Home | Forward |© Copyright 1998 Soren Krohn. All rights reserved.
Updated 19 January 2001http://www.windpower.org/tour/design/updown.htm

Wind Turbines:How many blades?
Why Not an Even Number of Blades?Modern wind turbine engineers avoid building large machines with an evennumber of rotor blades. The most important reason is the stability of theturbine. A rotor with an odd number of rotor blades (and at least threeblades) can be considered to be similar to a disc when calculating thedynamic properties of the machine.
A rotor with an even number of blades will give stability problems for amachine with a stiff structure. The reason is that at the very moment whenthe uppermost blade bends backwards, because it gets the maximum powerfrom the wind, the lowermost blade passes into the wind shade in front ofthe tower.
The Danish Three-Bladed ConceptMost modern wind turbines are three-bladed designs with the rotor positionmaintained upwind (on the windy side of the tower) using electrical motorsin their yaw mechanism. This design is usually called the classical Danishconcept, and tends to be a standard against which other concepts areevaluated. The vast majority of the turbines sold in world markets have thisdesign. The basic design was first introduced with the renowned Gedserwind turbine. Another characteristic is the use of an asynchronous generator.You may read more about the Danish concept in the articles section of thisweb site.
Two-Bladed (Teetering) ConceptTwo-bladed wind turbine designs have the advantage of saving the cost ofone rotor blade and its weight, of course. However, they tend to havedifficulty in penetrating the market, partly because they require higherrotational speed to yield the same energy output. This is a disadvantage bothin regard to noise and visual intrusion. Lately, several traditionalmanufacturers of two-bladed machines have switched to three-bladeddesigns.
Two- and one-bladed machines require a more complexdesign with a hinged (teetering hub) rotor as shown in thepicture, i.e. the rotor has to be able to tilt in order to avoidtoo heavy shocks to the turbine when a rotor bladespasses the tower. The rotor is therefore fitted onto a shaftwhich is perpendicular to the main shaft, and whichrotates along with the main shaft. This arrangement mayrequire additional shock absorbers to prevent the rotor blade from hitting thetower.

One-Bladed ConceptYes, one-bladed wind turbines do exist, and indeed, they save the cost ofanother rotor blade! If anything can be built, engineers will do it.One-bladed wind turbines are not very widespread commercially, however,because the same problems that are mentioned under the two-bladed designapply to an even larger extent to one-bladed machines.
In addition to higher rotational speed, and the noise andvisual intrusion problems, they require a counterweight tobe placed on the other side of the hub from the rotor bladein order to balance the rotor. This obviously negates thesavings on weight compared to a two-bladed design.
| Back | Home | Forward |© Copyright 2001 Soren Krohn. All rights reserved.
Updated 3 January 2001http://www.windpower.org/tour/design/concepts.htm

Optimising Wind Turbines
Optimisation and Economics
Victoria in SouthernAustralia would never havebeen populated in the late
19th century, were it not forthe water pumping windmills
- and these windmills arereally optimised for their
purpose.Photograph © 1998
by Soren Krohn
The water pumping windmills to the leftlook very different from modern, largewind turbines. But they are quite sensiblydesigned for the purpose they serve: Thevery solid rotor with many blades meansthat they will be running even at verylow wind speeds, and thus pumping a fairamount of water all year round.
Clearly, they will be very inefficient athigh wind speeds, and they will have toshut themselves down, and yaw out ofthe wind in order to avoid damage to theturbine, due to the very solid rotor. Butthat does not really matter: We do notwant them to empty the wells and flood
the water tank during a gale.The ideal wind turbine design is not dictated by technology alone, but by a
combination of technology and economics: Wind turbine manufacturerswish to optimise their machines, so that they deliver electricity at the lowestpossible cost per kilowatt hour (kWh) of energy.
But manufacturers are not very concerned about how efficiently they usethe wind resource: The fuel is free, after all.
It is not necessarily a good idea to maximise annual energy production, ifthat means that one has to build a very expensive wind turbine. In the nextsections we shall look at some of the choices manufacturers have to make.
Relative Generator and Rotor SizeA small generator, (i.e. a generator with low rated power output in kW)requires less force to turn than a large one. If you fit a large wind turbinerotor with a small generator it will be producing electricity during manyhours of the year, but it will capture only a small part of the energy contentof the wind at high wind speeds.
A large generator, on the other hand, will be very efficient at high windspeeds, but unable to turn at low wind speeds.
Clearly, manufacturers will look at the distribution of wind speeds and theenergy content of the wind at different wind speeds to determine the idealcombination of the size of the rotor and the size of the generator at differentwind turbine sites.
Fitting a wind turbine with two (or more) generators can sometimes be anadvantage, but whether it really pays to do it depends on the electricity price.
Tower HeightsIn the section on wind shear, you have learned that taller towers generallyincrease a wind turbine's energy production.
Once again, whether a taller tower is worth the extra cost depends both onthe roughness class, and the cost of electricity.

| Back | Home | Forward |© Copyright 1998 Soren Krohn. All rights reserved.
Updated 6 August 2000http://www.windpower.org/tour/design/optim.htm

Designing for Low MechanicalNoise from Wind TurbinesSound emissions from wind turbines may have two different origins:Mechanical noise which we deal with on this page, and aerodynamic noisewhich we deal with on the next page.
Mechanical Sources of Sound EmissionMechanical noise, i.e. metal components moving or knocking against eachother may originate in the gearbox, in the drive train (the shafts), and in thegenerator of a wind turbine.
Machines from the early 1980s or before do emit some mechanical noise,which may be heard in the immediate surroundings of the turbine, in theworst cases even up to a distance of 200 m (600 ft.)
A survey on research and development priorities of Danish wind turbinemanufacturers conducted in 1995, however, showed that no manufacturerconsidered mechanical noise as a problem any longer, and therefore nofurther research in the area was considered necessary. The reason was, thatwithin three years noise emissions had dropped to half their previous leveldue to better engineering practices.
Quieting Wind Turbine GearboxesGearboxes for wind turbines are no longer standard industrial gearboxes, butthey have been adapted specifically for quiet operation of wind turbines.One way of doing this is to ensure that the steel wheels of the gearbox havea semi-soft, flexible core, but a hard surface to ensure strength and long timewear.
The way this is done is basically to heat the gear wheels after their teethhave been ground, and then let them cool off slowly while they are packedin a special high carbon-content powder. The carbon will then migrate intothe surface of the metal. This ensures a high carbon content and highdurability in the surface of the metal, while the steel alloy in the interiorremains softer and more flexible.
Structural Dynamics AnalysisWhen going by car, plane, or train, you may have experienced howresonance of different components, e.g. in the dashboard of a car or awindow of a train may amplify noise.
An important consideration, which enters into the turbine design processtoday, is the fact that the rotor blades may act as membranes that mayretransmit noise vibrations from the nacelle and tower.
As explained in the tour section on Research and Development, the turbinemanufacturers nowadays make computer models of their machines beforebuilding them, to ensure that the vibrations of different components do notinteract to amplify noise.
If you look at the chassis frame of the nacelle on some of the large windturbines on the market today, you may discover some odd holes which weredrilled into the chassis frame for no apparent reason. These holes were

precisely made to ensure that the frame will not vibrate in step with the othercomponents in the turbine.
Sound InsulationSound insulation plays a minor role in most wind modern turbines on themarket today, although it can be useful to minimise some medium- andhigh-frequency noise. In general, however, it seems to be more efficient toattack noise problems at the source, in the structure of the machine itself.
| Back | Home | Forward |© Copyright 2000 Soren Krohn. All rights reserved.
Updated 9 September 2000http://www.windpower.org/tour/design/quietma.htm

Designing for Low AerodynamicNoise from Wind Turbines
Aerodynamic Sources of Sound EmissionWhen the wind hits different objects at a certain speed, it will generally startmaking a sound. If it hits the leaves of trees and bushes, or a water surface itwill create a random mixture of high frequencies, often called white noise.
The wind may also set surfaces in vibration, as sometimes happens withparts of a building, a car or even an (engineless) glider aeroplane. Thesesurfaces in turn emit their own sound. If the wind hits a sharp edge, it mayproduce a pure tone, as you can hear it from musical wind instruments.
Rotor Blade Sound Emission and the Fifth Power LawRotor blades make a slight swishing sound which you may hear if you areclose to a wind turbine at relatively low wind speeds.
Rotor blades must brake the wind to transfer energy to the rotor. In theprocess they cause some emission of white noise. If the surfaces of the rotorblades are very smooth (which indeed they must be for aerodynamicreasons), the surfaces will emit a minor part of the noise. Most of the noisewill originate from the trailing (back) edge of the blades. Careful design oftrailing edges and very careful handling of rotor blades while they aremounted, have become routine practice in the industry.
Other things being equal, sound pressure will increase with the fifth powerof the speed of the blade relative to the surrounding air. You will thereforenotice that modern wind turbines with large rotor diameters have very lowrotational speed.
Rotor Blade Tip DesignSince the tip of the blade moves substantially faster than the root of theblade, great care is taken about the design of the rotor tip. If you look closelyat different rotor blades you will discover subtle changes in their geometryover time, as more and more research in the area is being done.
The research is also done for performance reasons, since most of thetorque (rotational moment) of the rotor comes from the outer part of theblades. In addition, the airflows around the tip of rotor blades is extremelycomplex, compared to the airflow over the rest of the rotor blade.
Research on Quieter BladesResearch on quieter rotor blades continues, but as mentioned in the sectionNoise is a Minor Problem, most of the benefits of that research will beturned into increased rotational speed and increased energy output, sincenoise is generally not a problem per se, given the distances to neighbouringhouses etc.

| Back | Home | Forward |© Copyright 2000 Soren Krohn. All rights reserved.
Updated 9 September 2000http://www.windpower.org/tour/design/quietae.htm

Photographs© 1999 Soren Krohn
Manufacturing Wind TurbineNacellesTake a 360° Panoramic View (QuickTime VR) into aWind Turbine Factory
Hold the mouse down on the picture and drag gently right, left, up or downto pan or tilt the camera. Use the shift key to zoom in, use the ctrl key tozoom out. This image (364K) requires a QuickTime plugin in your browser.You may download the necessary plugin and a QuickTime player fromApple's web site.
| Home | Forward |© Copyright 2000 Soren Krohn
Updated 6 August 2000http://www.windpower.org/tour/manu/index.htm

Video© 1999 Soren Krohn
Click on image to restartvideo
Testing Wind Turbine RotorBladesFatigue Testing of Rotor Blades
The video to the left(122 K) shows how a 32m rotor blade is fatiguetested by being bentcyclically in a flapwisedirection for 5 million fullcycles. A full flapwise testthus takes about threemonths.
If you look closely tothe left you can seeanother (shorter) rotorblade being bentcyclically in an edgewise
(chordwise) direction.In both cases the blades are bent using a cycle close to the natural
frequency of the blade.The natural frequency is the frequency with which the blade will oscillate
back and forth, if you push it once in a certain direction and let go. Thenatural frequencies are different in the flapwise and edgewise direction: Theblade tends to be much stiffer in the edgewise direction, thus it has a highernatural frequency for edgewise bending.
Each blade is set in motion by an electric motor mounted on the bladewhich swings a weight up and down. The foundations which carry the bladesocket have to be very solid: The foundation for the large blade socketconsists of 2,000 tonnes of concrete.
This video was shot at the rotor blade test facility of the Risoe NationalLaboratory Sparkær Test Centre in Jutland, Denmark. (Type approvalrequirements for rotor blades are very strict in Denmark, requiring physicaltesting of rotor blades for both fatigue properties (fatigue testing) andstrength properties (static testing). Other countries usually have lessstringent requirements for type approval of rotor blades).
Rotor Blade MaterialsRotor blades are usually made using a matrix of fibre glass mats which areimpregnated with a material such as polyester (GRP = Glass fibre reinforcedpolyester). The polyester is hardened after it has impregnated the fibre glass.Epoxy may be used instead of polyester. Likewise the basic matrix may bemade wholly or partially from carbon fibre, which is a lighter, but costliermaterial with high strength. Wood-epoxy laminates are also being used forlarge rotor blades.

The Purpose of Testing Rotor BladesThe purpose of rotor blade testing is to verify that laminations in the bladeare, safe, i.e. that the layers of the rotor blade do not separate (delamination).Also, the test verifies that the fibres do not break under repeated stress.
Photograph© 1999 Soren Krohn
Measuring Strains
Strain gauges, (i.e. flatelectrical resistors whichare glued on to the surfaceof the rotor blades beingtested), are used tomeasure very accuratelythe bending and stretchingof the rotor blades.
Photograph© 1999 Soren Krohn
Monitoring Fatigue Testing
The measurement resultsfrom the strain gauges arecontinuously monitored oncomputers. Nonlinearvariations in the pattern ofbending may reveal adamage in the rotor bladestructure.
Infrared Inspection (Thermography)Infrared cameras are used to reveal local build-up of heat in the blade. Thismay either indicate an area with structural dampening, i.e. an area wherethe blade designer has deliberately laid out fibres which convert the bendingenergy into heat in order to stabilise the blade, or it may indicate an area ofdelamination or an area which is moving toward the breaking point for thefibres.
Modal Forms of Rotor Blade VibrationsFrom the year 2000 blade testing (in Denmark) also includes a verificationof the different modal forms of vibration of each blade. This is done using aspecial type of equipment which excites the blade vibrations at differentfrequencies and in different directions.
Different modal forms of oscillation are also known when building musicalinstruments: A string on a violin may oscillate with is basic tone, i.e. the

centre of the string moving up and down, but it will usually also oscillatewith the first overtone or first harmonic, with two centres of oscillationlocated at a distance of 1/4 from each end of the string, moving at twice thefrequency of the basic tone or natural frequency.
The reason why manufacturers of wind turbines are interested in studyingand verifying the various forms of vibration frequencies in rotor blades, isthat they have to make sure that the turbine on which the blade is to bemounted does not have some of the same natural frequencies as the rotorblade. Otherwise, a resonance may occur in the whole structure of theturbine, leading to undampened vibrations which may eventually wreckthe whole wind turbine. We will return to this issue on the page on structuraldynamics in the design section later in this guided tour.
Static Testing of Rotor BladesRotor blades are also tested for strength (and thus their ability to withstandextreme loads) by being bent once with a very large force. This test is madeafter the blades has been subject to fatigue testing, in order to verify thestrength for a blade which has been in operation for a substantial amount oftime.
| Back | Home | Forward |© Copyright 2000 Soren Krohn
Updated 16 August 2000http://www.windpower.org/tour/manu/bladtest.htm

All photographs© 1999 Soren Krohn
Manufacturing Wind TurbineTowersRolling Conical Tower Sections
Most modern windturbine towers areconical tubular steeltowers, as we learnedon the page aboutwind turbine towers.
This image from atower manufacturer'sworkshop shows howa steel plate is rolledinto a conicalsubsection for a windturbine tower. It is abit tricky to achievethe conical shape,since the tension(pressure) of the steelrollers has to bedifferent at the twosides in order to makethe plate bendproperly.
Towers areassembled from thesesmaller, conicalsubsections which are
cut and rolled into the right shape, and then welded together.Towers are usually manufactured in 20 to 30 m sections (65 to 100 ft.), the
limiting factor being transportation on roads or rail. Typical modern towerweights are 40 metric tonnes for a 50 m (165 ft.) tower for a turbine with a44 m rotor diameter (600 kW), and 80 metric tonnes for a 60 metre tower fora 72 m rotor diameter (2000 kW).

Designed by the Turbine ManufacturerTowers for wind turbines are generally designed by each turbinemanufacturer, since the entire wind turbine has to be type approved as a unit.(The reasons are explained in the page about structural dynamics). So evenif some towers are manufactured by independent producers, they are alwaysspecific for each manufacturer.
Independent tower manufacturers are often also manufacturers of oil tanksor pressure vessels, since the machinery and safety inspection procedures arevery similar.
Weight MattersTower weights (per installed power in kW) have declined by about 50%during the past five years due to more advanced design methods. Still,towers are a fairly heavy part of the wind turbine, so transportation costs areimportant. For larger markets it generally does not pay to transport towersmore than 1000 km (600 miles) by road. In case the distance is larger (andthe project is a large one), towers are usually manufactured locally.
Banana Peel Shaped PlatesIn order to end upwith a cone-shapedsection, the plate usedfor rolling has to becurved along thelongest edges, and theshort edges are notparallel. Most towermanufacturers useprogrammable lasercutting tools in orderto obtain theappropriate shape forthe steel plate.
| Back | Home | Forward |© Copyright 2000 Soren Krohn
Updated 6 August 2000http://www.windpower.org/tour/manu/towerm.htm

All photographs© 1999 Soren Krohn
Welding Wind Turbine TowersSteel Sections are Powder Welded
Each tower section iswelded with a seamlengthwise, plus acircular welding seamto connect to the nextsection of the tower.This is done byplacing the towersections on a rollingbed which slowlyrotates the tower,while an operatorwith a powderwelding machinewelds the sectionsfrom the outside...
...and anotheroperator welds acorresponding set ofseams on the inside.
Checking Welding Seams for SafetyWelding seams in towers are checked using ultrasonic or x-ray devices.Important seams are checked 100%, while other seams are checked on asample basis.
| Back | Home | Forward |© Copyright 1999 Soren Krohn
Updated 6 August 2000http://www.windpower.org/tour/manu/towerwld.htm

Installing and Assembling WindTurbine Towers
Attaching Towers to theirFoundationsTowers are usually bolted onto theconcrete foundations on which they areplaced.
There are other methods, however, asin this case where part of the bottomsection of the tower is cast into theconcrete foundation, and where thelowest section of the tower issubsequently welded together directlyon the site.
This method requires that the tower befitted with special guides and clamps tohold the two tower sections in placewhile the welding is being done. It alsorequires a small mobile tower factoryincluding a generator, welding gear, andx-ray inspection equipment forchecking the welding seams.
All pictures© 1999 Soren Krohn
FlangesWind turbine towersections are boltedtogether using hotrolled steel flanges,which are welded tothe end of each towersection.
The flanges aremade from killedsteel. The imageshows a pair offlanges.

Bolt AssemblyThe next imageshows how thetower sectionsare boltedtogether insidethe tower.
The quality ofthe flanges andthe bolt tensionsare importantparameters forthe safety ofwind turbinetowers.
| Back | Home | Forward |© Copyright 2000 Soren Krohn
Updated 9 September 2000http://www.windpower.org/tour/manu/towrassy.htm

Research and Development inWind EnergyFor wind turbine manufacturers, the basic aim of research and developmentof wind turbines is to be able to manufacture ever more cost effectivemachines.
Photographof computer simulation of
airflows around a rotor blade© Risoe National
Laboratory, Denmark
Basic Aerodynamics ResearchWind turbines engineers use techniques such asstall, which aircraft designers try to avoid at allcosts. Stall is a very complex phenomenon,because it involves airflows in three dimensionson wind turbine rotor blades. (e.g. thecentrifugal force will induce an airflow whichmakes the air molecules move radially alongthe rotor blade from its root towards the tip ofthe blade).
3D computer simulations of airflows are rarely used in the aircraftindustry, so wind turbine researchers have to develop new methods andcomputer simulation models to deal with these issues.
Computational Fluid Dynamics, or CFD, is a group of methods that dealwith simulating airflows around e.g. rotor blades for wind turbines.
The picture shows a computer simulation of the airflows and pressuredistributions around a wind turbine rotor blade moving towards the left.
Aerodynamic Improvement DevicesA number of technologies known from the aircraft industry are increasinglybeing applied to improve the performance of wind turbine rotors.
One example is vortex generators, which are small fins, often only about0.01 metre (0.4 inch) tall, which are fitted to the surface of aircraft wings.The fins are alternately slightly skewed a few degrees to the right and theleft. The fins create a thin current of turbulent air on the surface of thewings. The spacing of the fins is very accurate to ensure that the turbulentlayer automatically dissolves at the back edge of the wing.
Curiously, this creation of minute turbulenceprevents the aircraft wing from stalling at low windspeeds.
Wind turbine blades are prone to stalling even atlow wind speeds close to the root of the blade wherethe profiles are thick.
Consequently, on some of the newest rotor bladesyou may find a stretch of one metre or so along theback side of the blade (near the root) equipped with anumber of vortex generators.(Picture © LM Glasfiber A/S).

| Back | Home | Forward |© Copyright 1998 Soren Krohn. All rights reserved.
Updated 19 January 2001http://www.windpower.org/tour/rd/index.htm

Offshore Wind Power ResearchVindeby Offshore Wind Farm
Photograph © 1992 Bonus EnergyA/S
Megawatt sized windturbines, cheaperfoundations and newknowledge about offshorewind conditions isimproving the economicsof offshore wind power.
While wind energy isalready economic in goodonshore locations, windenergy is about to crossanother frontier: Theeconomic frontier set byshorelines. Researchers
and developers are about to challenge conventional wisdom on electricitygenerating technologies: Offshore wind energy is rapidly becomingcompetitive with other power generating technologies.
The Danish Plan 21According to The Danish Governments' Action Plan for Energy, Energy 21(see the Links page), 4,000 MW of offshore wind power should be installedbefore year 2030. With another 1,500 MW installed onshore Denmark willthen be able to cover more than 50 per cent of total electricity consumptionby wind energy. In comparison, the current wind power capacity inDenmark is 1,100 MW (mid 1998).
A total of 5,500 MW of wind power in the Danish electricity system meansthat the wind turbines periodically will cover more than 100 per cent ofDanish electricity demand. Therefore, the future Danish offshore powerplants should be an integrated part of the Scandinavian electricity system,which is based on huge amounts on hydro power.
With a total investment of some 48 billion DKK (= 7 billion USD) for the4,000 MW offshore capacity the Danish action plan will be the world'slargest investment in wind power ever.
Offshore Timetable in DenmarkDanish power companies have already applied for planning permission for750 MW of offshore wind parks. According to their timetable more than4,000 megawatts of wind power will be installed offshore in Denmarkbefore 2027. The first stage is likely to be a smaller 40 MW offshore parkjust of the coast of Copenhagen in year 2000.
A report drafted by the Danish power companies for the Minister ofEnvironment and Energy identifies four main areas in Danish sea territorysuitable for wind power with a potential of 8,000 MW. The philosophybehind the selected areas is simple: For environmental reasons theCommittee has concentrated the capacity in few and remote areas with waterdepths between 5 and 11 metres.
The areas have been selected to avoid national park areas, shipping routes,microwave links, military areas, etc. The distance from coastal areas variesfrom 7 to 40 km. This also minimises the visual impact onshore.

The most recent research into foundations indicates that it may beeconomic to install offshore turbines even at 15 metres water depth. Thismean that the offshore potential is some 16,000 MW in the selected areas inthe Danish Waters.
| Back | Home | Forward |© Copyright 2000 Soren Krohn. All rights reserved.
Updated 9 September 2000http://www.wind power.dk/tour/rd/offintro.htm

Wind Turbine OffshoreFoundationsThe major challenge for offshore wind energy is cutting costs: Underseacabling and foundations have until recently made offshore wind energy anexpensive option.
New studies of foundation technology, however, plus megawatt-sized windturbines are now on the point of making offshore wind energy competitivewith onshore sites, at least for shallow water depths up to 15 metres (50 ft.).
Since offshore wind turbines generally yield 50 per cent higher output thanturbines on nearby onshore sites (on flat land), offshore siting may be quiteattractive, cf. the page on offshore wind conditions.
Steel is Cheaper Than ConcreteTwo Danish power company groups and three engineering firms made apioneering study on the design and costing of offshore wind turbinefoundations in 1996-1997. The report concluded that steel is far morecompetitive than concrete for larger offshore wind farms.
It appears that all of the new technologies will be economic until at least15 metres water depth, and possibly beyond such depths. In any case, themarginal cost of moving into deeper waters is far smaller than what waspreviously estimated.
With these concepts foundation and grid connection costs for large 1.5megawatt turbines are only 10 to 20 per cent higher than the correspondingcosts for the 450-500 kW turbines used at Vindeby and Tunø Knob offshorewind parks in Denmark.
50 Year Design LifetimeContrary to popular belief, corrosion is not a major concern with offshoresteel structures. Experience from offshore oil rigs has shown that they can beadequately protected using cathodic (electrical) corrosion protection.
Surface protection (paint) on offshore wind turbines will routinely bedelivered with a higher protection class than for onshore turbines.
Oil rig foundations are normally built to last 50 years. This is also thedesign lifetime for the steel foundations used in these studies.
Reference TurbineThe reference turbine for the study is a modern 1.5 MW three-bladedupwind turbine with a hub height of about 55 metres (180 ft.) and a rotordiameter of some 64 metres (210 ft.).
The hub height of the reference turbine is low compared with the typicalonshore turbine of that size. In Northern Germany the typical hub height of a1.5 MW turbine varies from 60 to 80 m (200 to 260 ft.). Because of the verysmooth surface (low roughness) of water surfaces it is cost-efficient to uselower towers. You may verify these conclusions using the Wind TurbinePower Calculator which already has a built in example of a 1.5 MW offshore

wind turbine.
| Back | Home | Forward |© Copyright 2000 Soren Krohn. All rights reserved.
Updated 25 January 2001http://www.windpower.org/tour/

Offshore Foundations:Traditional Concrete
Foundation being floated out toTunoe Knob
Photograph © 1996 byFlemming Hagensen
The first offshore pilot projects inDenmark (and the world) used concretegravity caisson foundations.
As the name indicates, the gravityfoundation relies on gravity to keep theturbine in an upright position.
Vindeby and Tunoe KnobOffshore Wind FarmsVindeby Offshore Wind Farm andTunoe Knob Wind Farm are examplesof this traditional foundation technique.The caisson foundations were built indry dock near the sites using armed
concrete and were floated to their final destination before being filled withsand and gravel to achieve the necessary weight. The principle is thus muchlike that of traditional bridge building.
The foundations used at these two sites are conical to act as breakers forpack ice. This is necessary because solid ice is regularly observed in theBaltic Sea and the Kattegat during cold winters.
Disadvantage of ConcreteUsing traditional concrete foundation techniques the cost of the completedfoundation is approximately proportional with the water depth squared - thequadratic rule.
The water depths at Vindeby and Tunoe Knob vary from 2.5 m to 7.5 m.This implies that each concrete foundation has an average weight of some1050 metric tonnes.
According to the quadratic rule the concrete platforms tend to becomeprohibitively heavy and expensive to install at water depths above 10 metres.Therefore, alternative techniques had to be developed in order to breakthrough the cost barrier, as we shall see on the next pages.
| Back | Home | Forward |© Copyright 2000 Soren Krohn. All rights reserved.
Updated 9 September 2000http://www.wind power.dk/tour/rd/concrete.htm

Offshore Foundations:Gravitation + SteelMost of the existing offshore wind parks usegravitation foundations. A new technologyoffers a similar method to that of the concretegravity caisson. Instead of armed concrete ituses a cylindrical steel tube placed on a flatsteel box on the sea bed.
Weight ConsiderationsA steel gravity foundation is considerablylighter than concrete foundations. Although thefinished foundation has to have a weight ofaround 1,000 tonnes, the steel structure willonly weigh some 80 to 100 tonnes for waterdepths between 4 and 10 m. (Another 10tonnes have to be added for structures in theBaltic Sea, which require pack ice protection).
The relatively low weight allows barges totransport and install many foundations rapidly,using the same fairly lightweight crane usedfor the erection of the turbines.
The gravity foundations are filled with olivine, a very dense mineral,which gives the foundations sufficient weight to withstand waves and icepressure.
Size ConsiderationsThe base of a foundation of this type will be 14 by 14 m (or a diameter of 15m for a circular base) for water depths from 4 to 10 m. (Calculation based ona wind turbine with a rotor diameter of 65 m).
Seabed PreparationThe advantage of the steel caisson solution is that the foundation can bemade onshore, and may be used on all types of seabed although seabedpreparations are required. Silt has to be removed and a smooth horizontalbed of shingles has to be prepared by divers before the foundation can beplaced on the site.
Erosion ProtectionThe seabed around the base of the foundation will normally have to beprotected against erosion by placing boulders or rocks around the edges ofthe base. This is, of course, also the case for the concrete version of thegravitation foundation. This makes the foundation type relatively costlier inareas with significant erosion.

Costs by Water Depth for Steel GravitationalFoundations
The cost penalty of movingto larger water depths isminimal compared totraditional concretefoundations. The reason is,that the foundation basedoes not have to increase insize proportion to the waterdepth to lean against icepressure or waves.
The cost estimates for thistype of foundation is forinstance 2,343,000 DKK (=335,000 USD) for a 1.5MW machine placed at 8 m
water depth in the Baltic Sea (1997 figures). The costs include installation.The graph shows how the cost varies with water depth. Interestingly, the
dimensioning factor (which decides the required strength and weight of thefoundation) is not the turbine itself but ice and wave pressure forces.
| Back | Home | Forward |© Copyright 1998 Soren Krohn. All rights reserved.
Updated 19 January 2001http://www.wind power.dk/tour/rd/gravitat.htm

Offshore Foundations: Mono Pile
The mono pile foundation is a simple construction. The foundation consistsof a steel pile with a diameter of between 3.5 and 4.5 metres. The pile isdriven some 10 to 20 metres into the seabed depending on the type ofunderground. The mono pile foundation is effectively extending the turbinetower under water and into the seabed.
An important advantage of this foundation is that no preparations of theseabed are necessary. On the other hand, it requires heavy duty pilingequipment, and the foundation type is not suitable for locations with manylarge boulders in the seabed. If a large boulder is encountered during piling,it is possible to drill down to the boulder and blast it with explosives.
Costs by Water Depth for Mono Pile Foundations
The dimensioning factor ofthe foundation varies fromthe North Sea to the BalticSea. In the North Sea it isthe wave size thatdetermines the dimension ofthe mono pile. In the BalticSea the pack ice pressuredecides the size of thefoundation. This is thereason why the mono pilefoundation cost increasesmore rapidly in the BalticSea than in the North Sea.The costs include
installation (1997 prices).
Erosion ConsiderationsErosion will normally not be a problem with this type of foundation.
Swedish Offshore ProjectA 2.5 MW pilot project with five Danish wind turbines using the mono piletechnology has been installed in the Baltic sea south of the Swedish island ofGotland.
Using the mono pile foundation technique at Gotland involved drilling ahole of 8 to 10 metres depth for each of the turbines (Wind World 500 kW).Each steel pile is slotted into the the solid rock. When the foundations are inplace the turbines can be bolted on top of the mono piles.
The whole operation takes about 35 days under average Baltic weatherconditions.

| Back | Home | Forward |© Copyright 2000 Soren Krohn. All rights reserved.
Updated 9 September 2000http://www.wind power.dk/tour/rd/monopile.htm

Offshore Foundations: Tripod
Image © 1997Ramboll
The tripod foundation draws on theexperiences with light weight and costefficient three-legged steel jackets formarginal offshore fields in the oilindustry.
From a steel pile below the turbinetower emanates a steel frame whichtransfers the forces from the tower intothree steel piles. The three piles aredriven 10 to 20 metres into the seabeddepending on soil conditions and iceloads.
Advantages of the TripodThe advantage of the three-leggedmodel is that it is suitable for larger
water depths. At the same time only a minimum of preparations are requiredat the site before installation.
Multi-pile technologyThe foundation is anchored into the seabed using a relatively small steel pile(0.9 m diameter) in each corner. Because of the piling requirement, thetripod foundation is not suited for locations with many large boulders.
Erosion ConsiderationsErosion will normally not be a problem with this type of foundation.
Suitable for Larger Water DepthsThis type of foundation is not suitable at water depths lower than 6-7 metres.The main reason for this is that service vessels at low water depths will faceproblems approaching the foundation due to the steel frame.
Cost by Water Depth for Tripod Foundations

As in previous page, thebasic difference betweencosts in the North Sea andthe Baltic Sea is that wavesdetermine dimensioning inthe North Sea, whereas iceis decisive in the Baltic Sea.The costs includeinstallation (1997 prices).
| Back | Home | Forward |© Copyright 2000 Soren Krohn. All rights reserved.
Updated 9 September 2000http://www.wind power.dk/tour/rd/tripod.htm

Building Gravity Foundations forOffshore Wind Turbines(QuickTime Video)
Video© 2000 Soren Krohn This video shows workers casting concrete for the gravity foundations of
the Middelgrunden wind turbine park off the coast of Copenhagen. (Thevideo runs for 1 minute and 10 seconds, 1087 K, soundtrack included, freeQuickTime plugin required).
These foundations are a hybrid between steel and concrete foundationssince concrete is only used as the ballast in the bottom section (thecylindrical 17 m slab).
| Back | Home | Forward |© Copyright 2000 Soren Krohn
Updated 6 August 2000http://www.windpower.org/tour/rd/foundoff.htm

Wind presently covers about10 per cent of the electricityconsumption in the Westernpart of Denmark.
The ELSAM electricitysupply area comprises theWestern part of Denmarkwith the Jutland Peninsulaand the neighbouring islandof Fyn. The area has apopulation of 3 million.
Wind Turbines in the ElectricalGrid:Wind Energy VariationsThe vast majority of the installed power of wind turbines in the world is gridconnected, i.e. the turbines feed their electricity directly into the publicelectrical grid.
Wind Energy Production During a Fine SummerWeek
The graph above shows a summer week of electricity output from the 650MW (megawatts) of wind turbines installed in the Western part of Denmark.The blue curve at the top left shows the power output on 25 June 1997,while the orange curve shows the output the preceding day.
Electrical power consumption was 2,700 MW at the time this curve wasprinted from the power company control centre. Wind was supplying 270MW i.e. wind was supplying exactly 10 per cent of the electricityconsumption of 3 million people at 13:45 hours when we visited the controlcentre.
Wind Matches Daily Electricity ConsumptionPatternsAt the bottom of the graph you can see the power output of the fivepreceding days. On average, the month of June has the lowest wind poweroutput during the year in Denmark. Some days of fresh winds, however,began in the early morning hours of 24 June.

The typical weather pattern is that winds are low at night, and higherduring the day, as you can see from the five days of moderate winds.
This means that wind electricity generally fits well into the electricityconsumption pattern, i.e. wind electricity tends to be more valuable to theelectrical grid systems than if it were being produced at a random level.
| Back | Home | Forward |© Copyright 1999 Soren Krohn. All rights reserved.
Updated 6 August 2000http://www.windpower.org/tour/grid/index.htm

Seasonal Variation in WindEnergy
Wind Matches Seasonal Electricity ConsumptionPatternsIn temperate zones summer winds are generally weak compared to winterwinds. Electricity consumption is generally higher in winter than in summerin these regions.
In the cooler areas of the globe, electrical heating is therefore ideal incombination with wind energy, because the cooling of houses varies with thewind speed much like the electricity production of wind turbines vary withwind speeds.
In electricity systems that are not based on hydropower and wind theremay be good reasons to avoid electrical heating, however:
Conventional power plant wastes a lot of heat, and thus fuel (at least 60%),i.e. for every unit of useful heat consumed by a household, the power stationwill waste 1.5 units of heat (and fuel).
Annual Variation in Wind Energy

Just like harvest yields vary from year to year in agriculture, you will findthat wind patters may vary from year to year. Typically, the variations areless than the changes in agricultural production. In the case of Denmark, youwill see that output from wind turbines typically have a variation (a standarddeviation) of some 9 to 10 per cent. You may see the monthly and yearlyvariations in Denmark during more than 20 years on the web siteVindstyrke.
| Back | Home | Forward |© Copyright 2000 Soren Krohn. All rights reserved.
Updated 14 February 2001http://www.windpower.org/tour/grid/season.htm

Wind Turbines and PowerQuality IssuesThe buyer of a wind turbine does not need to concern himself with localtechnical regulations for wind turbines and other equipment connected to theelectrical grid. This responsibility is generally left to the turbinemanufacturer and the local power company.
For the people who are technically minded, we go into some of theelectrotechnical issues involved in connecting a turbine to the grid on thispage.
Power Quality
The term "power quality" refers to the voltage stability, frequency stability,and the absence of various forms of electrical noise (e.g. flicker or harmonicdistortion) on the electrical grid. More broadly speaking, power companies(and their customers) prefer an alternating current with a nice sinusoidalshape, such as the one in the image above. (If you are not familiar with thebasics of alternating current (AC) it may be useful to consult the ReferenceManual about this subject before continuing).
Starting (and Stopping) a TurbineMost electronic wind turbine controllers are programmed to let the turbinerun idle without grid connection at low wind speeds. (If it were gridconnected at low wind speeds, it would in fact run as a motor, as you canread about on the generator page). Once the wind becomes powerful enoughto turn the rotor and generator at their rated speed, it is important that theturbine generator becomes connected to the electrical grid at the rightmoment.
Otherwise there will be only the mechanical resistance in the gearbox andgenerator to prevent the rotor from accelerating, and eventually

overspeeding. (There are several safety devices, including fail-safe brakes,in case the correct start procedure fails, which you may have read in thesection on Wind Turbine Safety).
Soft Starting with ThyristorsIf you switched a large wind turbine on to the grid with a normal switch, theneighbours would see a brownout (because of the current required tomagnetise the generator) followed by a power peak due to the generatorcurrent surging into the grid. You may see the situation in the drawing in theaccompanying browser window, where you see the flickering of the lampwhen you operate the switch to start the wind turbine. The same effect canpossibly be seen when you switch on your computer, and the transformer inits power supply all of a sudden becomes magnetised.
Another unpleasant side effect of using a "hard" switch would be to put alot of extra wear on the gearbox, since the cut-in of the generator wouldwork as if you all of a sudden slammed on the mechanical brake of theturbine.
Large power thyristors inwind turbines get very hotwhen they are activated.They have to be equippedwith aluminium heat sinksand fans as you see in thepicture to the right.Photograph© 1998 Soren Krohn
To prevent thissituation, modernwind turbines are softstarting, i.e. theyconnect anddisconnect graduallyto the grid usingthyristors, a type ofsemiconductorcontinuous switcheswhich may becontrolledelectronically. (Youmay in fact have athyristor in your ownhome, if you own a
modern light dimmer, where you can adjust the voltage on your lampscontinuously).
Thyristors waste about 1 to 2 per cent of the energy running through them.Modern wind turbines are therefore normally equipped with a so calledbypass switch, i.e. a mechanical switch which is activated after the turbinehas been soft started. In this way the amount of energy wasted will beminimised.
Weak Grids, Grid ReinforcementIf a turbine is connected to a weak electrical grid, (i.e. it is vary far away in aremote corner of the electrical grid with a low power-carrying ability), theremay be some brownout / power surge problems of the sort mentioned above.In such cases it may be necessary to reinforce the grid, in order to carry thefluctuating current from the wind turbine.
Your local power company has experience in dealing with these potentialproblems, because they are the exact mirror-image of connecting a largeelectricity user, (e.g. a factory with large electrical motors) to the grid.

FlickerFlicker is an engineering expression for short lived voltage variations in theelectrical grid which may cause light bulbs to flicker. This phenomenon maybe relevant if a wind turbine is connected to a weak grid, since short-livedwind variations will cause variations in power output. There are variousways of dealing with this issue in the design of the turbine, mechanically,electrically, and using power electronics.
Preventing "Islanding"Islanding is a situation which may occur if a section of the electrical gridbecomes disconnected from the main electrical grid, e.g. because ofaccidental or intended tripping of a large circuit breaker in the grid (e.g. dueto lightning strikes or short circuits in the grid). If wind turbines keep onrunning in the isolated part of the grid, then it is very likely that the twoseparate grids will not be in phase after a short while.
Once the connection to the main grid is re-established it may cause hugecurrent surges in the grid and the wind turbine generator. It would also causea large release of energy in the mechanical drive train (i.e. the shafts, thegear box and the rotor of the wind turbine) much like "hard switching" theturbine generator onto the grid would do.
The electronic controller of the wind turbine will therefore constantly haveto monitor the voltage and frequency of the alternating current in the grid. Incase the voltage or frequency of the local grid drift outside certain limitswithin a fraction of a second, the turbine will automatically disconnect fromthe grid, and stop itself immediately afterwards. (Normally by activating theaerodynamic brakes as explained in the section on wind turbine safety).
| Back | Home | Forward |© Copyright 2000 Soren Krohn. All rights reserved.
Updated 9 September 2000http://www.windpower.org/tour/grid/rein.htm
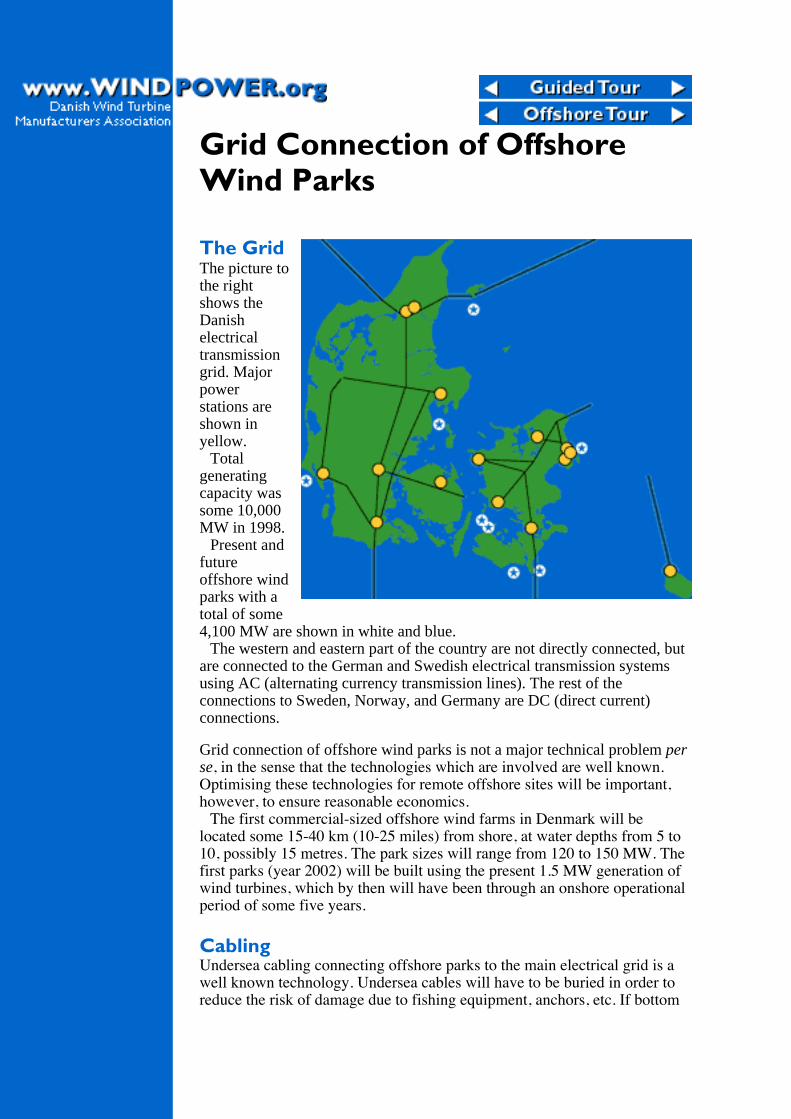
Grid Connection of OffshoreWind Parks
The GridThe picture tothe rightshows theDanishelectricaltransmissiongrid. Majorpowerstations areshown inyellow.
Totalgeneratingcapacity wassome 10,000MW in 1998.
Present andfutureoffshore windparks with atotal of some4,100 MW are shown in white and blue.
The western and eastern part of the country are not directly connected, butare connected to the German and Swedish electrical transmission systemsusing AC (alternating currency transmission lines). The rest of theconnections to Sweden, Norway, and Germany are DC (direct current)connections.
Grid connection of offshore wind parks is not a major technical problem perse, in the sense that the technologies which are involved are well known.Optimising these technologies for remote offshore sites will be important,however, to ensure reasonable economics.
The first commercial-sized offshore wind farms in Denmark will belocated some 15-40 km (10-25 miles) from shore, at water depths from 5 to10, possibly 15 metres. The park sizes will range from 120 to 150 MW. Thefirst parks (year 2002) will be built using the present 1.5 MW generation ofwind turbines, which by then will have been through an onshore operationalperiod of some five years.
CablingUndersea cabling connecting offshore parks to the main electrical grid is awell known technology. Undersea cables will have to be buried in order toreduce the risk of damage due to fishing equipment, anchors, etc. If bottom

conditions permit, it will be most economic to wash cables into the seabed(using high pressure water jets) rather than digging or ploughing cables intothe bottom of the sea.
VoltagesInside the large 120-150 MW wind parks being planned in Denmark, it islikely that 30-33 kV connections will be used. In the middle of each parkthere will probably be a platform with a 30 to 150 kV transformer station,plus possibly a number of service facilities.
Connection to the mainland will be done using 150 kV connections.
Reactive Power is related tophase-shifting of alternatingcurrent, which makes itmore difficult to transportusable energy through theelectrical grid. See theReference Manual on thisweb site for the technicaldetails.
Reactive Power, HVDCThe undersea cables will have a high electrical capacitance, which may beuseful to supply reactive power to the parks. It may be optimal to have someform of variable reactive power compensation built into the system,depending on the precise grid configuration. If the distance to the main gridis considerable, an interesting alternative could be to connect the parks to themainland using high voltage direct current connections (HVDC).
Remote SurveillanceRemote surveillance of the parks will obviously be even more importantthan on land. Radio links for this purpose have already been in operation atthe Tunoe Knob and Vindeby offshore wind parks for some years.
With the the large 1.5 MW units foreseen for these parks, it may beeconomic to install e.g. extra sensors on each piece of equipment, (andcontinuously analyse its minute vibrations which tend to change their patternas the part is worn down). This technology which is well known in certainparts of industry to ensure optimum maintenance of machinery.
Preventive MaintenanceSince weather conditions may prevent service personnel from approachingthe wind turbines at times of bad weather, it is extremely important to ensurea high availability rate of offshore wind turbines. Preventive maintenancecheck programmes may need to be optimised for remote offshore locations.
| Back | Home | Forward |© Copyright 1998 Soren Krohn. All rights reserved.
Updated 6 August 2000http://www.windpower.org/tour/grid/offshore.htm

Wind Turbines and theEnvironment: Landscape
Hints About Landscape Architecture and WindTurbines
Wind turbines are
always highly visibleelements in thelandscape. Otherwisethey are not locatedproperly from ameteorological pointof view, cf. the pageon wind turbine siting.
The image to the leftshows the wind farmat Kappel, Denmark. Itis perhaps the mostaesthetically pleasinglayout of any windfarm known to thisauthor. The shape ofthe dike along thecoastline is repeated inthe line of turbines.
There is onedisturbing element in
the picture above: The single turbine next to the farmhouse, which interruptsthe otherwise smooth pattern of turbines. (That turbine was there before thewind farm was built).
Simple Geometrical PatternsIn flat areas it is often a good idea to place turbines in a simple geometricalpattern which is easily perceived by the viewer. Turbines placedequidistantly in a straight line work well, but the example in the pictureabove may be even more elegant, where landscape contours invite such asolution.
There are limits to the usefulness of being dogmatic about using simplegeometrical patterns, however:
In hilly landscapes it is rarely feasible to use a simple pattern, and itusually works better to the the turbines follow the altitude contours of thelandscape, or the fencing or other characteristic features of the landscape.
Whenever turbines are placed in several rows, one will rarely be able toperceive the pattern when the park is viewed from normal eye level. Onlywhen one is standing at the end of a row, does it really appear as an orderedlayout. In the next panorama picture, you will probably only be able todiscern three rows of turbines, while the rest appear to be scattered aroundthe landscape.

Photograph © 1997by Suzanne Clemmesen
Light Grey PaintThe picture above shows one of the larger groupings of Danish built windturbines at Näsudden on the island of Gotland in Sweden. The grey painton the turbines make them blend well into the landscape.
Size of Wind TurbinesLarge wind turbines enable the same amount of energy to be produced withfewer wind turbines. There may be economic advantages to this, such aslower maintenance costs.
From an aesthetic point of view, large wind turbines may be an advantagein the landscape, because they generally have lower rotational speed thansmaller turbines. Large turbines therefore do not attract the eye the wayfast-moving objects generally do.
People's Perception of Wind Turbines in theLandscapeTo a large extent it is a matter of taste how people perceive that windturbines fit into the landscape.
Numerous studies in Denmark, the UK, Germany, and the Netherlandshave revealed that people who live near wind turbines are generally morefavourable towards them than city dwellers. You may find more detailsabout these studies in the article Public Attitudes Toward Wind Power onthis web site.
A beautiful book of photographic examples of Wind Turbines in theLandscape may be purchased from Birk Nielsens Tegnestue, Aarhus,Denmark. The price is approximately 150 DKK, plus postage.
| Back | Home | Forward |© Copyright 2000 Soren Krohn. All rights reserved.
Updated 26 September 2000http://www.windpower.org/tour/env/index.htm

Sound from Wind TurbinesNoise is a Minor Problem TodayIt is interesting to note that the sound emission levels for all new Danishturbine designs tend to cluster around the same values. This seems toindicate that the gains due to new designs of e.g. quieter rotor blade tips arespent in slightly increasing the tip speed (the wind speed measured at the tipof the rotor blade), and thus increasing the energy output from the machines.
In the guided tour section on Wind Turbine Design we have explained howturbines today are engineered to reduce sound emissions.
It thus appears that noise is not a major problem for the industry, given thedistance to the closest neighbours (usually a minimum distance of about 7rotor diameters or 300 m = 1000 ft. is observed).
The concepts of sound perception and measurement are not widely knownin the public, but they are fairly easy to understand, once you get to gripswith it. You can actually do the calculations yourself in a moment.
Planning Wind Turbine Installation in Regard toSound
Fortunately, it is usually reasonably easy to predict the sound effect fromwind turbines in advance. On one of the following pages you may even tryfor yourself, using the Sound Map Calculator, which was used to draw thepicture.
Each square measures 43 by 43 metres, corresponding to one rotordiameter. The bright red areas are the areas with high sound intensity, above

55 dB(A). The dashed areas indicate areas with sound levels above 45dB(A), which will normally not be used for housing etc. (We get to theexplanation of the sound level and dB(A) in a moment).
As you can see, the zone affected by sound extends only a few rotordiameters' distance from the machine.
Background Noise: Masking Noise Drowns outTurbine NoiseNo landscape is ever completely quiet. Birds and human activities emitsound, and at winds speeds around 4-7 m/s and up the noise from the windin leaves, shrubs, trees, masts etc. will gradually mask (drown out) anypotential sound from e.g. wind turbines.
This makes it extremely difficult to measure sound from wind turbinesaccurately. At wind speeds around 8 m/s and above, it generally becomes aquite abstruse issue to discuss sound emissions from modern wind turbines,since background noise will generally mask any turbine noise completely.
The Influence of the Surroundings on SoundPropagationSound reflection or absorption from terrain and building surfaces may makethe sound picture different in different locations. Generally, very little soundis heard upwind of wind turbines. The wind rose is therefore important tochart the potential dispersion of sound in different directions.
Human Perception of Sound and NoiseMost people find it pleasant listen to the sound of waves at the seashore, andquite a few of us are annoyed with the noise from the neighbour's radio,even though the actual sound level may be far lower.
Apart from the question of your neighbour's taste in music, there isobviously a difference in terms of information content. Sea waves emitrandom "white" noise, while you neighbour's radio has some systematiccontent which your brain cannot avoid discerning and analysing. If yougenerally dislike your neighbour you will no doubt be even more annoyedwith the noise. Sound experts for lack of a better definition define "noise" as"unwanted sound".
Since the distinction between noise and sound is a highly psychologicalphenomenon, it is not easy to make a simple and universally satisfactorymodelling of sound phenomena. In fact, a recent study done by the Danishresearch institute DK Teknik seems to indicate that people's perception ofnoise from wind turbines is governed more by their attitude to the source ofthe noise, rather than the actual noise itself.
| Back | Home | Forward |© Copyright 2000 Soren Krohn. All rights reserved.
Updated 9 September 2000http://www.windpower.org/tour/env/sound.htm

Measuring and CalculatingSound LevelsThe dB(A) ScalePublic authorities around the world use the so-called dB(A), or decibel (A) ,scale to quantify sound measurement. To give you an idea of the scale, lookat the table below.
SoundLevel
thresholdof hearing whisper talking city
traffic rock
concertjet engine10 m away
dB(A) 0 30 60 90 120 150
The dB(A) scale measures the sound intensity over the whole range ofdifferent audible frequencies (different pitches), and then it uses a weighingscheme which accounts for the fact that the human ear has a differentsensitivity to each different sound frequency. Generally, we hear better atmedium (speech range) frequencies than at low or high frequencies. ThedB(A) system says, that the sound pressure at the most audible frequenciesare to be multiplied by high numbers while the less audible frequencies aremultiplied by low numbers, and everything is then added up to get an indexnumber.
(The (A) weighing scheme is used for weak sounds, such as wind turbines.There exist other weighing schemes for loud sounds called (B) and (C),although they are rarely used).
The dB-scale is a logarithmic, or relative scale. This means, that as youdouble the sound pressure (or the energy in the sound) the index increasesby approximately 3. A sound level of 100 dB(A) thus contains twice theenergy of a sound level of 97 dB(A). The reason for measuring sound thisway is that our ears (and minds) perceive sound in terms of the logarithm ofthe sound pressure, rather than the sound pressure itself.
Most people will say, that if you increase the dB(A) by 10, you double thesubjective loudness of the sound.
In case you are interested in the exact definitions, take a look at theReference Manual on Acoustics of this web site.
Sound Propagation and Distance: Inverse SquareLaw

The energy in soundwaves (and thus thesound intensity) willdrop with the square ofthe distance to the soundsource. In other words,if you move 200 maway from a windturbine, the sound levelwill generally be onequarter of what it is 100m away. A doubling ofyour distance will thusmake the dB(A) leveldrop by 6.
At one rotor diameterdistance (43 m) from thebase of a wind turbineemitting 100 dB(A) you will generally have a sound level of 55-60 dB(A)corresponding to a (European) clothes dryer. 4 rotor diameters (170 m) awayyou will have 44 dB(A), corresponding to a quiet living room in a house. 6rotor diameters (260 m) away you will have some 40 dB(A).
The precise relationship between sound level and distance from the soundsource is given in a table on the Reference Manual on Acoustics of this website.
In practice, sound absorption and reflection (from soft or hard surfaces)may play a role on a particular site, and may modify the results shown here.
Adding Sounds from Several SourcesIf we have two wind turbines rather than one, located at the same distancefrom our ears, naturally the sound energy reaching us will double. As wehave just learned, this means that two turbines will increase the sound levelby 3 dB(A). Four turbines instead of one (at the same distance) will increasethe sound level by 6 dB(A). You will actually need ten turbines placed at thesame distance from you, in order to perceive that the subjective loudnesshas doubled (i.e. the dB level has increased by 10).
If you wish to learn the details about adding sounds together, take a look atthe Reference Manual on Acoustics in this web site.
The Pure Tone PenaltyThe fact that the human ear (and mind) discerns pure tones more easily than(random) white noise, means the authorities may wish to take that intoaccount when doing sound estimates. They consequently often have ruleswhich specify that you add a certain number to the dB(A) figure in case youhave pure tones present in a sound.
Wind Turbine Noise Information in PracticeIn accordance with international standards manufacturers generally specify atheoretical dB(A) level for sound emissions which assumes that all soundoriginates from a central point, although in practice, of course, it willoriginate from the whole surface of the machine and its rotor.
Sound pressure thus calculated is typically around 96-101 dB(A) formodern wind turbines. The figure itself is rather uninteresting, since there

will not be a single point, where you can experience that sound level!Rather, it is useful for predicting the sound level at different distances fromthe wind turbine.
Pure tones have generally be eradicated completely for modern windturbines, at least in the case of the modern turbines listed in the catalogue onthe Wind Power Calculator page.
Legal Noise LimitsAt distances above 300 m the maximum theoretical noise level from highquality wind turbines will generally be significantly below 45 dB(A)outdoors, corresponding to the legislation in Denmark. (For built-up areaswith several houses, a noise limit of 40 dB(A) is the legal limit in Denmark).
Noise regulations vary from country to country. In practice the samemachine designs can be used everywhere.
Current Practice: Calculations Rather thanMeasurementCalculating potential sound emission from wind turbines is generallyimportant in order to obtain planning permission (from the publicauthorities) for installing wind turbines in densely populated areas.
Generally speaking, it is far easier to calculate the potential soundemissions than to measure them in practice.
The reason why it is difficult to measure the sound is that the sound levelhas to be some 10 dB(A) above the background noise in order to measure itproperly. The background noise from leaves, birds, and traffic willfrequently be above 30 dB(A), however. In most places in the world publicauthorities therefore rely on calculations rather than measurements, whengranting planning permission for wind turbines.
| Back | Home | Forward |© Copyright 2000 Soren Krohn. All rights reserved.
Updated 9 September 2000http://www.windpower.org/tour/env/db/dbdef.htm

Sound Map CalculatorThis calculator requires a Netscape 3.0 or later browser to work. If you are using Navigator 3.0 or later and you see thismessage, you need to enable JavaScript. Choose Options | Network Preferences, choose the Languages tab, and click EnableJavaScript. Then click reload on your browser. Do not operate the form until this page and its programme have loadedcompletely, and the picture has appeared in the frame below. Click in grid to insert or remove turbines. Point with mouse to
read sound level in dB(A) in your browser's status line. Source sound level for next turbine is set to dB(A), Grid
unit size is set to m. (It is convenient to use the rotor diameter as your grid size when placing turbines).
Maximum permissible sound level at houses is set to dB(A). This grid has grid points each way. You mayuse a grid with up to 32 points if you have a fast computer with enough memory allocated for Netscape. If you change anumber, press the tab key, click CALCULATE, or click outside the field you just entered to start calculations and plot. ClickCLEAR to delete the turbines and reset to default data.
| Back | Home | Forward |© Copyright 1997 Danish Wind Turbine Manufacturers Association
Updated 6 August 2000http://www.windpower.org/tour/env/db/dbcalc.htm

Wind Turbine Sound CalculatorThis calculator requires a Netscape 3.0 or later browser to work. If you are using Navigator 3.0 or laterand you see this message, you need to enable JavaScript. Choose Options | Network Preferences, choosethe Languages tab, and click Enable JavaScript. Then click reload on your browser. Do not operate theform until this page and its programme have loaded completely. You may enter source noise and distancefor up to ten wind turbines in the worksheet below to calculate the resulting sound at a particular point.The calculator assumes that sound absorption and reflection cancel one another out, although local noiseregulations may specify rules for this. You should have read the pages on Sound from Wind Turbines andMeasuring and Calculating Sound Levels before using the calculator. You may learn more about thetechnical details of sound calculations in the Reference Manual on Acoustics.
TurbineSource dB(A) Distance m Resulting dB(A)
Sound LevelSound PowerW/m2
1
2
3
4
5
6
7
8
9
10
Sum=
| Back | Home | Forward |© Copyright 1998 Soren Krohn. All rights reserved.
Updated 6 August 2000http://www.windpower.org/tour/env/db/db2calc.htm

Energy Payback Period for WindTurbinesTwo to Three Months RequiredModern wind turbines rapidly recover all the energy spent in manufacturing,installing, maintaining, and finally scrapping them. Under normal windconditions it takes between two and three months for a turbine to recover allof the energy involved.
This is one of the main results of a life cycle analysis of wind turbinesdone by the Danish Wind Turbine Manufacturers Association.
The study includes the energy content in all components of a wind turbine,and it includes the global energy content in all links of the production chain.
You may download the 16 page report from the Publications page on thisweb site.
Input Output Analysis MethodTo find the results, the study employs a so called input output model of theDanish economy published by the Danish Central Bureau of Statistics. Theinput output model divides the economy into 117 sub sectors, and accountsfor the flows of 27 different energy goods (fuels etc.) between the 117sectors.
The basic advantage of using this method instead of engineeringcalculations, is that we are able to account properly for the amount of energyused by producers of components and manufacturing equipment, buildingsetc. in all links of the production chain. The result is a large 117 by 117 tableof energy flows. (Doing a mathematical operation on the table called matrixinversion we obtain the amount of energy per dollar of output).
The Energy Balance for Offshore Wind TurbinesOffshore wind turbines may have a slightly more favourable energy balancethan onshore turbines, depending on local wind conditions. In Denmark andthe Netherlands, where wind turbines onshore are typically placed in flatterrain, offshore wind turbines will generally yield some 50 per cent moreenergy than a turbine placed on a nearby onshore site. The reason is the lowroughness of the sea surface.
On the other hand, the construction and installation of foundations require50 per cent more energy than onshore turbines.
It should be remembered, however, that offshore wind turbines have alonger expected lifetime than onshore turbines, in the region of 25 to 30years. The reason is that the low turbulence at sea gives lower fatigue loadson the wind turbines.
Analysis of 1980 Vintage Turbines1980 wind turbines do surprisingly well in the studies of the energy balance.The analysis shows that while small Danish 1980 turbines of 10-30 kW tookalmost a year to recover the energy spent in manufacturing, installing anddecommissioning them, turbines of 55 kW took some 6 months to recover

all of the energy.
| Back | Home | Forward |© Copyright 1998 Soren Krohn. All rights reserved.
Updated 27 September 2000http://www.windpower.org/tour/env/enpaybk.htm

Common Eider(Somateria Mollissima)© 1996 Søren Krohn
Birds and Wind TurbinesBirds often collide with high voltage overhead lines, masts, poles, andwindows of buildings. They are also killed by cars in the traffic.
Birds are seldom bothered by wind turbines, however. Radar studies fromTjaereborg in the western part of Denmark, where a 2 megawatt windturbine with 60 metre rotor diameter is installed, show that birds - by day ornight - tend to change their flight route some 100-200 metres before theturbine and pass above the turbine at a safe distance.
In Denmark there are several examples of birds (falcons) nesting in cagesmounted on wind turbine towers.
The only known site with bird collision problems is located in theAltamont Pass in California. Even there, collisions are not common, but theyare of extra concern because the species involved are protected by law.
A study from the Danish Ministry of the Environment says that powerlines, including power lines leading to wind farms, are a much greaterdanger to birds than the wind turbines themselves.
Some birds get accustomed to wind turbines very quickly, others take asomewhat longer time. The possibilities of erecting wind farms next to birdsanctuaries therefore depend on the species in question. Migratory routes ofbirds will usually be taken into account when siting wind farms, althoughbird studies from Yukon show that migratory birds do not collide with windturbines.
| Back | Home | Forward |© Copyright 2001 Soren Krohn. All rights reserved.
Updated 28 April 2002http://www.windpower.org/tour/env/birds.htm

Birds and Offshore WindTurbines
Ornithologists' (Birdwatchers) tower erected
next to the offshore windfarm at Tunø Knob,
Denmark, for a three-yearavian study which were
completed in 1997.Photograph © 1997
by Soren Krohn
Offshore wind turbines have nosignificant effect on water birds. That isthe overall conclusion of a three yearoffshore bird life study made at theDanish offshore wind farm Tunø Knob.
The offshore wind park has beenplaced in this particular area because ofa very substantial population of eiders(Somateria mollissima) and a smallpopulation of scoters (Melanitta nigra).At Tunø Knob more than 90 per cent ofthe birds are eiders, and about 40 percent of the North Atlantic population ofeiders are wintering in the Danish part ofthe Kattegat Sea.
The Studies were conducted by theNational Environmental ResearchInstitute at Kalø, Denmark.
Eight Different StudiesThe very thorough study consists of both aerial surveys, bird counts fromobservation towers, and observations of the spatial distribution of birds atthe offshore site as well as at a similar control site in the same region.
In the three year period some eight experiments were carried out. Thecentral experiment was a so called before-after-control-impact study. From awatch tower placed one kilometre from the turbines and from aeroplanesscientists mapped the population of eiders the winter before the erection ofthe turbines and the following two winters.
Declining PopulationDuring the three year period the number of Eiders declined by 75 per centand the number of scoters declined by more than 90 per cent. But moreinterestingly, the population of water birds fell in all of the shoal of the TunøKnob and not just around the turbines. This indicated that other factors thanthe turbines had to be taken into account.
At the same time the area was repeatedly surveyed by divers in order todetermine variations in the amount of blue mussels (Mytilus edulis) whichthe birds prey on.
Less FoodThe amount of blue mussels showed also great natural variation over thethree years. Especially the population of smaller mussels which are theeiders' preferred prey fell significantly in the three year period. With thesefindings in mind the scientific group concluded that the changes in size andcomposition of the blue mussel population could explain the variation in thenumber of eiders before and after the construction of the wind farm.

Safe DistanceControlled experiments stopping the wind turbines for a certain period hasbeen performed. In another experiment decoys was used to attract the eiders,which are very social birds.
The result of the experiment using groups of decoys at different distancesfrom the wind farm showed that the eiders were reluctant to pass at distancesof 100 m or closer to the turbines.
The on/off experiment showed that there was no detectable effect ofrevolving rotors on the abundance of eiders in the area. In fact the eiders -like people - apparently prefer rotating turbines (but that result was clearlyinsignificant).
The overall conclusion of the final two experiments were that on one handthe eiders do keep a safe distance to the turbines, but on the other hand theydo not get scared away from their foraging areas by revolving rotors. Also,the eiders showed normal landing behaviour until 100 m from the turbines.
Mussels MatterThe prevalence of eiders in thedifferent zones around the turbinescould be fully accounted for by therelative abundance of food.
The English edition of this study"Impact Assessment of anOff-shore Wind Park on Sea Ducks,
NERI Technical Report No. 227 1998" is available from Miljøbutikken, i.e.the Sales office of the Danish Ministry of the Environment and Energy.
| Back | Home | Forward |© Copyright 1998 Soren Krohn. All rights reserved.
Updated 6 August 2000http://www.windpower.org/tour/env/birdsoff.htm

Shadow Casting from WindTurbines
Wind turbines, like other tall structures will cast a shadow on theneighbouring area when the sun is visible. If you live very close to the windturbine, it may be annoying if the rotor blades chop the sunlight, causing aflickering (blinking) effect while the rotor is in motion.
A bit of careful planning, and the use of good software to plan your windturbine site can help you resolve this problem, however. If you know wherethe potential flicker effect is of a certain size, you may be able to place theturbines to avoid any major inconvenience for the neighbours.
Few RulesShadow casting is generally not regulated explicitly by planning authorities.In Germany, however, there has been a court case in which the judgetolerated 30 hours of actual shadow flicker per year at a certain neighbour'sproperty. In the 30 hours, it appears, one should only include flicker whichoccur during the hours where the property is actually used by people (whoare awake).
Predicting Shadow FlickerFortunately, we are able to predict quite accurately the probability of whenand for how long there may be a flicker effect. We may not know in advancewhether there is wind, or what the wind direction is, but using astronomyand trigonometry we can compute either a likely, or a "worst case" scenario,i.e. a situation where there is always sunshine, when the wind is blowing allthe time, and when the wind and the turbine rotor keep tracking the sun byyawing the turbine exactly as the sun moves.
Figuring out the exact shape, place, and time of the shadow from a wind

turbine requires a lot of computation, but at least one professional windsoftware programme can do this very accurately, even in hilly terrain, andwith house windows of any size, shape, location and inclination facing inany direction. (See the Links page for the address of wind softwarecompanies).
Do it YourselfOn one of the following pages we have included another shadow calculator,which will give you a possibility of computing a shadow map of yourparticular area in flat terrain. The calculator gives you a lot of options toproduce realistic estimates of actual shadow casting. Fortunately, you willdiscover that shadow casting problems are generally restricted to a few areasclose to the turbine.
Since the calculation of shadow casting requires lots of computer power,we have included a number of important general results on the followingpages.
| Back | Home | Forward |© Copyright 1998 Soren Krohn. All rights reserved.
Updated 27 September 2000http://www.windpower.org/tour/env/shadow/index.htm

Calculating Shadows from WindTurbinesDaily Shadow Variation - Worst Case
This simulation of shadowcasting shows how the rotorshadow moves (worst case) fromsunrise to sunset on a particularday at a certain location on theglobe. The image is seen directlyfrom above, with the centre ofthe wind turbine tower placed atthe tiny black dot in the centre.The shadow positions are shownfor every half hour during theday. Shadows, of course, are long
around sunrise and sunset, and short at noon.This particular set of images was made for 55° Northern latitude for 21
September, assuming a 43 m rotor diameter on a 50 m tower, using theshadow simulation programme on this web site.
Doing a worst case simulation we assume that the rotor yaws so as to trackthe movement of the sun exactly. This is is equivalent to assuming that therotor is a solid balloon (or a Darrieus turbine).
Map of maximum (worstcase) shadows around a 600kW wind turbine placed at55 degrees Northernlatitude. The turbine has a 43m rotor diameter and a 50 mtower. The map is 1200 mwide (East - West) and 750m in the North - Southdirection. The map wascomputed using the WindTurbine Shadow Calculatoron this web site.
Annual and Daily Shadows - Worst Case
This map shows how shadows aretypically distributed around a windturbine throughout a year, assuming aworst case direction of the rotor. Youwill notice a number ofkidney-shaped or bell-shaped areasaround the wind turbine in the centreof the map. Each of the grey areasrepresents a certain maximumnumber of minutes of shadow fromthe wind turbine rotor. Since this mapwas computed for 55 degrees latitudein the Northern hemisphere, there isno shadow South of the turbine.
Timing ShadowsYou will notice from the white lines on the map, that we can easily predictthe time of day when shadows may occur. The shadow will e.g. obviously bedirectly North of the turbine at solar noon, when the sun reaches itsmaximum height in the sky. (Solar noon varies a bit during the year relative

to our clocks, but it is fairly close to 12 o' clock, local time). The shadowwill be to the bottom left at 4 o'clock in the morning on a summer day, soshadows to the Southwest are a minor problem in the Northern hemisphere.(The shadows occur in summer only, and at 4 in the morning mostneighbours will be asleep anyway).
The commercial software we referred to earlier will tell you exactly thedates and times when shadows may occur.
| Back | Home | Forward |© Copyright 1998 Soren Krohn. All rights reserved.
Updated 26 September 2000http://www.windpower.org/tour/env/shadow/shadow.htm

Refining Shadow Calculations forWind TurbinesRandom Rotor Direction (Random Azimuth)It is very unlikely that the wind and thus the rotor will track the sun inpractice. We may therefore get a more realistic result if we modify ourcalculations by assuming that the rotor canassume any position at any time. In the smallpicture to the far right you can see a situationwhere the rotor is directly facing the sun. Thetiny white dot near the bottom right is the centreof the wind turbine tower.
Now, let us assume that we yaw the rotor out of its position by one degree,take a snapshot of the shadow image, then yaw it by another degree, takeanother snapshot etc., until we have done a full 360 degree turn. Then weoverlay all our 360 snapshots, and what we end up with will look similar tothe small image to the left: The centre will get the most of the shadow, butas we move towards the outer edge (where the vertical edges of the rotordisc cast their shadows) the overall shadow intensity will decrease.
Shadow casting is on average reduced to 63% of the worst case results, ifyou assume a random rotor direction. Ideally, we should have a wind rose,(preferably hourly for each day or month) to do an exact calculation.
Fixed Rotor Direction (Fixed Azimuth)In practice the wind turbine rotor will follow thewind direction (if the wind speed is above the cutin speed). This image shows the shape of an area(in red) which gives 10 hours or more ofshadows per year at 55° Northern latitude withthe rotor yaw (azimuth) fixed at an angle of -45degrees (i.e. with the wind permanently comingfrom the Southwest or Northeast). As you cansee, there will be almost no shadows at an angleof +45 degrees, i.e. in the direction parallel to the
rotor plane.Shadow casting is typically reduced to around 62% of the worst case
results, if we assume a fixed rotor direction.
Actual Rotor Direction (Wind Rose)Usually we will already have a wind rose with a frequency distribution ofthe wind in the different directions of the compass when we are planning awind turbine site. Using that information, we may calculate a more exactshadow picture. In the case of our test example, Copenhagen, shadows arereduced to some 64 per cent of the comparable worst case value.

Turbine Operating HoursThe rotor will not be running all the time, so we may multiply the number ofminutes of shadow flicker by a factor of typically 0.75, depending on thelocal wind climate, (and ideally using the correct factor for daytime duringeach month).
Actual Sunshine HoursWhen studying shadows, we should only count the fraction of the time whenthe sun is actually shining brightly, ideally using the correct fraction for eachhour of the day during the year. In 1853 the first reliable sunshine recordingdevice was invented (and improved in 1879), which means that in manyparts of the world the meteorological institutes have very accurate long termstatistics on the number of hours of bright sunshine during the year.
The number of bright sunshine hours varies with the geographical locationand the season (summer or winter). We have included data for three Danishsites (Christiansø, Copenhagen, and Viborg) where the number of sunshinehours vary from 44 to 40, and 36 per cent of the time.
Combining Turbine operating hours, Actual RotorDirection, and Actual Sunshine HoursIf we use both turbine operating hours, the actual rotor direction, and theactual bright sunshine hours we get a result (in the case of Denmark) whichis some 18 per cent of the worst case assumption, using 75% operating hoursin both cases. (The percentages given above are the results of simulations forCopenhagen on a 720 by 720 metre square with a turbine in the centre with43 m rotor diameter and 50 m hub height).
The two images below compare a worst case simulation (with 75%operating hours) with an actual simulation for Copenhagen (also 75%operating hours) using both sunshine and wind statistics. The red area is thezone with 30 hours of shadow or more per year. Each map represents 720 by720 metres.
The important conclusion of this simulation is that actual sunshine hoursplay a very important role in diminishing the amount of shadows north ofthe turbine (in the Northern hemisphere). The reason why this is important isthat there are very few hours of sunshine when the sun is low in the sky tothe south during winter.

| Back | Home | Forward |© Copyright 1998 Soren Krohn. All rights reserved.
Updated 26 September 2000http://www.windpower.org/tour/env/shadow/shadowr.htm

Shadow Variations from WindTurbinesMonthly Shadow Variation
This movie shows the areas affected by shadowcasting from a wind turbine. The movie showshow the area varies month by month - in this casein relatively high latitudes (55°) in the Northernhemisphere. The darkest areas represent the areaswith most shadows.
In winter the sun stays in the Southern part ofthe sky, and the shadows are distributed in a V-shaped area to the North ofthe turbine.
In summer the sun rises very early in the morning to the Northeast andsunset is in the Northwest. This means that the summer shadows will bedistributed in an A-shaped area, with the turbine in the tip of the "A".
In locations closer to the equator there will be far less shadow North andSouth of the turbine.
Shadow Geometry Varies by Latitude
Each latitude on the globe has its own shadow signature in terms of the areaaffected by a certain period of shadows from an object (30 hours per year).Close to the equator the signature resembles a butterfly. Farther away fromthe equator it becomes more kidney-shaped, and close to the poles it almostbecomes a circle.
All of the graphs above were computed using the shadow calculator on thisweb site, and assume a "worst case" or a random rotor position.

Shadow Size Grows with Rotor Diameter
The size of the rotor shadow and the number of shadow minutes per year inthe vicinity of the turbine varies in proportion to the rotor area, as shown inthe three pictures above. The red areas indicate the annual shadow patternswith more than 30 hours of shadow (worst case) from wind turbine rotors of43, 53, and 63 m mounted on 50 m towers and computed for 55° latitude.
Hub Height of Minor Importance
The hub height of awind turbine is ofminor importance forthe shadow from therotor. The sameshadow will bespread over a largerarea, so in thevicinity of theturbine, say, up to1,000 m, the numberof minutes per yearwith shadows willactually decrease.The four pictures show shadow casting during a year (worst case) from awind turbine with a 43 m rotor diameter, placed with four different hubheights and computed for 55° latitude. The red areas represent areas withmore than 30 hours of shadows.
If you are farther away from a wind turbine rotor than about 500-1000metres, the rotor of a wind turbine will not appear to be chopping the light,but the turbine will be regarded as an object with the sun behind it.Therefore, it is generally not necessary to consider shadow casting at suchdistances.
| Back | Home | Forward |© Copyright 1998 Soren Krohn. All rights reserved.
Updated 26 September 2000http://www.windpower.org/tour/env/shadow/shadow2.htm

Guide to the Wind TurbineShadow CalculatorThe calculator on the following page allows you to simulate shadows from awind turbine on a plane, horizontal landscape any minute, hour, day, month,or year anywhere on the globe.
Warning:Huge Plots Will Take Their Time - and lots of RAMIf you wish to compute shadows for a whole year, it may take your computerfrom 20 minutes to a couple of hours or more, depending on the speed ofyour browser and your machine, and how fine a map resolution and timeresolution you choose. A fine map resolution (down to 3 pixels square) or alarge plot area increases processing time and the required amount of RAMon your computer significantly.
Which Browser?The shadow calculator is an extremely powerful, but computationallydemanding programme.
If you use Internet Explorer 4 for this calculator, be sure to enableMicrosoft's Just-in-time compiler for JavaScript, since it is much faster.Internet Explorer will also give you the option of being able to read thenumber of minutes of shadow anywhere by moving the mouse cursor aroundthe screen, if you select that option in your setup.
Netscape 4 will work, as well, and on some platforms it is occasionally(but rarely) faster than IE4.
Unfortunately Netscape up to version 4.05 for Macintosh appear to have abug which means that they do not do "garbage collection" (cleanup afterdisused variables) properly. This means that the programme will run moreand more slowly, until you quit your browser. Netscape has one advantage,however: You may let the programme run in the background while you dosomething else. (Version 4.06 seems to be safe, and faster than itspredecessors).
Netscape 3 is quite fast, but it may very easily get a stack overflow andcrash, if you use squares of much less than 25 pixels. Netscape 3 also stopsand asks you if you want to continue every time you have completed 1million iterations (i.e. repeated calculation steps). Since each month takesabout 5 million iterations, you'll have to sit around and click "Yes" quite afew times. The solution is to upgrade, of course.
Colouring the PlotThe grey colours in your plot are selected automatically by the programme,so that the most shadow affected areas are shown in pure black, while theleast affected areas are shown in white, regardless of whether you run theprogramme for 1 minute or a year. The unaffected areas remain green.

Screen SettingsIf you have a screen with millions of colours, you will find that the greyshadows vary very smoothly across the screen. If you like to be able to seethe different "bands" of shadow minute values, like we have done in ourimages on this web site, set your monitor to thousands of colours, or even256 colours.
You Can Save Your Shadow MapsIf you have generated a shadow map which you want to look at later, orcompare with another map, you may save the page (e.g. onto your desktop),just like any other web page in HTML format, if you use Internet Explorer 4.Just choose Save from your file menu, (and take care where you save it, andwhat you name it).
Read the Number of Minutes of Shadows in EachCellif you have an Internet Explorer 4 browser, and you leave this option onwhen you generate the map, you can do an exact readout (in the status lineof your browser) of the number of minutes there may be shadows in eachcell by moving the cursor around on the shadow map.
You May Recolour Your ResultThe plot uses a number of standard colours which look logical on a colourscreen. The colours, however, may not be optimal if you wish to print theresult on a black and white printer. We have therefore included a facilitywhich allows you to change the colour scheme without redoing the longcalculations: You may use a particular colour in a "shadow zone" around theturbine. If you use a large high resolution map, it may take a few minutes foryour programme to do the recolouring (IE 4 is slower than Netscape 4 forthis).
Paint Your Shadow ZoneYou may modify your plot to show you any zone with a certain minimumnumber of minutes of shadows in a certain colour. Be warned, however, thatwith a large high resolution map, it will take several minutes to completethat process.
Other Calculator UsageIncidentally, this calculator is very practical for photographers who wish toknow where the sun is before they go out to take a picture of their favouritemotive in ideal lighting conditions. (We tested it when photographing windturbines, of course). You may also use it if you wish to know how to place aterrace in your garden (regardless of whether you want shadow or sun).
LocationYou may either specify your turbine location using the pop up menu whichgives the longitude and latitude of a number of cities around the globe, oryou may enter the longitude and latitude in degrees and minutes directly,together with your time zone.

Time ZoneThe time zone is automatically included, if you use the pop up menu withcity names. You may enter your time zone relative to GMT from the pop upmenus, or you may enter the standard time zone meridian, i.e. the longituderelative to Greenwich which your local time system uses as a reference,which is generally a multiple of 15 degrees, corresponding to a one hourtime difference. (India and a few other places have a time zone which is amultiple of 7.5 degrees, i.e. half an hour).
TimeYou may enter date and time to see the sunrise and sunset times, plus thecurrent direction of the light coming from the sun.
Wind TurbineEnter the hub height and the rotor diameter. A typical hub height for a600-750 kW wind turbine is 45 to 60 m, a typical rotor diameter is 43 to 48m. (You may find typical hub heights and rotor diameters using the WindTurbine Power Calculator turbine pop up menu).
If you wish to study shadows in areas which are lower than the base of thewind turbine, you can cheat, and increase the hub height of the turbine.Conversely, you can lower the hub height, if you wish to study areas whichare higher than the base of the turbine.
If you enter, say 0.5 for the rotor diameter, you may use the programme tostudy the behaviour of a shadow from the top of a mast, or the corner of abuilding. (Or you can use it to build your own sundial).
Shadow PlotYou can specify the time range for which you like your shadow imagescomputed. You can select a minute, an hour, a day, a month, or a year.
You may set the plot area to fit your screen size (and/or paper output). Ifyou have enough RAM (and time) you may even specify a map larger thanyour screen. The default size prints well on A4 paper in landscape format.
The resolution parameter determines the area covered by each 3-25 pixelsquare. We recommend that you let each square represent less than half therotor diameter to get a decent plot. Or, even more cleverly, you may set it tomatch your map resolution, and print your output on an acetate (overhead)foil as an overlay to a map of a prospective wind turbine location. (Oneprinted pixel is 1/72 of an inch (1 inch = 2.54 cm)).
The step length in minutes determines how many rotor images theprogramme projects onto your ground surface. The default step length of 4minutes corresponds to the sun azimuth changing on average 1 degreebetween each simulation. You may save processing time if you choose alonger step length. For a 1 month or 1 year simulation results are generallynot affected much by using 8 minute steps - and it is 8 times faster than 1minute steps. If the shadow image is not smooth, (or if it is asymmetrical inthe East-West direction even if you are not running with a fixed rotordirection or a wind rose), your step length may be too large. If you doublethe step length, the programme assumes that the rotor shadow stays in thesame place for twice as long, i.e. for each rotor image projected onto theground, it adds the step length to a shadow counter for that particular area.
You may choose rotor direction as random (default), which means therotor may be facing in any direction (random azimuth), you may choose

worst case, where the rotor always faces the sun.You may choose a fixed rotor azimuth angle from -90 to 90 degrees. The
angle is measured relative to South, and the solar angle is positive beforenoon, regardless of hemisphere. 0 means that the wind is coming form theSouth or North. Southeast/Northwest is 45 degrees in the Northernhemisphere, and -45 degrees in the Southern hemisphere. East/West is 90 or-90 degrees. To help you select the correct angle, you may use the pop upmenu.
Finally, you may choose to enter a wind rose with a frequency distributionfor your wind directions. Since a normal propeller type wind turbine issymmetrical about its rotor plane, you should add the percentages for Northand South, and so forth in each of your directions. The programme accepts8, 12 and 16 compass directions, which means that you specify 4, 6, or 8percentages. The program checks that the sum is exactly 100, before it iswilling to do the simulation. Please note that wind roses are specified withthe North as 0 degrees, and that the degrees are given in a clockwisedirection (retrograde direction).
You should specify the fraction of daytime hours the turbine will berunning. 0.75 is a typical fraction. The basic result in terms of minutes ofshadows is multiplied by this fraction.
You should specify the fraction of daytime hours with bright sunshine.The basic result in terms of minutes of shadows is multiplied by thisfraction.
If you have accurate statistics on the number of bright sunshine hours permonth, you may instead use that data in your calculations, by filling out thesunshine table at the bottom of the page. In that case the programme usesthe table data for each month instead of the average. We have includedsunshine data for 3 Danish locations (you select them from the pop upmenu). If you have reliable monthly data available for your location, pleasee-mail us (giving the source) so that we may include it in the city pop upmenu. Remember to check the box that says you want to use the table foryour calculations. (A clever trick: If you wish to see the pattern of shadowsduring e.g. June, July, and August only, you may set the sunshinepercentages for the three months only, and leave the rest of the months atzero, and then run a simulation for a year, using the sunshine table).
You may set a maximum distance from the wind turbine for the shadowplot, since it is usually not relevant to look at distances above 7 to 10 rotordiameters or 1,000 m at the most.
Finally, you may choose to have your output displayed withmouse-sensitive shadow readout (for I.E. 4 browsers), which means thatyou may read the number of minutes of shadow in each cell on the map inyour browser's status line by placing the mouse cursor on a particular cell.Using this mechanism increases RAM demand.
SunriseIn this programme the sunrise time is defined as the moment a straight lineto the centre of the sun passes the horizon in the upwards direction on thedate you have entered in your data. In your local newspaper, you may findthat the sunrise is defined as being some minutes earlier, when the upperedge of the sun reaches the horizon. In addition, the refraction (bending ofthe light) in the atmosphere means that you can actually see the sun before itreaches the horizon. The sunrise is in local time, or daylight saving time, ifthe Daylight saving time box is checked.

NoonThe solar noon is when the sun reaches it highest point in the sky, i.e. thesolar altitude is at its maximum. Noon is in local time, or daylight savingtime, if the Daylight saving time box is checked.
SunsetIn this programme sunset time is defined as the moment a straight line to thecentre of the sun passes the horizon in the downwards direction on the dateyou have entered in your data. In your local newspaper, you may find thatthe sunset is defined as being some minutes later, when the upper edge ofthe sun reaches the horizon. In addition, the refraction (bending of the light)in the atmosphere means that you can actually see the sun after it goes belowthe horizon. The sunset is in local time, or daylight saving time, if theDaylight saving time box is checked.
DeclinationThe declination is the angle between the earth's equatorial plane, and theearth-sun line. As the earth rotates, it spins around its axis which points to the North Star.This axis is inclined 23.45° relative to the plane in which it orbits the sun. The anglebetween the equatorial plane and the earth-sun line thus varies between +/-23.45° duringthe year, being approximately zero on the 21/3 and 23/9 (Equinox), and reaching its extremevalues on 21/6 and 21/12 (Solstice). (Its precise value varies a bit from year to year since ayear is 365.25 days long).
Sunrise/Sunset DurationThis is the number of minutes and seconds it takes for the solar disc to movethe 0.531° between the bottom and the top of the sun at sunrise or sunset.At the equator the sunrise and sunset last little more than two minutes. Asyou move towards the polar regions, the duration increases significantly,particularly in winter, as you may verify by altering the latitude.
Solar AzimuthThe solar azimuth is the angle in the horizontal plane between the South andthe sun at the moment in time you have entered in your data. The angle ispositive before noon, negative after noon (regardless of hemisphere).
Solar AltitudeThe solar altitude is the angle between the horizontal plane and the sun.
Direction form the Sun (Sun Vector)If you are standing in the centre of the turbine with your back towards theSouth, and you move x units of length to the right (East), y ahead (North),and z up (or rather -z down), then a straight line from your new position tothe centre of the turbine will be pointing directly to the sun. The values forx, y, and z are given in the three boxes.

| Back | Home | Forward |© Copyright 1998 Soren Krohn. All rights reserved.
Updated 26 September 2000http://www.windpower.org/tour/env/shadow/guide.htm

Wind Turbine Shadow CalculatorThis calculator requires a Netscape 3.01 or IE 4 or later browser to work. If you are using Navigator 3.01 orlater or Internet Explorer 4 or later, and you see this message, you need to enable JavaScript. In Netscape,choose Options | Network Preferences, choose the Languages tab, and click Enable JavaScript. Then clickreload on your browser. In Internet Explorer, choose Edit | Preferences | Java, and enable Java, select theMicrosoft virtual machine, and enable the "Just in time compiler". Then click reload on your browser. Do notoperate the form until this page and its programme have loaded completely. Otherwise the program willcomplain about missing data, and you will have to click Reload. This calculator lets you experiment withyour local conditions to determine the shape and size of the local area which may be affected by shade (lightflicker) from a wind turbine. For an actual project you will probably want professional wind project softwarewhich will help you with a lot of other aspects as well. (See the Links section).
After changing data, use the tab key, click the Calculate button, or click anywhere on the page outside thefield you have updated to get the results in the right column. To get a plot image, click on the Plot button.Click on the question marks for help. (If a plot windows disappears, it is probably hidden behind thiswindow).Location
Select: or type
° ' latitude North South
° ' longitude East WestTime Zone
° time zone meridian East
West
or GMT :
Time
day month
time (0:00-23:59) : Daylightsaving timeWind Turbine
m hub height, m rotor
diameter
Results this Day
Sunrise :
Noon :
Sunset :
Declination °
Sunrise/sunset duration
min. sec.
Results this Minute
Solar azimuth °
Solar altitude °
Direction from the sun
(East, North, Up coordinates)

Shadow Plot
this... minute hour day month year, step minute(s)
Plot area height width pixels, resolution = m per pixelsRotor direction (azimuth) random worst case (Darrieus)
facing azimuth ° = use wind rose table below
Turbine running % of the daytime. Max. distance m
Sunshine % of the time OR check here to use monthly sunshine hours from table below. Include mouse sensitive shadow duration readout (only useful if used with an I.E. 4 browser)
*)= Cities marked with an asterisk in the city popup menu include sunshine and wind rose data for the tablesbelow.
Bright Sunshine Table
Wind Rose Table
Month DaytimeHours
BrightSunshineHours
BrightSunshineper cent
using directionswind rose sector (not azimuth) %
January °
February °
March °
April °
May °
June °
July °
August °
September Total ... ... ...
October Total must be 100%
November
December
Year Total

Daytime hours are computed automatically by thisprogramme.Source for bright sunshine hours:
| Back | Home | Forward |© Copyright 1998 Danish Wind Turbine Manufacturers Association
Updated 14 August 2000http://www.windpower.org/tour/env/shadow/shadowc.htm

What does a Wind TurbineCost?The Price Banana
The graph above gives an impression of the price range of modern, Danishgrid connected wind turbines as of February 1998. As you can see pricesvary for each generator size. The reasons are e.g. different tower heights,and different rotor diameters. One extra metre of tower will cost you roughly1 500 USD. A special low wind machine with a relatively large rotordiameter will be more expensive than a high wind machine with a smallrotor diameter.
Economies of ScaleAs you move from a 150 kW machine to a 600 kW machine, prices willroughly triple, rather than quadruple. The reason is, that there are economiesof scale up to a certain point, e.g. the amount of manpower involved inbuilding a 150 kW machine is not very different from what is required tobuild a 600 kW machine. E.g. the safety features, and the amount ofelectronics required to run a small or a large machine is roughly the same.There may also be (some) economies of scale in operating wind parks raterthan individual turbines, although such economies tend to be rather limited.
Price Competition and Product RangePrice competition is currently particularly tough, and the product rangeparticularly large around 500 - 750 kW. This is where you are likely to finda machine which is optimised for any particular wind climate.
Typical 600 kW Machines on the Market TodayEven if prices are very similar in the range from 500 to 750 kW, you wouldnot necessarily want to pick a machine with as large a generator as possible.A machine with a large 750 kW generator (and a relatively small rotor

diameter) may generate less electricity than, say a 450 kW machine, if it islocated in a low wind area. The working horse today is typically a 600kilowatt machine with a tower height of some 40 to 50 metres and a rotordiameter of around 43 metres.
We use a typical Danish 600 kW turbine as an example below(approximate amounts in US dollars, prices vary with tower heights, rotordiameter, and local specifications):
Currency *
600 kW wind turbine, typically
Installation costs, typically
Total*) Prices, costs, and exchange rates were reasonably accurate on 13 February 1998. The price range goes fromthe cheapest turbine model without any options to a special low wind model on a tall tower with a large rotordiameter. Freight costs are not included. Currency conversion requires a Netscape 3.0 browser.
1 000 Dollars per Kilowatt AverageThe average price for large, modern wind farms is around 1 000 USD perkilowatt electrical power installed. (Note, that we are not talking aboutannual energy production, yet. We'll return to that in a couple of pages.Energy production is measured in kilowatt hours. If this sounds confusing,take a look at the Reference Manual of this web site).
For single turbines or small clusters of turbines the costs will usually besomewhat higher. On the next page we will discuss installation costs further.
| Back | Home | Forward |© Copyright 1998 Soren Krohn. All rights reserved.
Updated 27 September 2000http://www.windpower.org/tour/econ/index.htm

Installation Costs for WindTurbines
Novar Wind Farm, Scotland,under construction in a
moor, July 1997.Photograph
by Steffen Damborg
Installation costs includefoundations, normallymade of armed concrete,road construction(necessary to move theturbine and the sectionsof the tower to thebuilding site), atransformer (necessaryto convert the lowvoltage (690 V) currentfrom the turbine to10-30 kV current for thelocal electrical grid,telephone connectionfor remote control andsurveillance of the
turbine, and cabling costs, i.e. the cable from the turbine to the local 10-30kV power line.
Installation Costs VaryObviously, the costs of roads and foundations depend on soil conditions, i.e.how cheap and easy it is to build a road capable of carrying 30 tonne trucks.Another variable factor is the distance to the nearest ordinary road, the costof getting a mobile crane to the site, and the distance to a power linecapable of handling the maximum energy output from the turbine.
A telephone connection and remote control is not a necessity, but is isoften fairly cheap, and thus economic to include in a turbine installation.
Transportation costs for the turbine may enter the calculation, if the siteis very remote, though usually they will not exceed some 15 000 USD.
Economies of ScaleIt is obviously cheaper to connect many turbines in the same location, ratherthan just one. On the other hand, there are limits to the amount of electricalenergy the local electrical grid can handle (see the section on Wind Turbinesin the Electrical Grid). If the local grid is too weak to handle the output fromthe turbine, there may be need for grid reinforcement, i.e. extending thehigh voltage electrical grid. It varies from country to country who pays forgrid reinforcement - the power company or the owner of the turbine.

| Back | Home | Forward |© Copyright 1998 Soren Krohn. All rights reserved.
Updated 6 August 2000http://www.windpower.org/tour/econ/install.htm

Operation and MaintenanceCosts for Wind TurbinesModern wind turbines are designed to work for some 120 000 hours ofoperation throughout their design lifetime of 20 years. That is far more thanan automobile engine which will generally last for some 4 000 to 6 000hours.
Operation and Maintenance CostsExperience shows that maintenance cost are generally very low while theturbines are brand new, but they increase somewhat as the turbine ages.
Studies done on the 5000 Danish wind turbines installed in Denmark since1975 show that newer generations of turbines have relatively lower repairand maintenance costs that the older generations. (The studies compareturbines which are the same age, but which belong to different generations).
Older Danish wind turbines (25-150 kW) have annual maintenance costswith an average of around 3 per cent of the original turbine investment.Newer turbines are on average substantially larger, which would tend tolower maintenance costs per kW installed power (you do not need to servicea large, modern machine more often than a small one). For newer machinesthe estimates range around 1.5 to 2 per cent per year of the original turbineinvestment.
Most of maintenance cost is a fixed amount per year for the regular serviceof the turbines, but some people prefer to use a fixed amount per kWh ofoutput in their calculations, usually around 0.01 USD/kWh. The reasoningbehind this method is that tear and wear on the turbine generally increaseswith increasing production.
Economies of ScaleOther than the economies of scale which vary with the size of the turbine,mentioned above, there may be economies of scale in the operation of windparks rather than individual turbines. These economies are related to thesemi-annual maintenance visits, surveillance and administration, etc.
Turbine Reinvestment(Refurbishment, Major Overhauls)Some wind turbine components are more subject to tear and wear thanothers. This is particularly true for rotor blades and gearboxes.
Wind turbine owners who see that their turbine is close the end of theirtechnical design lifetime may find it advantageous to increase the lifetime ofthe turbine by doing a major overhaul of the turbine, e.g. by replacing therotor blades.
The price of a new set of rotor blades, a gearbox, or a generator is usuallyin the order of magnitude of 15-20 per cent of the price of the turbine.

Project Lifetime, Design LifetimeThe components of Danish wind turbines are designed to last 20 years. Itwould, of course, be possible to design certain components to last muchlonger, but it would really be a waste, if other major components were to failearlier.
The 20 year design lifetime is a useful economic compromise which isused to guide engineers who develop components for the turbines. Theircalculations have to prove that their components have a very smallprobability of failure before 20 years have elapsed.
The actual lifetime of a wind turbine depends both on the quality of theturbine and the local climatic conditions, e.g. the amount of turbulence at thesite, as explained in the page on turbine design and fatigue loads.
Offshore turbines may e.g. last longer, due to low turbulence at sea. Thismay in turn lower costs, as shown in the graph on the page on theEconomics of Offshore Wind Turbines.
| Back | Home | Forward |© Copyright 1998 Soren Krohn. All rights reserved.
Updated 6 August 2000http://www.windpower.org/tour/econ/oandm.htm

Income from Wind TurbinesEnergy Output from a Wind TurbineIf you have read thepage on Annualenergy output froma wind turbine, thisgraph will alreadybe familiar to you.
The graph showshow annual energyproduction inmillion kilowatthours varies withthe windiness ofthe site. With amean wind speedof, say 6.75 metresper second at hubheight you get about1.5 million kilowatt hours of energy per year.
As you can see, annual energy output varies roughly with the cube of thewind speed at turbine hub height. Just how sensitive energy production is towind speed varies with the probability distribution for the wind, as explainedin the page on the Weibull distribution. In this graph we have three exampleswith different k-values (shape factors). We will be working with the redcurve (k=2) in our example.
The Availability FactorThe figures for annual energy output assume that wind turbines areoperational and ready to run all the time. In practice, however, wind turbinesneed servicing and inspection once every six months to ensure that theyremain safe. In addition, component failures and accidents (such as lightningstrikes) may disable wind turbines.
Very extensive statistics show that the best turbine manufacturersconsistently achieve availability factors above 98 per cent, i.e. themachines are ready to run more than 98 per cent of the time. Total energyoutput is generally affected less than 2 per cent, since wind turbines arenever serviced during high winds.
Such a high degree of reliability is remarkable, compared to other types ofmachinery, including other electricity generating technologies. Theavailability factor is therefore usually ignored when doing economiccalculations, since other uncertainties (e.g. wind variability) are far larger.
Not all wind turbine manufacturers around the world have a good, longreliability record, however, so it is always a good idea to check themanufacturers' track record and servicing ability before you go out and buya new wind turbine.

| Back | Home | Forward |© Copyright 2000 Soren Krohn. All rights reserved.
Updated 6 August 2000http://www.windpower.org/tour/econ/income.htm

Wind Energy and ElectricalTariffsThis page is relevant for privateinvestors in wind energy, but not forpower companies, which of courseknow everything about their own tariffsystem.
Electrical Energy TariffsElectricity companies are generallymore interested in buying electricityduring the periods of peak load(maximum consumption) on theelectrical grid, because this way theymay save using the electricity from theless efficient generating units.According to a study on the social costsand benefits of wind energy by theDanish AKF institute (see the Linkspage), wind electricity may be some 30to 40 per cent more valuable to thegrid, than if it were producedcompletely randomly.
In some areas, power companies apply variable electricity tariffsdepending on the time of day, when they buy electrical energy from privatewind turbine owners.
Normally, wind turbine owners receive less than the normal consumerprice of electricity, since that price usually includes payment for the powercompany's operation and maintenance of the electrical grid, plus its profits.
Environmental CreditMany governments and power companies around the world wish to promotethe use of renewable energy sources. Therefore, they offer a certainenvironmental premium to wind energy, e.g. in the form of refund ofelectricity taxes etc. on top of normal rates paid for electricity delivered tothe grid.
Capacity CreditTo understand the concept of capacity credit, let us look at its opposite,power tariffs: Large electricity customers are usually charged both for theamount of energy (kWh) they use, and for the maximum amount of power(kW) they draw from the grid, i.e. customers who want to draw a lot ofenergy very quickly have to pay more. The reason they have to pay more is,that it obliges the power company to have a higher total generating capacity(more power plant) available.
Power companies have to consider adding generating capacity whenever

they give new consumers access to the grid. But with a modest number ofwind turbines in the grid, wind turbines are almost like "negativeconsumers", as explained in the section on Wind turbines in the electricalgrid: They postpone the need to install other new generating capacity.
Many power companies therefore pay a certain amount per year to thewind turbine owner as a capacity credit. The exact level of the capacitycredit varies. In some countries it is paid on the basis of a number ofmeasurements of power output during the year. In other areas, some otherformula is used. Finally, in a number of areas no capacity credit is given, asit is assumed to be part of the energy tariff. In any case, the capacity credit isusually a fairly modest amount per year.
Reactive Power ChargesMost wind turbines are equipped with so called asynchronous generators,also called induction generators, cf. the section on electrical parts of a windturbine. These generators require current from the electrical grid to create amagnetic field inside the generator in order to work. As a result of this, thealternating current in the electrical grid near the turbine will be affected(phase-shifted). This may at certain times decrease (though in some casesincrease) the efficiency of electricity transmission in the nearby grid, due toreactive power consumption.
In most places around the world, the power companies require that windturbines be equipped with switchable electric capacitor banks which partlycompensate for this phenomenon. (For technical reasons they do not wantfull compensation). If the turbine does not live up to the power companyspecifications, the owner may have to pay extra charges.
Normally, this is not a problem which concerns wind turbine owners, sincethe experienced manufacturers routinely will deliver according to localpower company specifications.
| Back | Home | Forward |© Copyright 2000 Soren Krohn. All rights reserved.
Updated 26 September 2000http://www.windpower.org/econ/tariffs.htm

Basic Economics of InvestmentSocial Return from Investment in Wind EnergyOn the next two pages, we look at the economics of an investment in windenergy from the point of view of society as a whole, as economists typicallydo. If you do not like economics, or if you know everything about it inadvance, skip this page.
We do not account for environmental benefits, we shall do that later. Wedo not look at financing or taxation. These items vary enormously from onecountry to the other, but they do not make any nation richer or poorer: Theyonly serve to redistribute income.
What society gets in return for investment in wind energy is pollution-freeelectricity; let us find out how much that costs.
Private Investors' GuideIf you are a private investor in wind energy you can still use our calculations- pre tax, that is: Generally speaking, investments which have a high rate ofreturn before tax will have an even higher rate of return after taxes.
This is a surprise to most people.The reason is, however, that depreciation regulations for all sorts of
business tend to be very favourable in most countries. With rapid taxdepreciation you get a higher return on your investment, because you areallowed to deduct the loss of value of your asset faster than it actually losesit value. This is nothing special for wind turbines. It is true for all sorts ofbusiness investment.
Once again, do note, that our calculations in real terms omit financing andtaxes. As a prudent investor, you would probably want to plan your cashflow to make sure you can pay your debts. This you obviously have tocalculate in money terms, i.e. in nominal terms.
Working with InvestmentsWith any investment, you pay something now to get something else later.We assume that a dollar in your pocket today is more valuable to you than adollar tomorrow. The reason why we say that, is that you could invest thatdollar somewhere or put it into a bank account and earn interest on it.
To tell the difference between today's and tomorrow's dollars, we thereforeuse the interest rate. If we do that, 1 dollar a year from now is worth1/(1+r) to you today. r is the interest rate, for example 5 per cent per year.
Thus 1 dollar a year from now is worth 1/1.05 = 0.9523 dollars today. 1dollar 2 years from now is worth 1/(1.05*1.05) = 0.9070 and so forth...
But what about inflation? To deal with that we shall simply only work withdollars which have the same purchasing power as a dollar does today.Economists call that working with real values, instead of nominal ones.
Work in Real Values, not Nominal ValuesAn investment in a wind turbine gives you a real return, i.e. electricity, andnot just a financial (cash) return. This is important, because if you expectsome general inflation of prices during the next 20 years, you may expect

electricity prices to follow the same trend.Likewise, we would expect operation and maintenance costs to follow
roughly the same price trend as electricity. If we expect all prices to move inparallel (with the same growth rates) over the next 20 years, then we can doour calculations quite simply: We do not need to adjust or calculations forinflation, we simply do all of our calculations in the price level of our baseyear, i.e. the year of our investment.
In other words, when we work with real values, we work with moneywhich represent a fixed amount of purchasing power.
Use the Real Rate of Interest, not the Nominal RateSince we are studying the real rate of return (profitability) of wind energy,we have to use the real rate of interest, i.e. the interest rate minus theexpected rate of inflation. (If both rates are high, say, above 10 per cent, youcannot really subtract the percentages, you should divide like this (1+r)/(1+i)but let's not make this into a course in economics).
Typical real rates of interest for calculation purposes these days are in thevicinity of 5 per cent per annum or so. You may say that in countries likeWestern Europe you could even go down to 3 per cent. Some people have avery high demand for profitability, so they might wish to use a higher realrate of interest, say, 7 per cent. Using the bank rate of interest is nonsense,unless you then do nominal calculations, i.e. add price changes everywhere,including to the price of electricity.
| Back | Home | Forward |© Copyright 1998 Soren Krohn. All rights reserved.
Updated 6 August 2000http://www.windpower.org/tour/econ/basic.htm

Wind Energy EconomicsThere is no Such Thing as a Single Price for WindEnergyAs we learned from the page on energy output, annual electricity productionwill vary enormously depending on the amount of wind on your turbine site.Therefore, there is not a single price for wind energy, but a range of prices,depending on wind speeds.
The graph to the right showshow the cost of electricityproduced by a typical Danish 600kW wind turbine varies withannual production. (We used theexample built into the WindEnergy Economics Calculator tofind the points for the graph).
The relationship is really verysimple: If you produce twice asmuch energy per year, you payhalf the cost per kilowatt hour. (Ifyou believe that maintenancecosts increase with turbine use,the graph might not be exactlytrue, but close to true).
If we use the graph above, plus the example from the page on income fromwind turbines we find the relationship between wind speeds and costs perkWh below. Remember, that everything on this page is based on ourexamples, so you cannot use the graph to predict costs for any particularproject. As an example, if your real rate of interest is 6 per cent per annum,rather than 5, costs are approximately 7.5 per cent higher than shown in thegraph. When you use the Wind Energy Economics Calculator in a moment,you can use your own data to compute the cost of electricity.

The example is for a 600 kW wind turbine with project lifetime of 20 years; investment =585,000 USD including installation; operation & maintenance cost = 6750 USD/year; 5%p.a. real rate of interest; annual turbine energy output taken from power density calculatorusing a Rayleigh wind distribution (shape factor = 2).
You should note that wind speeds at 50 metre hub height will be some 28 to35 per cent higher* than at 10 metre height, which is usually used formeteorological observations, cf. the wind speed calculator page. Look at thegrey axis at the bottom of the graph to see how wind speeds at 10 metreheight may translate into higher wind speeds. A wind speed of e.g. 6.25 m/sat 10 metre height in roughness class 1 will translate into 8 m/s at 50 metrehub height.
* For roughness classes between 1 and 2.
| Back | Home | Forward |© Copyright 1998 Soren Krohn. All rights reserved.
Updated 26 September 2000http://www.windpower.org/tour/econ/economic.htm

Guide to the Wind EnergyEconomics CalculatorThis page is a guide to the Wind Energy Economics Calculator on the nextpage. It may may sense for you to look at the calculator first, and then clickon the question marks to jump back here and get the full explanation of howit works.
Built-in ExamplesTo kick start you to get working right away we have included some dataexamples for wind turbines, which you may select from the pop up menu.The offshore example is taken from the Danish power companies' report onoffshore wind turbines. Details may be found in our report on the energybalance of wind turbines, which you may download from the publicationssection.
Project LifetimeDanish wind turbines have a design lifetime of 20 years. With offshore windconditions (low turbulence) it is likely that the the turbines will last longer,probably 25 to 30 years.
Since offshore foundations are designed to last 50 years, it may beinteresting to calculate two generations of turbines on the same set offoundations, possibly with a repair overhaul after 25 years.
Read more on the page on Operation and Maintenance.
Wind Turbine PricePrices may vary due to transportation costs, different tower heights, differentrotor diameters etc. You can use the example prices, or you can type a priceof your own directly in the box to the right.
Read more on the page What does a Wind Turbine Cost?
Installation CostCosts may vary with the location, particularly with costs for roadconstruction and grid connection. 30% of turbine cost is a fair average forDenmark.
Read more on the page on Installation Costs.
Income from Electricity SalesThis optional data item is interesting for individuals who want to invest in awind turbine. You may also include capacity credit, if any. Specify thenumber of kilowatt hours you found using the Power Density Calculator,and the tariff (payment) per kilowatt hour. You may also enter an amountdirectly in the box to the far right in the form.The data is not needed tocompute the cost of electricity.
Read more on the page on Income from Wind Turbines, and the page on

Electricity Tariffs.
Operation and MaintenanceYou may include either a fixed amount per year (by typing directly into thebox to the right) or a percentage of the cost of the turbine. Costs couldinclude a service contract with the manufacturer. You may specify a fixedcost per kilowatt hour instead, if you wish.
Read more on the page on Operation and Maintenance.
Net Present ValueHere you specify the real rate of interest to tell the programme how toevaluate future income and expenditure.
The Net Present Value of your project is the value of all payments,discounted back to the beginning of the investment. If the figure is positive,your project has a real rate of return which is larger than your real rate ofinterest. If the value is negative, the project has a lower rate of return.
To compute the real rate of return, the programme takes the first paymentlisted at the bottom of the calculator (number 01) and divides it by (1+thereal rate of interest). It then divides the next payment (number 02) by (1+thereal rate of interest) to the second power, and so forth, and adds it all uptogether with the initial investment (number 00).
Real Rate of ReturnThe real rate of return tells you the real rate of interest which makes the netpresent value of your project exactly zero. In other words, the real rate ofreturn tells you how much real interest you earn on your investment. (Theprogramme does not use your real rate of interest for anything, it computesone for you).
Computing that rate is a bit tricky, since it requires that the programmemakes a guess to find the answer that makes the net present value zero. If itguesses to high, the net present value becomes negative. If it guesses toolow, it becomes positive. But the programme uses a very clever, blazinglyfast technique called Newton-Rapson iteration which means that the guessesimprove dramatically each time. After 5 guesses it has found your answerwith 5 digit precision.
Electricity Cost per kWhThe cost is calculated by finding the sum of the total investment and thediscounted value of operation and maintenance costs in all years. We thendivide the result by the sum of the discounted value of all future electricityproduction, i.e. we divide each year's electricity production by (1+i) to the nth power, where n is the period number (01 to 50. If you have specified anincome from electricity sales, that amount is not used, or more accurately, itis subtracted from all non-zero amounts specified in the list of payments inperiod 01 to 50.
PaymentsThe payments in these boxes are the results of your specifications above,and they are used to calculate the net present value and the real rate ofreturn. The boxes are also used to calculate the cost of electricity aftersubtracting any income from electricity sales from all non zero boxes inperiod 01 to 50.

| Back | Home | Forward |© Copyright 1998 Soren Krohn. All rights reserved.
Updated 26 September 2000http://www.windpower.org/tour/econ/guide.htm
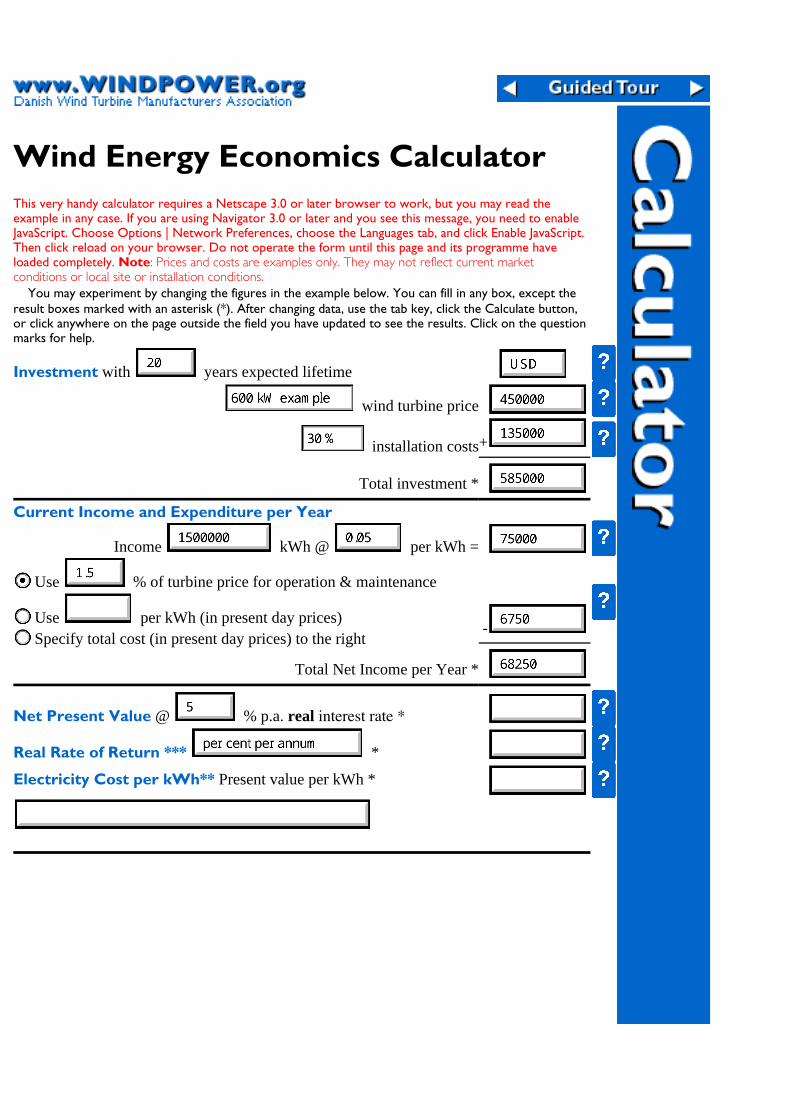
Wind Energy Economics CalculatorThis very handy calculator requires a Netscape 3.0 or later browser to work, but you may read theexample in any case. If you are using Navigator 3.0 or later and you see this message, you need to enableJavaScript. Choose Options | Network Preferences, choose the Languages tab, and click Enable JavaScript.Then click reload on your browser. Do not operate the form until this page and its programme haveloaded completely. Note: Prices and costs are examples only. They may not reflect current marketconditions or local site or installation conditions.
You may experiment by changing the figures in the example below. You can fill in any box, except theresult boxes marked with an asterisk (*). After changing data, use the tab key, click the Calculate button,or click anywhere on the page outside the field you have updated to see the results. Click on the questionmarks for help.
Investment with years expected lifetime
wind turbine price
installation costs+
Total investment *
Current Income and Expenditure per Year
Income kWh @ per kWh =
Use % of turbine price for operation & maintenance
Use per kWh (in present day prices)Specify total cost (in present day prices) to the right
-
Total Net Income per Year *
Net Present Value @ % p.a. real interest rate *
Real Rate of Return *** *
Electricity Cost per kWh** Present value per kWh *

Payments, (Used for Net Present Value and Real Rate of Return) **
00 Investment (expenditure, therefore always a minus sign)
01 02 03 04 05
06 07 08 09 10
11 12 13 14 15
16 17 18 19 20
21 22 23 24 25
26 27 28 29 30
31 32 33 34 35
36 37 38 39 40
41 42 43 44 45
46 47 48 49 50
* = Boxes marked with an asterisk cannot be changed directly by the user.** = These boxes is filled out by the programme, but you may change the amounts if you wish. Thecalculation of electricity cost per kWh uses the same payments as above, but the programme subtracts theelectricity sales income from all non zero payment values in the table, year 01 to year 50. If you want to besure what you are doing when computing the electricity cost per kWh, you should set the income fromelectricity sales to zero.*** = To compute the real rate of return you must have entered both expenditures and income fromelectricity sales.
| Back | Home | Forward |© Copyright 1998 Soren Krohn. All rights reserved.
Updated 6 August 2000http://www.windpower.org/tour/econ/econ.htm

Economics of Offshore WindEnergyNew Danish Reports on Offshore Wind EnergyIn 1997 the Danish electrical power companies and the Danish Energyagency finalised plans for large scale investment in offshore wind energy inDanish waters.
The plans imply that some 4 100 MW of wind power are to be installedoffshore before the year 2030. Wind would by then cover some 50 per centof Danish electricity consumption (out of a total of 31 TWh/year).
Improving Economics of Offshore Wind EnergyOn the previous page, the calculator already includes an example showingthe expected average cost of offshore wind energy in Denmark, usingpresently available technology.
The most important reason why offshore wind energy is becomingeconomic is that the cost of foundations has decreased dramatically. Theestimated total investment required to install 1 MW of wind power offshorein Denmark is around 12 million DKK today, (equivalent to 4 million DEM,or 1.7 million USD). This includes grid connection etc.
Since there is substantially more wind at sea than on land, however, wearrive at an average cost of electricity of some 0.36 DKK/kWh = 0.05USD/kWh = 0.09 DEM/kWh. (5% real discount rate, 20 year projectlifetime, 0.08 DKK/kWh = 0.01 USD/kWh = 0.02 DEM in operation andmaintenance cost).
Accounting for Longer Project LifetimeIt would appear, however thatturbines at sea would have alonger technical lifetime, due tolower turbulence.
If we assume a project lifetimeof, say, 25 years instead of 20,this makes costs 9 per cent lower,at some 0.325 DKK/kWh.
The cost sensitivity to projectlifetime is plotted in theaccompanying graph, which wasmade using the calculator on theprevious page.
Danish power companies,however, seem to be optimising
the projects with a view to a project lifetime of 50 years. This can be seenfrom the fact that they plan to require 50 year design lifetime for bothfoundations, towers, nacelle shells, and main shafts in the turbines.
If we assume that the turbines have a lifetime of 50 years, and add anoverhaul (refurbishment) after 25 years, costing some 25 per cent of theinitial investment (this figure is purely a numerical example), we get a cost

of electricity of 0.283 DKK/kWh, which is similar to average onshorelocations in Denmark.
| Back | Home | Forward |© Copyright 1998 Soren Krohn. All rights reserved.
Updated 26 September 2000http://www.windpower.org/tour/econ/offshore.htm

Employment in the WindIndustry30,000 Jobs Worldwide in 1995The wind industry in 1995 employed some 30,000 people worldwide. Thisestimate is based on a study from the Danish Wind Turbine ManufacturersAssociation, which was published in 1995.
The study accounts for both direct and indirect employment. By indirectemployment we mean the people who are employed manufacturingcomponents for wind turbines, and the people who are involved ininstalling wind turbines worldwide.
9,000 Jobs in DenmarkThe Danish wind industry had some 8 500 people employed in 1995. It maybe interesting to see how they are divided between different components:Component EmploymentTurbine assembly 3 600Rotor blades 2 000Electronic controllers 700Brakes, hydraulics etc. 200Towers 1 500Installation of turbines 300Other 300Total 8 300
In reality wind turbine production creates about 50 per cent more jobs, sinceDanish manufacturers import many components, e.g. gearboxes, generators,hubs etc. from abroad. In addition, jobs are created through the installationof wind turbines in other countries.
How was the Study done?You may think we went out and asked the wind turbine manufacturers to getthe figures. Well, we did, but only to check our calculations. The point is,that you are likely to end up with the wrong answer, if you rely on askingpeople about something as complex as job creation throughout the economy.You may see remarkably large errors in other estimates made as naiveback-of-an-envelope calculations elsewhere on the Web. (Out of courtesy,we won't include the link, here).
Actually, we started very differently using a so called input-output model, which is whatmost economists in government service, or central statistical bureaus would do. In an inputoutput model we actually follow the flow of deliveries from each sector of the economy toother sectors of the economy. In our case, we have a 117 by 177 table of deliveries betweenthe sectors, and the statisticians have double checked that they sum up to the totalproduction in the economy. With this table on may follow sub-sub-contracting all the wayback in the economy in an infinite number of links. (Using a mathematical technique calledmatrix inversion):

How to get Hold of the StudyYou may download the employment study (44K) in Adobe Acrobatpdf-format for printing in the original layout on your own printer. Todownload to a PC: Click the Download button using the right mousebutton. To download to a Macintosh, hold the mouse button down, andselect Save this Link as...
| Back | Home | Forward |© Copyright 1998 Soren Krohn. All rights reserved.
Updated 26 September 2000http://www.windpower.org/tour/econ/empl.htm

Wind Energy PicturesPlease respect that we have exclusive copyright on all of this web site. Youmay quote us, giving proper attribution to the Danish Wind TurbineManufacturers Association web site www.windpower.org, but it is illegal touse any picture, plot, graphics or programming on any other web site or inany commercial or non commercial medium, printed, electronic orotherwise.
To get the best quality, set your monitor to thousands of colours or betterwhen viewing these pictures.
The Wind Energy Pioneer: Poul la Cour1.
The Wind Energy Pioneers - 1940-19502.
The Wind Energy Pioneers - The Gedser Wind Turbine3.
Wind Turbines From the 1980s4.
The California Wind Rush5.
Modern Wind Turbines6.
Offshore Wind Turbines7.
Megawatt-Sized Wind Turbines8.
Multi-Megawatt Wind Turbines9.
Please note that all images on this web site are the property of the DanishWind Turbine Manufacturers Association, or the respective copyrightholders.
| Home | Guided tour | FAQs | Quiz | Manufacturers | Articles | Publications | News |Mailing List | Find | Links | About Us | Reference Manual | E-Mail | Map&Guide | Download
|
© Copyright 2001 Søren Krohn and other copyright holdersUpdated 4 January 2001
http://www.windpower.org/pictures/index.htm

Askov Folk High School stillexists.
Presently a non-profitassociation is trying tocollect funds to preservePoul la Cour's originalwindmill
The Wind Energy Pioneer - Poulla CourTo get the best quality, set your monitor to thousands of colours or betterwhen viewing these pictures.
Poul la CourPoul la Cour (1846-1908) who was originallytrained as a meteorologist was the pioneer ofmodern electricity generating wind turbines.
La Cour was one of the pioneers of modernaerodynamics, and built his own wind tunnelfor experiments.
The picture shows Poul la Cour and his wifeChristine at Askov. (49K JPEG)
La Cour was concerned with the storage ofenergy, and used the electricity from his windturbines for electrolysis in order to producehydrogen for the gas light in his school.
One basic drawback of this scheme was thefact that he had to replace the windows ofseveral school buildings several times, as thehydrogen exploded due to small amounts of
oxygen in the hydrogen(!)
Class of 1904La Cour gave several courses for windelectricians each year at Askov Folk HighSchool. This picture shows the groupgraduating in 1904. (124K, JPEG)

La Cour's Wind TurbinesTwo of his test wind turbines in 1897 atAskov Folk High School, Askov,Denmark. 89K, JPEG
La Cour founded the Society of WindElectricians which in 1905, one yearafter it was formed, had 356 members.
The Journal of Wind ElectricityThe world's first Journal of Wind Electricitywas also published by Poul la Cour.
In 1918 some 120 local utilities in Denmark hada wind turbine, typically of a size from 20 to 35kW for a total of some 3 megawatt installedpower.
These turbines covered about 3 per cent ofDanish electricity consumption at the time. TheDanish interest in wind power waned insubsequent years, however, until a supply crisisset in during World War II.
| Home | Forward |
© Copyright 2001 Søren Krohn.Updated 30 April 2001
http://www.windpower.org/pictures/lacour.htm

The Wind Energy Pioneers -1940-1950To get the best quality, set your monitor to thousands of colours or betterwhen viewing these pictures.
The F.L. Smidth TurbinesDuring World War II the Danish engineeringcompany F.L. Smidth (now a cementmachinery maker) built a number of two- andthree-bladed wind turbines.
Yes, Danish wind turbine manufacturers haveactually made two-bladed wind turbines,although the so-called "Danish concept" is athree bladed machine.
All of these machines (like their predecessors)generated DC (direct current).(43 K, JPEG)(Photograph © F.L.Smidth & Co. A/S)
This three-bladed F.L. Smidth machine from theisland of Bogø, built in 1942, looks more like a"Danish" machine. It was part of a wind-dieselsystem which ran the electricity supply on theisland. (22K, JPEG)
Today, we would probably argue about how theconcrete tower looks, but this machine actuallyplayed an important role in the 1950s wind energystudy programme in Denmark.
In 1951 the DC generator was replaced with a 35kW asynchronous AC (alternating current)generator, thus becoming the second wind turbineto generate AC.(Photograph © F.L.Smidth & Co. A/S)
| Back | Home | Forward |
© Copyright 1998 Søren Krohn.Updated 6 August 2000
http://www.windpower.org/pictures/fifties.htm

The Wind Energy Pioneers:The Gedser Wind Turbine
Johannes Juul and the Vester Egesborg TurbinesThe engineer Johannes Juul was one of the firststudents of Poul La Cour in his courses for "WindElectricians" in 1904.
In the 1950s J. Juul became a pioneer in developingthe world's first alternating current (AC) windturbines at Vester Egesborg, Denmark. (57K JPEG)
Gedser is a good, windy arealocated at the southern tip ofthe island of Falster inDenmark.
The concrete tower of theGedser turbine is still thereafter 50 years, although it isnow equipped with a modernDanish wind turbine nacelle
The Gedser Wind TurbineThe innovative 200 kW Gedserwind turbine (35K JPEG) wasbuilt in 1956-57 by J. Juul for theelectricity company SEAS atGedser coast in the Southern partof Denmark.
The three-bladed upwind turbinewith electromechanical yawingand an asynchronous generatorwas a pioneering design formodern wind turbines, althoughits rotor with guy wires looks a bitold fashioned today.
The turbine was stall controlled,and J. Juul invented theemergency aerodynamic tipbrakes which were released by thecentrifugal force in case of overspeed. Basically the same systemis used today on modern stallcontrolled turbines.
The turbine, which for manyyears was the world's largest, wasincredibly durable. It ran for 11years without maintenance.

The Gedser wind turbine was refurbished in 1975 atthe request of NASA which wanted measurementresults from the turbine for the new U.S. wind energyprogramme.
The machine ran for a few years with testmeasurements after which it was dismantled. Thenacelle and rotor of the turbine are now on displaythe Electricity Museum at Bjerringbro, Denmark.(Photographs © the Electricity Museum,Bjerringbro).
The Nibe TurbinesAfter the first oil crisis in 1973, interest in wind energy rekindled in severalcountries. In Denmark, the power companies immediately aimed at makinglarge turbines, just like their counterparts in Germany, Sweden, the UK, andthe USA.
In 1979 they built two 630 kW wind turbines, one pitch controlled, andone stall controlled. In many ways they suffered the same fate as their evenlarger colleagues abroad: The turbines became extremely expensive, and thehigh energy price subsequently became a key argument against wind energy.
| Back | Home | Forward |
© Copyright 1998 Søren Krohn.Updated 6 August 2000
http://www.windpower.org/pictures/juul.htm

Wind Turbines From the 1980s
The Riisager TurbineA carpenter, Christian Riisager, however, built asmall 22 kW wind turbine (39K, JPEG) in his ownback yard using the Gedser Wind Turbine design as apoint of departure. He used inexpensive standardcomponents (e.g. an electric motor as generator, andcar parts for gear and mechanical brake) whereverpossible.
Riisager's turbine became a success with manyprivate households around Denmark, and his successgave the present day Danish wind turbinemanufacturers their inspiration to start designing theirown wind turbines from around 1980.
(Photograph © 1996 Copyright The Electricity Museum,Bjerringbro, Denmark).
Competing Turbine DesignsSome designs, including theRiisager design were partly basedon solid experience from theclassical Gedser wind turbine, orclassical slow movingmulti-bladed American "windroses", others were morerevolutionary including verticalaxis Darrieus machines,machines using flaps for powercontrol, or hydraulics for thetransmission system, etc. etc.Most machines were very smallby today's standards, usually 5 to11 kW.

Picture from the secrettesting grounds of Vestas
Wind Systems in 1979: Theengineer Léon Bjervig nextto his 12 kW 7.3 m rotor
diameter Darrieus "biplane"machine.
Picture © BTM Consult1979.
The Tvind 2 MW MachineOne important exception to the rule of smallmachines was the Tvind 2 MW machine, a fairlyrevolutionary machine, (in a political sense, too,having been built by idealist volunteers, practisinggender quotas and other politically correctactivities, including waving Chairman Mao's littlered book.) The machine is a downwind machinewith 54 m rotor diameter running at variable speedwith a synchronous generator, and indirect gridconnection using power electronics. The machine isstill running nicely. (Photograph © 1998 Soren Krohn)
Early Danish wind turbine development was thusa far cry from simultaneous government sponsored research programmes onvery large machines in Germany, USA, Sweden, the UK, or Canada.
In the end, improved versions of the classical, three-bladed upwind designfrom the Gedser wind turbine appeared as the commercial winner of thiswild competition, but admittedly not without a number of wreckages,mechanical, and financial.
Risoe National LaboratoryRisoe National Laboratory was really born to become the Danish answer toLos Alamos, i.e. the national centre for nuclear research. Today it is farbetter known for its work on wind energy.
Risoe National Laboratory's Department of Wind Energy and AtmosphericPhysics has a staff of some 100 people working on basic research intoaeroelastics, i.e. the interaction between aerodynamics and structuraldynamics, on wind turbine technology, and wind resource assessment. It alsohas a separate, small, commercial activity dealing with type approval ofwind turbines.
Risoe was originally founded with this last purpose in mind, when theDanish Government instituted a support programme for the erection of windturbines in Denmark. In order to protect the buyers of wind turbines (andtheir surroundings) the Government required that all supported windturbines be type approved for safety. The strict safety regulations (includingrequirements for dual braking systems) indirectly helped developing saferand more reliable wind turbines. (The support programme was abandoned in1989).
Bonus 30 kW

The Bonus 30 kW machine (21K, JPEG)manufactured from 1980 is an example of one ofthe early models from present daymanufacturers.
Like most other Danish manufacturers, thecompany was originally a manufacturer ofagricultural machinery.
The basic design in these machines wasdeveloped much further in subsequentgenerations of wind turbines.
(Photograph copyright Bonus Energy A/S).
| Back | Home | Forward |
© Copyright 1998 Søren Krohn.Updated 15 December 2000
http://www.windpower.org/pictures/eighties.htm

The Great California Wind Rush
Nordtank 55 kWThe 55 kW generationof wind turbines whichwere developed in1980 - 1981 becamethe industrial andtechnologicalbreakthrough formodern wind turbines.
The cost per kilowatthour (kWh) ofelectricity dropped byabout 50 per cent withthe appearance of thisgeneration of windturbines. The windindustry became much
more professionalised, and the parallel development of the European WindAtlas Method by Risoe National Laboratory was extremely important inlowering kWh costs.
The picture shows a particularly imaginative way of siting these Nordtank55 kW wind turbines (43K, JPEG), on a harbour pier at the town of Ebeltoft,Denmark. Red tipped rotor blades have disappeared completely from themarket since then, after it was discovered that birds do not fly into the rotorsanyway.(Photograph copyright © 1981 NEG Micon A/S)
The Great California Wind RushLiterally thousands of thesemachines were delivered tothe wind programme inCalifornia in the earlyeighties. The Micon 55 kW(69K, JPEG) is oneexample of such a machine,delivered to one huge parkof more than 1000machines in Palm Springs,California.
Having started seriesmanufacturing of wind turbines about 5 years earlier, Danish manufacturershad much more of a track record than companies from other countries.About half of the wind turbines placed in California are of Danish origin.
The market for wind energy in the United States disappeared overnightwith the disappearance of the Californian support schemes around 1985.

Since then, only a tiny trickle of new installations have been commissioned,although the market seems to have been picking up, lately. Germany is nowthe world's main market, and the country with the largest wind powerinstallation.
(Photograph copyright NEG Micon A/S).
| Back | Home | Forward |
© Copyright 1998 Søren Krohn.Updated 13 December 2000
http://www.windpower.org/pictures/windrush.htm

Modern Wind TurbinesTo get the best quality, set your monitor to thousands of colours or betterwhen viewing these pictures.
Avedøre Holme, DenmarkThe picture shows the Avedøre Wind Farm, just 5kilometres from the city centre of Copenhagen,Denmark. The 12 Bonus 300 kW wind turbines, (andone 1,000 kW power company test wind turbine) arelocated next to a 250 MW coal-fired power plant.(Photograph © 1997 Copyright Søren Krohn) (39K, JPEG)
Denmark's Largest Wind Farm: MiddelgrundenDenmark currently hassome 2,000 megawatts ofwind power, and 6,000wind turbines in operation.80 per cent of the turbinesare owned by individualsor local wind turbineco-operatives.
The largest wind farm inDenmark isMiddelgrunden, which is
also the largest offshore wind farm in the world. It consists of 20 Bonus 2MW wind turbines - a total power of 40 MW.
The largest land based wind farm in Denmark is Syltholm on the island ofLolland, consisting of 35 NEG Micon 750 kW wind turbines - a total powerof 26,25 MW.(Photograph © 2000 Soren Krohn) (52 K, JPEG)
| Back | Home | Forward |
© Copyright 2000 Søren Krohn.Updated 5 January 2001
http://www.windpower.org/pictures/modern.htm

Offshore Wind TurbinesTo get the best quality, set your monitor to thousands of colours or betterwhen viewing these pictures.
The world's first offshorewind farm is located Northof the island of Lolland in theSouthern part of Denmark
VindebyThe Vindeby wind farm (32K,JPEG) in the Baltic Sea off thecoast of Denmark was built in1991 by the utility companySEAS.
The wind farm consists of 11Bonus 450 kW stall controlledwind turbines, and is locatedbetween 1.5 and 3 kilometresNorth of the coast of the island
of Lolland near the village of Vindeby.The turbines were modified to allow room for high voltage transformers
inside the turbine towers, and entrance doors are located at a higher levelthan normally. These same modifications were carried over to thesubsequent Tunø Knob project.
Two anemometer masts were placed at the site to study wind conditions,and turbulence, in particular. A number of interesting results on offshorewind conditions have been obtained through these studies which werecarried out by Risø National Laboratory.
The park has been performing flawlessly.Electricity production is about 20 per cent higher than on comparable land
sites, although production is somewhat diminished by the wind shade fromthe island of Lolland to the South.(Photograph copyright Bonus Energy A/S)
Tunø Knob

The world's second offshorewind farm is located betweenthe Jutland peninsula and thesmall island of Tunø inDenmark
The Tunø Knob offshore wind farm (36K,JPEG) in the Kattegat Sea off the Coastof Denmark was built in 1995 by theutility company Midtkraft. The pictureshows the construction work with afloating crane.
The Wind farm consists of 10 Vestas500 kW pitch controlled wind turbines.
The turbines were modified for themarine environment, each turbine beingequipped with an electrical crane to beable to replace major parts such asgenerators without the need for a floatingcrane.
In addition, the gearboxes weremodified to allow a 10 per cent higher
rotational speed than on the onshore version of the turbine. This will give anadditional electricity production of some 5 per cent. This modification couldbe carried out because noise emissions are not a concern with a wind parklocated 3 kilometres offshore from the island of Tunø, and 6 kilometres offthe coast of the mainland Jutland peninsula.
The park has been performing extremely well, and production results havebeen substantially higher than expected, cf. the page on offshore windconditions.(Photograph copyright Vestas Wind Systems A/S)
The Future of Offshore Wind EnergyOffshore wind energy is an extremely promising application of wind power,particularly in countries with high population density, and thus difficulties infinding suitable sites on land. Construction costs are much higher at sea, butenergy production is also much higher.
The Danish electricity companies have announced major plans forinstallation of up to 4 000 megawatts of wind energy offshore in the yearsafter the year 2000. The 4 000 MW of wind power is expected to producesome 13.5 TWh of electricity per year, equivalent to 40 per cent of Danishelectricity consumption.
| Back | Home | Forward |
© Copyright 1998 Søren Krohn.Updated 27 September 2000
http://www.windpower.org/pictures/offshore.htm

Megawatt-Sized Wind TurbinesTo get the best quality, set your monitor to thousands of colours or betterwhen viewing these pictures.
Nordtank 1500The prototype of the NEG Micon 1500 kWTurbine (35K JPEG) was commissioned inSeptember 1995.
The original model had a 60 metre rotordiameter and two 750 kW generators operating inparallel.
The most recent version is a 1,500/750 kWmodel (with two 750 kW generators) with a 64metre rotor diameter.
The photograph was taken at the Tjaereborg sitein the Western part of Denmark near the city ofEsbjerg.(Photograph © 1995 NEG Micon A/S 1996)
The Tjaereborg test site formegawatt turbines is locatedin Western Denmark nearthe city of Esbjerg
Vestas 1.5 MWThe prototype of the Vestas 1500 kWTurbine (51K JPEG) wascommissioned in 1996.
The original model had a 63 metrerotor diameter and a 1,500 kWgenerator.
The most recent version has a 68metre rotor diameter and a dual1650/300 kW generator.
The picture shows the nacelle beinghoisted by a crane.
In the background to the left youmay see the ELSAM 2 MW testturbine (on a concrete tower), and theNEG Micon 1500 kW a bit farther inthe background. At the far left youcan catch a glimpse of a Bonus 750kW turbine (the most recent version is
a 1 MW turbine).(Photograph © 1996 Vestas Wind Systems A/S 1996)
The Future for Megawatt-Sized Turbines600 and 750 kW machines continue to be the "working horses" of theindustry at present, but the megawatt-market took off in 1998.

Megawatt-sized machines will be ideal for offshore applications, and forareas where space for siting is scarce, so that a megawatt machine willexploit the local wind resources better.
| Back | Home | Forward |© Copyright 2000 Søren Krohn.
Updated 26 September 2000http://www.windpower.org/pictures/mega.htm

Multi-Megawatt Wind TurbinesTo get the best quality, set your monitor to thousands of colours or betterwhen viewing these pictures.
NEG Micon 2 MW
The prototype of the NEG Micon 2 MW turbine (1024 x 768 pixels, 132KJPEG) was commissioned in August 1999. It has a 72 m (236 ft.) rotordiameter. In this case (Hagesholm, Denmark) it is mounted on a 68 m tower.In the background you see the foundations for two sister machines.Theturbine is intended for offshore applications.
From the outside it resembles the 1500 kW NEG Micon machine so much,that you'd have to see the turbine in its stopped state (with the blades pitchedout of the wind) in order to notice the difference: The rotor blades arepitchable, since the machine has active stall power control, whereas its 1500kW cousin has passive stall power control.(Aerial photograph © 1999 Soren Krohn)

Bonus 2 MW
The prototype of the Bonus 2 MW turbine (88 K) was commissioned in thefall of 1998. It has a 72 m (236 ft.) rotor diameter. In this case(Wilhelmshaven, Germany) it is mounted on a 60 m tower. The turbine isintended for offshore applications, and has Combi Stall® power control(Bonus trademark for active stall power control). The machine resembles theBonus 1 MW and 1.3 MW machines considerably.(Aerial photograph © 1999 Soren Krohn)
Nordex 2,5 MW

The prototype of theNordex 2,5 MWturbine (132 K) wascommissioned in thespring of 2000. Therotor diameter of thewind turbine is 80 m.The image shows theprototype atGrevenbroich,Germany, which has a80 m tower. Theturbine has pitchpower control. It isthe world's largestcommercial windturbine.(Photo © 2000Nordex)
| Back | Home | Forward |© Copyright 1999 Søren Krohn.
Updated 9 February 2000http://www.windpower.org/pictures/multimeg.htm

Wind Energy Reference ManualWind Energy Concepts1.
Energy and Power Definitions2.
Proof of Betz' Law3.
Wind Energy Acoustics4.
Wind Energy and Electricity
Three Phase Alternating Current1.
Connecting to Three Phase Alternating Current2.
Electromagnetism Part 13.
Electromagnetism Part 24.
Induction Part 15.
Induction Part 26.
5.
Wind Energy, Environment, and Fuels6.
Bibliography7.
Wind Energy Glossary8.
| Home | Guided Tour | FAQs | Quiz | Manufacturers | Articles | Pictures | News | MailingList | Find | Links | About Us | E-Mail | Map&Guide | Download |
© Copyright 2000 Soren KrohnUpdated 9 September 2000
http://www.windpower.org/stat/units.htm

Wind Energy Reference ManualPart 1:
Wind Energy ConceptsUnit Abbreviationsm = metre = 3.28 ft.s = secondh = hourW = WattHP = horsepowerJ = Joulecal = calorietoe = tonnes of oilequivalentHz= Hertz (cycles persecond)
10-12 = p pico = 1/1000,000,000,00010-9 = n nano = 1/1000,000,00010-6 = µ micro = 1/1000,00010-3 = m milli = 1/1000103 = k kilo = 1,000 = thousands106 = M mega = 1,000,000 = millions109 = G giga = 1,000,000,0001012 = T tera = 1,000,000,000,0001015 = P peta = 1,000,000,000,000,000
Wind Speeds1 m/s = 3.6 km/h = 2.187 mph = 1.944 knots1 knot = 1 nautical mile per hour = 0.5144 m/s = 1.852 km/h = 1.125 mphWind Speed Scale
Wind Speed at 10 m height Beaufort Scale(outdated) Windm/s knots
0.0-0.4 0.0-0.9 0 Calm0.4-1.8 0.9-3.5 1
Light1.8-3.6 3.5-7.0 23.6-5.8 7-11 35.8-8.5 11-17 4 Moderate8.5-11 17-22 5 Fresh11-14 22-28 6 Strong14-17 28-34 717-21 34-41 8 Gale21-25 41-48 925-29 48-56 10 Strong Gale29-34 56-65 11>34 >65 12 Hurricane
Roughness Classes and Roughness LengthsThe roughness class is defined in the European Wind Atlas on the basis of theroughness length in metres z0, i.e. the height above ground level where the windspeed is theoretically zero. ln is the natural logarithm function.
if (length <= 0.03)class = 1.699823015 + ln(length)/ln(150)if (length > 0.03)class = 3.912489289 + ln(length)/ln(3.3333333)
You may use the calculator below and enter either the roughness length or theroughness class.This calculator requires a Netscape 3, IE 4, or later browser to work. If you are usingNavigator 3, IE 4, or later and you see this message, you need to enable JavaScript. InNetscape, choose Edit | Preferences | Advanced, and click Enable JavaScript. Then click reload

on your browser. In Internet Explorer, choose Edit | Preferences | Web Browser | Java andclick Enable Java. Then click reload on your browser. Do not use the calculator until this pageand its programme have loaded completely.
Roughness ClassCalculator
Roughness length in m
= Roughness class
Roughness Classes and Roughness Length Table
Rough-ness Class
RoughnessLength m
EnergyIndex
(per cent)Landscape Type
0 0.0002 100 Water surface
0.5 0.0024 73Completely open terrain with a smoothsurface, e.g.concrete runways inairports, mowed grass, etc.
1 0.03 52Open agricultural area without fencesand hedgerows and very scatteredbuildings. Only softly rounded hills
1.5 0.055 45Agricultural land with some housesand 8 metre tall sheltering hedgerowswith a distance of approx. 1250 metres
2 0.1 39Agricultural land with some housesand 8 metre tall sheltering hedgerowswith a distance of approx. 500 metres
2.5 0.2 31
Agricultural land with many houses,shrubs and plants, or 8 metre tallsheltering hedgerows with a distanceof approx. 250 metres
3 0.4 24
Villages, small towns, agricultural landwith many or tall shelteringhedgerows, forests and very rough anduneven terrain
3.5 0.8 18 Larger cities with tall buildings
4 1.6 13 Very large cities with tall buildings andskycrapers
Definitions according to the European Wind Atlas, WAsP.For practical examples, see the Guided Tour section on Wind SpeedCalculation.
Density of Air at Standard Atmospheric Pressure

Temperature° Celsius
Temperature° Farenheit
Density, i.e.mass of dry air
kg/m3
Max. watercontentkg/m3
-25 -13 1.423-20 -4 1.395-15 5 1.368-10 14 1.342-5 23 1.3170 32 1.292 0.0055 41 1.269 0.007
10 50 1.247 0.00915 59 1.225 *) 0.01320 68 1.204 0.01725 77 1.184 0.02330 86 1.165 0.03035 95 1.146 0.03940 104 1.127 0.051
*) The density of dry air at standard atmospheric pressure at sea level at 15°C is used as a standard in the wind industry.Power of the Wind **)
m/s W/m2 m/s W/m2 m/s W/m2
0 0 8 313.6 16 2508.81 0.6 9 446.5 17 3009.22 4.9 10 612.5 18 3572.13 16.5 11 815.2 19 4201.14 39.2 12 1058.4 20 4900.05 76.2 13 1345.7 21 5672.46 132.3 14 1680.7 22 6521.97 210.1 15 2067.2 23 7452.3
**) For air density of 1.225 kg/m3, corresponding to dry air at standardatmospheric pressure at sea level at 15° C.
The formula for the power per m2 in Watts = 0.5 * 1.225 * v3, where v is thewind speed in m/s.
Warning: Although the power of the wind at a wind speed of e.g. 7 m/s is 210 W/m2, you shouldnote, that the average power of the wind at a site with an average wind speed of 7 m/s typically isabout twice as large. To understand this, you should read the pages in the Guided Tour beginningwith the Weibull Dustribution and ending with the Power Density Function.
| Back | Home | Forward |
© Copyright 1999 Soren KrohnUpdated 15 December 2000
http://www.windpower.org/stat/unitsw.htm

Wind Energy Reference ManualPart 2:
Energy and Power DefinitionsEnergyPhysicists define the word energy as the amount of work a physical systemis capable of performing. Energy, according to the definition of physicists,can neither be created nor consumed or destroyed.
Energy, however may be converted or transferred to different forms: Thekinetic energy of moving air molecules may be converted to rotationalenergy by the rotor of a wind turbine, which in turn may be converted toelectrical energy by the wind turbine generator. With each conversion ofenergy, part of the energy from the source is converted into heat energy.
When we loosely use the expression energy loss (which is impossible bythe definition above), we mean that part of the energy from the sourcecannot be used directly in the next link of the energy conversion system,because it is converted into heat. E.g. rotors, gearboxes or generators arenever 100 per cent efficient, because of heat losses due to friction in thebearings, or friction between air molecules.
Most of us have the sensible notion, however, that as we e.g. burn fossilfuels, somehow, loosely speaking, the global potential for future energyconversion becomes smaller. That is absolutely true.
Physicists, however, use a different terminology: They say that the amountof entropy in the universe has increased. By that they mean that our abilityto perform useful work converting energy decreases each time we letenergy end up as heat which is dissipiated into the universe. Useful work iscalled exergy by physicists.
Since the vast majority of wind turbines produce electricity, we usuallymeasure their performance in terms of the amount of electrical energy theyare able to convert from the kinetic energy of the wind. We usually measurethat energy in terms of kilowatt hours (kWh) or megawatt hours MWhduring a certain period of time, e.g. an hour or a year.
People who want to show that they are very clever, and show that theyunderstand that energy cannot be created, but only converted into differentforms, call wind turbines Wind Energy Converters (WECs). The rest of usmay still call them wind turbines.
Note Energy is not measured in kilowatts, but in kilowatt hours (kWh).Mixing up the two units is a very common mistake, so you might want toread the next section on power to understand the difference.
Energy Units1 J (joule) = 1 Ws = 4.1868 cal1 GJ (gigajoule) = 109 J1 TJ (terajoule) = 1012 J1 PJ (petajoule) = 1015 J1 kWh (kilowatt hour) = 3,600,000 Joule1 toe (tonne oil equivalent)= 7.4 barrels of crude oil in primary energy

= 7.8 barrels in total final consumption= 1270 m3 of natural gas= 2.3 metric tonnes of coal1 Mtoe (million tonne oil equivalent) = 41.868 PJ
PowerElectrical power is usually measured in watt (W), kilowatt (kW), megawatt(MW), etc. Power is energy transfer per unit of time.
Power may be measured at any point in time, whereas energy has to bemeasured during a certain period, e.g. a second, an hour, or a year. (Read thesection on energy, if you have not done so yet).
If a wind turbine has a rated power or nameplate power of 600 kW, thattells you that the wind turbine will produce 600 kilowatt hours (kWh) ofenergy per hour of operation, when running at its maximum performance(i.e. at high winds above, say, 15 metres per second (m/s)).
If a country like Denmark has, say 1000 MW of wind power installed, thatdoes not tell you how much energy the turbines produce. Wind turbines willusually be running, say, 75 per cent of the hours of the year, but they willonly be running at rated power during a limited number of hours of theyear.
In order to find out how much energy the wind turbines produce you haveto know the distribution of wind speeds for each turbine. In Denmark's case,the average wind turbines will return 2,300 hours of full load operation peryear. To get total energy production you multiply the 1000 MW of installedpower with 2,300 hours of operation = 2,300,000 MWh = 2.3 TWh ofenergy. (Or 2,300,000,000 kWh).
In other areas, like Wales, Scotland, or Western Ireland you are likely tohave something like 3,000 hours of full load operation or more. In Germanythe figure is closer to 2,000 hours of full load operation.
The power of automobile engines are often rated in horsepower (HP)rather than kilowatt (kW). The word "horsepower" may give you an intuitiveidea that power defines how much "muscle" a generator or motor has,whereas energy tells you how much "work" a generator or motor performsduring a certain period of time.
Power Units1 kW = 1.359 HP
| Back | Home | Forward |
© Copyright 1999 Soren KrohnUpdated 26 September 2000
http://www.windpower.org/stat/unitsene.htm

The original formulation ofBetz' law in German.
Proof of Betz' LawThis page gives a proof of Betz' law. Before reading this page you shouldhave read the pages in the Guided Tour on how the wind turbine deflects thewind and Betz' Law. If you do not follow the argument in detail, just glancethrough the rest of this page, which uses Betz' own reasoning from his bookWind-Energie from 1926 to explain the law.
Proof of Betz' TheoremLet us make thereasonable assumptionthat the average windspeed through therotor area is theaverage of theundisturbed windspeed before the windturbine, v1, and thewind speed after thepassage through therotor plane, v2, i.e.
(v1+v2)/2. (Betz offers a proof of this).The mass of the air streaming through the rotor during one second is
m = F (v1+v2)/2
where m is the mass per second, is the density of air, F is the swept rotorarea and [(v1+v2)/2] is the average wind speed through the rotor area. Thepower extracted from the wind by the rotor is equal to the mass times thedrop in the wind speed squared (according to Newton's second law):
P = (1/2) m (v12 - v22)
Substituting m into this expression from the first equation we get thefollowing expression for the power extracted from the wind:
P = ( /4) (v12 - v22) (v1+v2) F
Now, let us compare our result with the total power in the undisturbed windstreaming through exactly the same area F, with no rotor blocking the wind.We call this power P0:
P0 = ( /2) v13 F
The ratio between the power we extract from the wind and the power in theundisturbed wind is then:
(P/P0) = (1/2) (1 - (v2 / v1)2) (1 + (v2 / v1))

We may plot P/P0 as a function of v2/v1:
We can see that the function reaches its maximum for v2/v1 = 1/3, and thatthe maximum value for the power extracted from the wind is 0,59 or 16/27of the total power in the wind.
Click here to go back the Guided Tour page on Betz' Law.
| Back | Home | Forward |© Copyright 1999 Soren Krohn
Updated 6 August 2000http://www.windpower.org/stat/betzpro.htm

Wind Energy Reference ManualPart 3:
AcousticsdB(A) Sound Levels in decibelsand Sound Power in W/m2
Level dB(A)PowerW/m2 Level dB(A)
PowerW/m2 Level dB(A)
PowerW/m2
0 1.000*10-12 55 3.162*10-7 83 1.995*10-4
10 1.000*10-11 56 3.981*10-7 84 2.512*10-4
20 1.000*10-10 57 5.012*10-7 85 3.162*10-4
30 1.000*10-9 58 6.310*10-7 86 3.981*10-4
31 1.259*10-9 59 7.943*10-7 87 5.012*10-4
32 1.585*10-9 60 1.000*10-6 88 6.310*10-4
33 1.995*10-9 61 1.259*10-6 89 7.943*10-4
34 2.512*10-9 62 1.585*10-6 90 1.000*10-3
35 3.162*10-9 63 1.995*10-6 91 1.259*10-3
36 3.981*10-9 64 2.512*10-6 92 1.585*10-3
37 5.012*10-9 65 3.162*10-6 93 1.995*10-3
38 6.310*10-9 66 3.981*10-6 94 2.512*10-3
39 7.943*10-9 67 5.012*10-6 95 3.162*10-3
40 1.000*10-8 68 6.310*10-6 96 3.981*10-3
41 1.259*10-8 69 7.943*10-6 97 5.012*10-3
42 1.585*10-8 70 1.000*10-5 98 6.310*10-3
43 1.995*10-8 71 1.259*10-5 99 7.943*10-3
44 2.512*10-8 72 1.585*10-5 100 1.000*10-2
45 3.162*10-8 73 1.995*10-5 101 1.259*10-2
46 3.981*10-8 74 2.512*10-5 102 1.585*10-2
47 5.012*10-8 75 3.162*10-5 103 1.995*10-2
48 6.310*10-8 76 3.981*10-5 104 2.512*10-2
49 7.943*10-8 77 5.012*10-5 105 3.162*10-2
50 1.000*10-7 78 6.310*10-5 106 3.981*10-2
51 1.259*10-7 79 7.943*10-5 107 5.012*10-2
52 1.585*10-7 80 1.000*10-4 108 6.310*10-2
53 1.995*10-7 81 1.259*10-4 109 7.943*10-2
54 2.512*10-7 82 1.585*10-4 110 1.000*10-1
To understand the table above, read the pages starting with Sound fromWind Turbines in the Guided Tour. If you wish to know about designingwind turbines for quiet operation, read the pages on turbine design in theGuided Tour.
The subjective sound loudness is perceived to double every time thedB(A) level increases by 10.
By definition the sound level in dB = 10 * log10(power in W/m2) + 120,where log10 is the logarithm function with base 10. [If you only have accessto the the natural log function, ln, then you can always use the relationlog10(x) = ln(x) / ln(10)]
If you solve the equation for the power, you get:The sound power in W/m2 = 100.1*(dB-120)

Sound Level by Distance from Source
Distancem
SoundLevel
ChangedB(A)
Distancem
SoundLevel
ChangedB(A)
Distancem
SoundLevel
ChangedB(A)
9 -30 100 -52 317 -6216 -35 112 -53 355 -6328 -40 126 -54 398 -6440 -43 141 -55 447 -6550 -45 159 -56 502 -6656 -46 178 -57 563 -6763 -47 200 -58 632 -6871 -49 224 -59 709 -6980 -50 251 -60 795 -7089 -51 282 -61 892 -71
How to use the table above:If a wind turbine has a source noise level of 100 dB(A), it will have a noise
level of 45 dB(A) 141 m away. [100 - 55 dB(A) = 45 dB(A)].The sound level decreases by approximately 6 dB(A) [ = 10*log10(2) ]
every time you double the distance to the source of the sound. The tableassumes that sound reflection and absorption (if any) cancel one another out.
How to derive the table above:The surface of a sphere = 4 pi r2, where pi = 3.14159265, and r is the
radius of the sphere. If we have a sound emission with a power of x W/m2
hitting a sphere with a certain radius, then we'll have the same power hittingfour times as large an area, if we double the radius.Adding Sound Levels from Two Sources
dB 41 42 43 44 45 46 47 48 49 5041 44.0 44.5 45.1 45.8 46.5 47.2 48.0 48.8 49.6 50.542 44.5 45.0 45.5 46.1 46.8 47.5 48.2 49.0 49.8 50.643 45.1 45.5 46.0 46.5 47.1 47.8 48.5 49.2 50.0 50.844 45.8 46.1 46.5 47.0 47.5 48.1 48.8 49.5 50.2 51.045 46.5 46.8 47.1 47.5 48.0 48.5 49.1 49.8 50.5 51.246 47.2 47.5 47.8 48.1 48.5 49.0 49.5 50.1 50.8 51.547 48.0 48.2 48.5 48.8 49.1 49.5 50.0 50.5 51.1 51.848 48.8 49.0 49.2 49.5 49.8 50.1 50.5 51.0 51.5 52.149 49.6 49.8 50.0 50.2 50.5 50.8 51.1 51.5 52.0 52.550 50.5 50.6 50.8 51.0 51.2 51.5 51.8 52.1 52.5 53.0
Example: A turbine located at 200 m distance with a source level of 100dB(A) will give a listener a sound level of 42 dB(A), as we learned in thetable before this one. Another turbine 160 m away with the same sourcelevel will give a sound level of 44 dB(A) on the same spot. The total soundlevel experienced from the two turbines will be 46.1 dB(A), according to thetable above.
Two identical sound levels added up will give a sound level +3 dB(A)higher. Four turbines will give a sound level 6 dB(A) higher. 10 turbineswill give a level 10 dB(A) higher.
How to add sound levels in generalFor each one of the sound levels at the spot where the listener is located, youlook up the sound power in W/m2 in the first of the three sound tables. Thenyou add the power of the sounds, to get the total no. of W/m2. Then use theformula dB = 10 * log10(power in W/m2) + 120, to get the dB(A) sound

level.
| Back | Home | Forward |
© Copyright 1999 Soren KrohnUpdated 27 September 2000
http://www.windpower.org/stat/unitssnd.htm

Wind Energy Reference ManualPart 4: Electricity
VoltageIn order to make a current flow through a cable you need to have a voltagedifference between the two ends of the cable - just like if you want to makeair move through a pipe, you need to have different pressure at the two endsof the pipe.
If you have a large voltage difference, you may move larger amounts ofenergy through the wire every second, i.e. you may move larger amounts ofpower. (Remember that power = energy per unit of time, cf. the page onEnergy and Power Definitions).
Alternating CurrentThe electricity that comes out of a battery is direct current (DC), i.e. theelectrons flow in one direction only. Most electrical grids in the world arealternating current (AC) grids, however.
One reason for using alternating current is that it is fairly cheap totransform the current up and down to different voltages, and when you wantto transport the current over longer distances you have much lower energylosses when you use a high voltage. Another reason is that it is difficult andexpensive to build circuit breakers (switches) for high DC voltages which donot produce huge sparks.
Grid Frequency
With an alternating current in the electrical grid, the current changesdirection very rapidly, as illustrated on the graph above: Ordinary householdcurrent in most of the world is 230 Volts alternating current with 50 cyclesper second = 50 Hz ("Hertz" named after the German Physicist H.R. Hertz(1857-1894)). The number of cycles per second is also called the frequencyof the grid. In America household current is 130 volts with 60 cycles persecond (60 Hz).

In a 50 Hz system a full cycle lasts 20 milliseconds (ms), i.e. 0.020seconds. During that time the voltage actually takes a full cycle between+325 Volts and -325 Volts. The reason why we call this a 230 volt system isthat the electrical energy per second (the power) on average is equivalent towhat you would get out of a 230 volt DC system.
As you can see in the graph, the voltage has a nice, smooth variation. This type of waveshape is called a sinusoidal curve, because you can derive it from the mathematicalformula
voltage = vmax * sin(360 * t * f),
where vmax is the maximum voltage (amplitude), t is the time measured in seconds, and fis the frequency in Hertz, in our case f = 50. 360 is the number of degrees around a circle.(If you prefer measuring angles in radians, then replace 360 by 2*pi).
PhaseSince the voltage in an alternating current system keeps oscillating up anddown you cannot connect a generator safely to the grid, unless the currentfrom the generator oscillates with exactly the same frequency, and is exactly"in step" with the grid, i.e. that the timing of the voltage cycles from thegenerator coincides exactly with those of the grid. Being "in step" with thegrid is normally called being in phase with the grid.
If the currents are not in phase, there will be a huge power surge whichwill result in huge sparks, and ultimately damage to the circuit breaker (theswitch), and/or the generator.
In other words, connecting two live AC lines is a bit like jumping onto amoving seesaw. If you do not have exactly the same speed and direction asthe seesaw, both you and the people on the seesaw are likely to get hurt.
The page on Power Quality Issues explains how wind turbines manage toconnect safely to the grid.
Alternating Current and ElectromagnetismTo learn about electromagnetism, turn to the next pages.
| Back | Home | Forward |© Copyright 1998 Soren Krohn
Updated 26 September 2000http://www.windpower.org/stat/unitsac.htm

3 Phase Alternating CurrentThe power of alternating current (AC) fluctuates. For domestic use for e.g.light bulbs this is not a major problem, since the wire in the light bulb willstay warm for the brief interval while the power drops. Neon lights (andyour computer screen) will blink, in fact, but faster than the human eye isable to perceive. For the operation of motors etc. it is useful, however, tohave a current with constant power.
Voltage Variation for Three Phase AlternatingCurrent
It is indeed possible toobtain constant powerfrom an AC system byhaving three separatepower lines withalternating current whichrun in parallel, and wherethe current phase isshifted one third of thecycle, i.e. the red curveabove is running one
third of a cycle behind the blue curve, and the yellow curve is running twothirds of a cycle behind the blue curve.
As we learned on the previous page, a full cycle lasts 20 milliseconds (ms)in a 50 Hz grid. Each of the three phases then lag behind the previous one by20/3 = 6 2/3 ms.
Wherever you look along the horizontal axis in the graph above, you willfind that the sum of the three voltages is always zero, and that the differencein voltage between any two phases fluctuates as an alternating current.
On the next page you will see how we connect a generator to a three phasegrid.
| Back | Home | Forward |© Copyright 2000 Soren Krohn
Updated 19 October 2000http://www.windpower.org/stat/unitsac3.htm

Connecting to 3 PhaseAlternating Current
On the page on synchronous generators we mention that each of theelectromagnets in the stator is connected to its own phase. You may wonderhow that can be done, because in a three phase system we usually have onlythree conductors (wires). The answer is given in the pictures above:
Delta ConnectionIf we call the three phase conductors L1, L2 and L3, then you connect thefirst magnet to L1 and L2, the second one to L2 and L3, and the third one toL3 and L1.
This type of connection is called a delta connection, because you mayarrange the conductors in a delta shape (a triangle). There will be a voltagedifference between each pair of phases which in itself is an alternatingcurrent. The voltage difference between each pair of phases will be largerthan the voltage we defined on the previous page, in fact it will always be1.732 times that voltage (1.732 is the square root of 3).
Star ConnectionThere is another way you may connect to a three phase grid, however:
You may also connect one end of each of the three magnet coils to its ownphase, and then connect the other end to a common junction for all threephases. This may look surprising, but consider that the sum of the threephases is always zero, and you'll realise that this is indeed possible.

| Back | Home | Forward |© Copyright 1998 Soren Krohn
Updated 26 September 2000http://www.windpower.org/stat/unitac3c.htm

Electromagnetism
Electromagnetism was
discovered by accidentin 1821 by the DanishPhysicist H.C. Ørsted.Electromagnetism isused both in theconversion ofmechanical energy toelectrical energy (ingenerators) and in theopposite direction inelectric motors.
In the picture to theleft we have set up anelectric circuit with acoil of insulated copperwire, winding around an"iron" (magnetic steel)core.
Click the switch in thepicture to the left to turnon the (direct) current,and watch whathappens.
| Back | Home | Forward |© Copyright 1998 Soren Krohn
Updated 26 September 2000http://www.windpower.org/stat/emag/index.htm

Electromagnetism
The current
magnetises the iron coreand creates a pair ofmagnetic poles, oneNorth, and the otherSouth. The two compassneedles consequentlypoint in oppositedirections. (You mayrepeat the experiment byclicking on the switchagain).
This magnetic fieldwould be createdwhether we had the ironcore in the middle ornot. But the iron coremakes the magneticfield much morepowerful.
The iron core may beshaped e.g. like a horseshoe, or a C, which is adesign used in
generators.Generators usually have several North - South pole pairs.For now, let's see how electromagnetism can work "in reverse" on the next
page on induction.
| Back | Home | Forward |© Copyright 1998 Soren Krohn
Updated 26 September 2000http://www.windpower.org/stat/emag/emagn.htm

Induction
To the left we have set
up another experiment,that looks almost likethe one on the previouspage. In the upper partwe have a battery, aswitch, and anelectromagnet.
Below theelectromagnet we haveset up another iron corewith an insulated coppercoil around it. We havethen connected a lightbulb to the lower coil.
Now, once again, flickthe switch, and watchwhat happens.
| Back | Home | Forward |© Copyright 1998 Soren Krohn
Updated 26 September 2000http://www.windpower.org/stat/emag/induct1.htm

Induction
As you can see, the
light bulb flashes themoment you connect theswitch to the battery.
The explanation is,that the magnetic fieldcoming from the upperelectromagnet flowsthrough the lower ironcore.
The change in thatmagnetic field, in turninduces an electriccurrent in the lower coil.
You should note thatthe current in the lowercoil ceases once themagnetic field hasstabilised.
If you switch off thecurrent, you get anotherflash, because themagnetic field
disappears. The change in the field induces another current in the lowercore, and makes the light bulb flash again.
In order to apply your knowledge of electromagnetism and induction, youmay now return to the page on wind turbine generators.
| Back | Home | Forward |© Copyright 1998 Soren Krohn
Updated 26 September 2000http://www.windpower.org/stat/emag/induct2.htm

Wind Energy Reference ManualPart 5:
Environment and FuelsEnergy Content of Fuels *)
GJ per tonneNorth Sea Crude Oil 42.7LPG (Liquefied petroleum gas:Propane, Butane) 46.0
Petrol (Gasoline) 43.8JP1 (Jet aircraft fuel) 43.5Diesel / Light Fuel oil 42.7Heavy Fuel Oil 40.4Orimulsion 28.0Natural Gas 39.3 per 1000 Nm3
Steam Coal 24.5Other Coal 26.5Straw 14.5Wood chips 14.7Household Waste 1995 10.0Household Waste 1996 9.4CO2-Emissions *)
kg CO2 per GJ kg CO2 per kg fuelPetrol (Gasoline) 73.0 3.20Diesel / Light Fuel oil 74.0 3.16Heavy Fuel Oil 78.0 3.15Orimulsion 76.0 2.13Natural Gas (methane) 56.9 2.74
Coal 95.0 2.33 (steam coal)2.52 (other)
*) Conversion factors provided by the Danish Energy Agency
| Back | Home | Forward |
© Copyright 1998 Soren KrohnUpdated 26 September 2000
http://www.windpower.org/stat/unitsenv.htm

Wind Energy BibliographyThis is a list of useful publications for readers who wish to find the relevantphysics or mathematical formulae etc.
Wind Energy Resources &Computing Wind Turbine Energy OutputIb Troen & Erik Lundtang Petersen: European Wind Atlas, Risoe NationalLaboratory, Risoe, Denmark, 1991, ISBN 87-550-1482-8 (Contains usefulguidance on wind speed calculation, wind statistics, wind turbine energyoutput, and the theoretical foundations).
Dipl.-Ing. Dr. Albert Betz, Wind-Energie und ihre Ausnutzung durchWindmühlen, Bandenhoeck & Ruprect, Göttingen 1926. Facsimile edition byÖkobuch Verlag, Staufen, 1994. ISBN 3-922964-11-7
D.L.Elliott, C.G.Holladay, W.R.Barchet, H.P.Foote, W.F.Sandusky: WindEnergy Resource Atlas of the United States, Solar Energy Research Institute,Golden, Co, 1987.
How does a Wind Turbine Work?Bruce R. Munson, Donald F. Young, Theodore H. Okiishi: Fundamentals ofFluid Mechanics, John Wiley & Sons Inc., New York 1994, ISBN0-471-30585-5
Ira H. Abott & Albert E. von Doenhoff: Theory of Wing Sections, DoverPublications, Inc., New York 1959.
Austin Hughes: Electric Motors and Drives, Oxford 1997,Butterworth-Heinemann, ISBN 0-7506-1741-1
Poul Erik Petersen: Elektricitet og Magnetisme, Bogfondens Forlag A/S,København 1995, ISBN 87-7463-228-0
Poul Erik Petersen: Elektriske Maskiner, Bogfondens Forlag A/S,København 1996, ISBN 87-7463-255-8
Wind Energy and the EnvironmentBirk Nielsens Tegnestue, Wind Turbines in the Landscape, Architecture &Aesthetics, Aarhus 1996, ISBN 87-985801-1-6
Henrik Meyer m. fl.: Omkostningsopgørelse for miljøeksternaliteter iforbindelse med energiproduktion, Risø-R-770 (DA), Roskilde 1994, ISBN87-550-2011-9
Søren Krohn: The Energy Balance of Modern Wind Turbines, Danish WindTurbine Manufacturers Association, WindPower Note No. 16, København1997.
Lars Teglgaard m.fl.: Vindmøller i Kommuneplanlægningen - eneksempelsamling, Miljøministeriet, København 1994, ISBN 87-601-4123-9

Guillemette, M., Larsen, J.K. & Clausager, I.: Assessing the impact of theTunø Knob wind park on sea ducks: the influence of food resources,National Environmental Research Institute, NERI Technical Report No 263,København 1999, ISBN 87-7772-444-5
Wind Energy EconomicsSøren Krohn: Er 10 og 27 lige ? Offentlige Finanser og Vindkraft,Vindmølleindustrien, Vindkraft Note nr. 7, København 1996.
Jesper Munksgaard, m.fl.: Samfundsmæssig Værdi af Vindkraft (4delrapporter), AKF Forlaget, København 1995, ISBN 87-7509-443-6
Hans-Henrik Kristoffersen, m.fl.: Kortlægning af Afgifter og Tilskud indenfor Energiområdet, AKF Forlaget, København 1997, ISBN 87-7509-509-2
Danish Ministry of Environment and Energy: Energy 21 - The DanishGovernment's Action Plan for Energy 1996, Copenhagen 1996, ISBN87-7844-062-9
Danmarks Energifremtider, Energistyrelsen, København 1995, ISBN87-7844-027-0
Action Plan for Offshore Wind Farms in Danish Waters, The OffshoreWind-Farm Working Group of the Electricity Companies and the DanishEnergy Agency, SEAS, Haslev 1997
Birger T. Madsen: World Market Update 1996-97, BTM Consult ApS,Ringkøbing 1995
International Energy Agency (IEA) Wind Energy Annual Report 1998,National Renewable Energy Laboratory, Colorado, USA, April 1999
International Energy Agency (IEA) Wind Energy Annual Report 1998,National Renewable Energy Laboratory, Colorado, USA, April 1999
Modern Wind Turbine HistoryPeter Karnøe, Dansk Vindmølleindustri, Samfundslitteratur, Frederiksberg1991, ISBN 87-593-0255-0
H. C. Hansen, Poul la Cour - grundtvigianer, opfinder og folkeoplyser,Askov Højskoles Forlag, Askov 1985, ISBN 87-88765-01-6
ReferenceInternational Electrotechnical Commission: International ElectrotechnicalVocabulary - Part 415: Wind turbine systems, Geneva 1998, IEC 60050-415
George Elliot (ed.): 8. Glossary Of Terms, 2. Edition, Expert Group Studyon Recommended Practices for Wind Turbine Testing and Evaluation,International Energy Agency Programme for Research and Development onWind Energy Conversion Systems, Glasgow 1993
Web DesignDavid Siegel: Creating Killer Web Sites, Second Edition, Hayden Books,Indianapolis 1998, ISBN 1-56830-433-1
Jakob Nielsen: Designing Web Usability : The Practice of Simplicity, First

Edition, New Riders Publishing 1999, ISBN 156205810X
Edward R. Tufte: The Visual Display of Quantitative Information, GraphicsPress, Cheshire, Connecticut, 1983
Jan Tschichold, The Form of the Book, Essays on the Morality of GoodDesign, Hartley & Marks, Vancouver, B.C. 1991, ISBN 0-88179-116-4
Paul Arthur & Romedi Passini: Wayfinding, People, Signs and Architecture,McGraw-Hill, New York 1992, ISBN 0-07-551016-2
| Back | Home | Forward |
© Copyright 2000 Soren KrohnUpdated 23 February 2001
http://www.windpower.org/stat/biblio.htm

Wind Energy GlossaryNEW feature: Type the first letter of the word to scroll to that letter.
Then click on a term to go to the page which explains it. In some cases we send you to the top of the pagewith the explanation, rather than the to word itself, in order to give you a better idea of each concept.
A B C D E F G H I J K L M N O P Q R S T U V W X Y ZEnglish German Spanish French Danish
AerodynamicsAerodynamik aerodinámica* aérodynamique* aerodynamik
active stall powercontrol
aktive Stall-regelung regulación* activapor pérdidaaerodinámica
régulation active pardécrochageaérodynamique
aktiv stallregulering
alternating current(AC)
Wechselstrom corriente* alterna(CA)
courant alternatif vekselstrøm
anemometer Anemometer anemómetro anémomètre anemometer
asynchronousgenerator
Asynchrongenerator generador asíncrono générateurasynchrone
asynkron generator
availability factor Verfügbarkeitsfaktor factor dedisponibilidad
facteur dedisponibilité
rådighedsfaktor
azimuth angle Azimuth ángulo azimutal (angle d') azimut azitmutvinkel
Betz' lawBetz'sches Gesetz ley* de Betz loi* de Betz Betz' lov
birds Vögel aves* oiseaux (avifaune) fugle
bolt assembly Verschrauben unión* con pernos assemblage parboulons
boltsamling
Cage rotorKäfigläufer,Kurzschlußläufer
rotor de jaula deardilla
induit à caged'écureuil
kortslutningsrotor
capacity credit Leistungsvergütung crédito de capacidad crédit de capacité effektbetaling
capacity factor Kapazitätsfaktor factor de carga facteur de capacité kapacitetsfaktor
computational fluiddynamics (CFD)
Computational FluidDynamics (CFD)
dinámica* de fluidoscomputacional(CFD)
dynamique* desfluides numérique
computational fluiddynamics (CFD)
cooling system Kühlung sistema derefrigeración
système derefroidissement
kølesystem
Coriolis force Corioliskraft fuerza* de Coriolis force* de Coriolis Corioliskraft
corrosion (offshore) Korrosion (Offshore) corrosión* (en aguade mar)
corrosion* (en mer) korrosion (offshore)
cost of electricity Stromkosten coste de laelectricidad
coût d'électricité omkostninger tilelproduktion
cut in wind speed Einschaltwind-geschwindigkeit
velocidad* deconexión
vitesse* dedémarrage
starthastighed
cut out wind speed Abschaltwind-geschwindigkeit
velocidad* de corte vitesse* de coupure stophastighed

Danish conceptDänisches Konzept concepto danés conception* danoise dansk koncept
dB (A), decibel (A)scale
dB(A)-Skala dB(A), escala* dedecibelios A
dB (A), échelle* desdécibel (A)
dB (A), decibel (A) skala
delta connection Dreieckschaltung conexión* triángulo connexion*(oucouplage) en triangle
deltaforbindelse
density of air Luftdichte densidad* de aire densité* d'air massefylde, vægtfylde
direct gridconnection
direkte Netzanbindung conexión* directa ared
raccordement directau réseau
direkte nettilslutning
downwind(machine)
Leeläufer máquina* con rotora sotavento
(éolienne*) sous levent
bagløber
drag Luftwiderstand resistencia*aerodinámica
trainée* drag, luftmodstand
EconomicsWirtschaftlichkeit economía* économie* økonomi
economies of scale Kostenvorteile beigrößeren Anlagen
economías* deescala
économies*d'échelle
stordriftsfordele
efficiency Wirkungsgrad eficiencia* efficacité* effektivitet
electromagnetism Elektromagnetismus electromagnetismo électromagnétisme elektromagnetisme
energy Energie energía* énergie* energi
energy balance Energiebilanz balance de energía bilan énergétique energibalance
extreme load Extremlast carga* extrema charge extrême ekstremlast
Fatigue loadMaterialermüdung carga* de fatiga charge de fatigue udmattelseslast
flange Flansche brida* bride* flange
flicker kurzzeitige Spannungs-schwankungen
flicker flicker flicker
foundation Fundament cimentación* fondation fundament
GearboxGetriebe multiplicador, caja*
multiplicadora)multiplicateur gearkasse
Gedser wind turbine Gedser-Windkraftanlage el aerogenerador deGedser
l'éolienne* deGedser
Gedsermøllen
generator Generator generador générateur (ougénératrice*)
generator
geostrophic wind geostrophischer Wind viento geostrófico vent géostrophique geostrofisk vind
global winds globale Winde vientos globales vents globaux globale vinde
gravity foundation(offshore)
Schwerkraft-Fundament(Offshore)
cimentación*(marina) porgravedad
fondation* decaissons (d'acier oude béton)(offshore)
gravitationsfundament(offshore)
grid frequency Netzfrequenz frecuencia* de red fréquence* du réseau netfrekvens
(electrical) grid (elektrisches) Netz red* (eléctrica) réseau (électrique) (el) net
gust Bö ráfaga* rafale* vindstød, vindbyge
guy (wire) Abspannung viento hauban bardun

Horizontal axis
wind turbine(HAWT)
Horizontalachser,-läufer
aerogenerador de ejehorizontal
éolienne* à axehorizontal
horisontalaksletvindmølle
hub Nabe buje moyeu nav
hub height Nabenhöhe altura* de buje hauteur du moyeu navhøjde
hydraulics system Hydrauliksystem sistema hidraúlico système hydraulique hydrauliksystem
Hz (Hertz) Hz (Hertz) Hz (hercio) Hz (Hertz) Hz (Hertz)
Indirect grid
connection
indirekteNetzanbindung
conexión indirecta ared*
raccordementindirect au réseau
indirekte nettilslutning
induction Induktion inducción* induction* indution
induction generator Induktionsgenerator generador deinducción
générateur àinduction
asynkrongenerator
installation costs Installationskosten costes de instalación coûts d'installation installationsomkostninger
inverter Wechselrichter inversor onduleur vekselretter
islanding Inselbildung islanding (ofuncionamiento enisla)
opération* insulaire ødrift
J
Killed steelberuhichter Stall acero calmado acier calmé beroliget stål
Lattice towerGitterturm torre* de celosía mât en trellis gittertårn
(design) lifetime Lebensdauer vida* (de diseño) durée de vie* (design) levetid
lift Auftrieb sustentación* ("lift") poussée*aérodynamique
opdrift, lift
ManufacturersHersteller fabricantes fabricants fabrikanter
masking noise Hintergrundgeräusche ruido enmascarador effet de masque maskerende lyd
mono pilefoundation(offshore)
Fundament mit einemPfeiler (Offshore)
cimentación*(marina) monopilote
monopilot d'acier(fondation offshore)
enkeltspælsfundament(offshore)
mountain wind Bergwind viento de montaña vent de montagne bjergvind
NacelleGondel góndola* nacelle* nacelle
noise Schall, Lärm ruido bruit støj
ObstacleHindernis obstáculo obstacle lægiver
occupational safety Betriebssicherheit seguridad* en eltrabajo
sécurité* du travail arbejdssikkerhed
offshore windenergy
Offshore-Windenergie energía* eólicamarina
énergie* éolienneoffshore
offshore vindkraft

operation andmaintenance costs
Betriebs- undWartungskosten
costes* de operacióny mantenimiento
coûts d'exploitationet d'entretien
drifts- ogvedligeholdelses-omkostninger
Park effectParkeffekt efecto del parque effet de parc parkvirkning
pitch control Pitchregelung regulación* porcambio del ángulode paso
contrôle à calagevariable
pitchregulering
pole changinggenerator
Generator mitPolumschaltung
generador connúmero de polosvariable
génératrice* à pôlescommutables
polomkobbelbargenerator
(magnetic) pole (magnetischer) Pol polo (magnético) pôle (magnétique) (magnet) pol
porosity Porosität porosidad* porosité* porøsitet
powercoefficient(rotor)power coefficient
Leistungsbeiwert (desRotors)
coeficiente depotencia (del rotor)
coefficient depuissance (du rotor)
(rotorens)effektkoefficient
power curve Leistungskurve curva* de potencia courbe* depuissance
effektkurve
power density Leistungsdichte densidad* depotencia
densité* depuissance
effekttæthed
power of the wind Leistung des Windes potencia* del viento puissance* du vent vindens effekt
power quality Leistungsqualität calidad* de potencia qualité* du courantélectrique
spændingskvalitet
(electrical) power (elektrische) Leistung potencia* (eléctrica) puissance*(électrique)
(elektrisk) effekt
Q
Rated power,
nameplate power
Nennleistung potencia* nominal puissance* nominale mærkeeffekt
Rayleigh distributionrectifier
Rayleigh-Verteilung distribución* deRayleigh
distribution* deRayleigh
Rayleighfordeling
rectifier Gleichrichter rectificador redresseur ensretter
renewable energy erneuerbare Energie energía* renovable énergie*renouvelable
vedvarende energi
rotor area(swept)rotor area
Rotorfläche área* del rotor (debarrido del rotor)
surface* balayée parle rotor (ou lel'hélice)
(bestrøget) rotorareal
rotor blade Rotorblatt pala* pale* rotorblad, vinge
rotor (of a generator) Rotor (des Generators) rotor (del generador) rotor (d'unegénératrice)
rotor (på generator)
rotor (of a windturbine)
Rotor (derWindkraftanlage)
rotor (de una turbinaeólica)
hélice*, rotor (d'uneéolienne)
rotor (på vindmølle)
roughness class Rauhigkeitsklasse clase* de rugosidad classe* de rugosité ruhedsklasse
roughness length Rauhigkeitslänge longitud* derugosidad (oparámetro deaspereza)
longueur* derugosité
ruhedslængde

roughness rose Rauhigkeitsrose rosa* de lasrugosidades
rose* des rugosités ruhedsrose
safety Sicherheit seguridad* sécurité* sikkerhed
Scale parameter
(Weibulldistribution)
Skalierungsparameter(Weibull-Verteilung)
parámetro de escala(distribución deWeibull)
paramètre d'échelle(distribution deWeibull)
skalaparameter(Weilbullfordeling)
sea bird Seevogel ave marina oiseau de mer søfugl
sea breeze Seebrise brisa* marina brise de mer * søbrise
shadow casting Schattenwurf distribución* de lassombras
projection* d'ombres skyggekastning
shape parameter(Weilbulldistribution)
Formparameter(Weibull-Verteilung)
parámetro de forma(distribución deWeibulll)
paramètre de forme(distribution deWeibull)
formfaktor(Weilbullfordeling)
shelter effect Windschatten einesHindernisses
efecto de resguardo effet d'obstacle lævirkning
sinusoidal sinusförmig sinusoidal sinusoïdal sinusformet
site, siting Standort, Standortwahl emplazamiento site, choix de site plads, placering
(generator) slip (Generator-) Schlupf deslizamiento (delgenerador)
glissement (d'ungénérateur)
(generator) slip
soft start "weiches" Einschalten arranque suave démarrage souple blød indkobling
sound Schall sonido son lyd
speed up effect Beschleunigungseffekt efecto acelerador effet de survitesse speed up effekt
stall Strömungsabriß, Stall pérdida* desustentación ("stall")
décrochageaérodynamique("stall")
stall
stall control Stallregelung, Regelungdurch Strömungsabriß
regulación* porpérdidaaerodinámica ("stallcontrol")
régulation* pardécrochageaérodynamique
stallregulering
star connection Sternschaltung conexión* estrella connexion* (oucouplage) en étoile
stjerneforbindelse
stator Stator estator stator stator
stream tube Stromröhre tubo de corriente tube de courant strømrør
structural dynamics Strukturdynamik dinámica*estructural
dynamique desstructures (dynami-que structurale)
strukturdynamik
synchronousgenerator
Synchrongenerator generador síncrono générateur(ou génératrice*)synchrone
synkrongenerator
synchronous speed Synchrondrehzahl velocidad* desincronismo
vitesse* synchrone synkron hastighed
Three phase
alternating current
Dreiphasen-Wechselstrom
corriente* alternatrifásica
courant alternatiftriphasé
trefaset vekselstrøm
thyristor Thyristor tiristor thyristor thyristor
tower Turm torre* tour* tårn

tripod foundation(offshore)
Dreibein-Fundament(Offshore)
cimentación*(marina) en trípode
fondation* à troispieds (le trépied)(offshore)
tripod fundament(offshore)
tubular tower Rohrturm torre* tubular tour tubulaire rørtårn
turbulence Turbulenz turbulencia* turbulence* turbulens
(rotor blade) twist Verwindung (desRotorblatts)
torsión, alabeo (de lapala)
torsion* de la pale twist, vridning
Upwind (machine)Luvläufer (máquina*) con rotor
a barloventoéolienne* face auvent
forløber
Variable
(rotational)
variable (Drehzahl) velocidad* (de giro)variable
vitesse* (de rotation)variable
variabel(omløbs)hastighed
vertical axis windturbine (VAWT)
Vertikalachser, -läufer aerogenerador de ejevertical
éolienne* à axevertical
vertikalakslet vindmølle
vortex generator Vortexgenerator generador detorbellinos
génératrice* devortex
vortex generator
Wake effectNachlauf-Effekt efecto de la estela effet de sillage kølvandseffekt, wake
effekt, slipstrøm
weak grid schwaches Netz red* débil réseau faible svagt net
Weilbull distribution Weibull-Verteilung distribución* deWeibull
distribution* deWeibull
Weilbullfordeling
wind energy Windenergie energía* eólica énergie* éolienne vindenergi
wind map Windkarte mapa eólico carte* des vents vindkort
wind power Windkraft potencia* eólica puissance* éolienne vindkraft
wind rose Windrose rosa* de los vientos rose* des vents vindrose
wind shade Windschatten abrigo (o sombra)del viento
abri, effet d'abri lævirkning
wind shear Windscherung cizallamiento (ocortadura) del viento
cisaillement du vent vindgradient, wind shear
wind turbine Windkraftanlage aerogenerador,turbina* eólica,aeroturbina*
éolienne*,aérogénérateur
vindmølle,vindkraftanlæg
wind vane Windfahne Windfahne girouette* vindfane
XYaw
Windnachführung orientación* orientation* krøjning
yaw mechanism Windnachführ-mechanismus
mecanismo deorientación
dispositifd'orientation
krøjemekanisme
Z
* = femenino * = féminin

| Home | Guided tour | FAQs | Quiz | Manufacturers | Articles | Pictures | News | MailingList | Find | Links | About Us | E-Mail | Map&Guide | Download |
Email: [email protected] pages are designed for Netscape 4, or Internet Explorer 4
© Copyright 2001 Soren KrohnUpdated 10 April 2001
http://www.windpower.org/glossary.htm

Copyright NoticeThis material is intended solely for personal and educational use.Linking to our pages is encouraged, but duplication,modification, or distribution of the content by any means isprohibited.
© CopyrightExcept as otherwise indicated any person is hereby authorised toview, copy, and print the documents in this web site subject to thefollowing conditions:
The documents may be used for informational,non-commercial purposes ONLY.
●
Any copy of the document or portion thereof must includethis copyright notice.
●
The Danish Wind Industry Association (hereafter alsoknown as DWIA) and any other copyright owner reservesthe right to revoke such authorisation at any time, and anysuch use shall be discontinued immediately upon writtennotice from the DWIA or any other copyright owner.
●
© Copyright on Graphics and CodeWith the exception of our logo mentioned below, pictures, plots,graphics or programming code from this web site may not bereused anywhere on the Internet, on an intranet, on CD-ROM orany other commercial or non commercial media, whetherelectronic, written or otherwise. Text, images, and programmingcode are the property of the Danish Wind Industry Association,and the respective copyright holders.
Any quotes from the content of this web site must beclearly attributed to the Danish Wind Industry Associationweb site www.windpower.org.
●
TrademarksDWIA and all DWIA logos and graphics contained within thissite are trademarks of the Danish Wind Industry Association, orits members. The current list of members can be found athttp://www.windpower.org/manuf/. All other brand and productnames are trademarks, registered trademarks or service marks oftheir respective holders.

Guide for Third Parties Who Use ourTrademarksDWIA authorises you or any other reader of this document toinclude the DWIA logo shown below on any World Wide Website, so long as the image is also a link to the DWIA's main pagelocated at http://www.windpower.org/. The following progressiveGIF logos are antialiased to a white and a default grey web pagebackground, respectively:
Making Links to This Web SiteIf you wish to make links to this web site on your site, we preferthat you link to our home page, http://www.windpower.org. Ifyou feel otherwise, please make links only to the main sectionslisted in the navigation panel in the top left corner of this page.That way we will be free to alter and improve the structure of thisweb site without wrecking the links on your site.
About this Web SiteUnless otherwise mentioned, the material on this site was written,edited, designed, programmed, and presented by Søren Krohn.
The material in this web site was created on AppleMacintosh Power PC 8500 computers, Apple MacintoshPower PC G3 and G4 computers and Apple MacintoshPower Book notebook computers. Web pages were
generated using the amazingly simple Adobe PageMillprogramme, admittedly with some manual HTML doctoring hereand there. Wind With Miller was layouted with Adobe GoLive.Our link errors were caught using Adobe SiteMill. Trickymulti-file searches for word modifications were done withBBEdit. 2D graphics and extrusion profiles were drawn inMacromedia FreeHand. 3D graphics and motion pictures weredesigned using Infini-D. Image optimisation for the web wasdone with Adobe Photoshop and lately Adobe ImageReady. Theexcellent freeware GifBuilder was used to create compact

cartoons, and lately some cartoons were processed in AdobeImageReady. Downloadable web site versions were compressedusing Stuffit de Luxe. QuickTime movies were shot with CanonXL1 and XM1 digital video cameras, edited with AdobePremiere and Apple FinalCut Pro, and compressed withMediaCleaner Pro and Sorenson Video Pro. QuickTimeVRpanoramas wer edited in Apple QuickTime VR Authoring Studio.Printed publications were lay-outed in Adobe PageMaker andAdobe InDesign and converted to pdf-format with AdobeAcrobat Distiller. For bulk mailing of update notices we useeMerge, while we update our mailing list using FileMaker Pro.All of these programmes except GifBuilder and eMerge areavailable for both Mac and Windows platforms.
| Home | Guided tour | FAQs | Quiz | Manufacturers | Publications |History | News | Mailing List | Find | Links | About Us | Reference Manual |
E-Mail | Map&Guide | Download |
These pages are designed for Netscape 4 and Internet Explorer 4.© Copyright 1998-2002Updated 26 January 2002
http://www.windpower.org/copyrght.htm


