Guided wave attenuation in coated pipes buried in sand · Guided wave attenuation in coated pipes...
10
Guided wave attenuation in coated pipes buried in sand Eli Leinov, Peter Cawley, and Michael J. S. Lowe Citation: AIP Conference Proceedings 1706, 030004 (2016); doi: 10.1063/1.4940476 View online: http://dx.doi.org/10.1063/1.4940476 View Table of Contents: http://scitation.aip.org/content/aip/proceeding/aipcp/1706?ver=pdfcov Published by the AIP Publishing Articles you may be interested in Guided wave attenuation in pipes buried in sand AIP Conf. Proc. 1650, 227 (2015); 10.1063/1.4914614 Investigation of guided waves propagation in pipe buried in sand AIP Conf. Proc. 1581, 271 (2014); 10.1063/1.4864830 Coating Property Effects on Guided Wave Attenuation in Viscoelastic Coated Pipes AIP Conf. Proc. 894, 124 (2007); 10.1063/1.2717963 Circumferential Guided Waves for Defect Detection in Coated Pipe AIP Conf. Proc. 820, 165 (2006); 10.1063/1.2184525 Ultrasonic guided wave propagation in pipes with viscoelastic coatings AIP Conf. Proc. 615, 239 (2002); 10.1063/1.1472805 Reuse of AIP Publishing content is subject to the terms at: https://publishing.aip.org/authors/rights-and-permissions IP: 155.198.12.147 On: Tue, 17 May 2016 14:22:39
-
Upload
nguyentruc -
Category
Documents
-
view
221 -
download
1
Transcript of Guided wave attenuation in coated pipes buried in sand · Guided wave attenuation in coated pipes...

Guided wave attenuation in coated pipes buried in sandEli Leinov, Peter Cawley, and Michael J. S. Lowe Citation: AIP Conference Proceedings 1706, 030004 (2016); doi: 10.1063/1.4940476 View online: http://dx.doi.org/10.1063/1.4940476 View Table of Contents: http://scitation.aip.org/content/aip/proceeding/aipcp/1706?ver=pdfcov Published by the AIP Publishing Articles you may be interested in Guided wave attenuation in pipes buried in sand AIP Conf. Proc. 1650, 227 (2015); 10.1063/1.4914614 Investigation of guided waves propagation in pipe buried in sand AIP Conf. Proc. 1581, 271 (2014); 10.1063/1.4864830 Coating Property Effects on Guided Wave Attenuation in Viscoelastic Coated Pipes AIP Conf. Proc. 894, 124 (2007); 10.1063/1.2717963 Circumferential Guided Waves for Defect Detection in Coated Pipe AIP Conf. Proc. 820, 165 (2006); 10.1063/1.2184525 Ultrasonic guided wave propagation in pipes with viscoelastic coatings AIP Conf. Proc. 615, 239 (2002); 10.1063/1.1472805
Reuse of AIP Publishing content is subject to the terms at: https://publishing.aip.org/authors/rights-and-permissions IP: 155.198.12.147 On: Tue, 17 May 2016 14:22:39
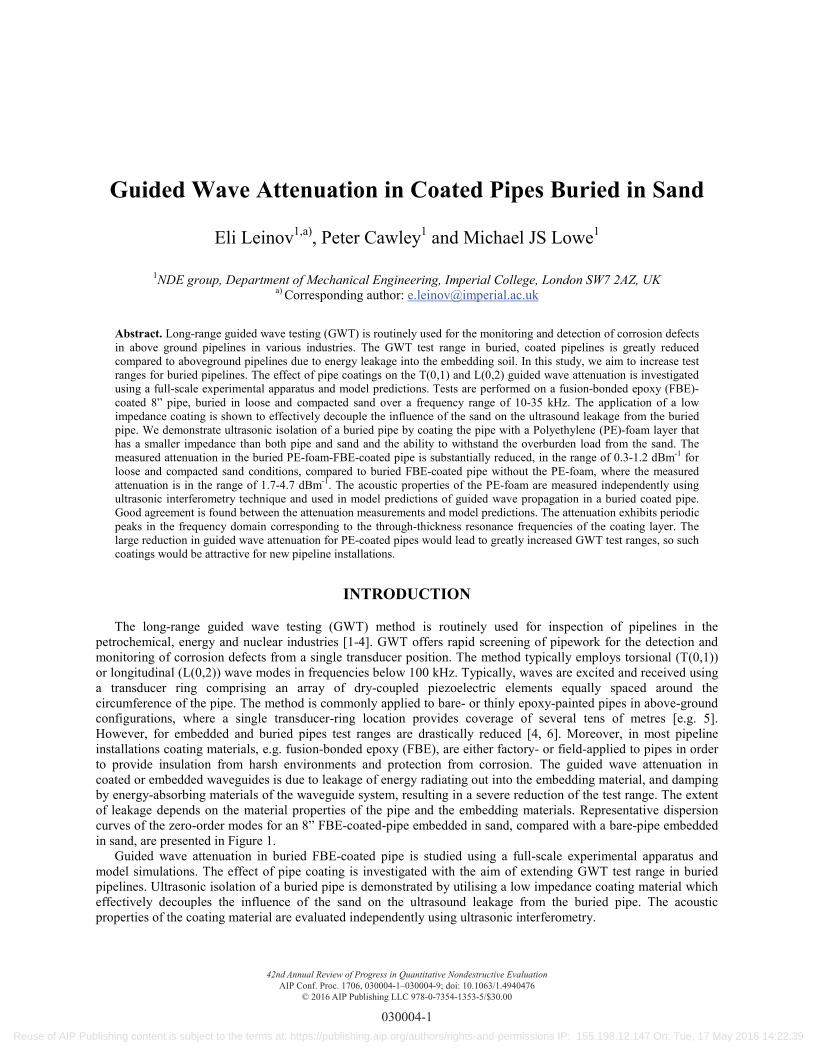
Guided Wave Attenuation in Coated Pipes Buried in Sand
Eli Leinov1,a), Peter Cawley1 and Michael JS Lowe1
1NDE group, Department of Mechanical Engineering, Imperial College, London SW7 2AZ, UKa) Corresponding author: [email protected]
Abstract. Long-range guided wave testing (GWT) is routinely used for the monitoring and detection of corrosion defects in above ground pipelines in various industries. The GWT test range in buried, coated pipelines is greatly reduced compared to aboveground pipelines due to energy leakage into the embedding soil. In this study, we aim to increase test ranges for buried pipelines. The effect of pipe coatings on the T(0,1) and L(0,2) guided wave attenuation is investigated using a full-scale experimental apparatus and model predictions. Tests are performed on a fusion-bonded epoxy (FBE)-coated 8” pipe, buried in loose and compacted sand over a frequency range of 10-35 kHz. The application of a low impedance coating is shown to effectively decouple the influence of the sand on the ultrasound leakage from the buried pipe. We demonstrate ultrasonic isolation of a buried pipe by coating the pipe with a Polyethylene (PE)-foam layer that has a smaller impedance than both pipe and sand and the ability to withstand the overburden load from the sand. The measured attenuation in the buried PE-foam-FBE-coated pipe is substantially reduced, in the range of 0.3-1.2 dBm-1 for loose and compacted sand conditions, compared to buried FBE-coated pipe without the PE-foam, where the measured attenuation is in the range of 1.7-4.7 dBm-1. The acoustic properties of the PE-foam are measured independently using ultrasonic interferometry technique and used in model predictions of guided wave propagation in a buried coated pipe. Good agreement is found between the attenuation measurements and model predictions. The attenuation exhibits periodic peaks in the frequency domain corresponding to the through-thickness resonance frequencies of the coating layer. The large reduction in guided wave attenuation for PE-coated pipes would lead to greatly increased GWT test ranges, so such coatings would be attractive for new pipeline installations.
INTRODUCTION
The long-range guided wave testing (GWT) method is routinely used for inspection of pipelines in the petrochemical, energy and nuclear industries [1-4]. GWT offers rapid screening of pipework for the detection and monitoring of corrosion defects from a single transducer position. The method typically employs torsional (T(0,1)) or longitudinal (L(0,2)) wave modes in frequencies below 100 kHz. Typically, waves are excited and received using a transducer ring comprising an array of dry-coupled piezoelectric elements equally spaced around the circumference of the pipe. The method is commonly applied to bare- or thinly epoxy-painted pipes in above-ground configurations, where a single transducer-ring location provides coverage of several tens of metres [e.g. 5]. However, for embedded and buried pipes test ranges are drastically reduced [4, 6]. Moreover, in most pipeline installations coating materials, e.g. fusion-bonded epoxy (FBE), are either factory- or field-applied to pipes in order to provide insulation from harsh environments and protection from corrosion. The guided wave attenuation in coated or embedded waveguides is due to leakage of energy radiating out into the embedding material, and damping by energy-absorbing materials of the waveguide system, resulting in a severe reduction of the test range. The extent of leakage depends on the material properties of the pipe and the embedding materials. Representative dispersion curves of the zero-order modes for an 8” FBE-coated-pipe embedded in sand, compared with a bare-pipe embedded in sand, are presented in Figure 1.
Guided wave attenuation in buried FBE-coated pipe is studied using a full-scale experimental apparatus and model simulations. The effect of pipe coating is investigated with the aim of extending GWT test range in buried pipelines. Ultrasonic isolation of a buried pipe is demonstrated by utilising a low impedance coating material which effectively decouples the influence of the sand on the ultrasound leakage from the buried pipe. The acoustic properties of the coating material are evaluated independently using ultrasonic interferometry.
42nd Annual Review of Progress in Quantitative Nondestructive EvaluationAIP Conf. Proc. 1706, 030004-1–030004-9; doi: 10.1063/1.4940476
© 2016 AIP Publishing LLC 978-0-7354-1353-5/$30.00
030004-1
Reuse of AIP Publishing content is subject to the terms at: https://publishing.aip.org/authors/rights-and-permissions IP: 155.198.12.147 On: Tue, 17 May 2016 14:22:39

(a) (b)FIGURE 1. Dispersion curves of the guided wave modes for 8” steel pipe (Sch-40, 9mm wall thickness, Steel=7932 kgm-3;CL,Steel=5960 ms-1; CS,Steel=3260 ms-1), solid lines: coated with fusion-bonded epoxy (0.3 mm thickness, FBE=1170 kgm-3;
CL,FBE=2610 ms-1; CS,FBE=1100 ms-1) and embedded in sand ( Sand=1620 kgm-3; CL,Sand=500 ms-1; CS,Sand=120 ms-1); and dashed lines: without coating embedded in sand: (a) Group velocity, and (b) Attenuation.
EXPERIMENTAL APPARATUS AND METHOD
A full-scale laboratory apparatus was used to facilitate well-controlled experimental conditions for the measurement of ultrasound attenuation in the coated-pipe buried in sand. A detailed description of the full-scale apparatus was provided elsewhere [6] and will only be described briefly here. The buried coated-pipe experimental apparatus consisted of a 6-meter long, 8 inch carbon steel pipe (schedule-40, 9mm wall thickness), FBE-coated (Resicoat R4 AkzoNoble, 0.25mm nominal thickness) embedded for 3-meters of its length in a rectangular container of 0.76m x 0.76m inner cross-section (Figure 3a-b). The container was constructed from 40mm-thick plywood plates, reinforced with a system of inter-connected rectangular section steel beams to support the load from the sand and was fitted with a tank-liner to contain the embedding sand. The pipe was fitted to the container at the entry and exit positions through circular openings in the corresponding wooden faces of the container, forming a 20mm gap around the pipe from the opening edge, in order to allow the pipe to settle in the sand without making contact with the openings in the wooden faces. Well-graded, dry clean sand (sand grain density of 2600 kgm-3) was used as the embedding medium. A rectangular inflatable air-bladder (3m x 0.76m x 0.1m, Polyurethane fabric) was fitted between the sand surface and the container covering plate for the application of overburden pressure loads on the sand corresponding to different depth conditions. The air-bladder was connected in-line with an air compressor, needle valve regulator and air pressure gauge. Ultrasonic guided waves were generated in the pipe using commercial transducer rings (Guided Ultrasonics Ltd) and signals were transmitted and collected using the Wavemaker G4 instrument (Guided Ultrasonics Ltd). Figure 2c presents photograph of the operating apparatus.
Guided wave attenuation was measured in loose and compacted sand conditions. The loose sand condition was obtained by pouring dry loose sand from bulk bags to backfill the container up to a height of 0.76m (Figure 3b) and the compacted sand case was obtained by application of overburden pressure up to 1bar on the sand, an equivalent to ca. 6m depth of dry sand with uniform density. The bulk densities of both cases are presented in Table 1. Bulk densities were determined from measurement of the net weight of sand used to fill the container and the volume it occupied in the container. Two independent transducer rings were attached in turn along the exposed length of the pipe to excite and record the torsional (T(0,1)) and longitudinal (L(0,2)) modes for each experimental condition.Received raw signals obtained from the transducer rings were applied with a Hilbert envelope in order to determine the amplitudes of the reflections peaks; signals were converted to the frequency domain via Fourier transform. Two different central frequencies, 16.5 kHz and 23.5 kHz, were used for each mode to allow overlap of the frequencies in the range covered.
The attenuation characteristic was obtained from the ratio of the signal amplitudes measured from the pipe end reflections:
LAA
2log20 0110 (1)
030004-2
Reuse of AIP Publishing content is subject to the terms at: https://publishing.aip.org/authors/rights-and-permissions IP: 155.198.12.147 On: Tue, 17 May 2016 14:22:39

where L is the length of the pipe embedded in sand, A0 is the reference reflection amplitude and A1 is themeasurement amplitude. The reference reflection signal is the received echo from the free end and the measurement signal is the received echo from the pipe-end beyond the buried section. The attenuation of both modes in air was found to be less than 0.1dBm-1 in reference tests; hence the attenuation of the modes in the pipe section exposed to air is considered to be negligible.
FIGURE 2. Full-scale experimental apparatus: (a) Side view drawing cut, (b) front view drawing cut, (c) photograph of the operating apparatus, (d) photograph of the FBE-coated pipe with additional layer of PE-foam coating being embedded in sand.
TABLE 1. Sand physical conditions and density.Sand Condition Sand Bulk Density (kg/m3)
Bare Pipe [6] FBE-Coated Pipe PE-Foam- FBE-Coated Pipe
Loose 1455 1485 1475Compacted 1724 1635 1630
To interpret the data, a series of dispersion curves was produced for a FBE-coated steel pipe embedded in an infinite layer of sand with a variety of possible values of acoustic parameters using the Disperse modelling software [7-8]. The acoustic properties of the sand were extracted from the best fit to the experiments. The use of two different modes for each experimental condition provides a verification of the model predictions with a high degree of confidence.
(a) (b)
(c) (d)
030004-3
Reuse of AIP Publishing content is subject to the terms at: https://publishing.aip.org/authors/rights-and-permissions IP: 155.198.12.147 On: Tue, 17 May 2016 14:22:39

RESULTS
Typical experimental results obtained from tests performed on the FBE-coated pipe embedded in loose and compacted sand cases, using the T(0,1) mode at a central frequency of 23.5 kHz, are presented in Figure 3a-b. The results are displayed as the amplitude of the Hilbert envelope of the recorded signal on a logarithmic scale as a function of distance from the transducer ring position. Reflections from both pipe-end locations are clearly evident, with the reflection from the free end of the pipe to the left of the transducer ring location and the reflection from the pipe end past the embedded section to the right of the transducer ring location. The attenuation is inferred from the amplitudes of these reflections using Equation (1). Two reverberations from the two pipe ends are also evident in the loose sand case (Figure 3a). The increase in the attenuation of the signal is noticeable in the compacted sand case (Figure 3b), where the reflection from the embedded pipe-end is much smaller than its counterpart in the loose sand case and the reverberation from the pipe end past the embedded part at just under 10 m cannot be distinguished from the noise floor.
(a) (b)
(c) (d)FIGURE 3. Typical experimental results from the coated buried pipe tests: amplitudes (in arbitrary units) as a function of
distance from the transducer ring using T(0,1) mode at central frequency of 23.5 kHz. FBE-coated pipe in (a) loose sand, and (b) compacted sand (1bar applied pressure); and FBE-coated pipe (same as used in (a-b)) with PE-foam coating layer in (c) loose
sand, and (d) compacted sand (1bar applied pressure). Grey shaded area represents near field.
FBE-Coated Pipe Buried in Loose and Compacted Sand
The attenuation measurements of the T(0,1) and L(0,2) modes as a function of frequency in the FBE-coated pipe for the loose sand (no applied pressure) and compacted sand (1 bar applied pressure) cases is presented in Figure 4.The attenuation measured in a particular sand condition at a certain frequency is the average of the values obtained from at least two different tests performed at these conditions and from different excitation central frequencies; error bars represent the variation between measurements at a certain frequency. The Disperse software was used to predict the attenuation as a function of frequency for a variety of sand acoustic velocities and the estimated density values
030004-4
Reuse of AIP Publishing content is subject to the terms at: https://publishing.aip.org/authors/rights-and-permissions IP: 155.198.12.147 On: Tue, 17 May 2016 14:22:39
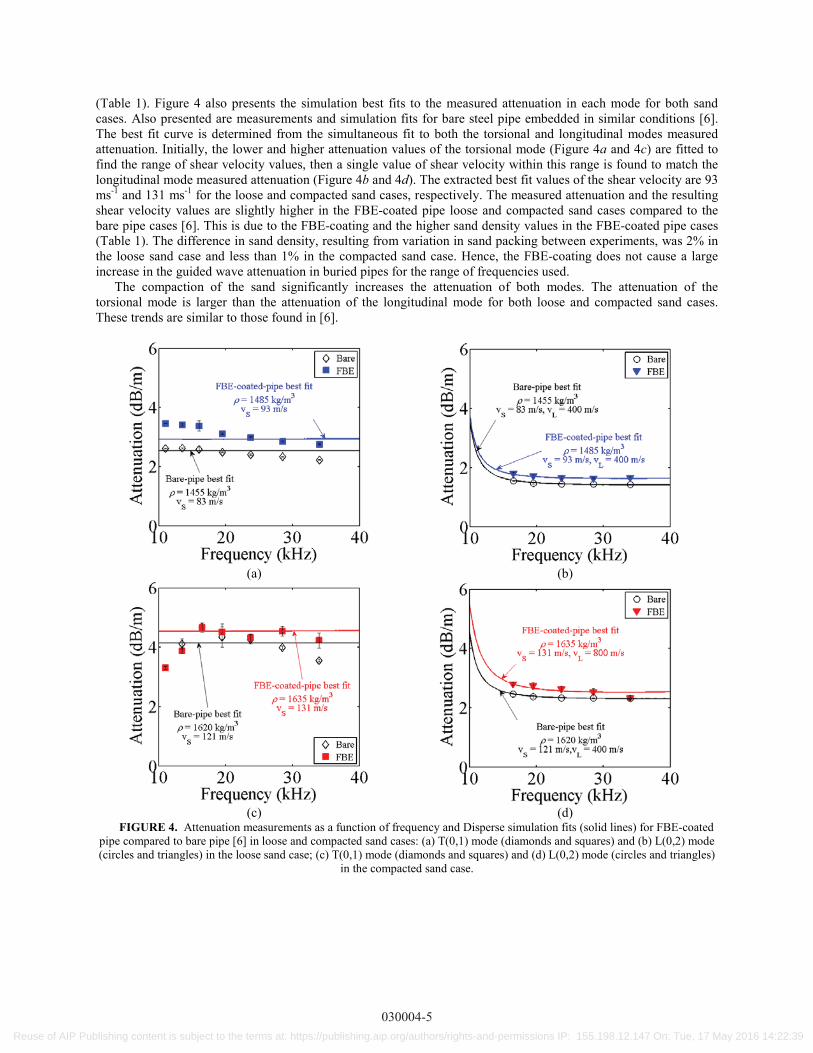
(Table 1). Figure 4 also presents the simulation best fits to the measured attenuation in each mode for both sand cases. Also presented are measurements and simulation fits for bare steel pipe embedded in similar conditions [6]. The best fit curve is determined from the simultaneous fit to both the torsional and longitudinal modes measured attenuation. Initially, the lower and higher attenuation values of the torsional mode (Figure 4a and 4c) are fitted to find the range of shear velocity values, then a single value of shear velocity within this range is found to match the longitudinal mode measured attenuation (Figure 4b and 4d). The extracted best fit values of the shear velocity are 93 ms-1 and 131 ms-1 for the loose and compacted sand cases, respectively. The measured attenuation and the resulting shear velocity values are slightly higher in the FBE-coated pipe loose and compacted sand cases compared to the bare pipe cases [6]. This is due to the FBE-coating and the higher sand density values in the FBE-coated pipe cases(Table 1). The difference in sand density, resulting from variation in sand packing between experiments, was 2% in the loose sand case and less than 1% in the compacted sand case. Hence, the FBE-coating does not cause a large increase in the guided wave attenuation in buried pipes for the range of frequencies used.
The compaction of the sand significantly increases the attenuation of both modes. The attenuation of the torsional mode is larger than the attenuation of the longitudinal mode for both loose and compacted sand cases. These trends are similar to those found in [6].
(a) (b)
(c) (d)FIGURE 4. Attenuation measurements as a function of frequency and Disperse simulation fits (solid lines) for FBE-coated
pipe compared to bare pipe [6] in loose and compacted sand cases: (a) T(0,1) mode (diamonds and squares) and (b) L(0,2) mode (circles and triangles) in the loose sand case; (c) T(0,1) mode (diamonds and squares) and (d) L(0,2) mode (circles and triangles)
in the compacted sand case.
030004-5
Reuse of AIP Publishing content is subject to the terms at: https://publishing.aip.org/authors/rights-and-permissions IP: 155.198.12.147 On: Tue, 17 May 2016 14:22:39

Buried FBE-Polyethylene-Foam-Coated Pipe
The density and shear velocity of the coating layer and the embedding sand dictate the attenuation of the guided wave modes. The impedance of the embedding sand promotes guided wave energy leakage and results in high attenuation values. Figure 5 presents the effect of the coating impedance on the attenuation of the T(0,1) mode for a coated-pipe buried in compacted sand. It is possible to achieve ultrasonic isolation of a buried pipe by introducing a coating layer of smaller impedance than both pipe and sand. The attenuation is presented as a function of the non-dimensional frequency, namely the product of the frequency and thickness of the coating layer over the shear velocity in the coating layer. For an impedance of the coating layer which equals that of the sand, the attenuation of the torsional mode is constant with frequency as in the bare-pipe case, yielding a constant attenuation value. As the impedance of the coating layer decreases from that of the sand impedance, the torsional mode attenuation decreases with a minimum when the coating layer thickness is a quarter wavelength; as the impedance of the coating layer increases from that of the sand, the attenuation increases with a maximum at the same layer thickness. The minimum and maximum values are a function of the shear velocity of the coating layer; the absolute frequency at which these values are obtained are determined by the actual coating layer thickness since it always occurs at a non-dimensional frequency of 0.25.
FIGURE 5. Attenuation of the T(0,1) mode as a function of non-dimensional frequency (the product of the frequency times the thickness over the shear velocity in the coating) for a pipe-coating-sand system: varying the impedance of a finite-thickness coating layer while keeping sand properties constant ( Sand=1620kg/m3; CS,Sand=121m/s). Black solid line: pipe-sand system
without coating present; Grey lines (dash, dash-dot, solid and dotted) – increasing the impedance of the coating layer; and black lines (dash, dash-dot and dotted) – decreasing the impedance of the coating layer.
Ultrasonic isolation of the buried FBE-coated pipe was realised experimentally by the application of a Polyethylene (PE)-foam layer (85 kgm-3, 19 mm thickness, Plastazote HD80, Zotefoams) around the buried section of the pipe. PE-foam was selected due to its low density and rigidity, allowing it to withstand the load experienced by the sand backfill and applied overburden pressure. The PE-foam was applied to the pipe with an epoxy spray adhesive (HS-300, Ambersil) and was secured with a set of cable-ties (Figure 2d).
Typical guided wave tests of the T(0,1) mode at a central frequency of 23.5 kHz, for the FBE-PE-foam-coated pipe buried in loose and compacted sand conditions are presented in Figures 3c,d, respectively. Reflections from both pipe-end locations are clearly evident. The amplitude of the pipe-end reflection past the embedded section, appearing as the first reflection to the right of the ring position, is larger in the FBE-PE-foam-coated pipe compared with the FBE-coated pipe for both the loose sand (Figures 3c,a) and compacted sand (Figures 3d,b) cases. The pipe-end reflection amplitudes obtained in the FBE-PE-foam-coated pipe cases are very similar, indicating the sand compaction has a minor effect on the attenuation in the PE-foam coated case, in contrast to the FBE-coating only case.
Figure 6 presents the attenuation measurements of the T(0,1) and L(0,2) modes as a function of frequency for the FBE-PE-foam-coated pipe buried in loose (no applied pressure) and compacted sand (1 bar applied pressure). Also presented in Figure 5 are measurements from the buried FBE-coated pipe and the corresponding Disperse simulation fits (see Figure 4). A substantial decrease in attenuation is clearly evident for both guided wave modes in the FBE-
030004-6
Reuse of AIP Publishing content is subject to the terms at: https://publishing.aip.org/authors/rights-and-permissions IP: 155.198.12.147 On: Tue, 17 May 2016 14:22:39
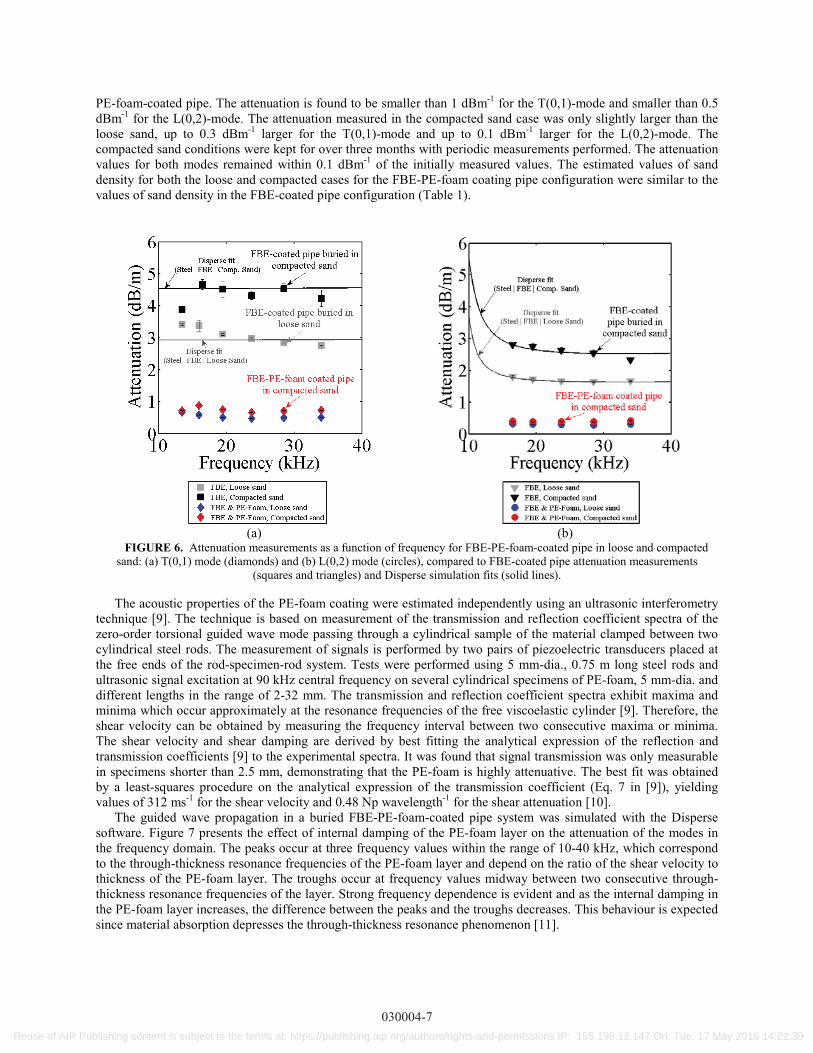
PE-foam-coated pipe. The attenuation is found to be smaller than 1 dBm-1 for the T(0,1)-mode and smaller than 0.5 dBm-1 for the L(0,2)-mode. The attenuation measured in the compacted sand case was only slightly larger than the loose sand, up to 0.3 dBm-1 larger for the T(0,1)-mode and up to 0.1 dBm-1 larger for the L(0,2)-mode. The compacted sand conditions were kept for over three months with periodic measurements performed. The attenuation values for both modes remained within 0.1 dBm-1 of the initially measured values. The estimated values of sand density for both the loose and compacted cases for the FBE-PE-foam coating pipe configuration were similar to thevalues of sand density in the FBE-coated pipe configuration (Table 1).
(a) (b)FIGURE 6. Attenuation measurements as a function of frequency for FBE-PE-foam-coated pipe in loose and compacted
sand: (a) T(0,1) mode (diamonds) and (b) L(0,2) mode (circles), compared to FBE-coated pipe attenuation measurements (squares and triangles) and Disperse simulation fits (solid lines).
The acoustic properties of the PE-foam coating were estimated independently using an ultrasonic interferometry technique [9]. The technique is based on measurement of the transmission and reflection coefficient spectra of the zero-order torsional guided wave mode passing through a cylindrical sample of the material clamped between two cylindrical steel rods. The measurement of signals is performed by two pairs of piezoelectric transducers placed at the free ends of the rod-specimen-rod system. Tests were performed using 5 mm-dia., 0.75 m long steel rods and ultrasonic signal excitation at 90 kHz central frequency on several cylindrical specimens of PE-foam, 5 mm-dia. and different lengths in the range of 2-32 mm. The transmission and reflection coefficient spectra exhibit maxima and minima which occur approximately at the resonance frequencies of the free viscoelastic cylinder [9]. Therefore, the shear velocity can be obtained by measuring the frequency interval between two consecutive maxima or minima. The shear velocity and shear damping are derived by best fitting the analytical expression of the reflection and transmission coefficients [9] to the experimental spectra. It was found that signal transmission was only measurable in specimens shorter than 2.5 mm, demonstrating that the PE-foam is highly attenuative. The best fit was obtained by a least-squares procedure on the analytical expression of the transmission coefficient (Eq. 7 in [9]), yielding values of 312 ms-1 for the shear velocity and 0.48 Np wavelength-1 for the shear attenuation [10].
The guided wave propagation in a buried FBE-PE-foam-coated pipe system was simulated with the Disperse software. Figure 7 presents the effect of internal damping of the PE-foam layer on the attenuation of the modes in the frequency domain. The peaks occur at three frequency values within the range of 10-40 kHz, which correspond to the through-thickness resonance frequencies of the PE-foam layer and depend on the ratio of the shear velocity to thickness of the PE-foam layer. The troughs occur at frequency values midway between two consecutive through-thickness resonance frequencies of the layer. Strong frequency dependence is evident and as the internal damping in the PE-foam layer increases, the difference between the peaks and the troughs decreases. This behaviour is expected since material absorption depresses the through-thickness resonance phenomenon [11].
030004-7
Reuse of AIP Publishing content is subject to the terms at: https://publishing.aip.org/authors/rights-and-permissions IP: 155.198.12.147 On: Tue, 17 May 2016 14:22:39

FIGURE 7. Disperse simulation results for FBE-PE-foam-coated pipe buried in compacted sand ( Sand= 1635kg/m3; CS,Sand=131m/s): attenuation as a function of frequency for various values of shear damping in the PE-foam layer ( S,PE-foam= 0-0.75
Neper/wavelength; 19 mm thickness; PE-foam= 85kg/m3; CS,PE-foam= 312m/s).
The amplitude spectra of the two end reflections for the torsional mode in the FBE-PE-foam-coated pipe buried in compacted sand case were computed via Fourier analysis and the attenuation spectrum was computed withEquation (1). Figure 8 presents the attenuation spectrum, obtained from a superposition of measurements performed at the different central frequencies, along with the corresponding simulation from Disperse, obtained using the PE-foam measured shear velocity and attenuation. The measured and predicted curves are qualitatively very similar with peaks occurring at similar frequencies. The attenuation values at the peaks are somewhat different and this is probably due to inaccuracies in the measurement of the PE-foam attenuation which was difficult in such a low impedance, high attenuation material. The Disperse prediction for a pipe surrounded by an infinite layer of PE-foam is also shown in Figure 8. Since the infinite layer has no through-thickness resonances, this is a constant value and the experimental curve is tending towards this value at higher frequencies as the resonances are heavily attenuated. This indicates that the pipe is increasingly decoupled from the sand; effectively, minimisation of the influence of the sand on the attenuation behaviour was accomplished.
FIGURE 8. Attenuation of the T(0,1) mode from the FBE-PE-foam-coated pipe buried in compacted sand ( Sand=1635kg/m3;CS,Sand=131m/s), obtained by experimental measurement (black solid line) and Disperse simulation (grey solid line). Also shown
Disperse simulation for a case of infinite layer of PE-foam (grey dashed line). Measured acoustic properties of PE-foam wereused in the simulations ( PE-foam=85kg/m3; CS,PE-foam=312m/s; S,PE-foam=0.48 Np/wavelength).).
030004-8
Reuse of AIP Publishing content is subject to the terms at: https://publishing.aip.org/authors/rights-and-permissions IP: 155.198.12.147 On: Tue, 17 May 2016 14:22:39

CONCLUSIONS
The attenuation of the T(0,1) and L(0,2) guided wave modes has been studied in a FBE-coated pipe buried in loose and compacted sand conditions over the frequency range commonly used in GWT of 10-35 kHz. The attenuation of the guided wave modes in buried pipes is largely due to energy leakage into the embedding sand. The thin FBE pipe coating was found to slightly increase the attenuation of the modes compared to buried bare pipe. The large values of attenuation measured for both guided wave modes dictate a significant reduction of GWT test ranges for buried pipes compared with above-ground pipes. The feasibility of ultrasonic isolation of the buried FBE-coated pipe using an additional coating layer has been investigated and has been demonstrated by the application of a PE-foam coating layer between the FBE-coated pipe and the sand. A PE-foam coating layer was selected since its impedance is smaller than that of both pipe and sand, and due to its ability to withstand the load from the sand and the applied overburden pressure. The measured guided wave attenuation values in the buried FBE-PE-foam-coated pipe were found to be substantially smaller than those measured in the buried FBE-coated pipe for both loose and compacted sand conditions. The measured attenuation was found to be 0.5-1.2 dBm-1 for the T(0,1) mode and 0.3-0.5 dBm-1 for the L(0,2) mode in the pipe buried with the PE-foam coating, compared to 2.8-4.7 dBm-1 for the T(0,1) mode and 1.7-2.8 dBm-1 for the L(0,2) mode in the pipe buried without the PE-foam coating.
The attenuation behaviour of the T(0,1) mode in the buried FBE-PE-foam-coated pipe was modelled using shear velocity and damping values of the PE-foam layer obtained from independent measurement using an ultrasonic interferometry technique. Good agreement was found between the experimental measurements and model predictions. The T(0,1) mode attenuation showed periodic peaks in the frequency domain which correspond to the through-thickness resonance frequencies of the PE-foam coating layer and depend on the ratio of the shear velocity to thickness of the layer. The attenuation peak values depend on the attenuation in the coating layer, and decrease with increasing coating layer attenuation.
The large reduction in guided wave attenuation of the ultrasonically isolated buried pipe due to the low impedance coating yields a substantial increase of guided wave inspection range. The guided wave attenuation measurements can be used to estimate the inspection pipe-length for a pipe buried in sand. Given minimum signal to coherent noise ratio of 40 dB generated by a GWT instrument (e.g. [5]), propagation distances for the torsional mode in a buried pipe without ultrasonic isolation would be limited to ~10m, corresponding to a test range in a pulse-echo configuration of ~5m; however, for an ultrasonically isolated pipe the torsional mode pulse-echo test range would increase to ~15-30 m.
ACKNOWLEDGMENTS
This work is funded by the UK Engineering and Physical Sciences Research Council (EPSRC) and carried out in collaboration with BP, EDF and Shell.
The authors would like to thank Drs. David Alleyne, Brian Pavlakovic and Thomas Vogt at Guided Ultrasonics Ltd for the loan of equipment and advice, and Mr. Leslie Clark and Mr. Bob Hewitt at the Structures Laboratory,Dept. of Civil and Enviro. Eng., Imperial College, for the excellent technical support.
REFERENCES
1. D.N. Alleyne and P. Cawley, IEEE Trans. Ultrasonics, Ferroelec., Freq. Control 39, pp. 381-397 (1992).2. P. Mudge, Insight 43, pp. 74-77 (2001).3. M. Sheard and A. McNulty, Insight 43, pp. 79-83 (2001)4. V.M. Nunez Ledesma, E. Perez Baruch, A. Demma and M.J.S. Lowe, Mat. Eval. 67, pp. 102-115 (2009).5. D.N. Alleyne, B. Pavlakovic, M.J.S. Lowe and P. Cawley, Insight 43, pp. 93-101 (2001).6. E. Leinov, M.J.S. Lowe and P. Cawley, J. Sound & Vib. 347, pp. 96-114 (2015).7. M.J.S. Lowe, IEEE Trans. Ultrasonics, Ferro. And Freq. Control, 42, pp. 525-542 (1995).8. B. Pavlakovic, M.J.S. Lowe, D.N. Alleyne and P. Cawley, in Rev. Prog. Quant. Nondestruct. Eval. 16, edited
by D.O. Thompson and D.E. Chimenti (New York: Springer, 1997), pp. 185-192.9. F. Simonetti and P. Cawley, J. Acoust. Soc. Am. 115, pp. 157-164 (2004).10. E. Leinov, M.J.S. Lowe and P. Cawley, Ultrasonic isolation of buried pipes, J. Sound & Vib., (Submitted,
2015). 11. F. Simonetti and P. Cawley, Proc. Royal Soc. Lon. A. 460, pp. 2197-2221 (2004).
030004-9
Reuse of AIP Publishing content is subject to the terms at: https://publishing.aip.org/authors/rights-and-permissions IP: 155.198.12.147 On: Tue, 17 May 2016 14:22:39