Guide to understanding customer reports. Claims with a Date of Injury within the Last Four Years...
95
Guide to Understanding Customer Reports - May 2012 1 GUIDE TO UNDERSTANDING CUSTOMER REPORTS May 2012
Transcript of Guide to understanding customer reports. Claims with a Date of Injury within the Last Four Years...

Guide to Understanding Customer Reports - May 2012
1
GUIDE TO UNDERSTANDING CUSTOMER REPORTS
May 2012

Guide to Understanding Customer Reports - May 2012
Disclaimer
This Guide has been developed by Comcare and
all attempts have been made to incorporate
accurate information. The information included
in the Guide has been compiled in October 2011.
This Guide is supplied on the terms and
understanding that Comcare is not responsible
for the results of any action taken on the basis of
information in this publication, nor for any error
or omission from this publication. Comcare
expressly disclaims all and any liability and
responsibility to any person, in respect of
anything, and the consequences of anything,
done or omitted to be done, by any such person
in reliance, whether wholly or partially, upon the
whole or any part of this publication.
Copyright
Published by Comcare ABN 41 640 788 304
© Commonwealth of Australia 2012-05-07
This work is copyright. Apart from any use as
permitted under the Copyright Act 1968, no part
may be reproduced by any process without prior
written permission from the Australian
Government and from the Commonwealth.
Requests and inquiries concerning reproduction
and rights should be addressed to the
Commonwealth Copyright Administration,
Attorney-General’s Department, National Circuit,
Barton ACT 2600 or posted at
http://www.agh.gov.au/cca
Contacts for further information
To obtain further information about the contents
of this Guide, contact:
CIS Helpdesk
Comcare
GPO Box 9905
Canberra ACT 2601

Guide to Understanding Customer Reports - May 2012
3
Contents
Comcare’s Customer Information System 5
Making the most of CIS ............................................................................................ 5
Where can I get more information? ............................................................................ 5
Section 1 - Management Reports 6
1. Progressive Costs Report ...................................................................................... 8
2. Prevention and Rehabilitation Performance Summary ............................................. 11
3. Claims and total cost by mechanism of incident - chart .......................................... 14
4. Claims, cost and time lost by cost centre .............................................................. 16
5. Number of injuries resulting in 5, 30 and 60 or more days of incapacity ................... 17
6. Number of injuries resulting in 5 days incapacity by mechanism of incident .............. 18
7. Number of Death Claims ..................................................................................... 20
8. Frequency of lost time injuries............................................................................. 21
9. Percentage of claimants with >= 10 days incapacity determined with a Return to Work
Plan ................................................................................................................ 22
10. Quality of Return to Work Outcomes .................................................................. 24
11. T1 Numbers of workplace injury and disease ....................................................... 25
12. T3 - weeks lost time ......................................................................................... 27
13. T4 - Average weeks for Return to Work activity to commence ............................... 29
14. Occupation by mechanism of incident - Claims .................................................... 31
15. Occupation by mechanism of incident - total cost ................................................. 33
16. Age group by mechanism of incident - claims ...................................................... 35
17. Age group by mechanism of incident - total cost .................................................. 37
18. Duty status by mechanism of incident - claims .................................................... 39
19. Duty status by mechanism of incident - total cost ................................................ 41
20. Claims and total cost by age group .................................................................... 43
21. Mechanism of injury by costs, incapacity and claims ............................................. 45
22. Cost centre structure report .............................................................................. 48
23. Case Manager Details by Customer report ........................................................... 49
24. CIS user access list .......................................................................................... 50
Section 2 - Case Management Reports 51
66. Customer Data Report - Claim Detail .................................................................. 52
30. Customer Data Report - claims by cost centre and case manager........................... 54
31. Customer Data Report - Open Claims ................................................................. 54
32. Customisable Customer Data Report .................................................................. 55
33. Accepted claims by date ................................................................................... 56
34. Claims incurring payment ................................................................................. 57

Guide to Understanding Customer Reports - May 2012
4
36. Open Return to Work Plan ................................................................................. 58
37. Claim activity post return to work ...................................................................... 59
38. Rehabilitation Expenditure ................................................................................ 60
39. Open/expired return to work plan ...................................................................... 61
40. RTWP average cost and duration ........................................................................ 62
41. Early Intervention ............................................................................................ 64
42. Provider Performance ....................................................................................... 66
43. Claims with multiple RTW plans ......................................................................... 67
44. Customer Data Report - Return to Work ............................................................ 68
45. Open Claims by Cost Centre by Mechanism of Incident ......................................... 70
46. Claim Details by Nature of Injury/Disease ........................................................... 71
47. Claim Details by Agency Of Injury/Disease .......................................................... 72
48. Claims with Reconsiderations ............................................................................ 73
49. Claims with AAT Case Decision .......................................................................... 74
50. Top 50 Claims by Cost to Date........................................................................... 75
51. Claims with a Date of Injury within the Last Four Years ........................................ 76
52. High Cost Claims ............................................................................................. 77
Section 3 - Financial Reports 79
70. Incapacity Determinations ................................................................................ 80
71. Payment Remittance Detail Report by Date ......................................................... 81
72. Payment Remittance Detail Report by Payment Number ....................................... 82
73. Payment Remittance Summary Report ............................................................... 83
74. Claims approaching 45 weeks incapacity ............................................................. 84
Section 4 – Using the CIS 85
Generating a report ............................................................................................... 85
Viewing a claim ..................................................................................................... 87
Cost Centre Restrictions ......................................................................................... 89
Preferences .......................................................................................................... 90
Section 5 – CIS Glossary of Terms 92

Guide to Understanding Customer Reports - May 2012
5
Comcare’s Customer Information System
The Customer Information System (CIS) provides customers with access to injury
management and claims information through a secure website, and can be used to improve
the measurement and monitoring of your agency’s injury management and claims
performance.
Access to CIS is granted to authorised personnel only.
Making the most of CIS
The Guide to Understanding Customer Reports provides you with detailed information on
the various reports available through CIS, explaining the various reporting fields and terms
used. The Guide also provides you with a brief guide to using the CIS application, and
contact details for the CIS helpdesk.
We have grouped the report information according to how it appears in CIS:
Section 1 - Management Reports
Section 2 - Case Management Reports and
Section 3 - Finance Reports
Section 4 - Using CIS and
Section 5 - Glossary of terms
There are three levels of user access in CIS, and your level of access will determine which of
the reports you can run. Your Agency CIS Administrator can provide you with more
information on your level of access, and is the first point of contact should you wish to
request an amendment to your CIS user account.
Where can I get more information?
There are a range of supporting documents and systems to make using CIS an easy and
informative experience. An online help function is available both from within CIS itself and
also from the main CIS website. The CIS website also provides you with a range of “how-
to” documents and frequently asked questions around the application itself.
You can access the CIS from the Comcare website - go to www.comcare.gov.au and follow
the link on the right hand side to the Customer Information System.
We also have a dedicated team of staff in the Comcare CIS Helpdesk that can be contacted
on 1300-366-979, or by email at [email protected] .

Guide to Understanding Customer Reports - May 2012
Section 1 - Management Reports
The suite of management reports provides essential management information about claims
experience, associated costs and the claim profile of claims with a date of injury within a
specified date range. The reports are represented in list and graphical formats.
An agency can monitor performance trends and assist in the development of effective injury
prevention and case management strategies for their agencies. The reports can be selected
to compare performance across an agency, dependant on the Agency’s cost centre structure
within Comcare’s management database.
Report Content
Data within these reports is at the Management level of access only (no claim level detail).
All reports provide a number of content and presentation options. For example, reports can
usually provide data by:
All (whole of agency)
Cost Centre
Cost Centre View (grouping of cost centres created by Comcare on request)
Reporting Periods
There is a number of reporting period options available for selection:
Financial year
Calender year
Other, as required
Note: the earliest reporting period available is 1.1.1998.
The number of periods available for selection varies between each report - some reports will
allow a comparison of 4 periods on the one report, others 1 or 2.
Data currency
The claims information within the Management Reports is updated on a daily basis, with
data as at close of business. This means that on any day, CIS will be reporting with data as
at close of business on the day immediately prior. Information about total costs, including
future cost estimates are updated on the following schedule:
Month case
estimate based on
Available on CIS
July First week October
August First week November
September First week December
October First week January
November First week February
December First week March
January First week April
February First week June - The extra wait for the estimates is to increase the
quality of the estimates of claim costs used in premium calculations.
CIS continues to show these estimates until mid July.
March Second last week of July
April Last week of July
May First week August
June First week September

Guide to Understanding Customer Reports - May 2012
7
All reports are available through the Comcare Customer Information System via the
Comcare Website, or can be produced on request as required.
Important notes:
Any claims with actual or potential Third Part Recovery action will reduce the future
cost estimate (case estimate) for that claim, which will in turn reduce the total cost of
that claim. The Third Party Recovery part of the likely future cost calculations takes
into consideration such things as the likelihood of successfully gaining a recovery and
the likely future size of that recovery. Please bear this in mind when reading reports
which include future cost estimate data.
It is important to note when looking at data for any given Date of Injury period there
may be a percentage of injuries incurred by employees that have not yet been
reported to Comcare, and will therefore not be included in reports. This is especially
true of reports run for recent Date of Injury periods. CIS only reports on accepted
claims, there it is useful to refer to your agency’s OH&S incident reporting records
when trying to gauge an overall picture of your agencies injury history and
performance.

Guide to Understanding Customer Reports - May 2012
8
1. Progressive Costs Report
Description: This report illustrates how claim costs accumulate over the life of a claim.
Access Level Required: Management level access
Export options: .pdf, .rtf
Benefits: This report is in contrast to the other reports available in CIS because it reports
on costs of claims that occur in each year, as opposed to just costs indiscriminate of the
claims injury year. In that sense it is beneficial to see the costs progress for all accepted
claims of a given year.
Parameters: The report is calculated based on Accepted claims with a date of injury within
the last 5 years inclusive of the current year.
Fields:
Field Description
Inj Year The year that the accepted claims injury occurred.
Mature Months The number of months since the beginning of the calendar year
being measured.
Month/Year The period other fields within report relate to.
No of Claims The number of claims that have occurred in the period.
<1 Day Incap The number of claims with a date of injury in the reported calendar
year that have less than 1 day incapacity.
>=1 Day Incap The number of claims with a date of injury in the reported calendar
year that have equal to or more than 1 day incapacity.
>45 Wk Incap The number of claims with a date of injury in the reported calendar
year that have more than 45 weeks incap.
Avg Wks Incap The average incapacity of all claims with a date of injury within the
reported calendar year.
Incapacity Costs The accumulation of incapacity costs for claims with a date of
injury within the reported year.
Medical Costs The accumulation of medical costs for claims with a date of injury
within the reported year.
Travel Costs The accumulation of travel costs for claims with a date of injury
within the reported year.
Other Costs The accumulation of other costs for claims with a date of injury
within the reported year.
Total Costs to Date
($)
The accumulation of all claim costs for claims with a date of injury
within the reported year.
Notes: This report allows an agency to compare the progressive costs, number of claims,
and total claim costs over a number of years.
Example Report: Following page

Guide to Understanding Customer Reports - May 2012
9
1. Progressive costs report
A Sample Agency
Period(s): [01/01/2011 - 31/12/2011]
lists progressive claim costs and incap durns

Guide to Understanding Customer Reports - May 2012
10
Inj Year
Mature Months
Month/Year No of Claims
<1 Day
Incap
>=1 Day
Incap
>45 Wk
Incap
Avg Wks
Incap
Incapacity Costs($)
Medical Costs($)
Travel Costs($)
Other Costs($)
Total Costs to Date($)

Guide to Understanding Customer Reports - May 2012
11
2. Prevention and Rehabilitation Performance Summary
Description: This report provides a snapshot view of claim numbers, delays and costs.
Access Level Required: Management level access
Export options: .pdf, .rtf
Benefits: A quick overview of claim statistics in regard to claim numbers, time lost, costs,
Return to Work and claim lodgement delays for the last completed quarter, previous year
and previous four years. This report also directs the user to more specific reports on each
topic.
Fields and Parameters:
Field Description
Period 4 year data reflects the performance of claims accepted in the
four years to 30 June of the previous financial year
1 year data reflects the performance of claims accepted in the
previous financial year.
Last quarter data reflects the performance of claims accepted
for the latest completed quarter. Due to the immaturity of
claims determined in this period, this data should be viewed
with caution and should not be used in isolation to inform any
assessment of a change in an agency's performance.
Claims accepted includes all claims for which Comcare issued
a determination accepting liability. This includes claims that
were accepted following reconsideration or review by the
Administrative Appeals Tribunal.
Number of claims Number of claims counts all claims accepted by Comcare in
the specified period/s.
This number can be used to calculate your agency's claim
frequency. Divide the number of accepted claims by $ million
payroll for your agency.
Number of lost time
injury claims
Number of lost time injury claims is a subset of the
number of claims and counts those claims that have recorded
one shift or more time away from the workplace due to a
compensated injury.
This number can be used to calculate your agency's lost time
frequency rate. Divide the number of lost time injury claims
by the total number of hours worked by all agency employees
in the period and multiply by 1,000,000. The total number of
hours worked can be derived from the actual hours worked or
from the number of hours of paid work, less a notional
estimate for leave hours.
Average cost of claims Average cost of claims is calculated by dividing the total cost
of claims accepted in the specified period/s by the number of
claims accepted in the period/s. Claim costs in this report
represent claims accepted in the period with any date of injury
and are not limited to claims with a date of injury in the last
quarter, year or 4 yearly period.

Guide to Understanding Customer Reports - May 2012
12
Field Description
Time taken to lodge
claims
Time taken to lodge a claim measures the average number
of calendar days taken for claims to be forwarded to Comcare
from a date of injury. This measure only includes claims
determined by Comcare in the specified period/s and excludes
any claim received by Comcare 1000 calendar days or more
after the date of injury.
Number of claims
reaching the 5th day of
lost time / Number of
claims reaching the 30th
day of lost time /
Number of claims
reaching the 60th day of
lost time
Number of claims reaching the 5th, 30th and 60th days
of lost time count claims that recorded the 5th, 30th or 60th
cumulative calendar day of incapacity entitlement in the
specified period/s.
This measure counts all claims with an incapacity entitlement
recorded in the period/s, irrespective of the date of injury, the
date the claim was received or determined or the date or
length of the period of incapacity entitlement.
Percentage of claims
with a new Return to
work plan
Percentage of claims with a new Return to work plan
counts the number of claims, having had 10 or more days
incapacity determined, who commenced a RTW plan
determined either in the period or prior to the 10th day of
incapacity being determined.
The percentage is calculated by dividing this count by the total
number of claims that recorded the 10th cumulative calendar
day of incapacity entitlement in the specified period/s.
Quality of return to work Quality of return to work counts the number of claimants
who actually returned to work at the end of a return to work
plan. This measure only includes return to work plans with an
end date in the specified period/s. It exclude claims where the
return to work plan has been amended to extend the initial end
date.
Example Report: following page

Guide to Understanding Customer Reports - May 2012
13
2. Prevention and rehabilitation performance summary
*A Sample Agency
An explanation of these indicators and precisely what they measure is provided in the help system
Indicator Last Quarter
1 Year 4 Year Refer reports(s)
Number of claims 7 86 26
Number of lost time injuries 2 18 6 Report 8
Avg. cost of claims($) 18,316.10 130,276.66 89,737.02
Avg. time taken to lodge claims 32.00 25.00 53.50
Number of claims reaching the 5th day of lost time 1 4 3 Report 5
Number of claims reaching the 30th day of lost time 0 1 3 Report 5
Number of claims reaching the 60th day of lost time 0 1 2 Report 5
Percentage of claims with a new Return to work plan 0% 50% 50% Report 9
Quality of return to work 0% 0% 40% Report 10

Guide to Understanding Customer Reports - May 2012
14
3. Claims and total cost by mechanism of incident - chart
Description: This report shows the claim cost and number of claims for a given period,
grouped by the major Mechanism of Incident groups.
Access Level Required: Management level access
Export options: .pdf, .rtf
Benefits: This report allows the user to break down costs and numbers of claims for each
Mechanism of Injury category, to help the user better understand how injuries are occurring
and how much they are costing. There are 3 charts available for the user to view the data.
The report also allows the user to compare 2 reporting periods to assess the differences in
cost attributed to specific injury types.
Parameters: The report represents Accepted claims with a date of injury within the period
defined by the user.
Fields:
Field Description
Period This field displays the date range the report was generated for.
Mechanism of Injury
Major Group
Refers to the classification groups within the Type of
occurrence classification system.
Cost to date ($) The total of costs incurred on the claim as of yesterday.
Future cost estimate ($) The estimate of future costs on the claim as of the case
estimate date. The future cost estimate is determined by a
complex calculation that takes into account a wide array of
factors.
Avg. cost to date ($) The cost to date of all claims within the given period divided by
the number of claims meeting the given caveat within the same
period.
No. Claims The number of claims that meet the criteria of the column.
Total Cost The total of Costs to date ($) plus Future Cost Estimate ($), as
at the case estimate date.
Notes: By grouping the major Mechanism of Incident categories, this report aids with
identifying the action, exposure or event which was the direct cause of the most serious
injury or disease, providing an excellent indicator of injury patterns in your agency.
Example report: following page

Guide to Understanding Customer Reports - May 2012
15
3. Claims and total cost by mechanism of incident
*A Sample Agency
Period(s): [01/07/2009 - 30/06/2010]
representing accepted claims with a date of injury in period chosen Total Cost: as at date of case estimates, sum of costs til then and likely future cost.
Costs to date and Future Cost Estimate
NOTE: When comparing recent periods with previous years data it should be noted that the data on the current period is the least mature and may not give a definitive view of related performanc
Period Mechanism Injury Major
Group
Cost To
Date($)
Future Cost
Estimate($)
Avg. Cost
To Date($)
No.
Claims
Tot. Cost
($)
07/2009-06/2010 Falls, Trips and Slips 568386.94 1162089.00 18335.06 31 1661037.59
07/2009-06/2010 Hitting Objects with Body 11934.22 33499.00 2983.56 4 43323.38
07/2009-06/2010 Being Hit by Moving Objects 150788.53 454491.00 30157.71 5 586134.04
07/2009-06/2010 Sound and Pressure 53516.18 69909.00 10703.24 5 118059.12
07/2009-06/2010 Body Stressing 2385338.81 7419351.00 18208.69 131 9514779.49
07/2009-06/2010 Heat, Elec + Other Enviro Fact 0.00 0.00 0.00 0 0.00
07/2009-06/2010 Chemicals and Other Substances 46553.47 122584.00 23276.74 2 148671.07
07/2009-06/2010 Biological Factors 7086.05 5256.00 7086.05 1 12318.05
07/2009-06/2010 Mental Stress 921345.72 3000249.00 32905.20 28 3804535.42
07/2009-06/2010 Other and Unspecified 218011.82 926865.00 31144.55 7 1118820.72
07/2009-06/2010 Total 4362961.74 13194293.00 20387.67 214 17007678.88

Guide to Understanding Customer Reports - May 2012
16
4. Claims, cost and time lost by cost centre
Description: This report shows the claim frequency, total and average cost, total
incapacity weeks and average incapacity weeks for a given period, grouped by the cost
centre structure of your agency.
Access Level Required: Management level access
Export options: .pdf, .rtf
Benefits: This report can useful both, when utilising formal or notional devolution, or to
highlight injury and claim hotspots within your agency.
Parameters: This report represents accepted claims with a date of injury within the period
chosen.
Fields:
Field Description
Liable cost centre No. The unique number that identifies the liable cost centre within
each agency.
Liable cost centre The reporting group that has been allocated to the claim. Usually
this is the business area or region the employee worked in when
they were injured. Liable cost centres are supplied by the
customer and the level of detail is dependant on the customers
reporting needs.
No. Claims The number of claims that meet the criteria of the column.
Cost to date ($) The total of costs incurred on the claim as of yesterday.
Future cost estimate ($) The estimate of future costs on the claim as of the case estimate
date. The future cost estimate is determined by a complex
calculation that takes into account a wide array of factors.
Total Cost($) The sum of costs to date and the future cost estimate at the date
the estimate was calculated.
Average cost($) Total Cost divided by the number of claims.
Incapacity Weeks The total number of incapacity weeks accrued as of yesterday.
Avg. Incapacity weeks The total incapacity weeks accrued divided by the No. of claims.
Example Report:
4. Claims, cost and time lost by cost centre
A sample agency
Period(s): [01/01/2010 - 31/12/2010]
representing accepted claims with a date of injury in period chosen Total Cost: as at date of case estimates, sum of costs til then and likely
future cost.
Liable Cost Centre No.
Liable Cost Centre
No. Claims
Cost To Date($)
Future Cost Estimate($)
Total Cost($)
Average Cost($)
Incapacity Weeks
Avg. Incapacity Weeks
10 Cost Centre A 1 360.30 1332.00 1692.30 1692.30 0.00 0.00
12 Cost Centre B 1 663.30 0.00 0.00 0.00 0.00 0.00
18 Cost Centre E 1 0.00 0.00 0.00 0.00 0.00 0.00
Total 3 1023.60 1332.00 1692.30 1692.30 0.00 0.00

Guide to Understanding Customer Reports - May 2012
17
5. Number of injuries resulting in 5, 30 and 60 or more days of incapacity
Description: This report displays data on the number of claims to have their 5th, 30th and
60th day of incapacity determined in the chosen reporting period.
Access Level Required: Management level access
Export options: .pdf, .rtf
Benefits: This report allows users to see the volume of claims reaching their 5th, 30th, and
60th day of incapacity in any given month.
Parameters: This report counts claims which have had the 5th day of incapacity, the 30th
day of incapacity and the 60th day of incapacity determined within the reporting period,
irrespective of the date of injury, the date of receipt of the claim, initial determination date
or dates of incapacity.
Fields:
Field Description
Month/Year Separates the months within the financial year.
5th day of incap
determ
The number of claims that had their 5th day of incapacity
determined with in the reporting period.
30th day of incap
determ
The number of claims that had their 30th day of incapacity
determined with in the reporting period.
60th day of incap
determ
The number of claims that had their 60th day of incapacity
determined with in the reporting period.
Example Report:
5. Numbers of injuries resulting in 5, 30 and 60 or more days incapacity
*A sample agency
Period(s): [01/07/2010 - 30/06/2011]
Month/Year 5th day of incap determ 30th day of incap determ 60th day of incap determ
Jul-10 136 77 54
Aug-10 129 69 55
Sep-10 123 76 51
Oct-10 105 66 35
Nov-10 150 94 74
Dec-10 117 70 67
Jan-11 90 69 54
Feb-11 94 74 51
Mar-11 0 0 0
FIN YEAR 2010/2011 944 595 441

Guide to Understanding Customer Reports - May 2012
18
6. Number of injuries resulting in 5 days incapacity by mechanism of incident
Description: This report displays data on the number of claims to have their 5th day of
incapacity determined in the chosen reporting period, and is then broken down by
Mechanism of Incident.
This report is presented as a table, with data grouped by month.
Access Level Required: Management level access
Export options: .pdf and .rtf
Benefits: These measures provide a proxy of the numbers of work related injuries occurring
in the period and accumulating the 5th day's incapacity. This forms the base data for the P2
SRCC indicators and needs to be supplemented and calculated using the additional average
number of FTE employee data element available in house as:
Indicators displayed are:
Incidence of injuries resulting in 5 days incapacity (for each MOI) = (Number of
claims in which the 5th of incapacity was determined (for each MOI) divided by the average number of FTE employees who worked in the period) * 1000
Parameters: Number of claims in which the 5th of incapacity was determined in the period
resulting from the major Mechanism of Incident groups.
Fields:
Field Description
Month/Year The period other fields within report relate to.
Falls, Trips and slips The major group used in the Type of Occurrence Classification
System to differentiate how claimants have been injured.
Hitting objects with
body
The major group used in the Type of Occurrence Classification
System to differentiate how claimants have been injured.
Being hit by moving
objects
The major group used in the Type of Occurrence Classification
System to differentiate how claimants have been injured.
Sound and pressure The major group used in the Type of Occurrence Classification
System to differentiate how claimants have been injured.
Body Stressing The major group used in the Type of Occurrence Classification
System to differentiate how claimants have been injured.
Heat, Elec + other
enviro fact
The major group used in the Type of Occurrence Classification
System to differentiate how claimants have been injured.
Chemicals and other
substances
The major group used in the Type of Occurrence Classification
System to differentiate how claimants have been injured.
Biological factors The major group used in the Type of Occurrence Classification
System to differentiate how claimants have been injured.
Mental stress The major group used in the Type of Occurrence Classification
System to differentiate how claimants have been injured.
Other and unspecified The major group used in the Type of Occurrence Classification
System to differentiate how claimants have been injured.
Total The sum of previous fields on the report.

Guide to Understanding Customer Reports - May 2012
19
Example Report:
6. Numbers of injuries resulting in 5 days incapacity by mechanism of incident
*A Sample Agency
Period(s): [01/07/2010 - 30/06/2011]
Month/Year Falls, Trips and Slips
Hitting Objects with Body
Being Hit by Moving Objects
Sound and Pressure
Body Stressing
Heat, Elec + Other Enviro Fact
Chemicals and Other Substances
Biological Factors
Mental Stress
Other and Unspecified
Total
Jul-10 22 1 8 2 72 0 1 2 23 5 136
Aug-10 21 2 5 1 59 1 1 1 33 5 129
Sep-10 24 4 6 1 49 0 2 0 31 6 123
Oct-10 17 2 8 1 50 0 0 1 24 2 105
Nov-10 25 4 4 1 83 1 0 1 27 4 150
Dec-10 18 4 4 0 56 0 2 1 29 3 117
Jan-11 12 2 3 1 46 1 0 2 21 2 90
Feb-11 18 0 5 1 48 1 1 0 19 1 94
Mar-11 0 0 0 0 0 0 0 0 0 0 0
Total 157 19 43 8 463 4 7 8 207 28 944

Guide to Understanding Customer Reports - May 2012
20
7. Number of Death Claims
Description: This report provides the number of claims for death (death benefit or funeral
costs) accepted within the reporting period.
Access Level Required: Management level access
Export options: .pdf, .rtf
Benefits: This forms the base data for the SRCC P3 indicators and needs to be
supplemented and calculated using the additional data element available in house as:
Average number of FTE employees who worked in the period.
Parameters: Number of claims for death (death benefit or funeral costs) accepted within
the period.
Fields:
Field Description
Month/Year The period other fields within report relate to.
No of claims for death The total number of death claims accepted in the reporting
period.
Example Report:
7. Numbers of death claims
*A Sample Agency
Period(s): [01/07/2010 - 30/06/2011]
Month/Year No of claims for death
Jul-10 6
Aug-10 2
Sep-10 3
Oct-10 3
Nov-10 0
Dec-10 0
Jan-11 0
Feb-11 0
Mar-11 2
Apr-11 0
May-11 0
Jun-11 0
FIN YEAR 2010/2011 16

Guide to Understanding Customer Reports - May 2012
21
8. Frequency of lost time injuries
Description: This report displays the number of claims that had their first incapacity
determination in the chosen reporting period of at least one lost day or shift.
Access Level Required: Management level access
Export options: .pdf and .rtf
Benefits: This forms the base data for the SRCC P4 indicators and needs to be
supplemented and calculated using the additional data element available in house as:
Total number of hours worked in the period by all employees (derived from actual
hours worked or from hours paid less a notional estimate for leave hours as per AS.1885 and the ABS leave estimate)
Parameters: This report represents the number of lost time injuries which is measured by
the number of claims with the determination in the reporting period of at least one lost day
or shift.
Fields:
Field Description
Month/Year The period other fields within report relate to.
No. of lost time injuries Number of claims that have had the first determination of
incapacity of at least one day or shift.
Example Report:
8. Frequency of lost time claims
A Sample Agency
Period(s): [01/07/2010 - 30/06/2011] [01/07/2011 - 30/06/2012]
Month/Year No of lost time injuries
Jul-10 0
Aug-10 1
Sep-10 2
Oct-10 0
Nov-10 4
Dec-10 4
Jan-11 1
Feb-11 1
Mar-11 0
FIN YEAR 2010/2011 13

Guide to Understanding Customer Reports - May 2012
22
9. Percentage of claimants with >= 10 days incapacity determined with a Return to Work Plan
Description: This report highlights the number of claims with 10 or more incapacity days
and the percentage of those claims with a registered return to work plan (RTW) with
Comcare.
Access Level Required: Management level access
Export options: .pdf, .rtf
Benefits: The indicator below measures the number of claimants, having had 10 or more
days incapacity determined, who commenced a RTW plan determined in the period (or,
having had at any time prior to the end of the period a RTW plan determined, have the 10th
day of incapacity determined in the period) as a percentage of the number of claimants who had the 10th day of incapacity determined in the period.
percentage of claimants with >=10 days incap with a RTW Plan = (Number of
claimants who, having had 10 or more days incapacity determined prior to the
period, commenced a RTW plan that was determined in the period + Number of
claimants who, having the 10th day of incapacity determined in the period, also had
at any time prior to or within the period commenced a RTW plan divided by Number
of claimants who, in the period, reached the 10th day of incapacity * 100
Parameters: The number of claimants who, in the period, reached the 10th day of
incapacity. The number of claimants who, having had 10 or more days incapacity
determined prior to the period commenced a RTW plan that was determined in the period.
The number of claimants who, having the 10th day of incapacity determined in the period
also had at any time prior to or within the period commenced a RTW plan.
Fields:
Field Description
Month/Year The period other fields within report relate to.
Reaching 10
days incap
Number of claimants who, in the period, reached the 10th day of
incapacity
Start RTWP prior
10 days
Number of claimants who, having had 10 or more days incapacity
determined prior to the period, commenced a RTW plan that was
determined in the period
Reach 10 days
with a RTWP
Number of claimants who, having the 10th day of incapacity
determined in the period, also had at any time prior to or within the
period commenced a RTW plan
% starting a
RTWP
percentage of claimants with >=10 days incap with a RTW Plan =
(Number of claimants who, having had 10 or more days incapacity
determined prior to the period, commenced a RTW plan that was
determined in the period + Number of claimants who, having the 10th
day of incapacity determined in the period, also had at any time prior
to or within the period commenced a RTW plan divided by Number of
claimants who, in the period, reached the 10th day of incapacity * 100
Example Report: following page

Guide to Understanding Customer Reports - May 2012
23
9. Percentage of claimants with >= 10 days incapacity determined with a RTW plan
A Sample Agency
Period(s): [01/07/2010 - 30/06/2011]
Month/Year Reaching 10 days incap Start RTWP prior 10days
Reach 10 days with RTWP
% starting a RTWP
Jul-10 1 0 1 100%
Aug-10 1 0 1 100%
Sep-10 2 0 2 100%
Oct-10 0 0 0 0%
Nov-10 2 1 0 50%
Dec-10 2 0 0 0%
Jan-11 0 1 0 0%
Feb-11 1 0 0 0%
Mar-11 0 1 0 0%
FIN YEAR 2010/2011 9 3 4 78%

Guide to Understanding Customer Reports - May 2012
24
10. Quality of Return to Work Outcomes
Description: This report displays a summary of the outcomes of Return to Work Plans,
measuring the nature of the outcome of the return to work plan, at the closure of the case.
Access Level Required: Management level access
Export options: .csv, .pdf and .rtf
Benefits: This report allows the user to monitor the outcomes of return to work plans over
a three financial years.
Parameters: This report represents a tabulation of the number of return to work plans that
have ended in the month specified and their outcomes.
Fields:
Field Description
Month/Year The period other fields within report relate to.
Same Emp Same Job Number & percentage of claimants who returned to pre injury
employment with the same employer in the period
Same emp mod job Number & percentage of claimants who returned to a modified job
with the same employer in the period
New emp same job Number & percentage of claimants who changed employer but
kept same job in the period
New emp any job Number & percentage of claimants who changed employer and job
in the period
Total RTW achieved Number & percentage of claimants who returned to work in the
period
RTW not achieved Number & percentage of claimants who did not achieve RTW
outcomes in the period.
Total RTW Number of claimants who had a RTW ending in the period
Example Report:
10. Quality of RTW Outcome
A Sample Agency
Month/Year Same emp same job
% Same emp mod job
% New emp same job
% New emp any job
% Total RTW achieved
% RTW not achieved
% Total RTW

Guide to Understanding Customer Reports - May 2012
25
11. T1 Numbers of workplace injury and disease
Description: This report is based on the Comcare 2012 targets. It displays the number of
total claims with the 5th day of incapacity determined in each financial year against the
target of reducing the number of claims that reach the 5th day of incapacity by 40 percent
by 2012.
Access Level Required: Management level access. (Drill down functionality requires Case
Manager Detail Level Access).
Export options: .pdf, .rtf
Benefits: The purpose of this report is to measure the injury prevention performance of an
agency against the target indicator.
To calculate the incident rate use the formula:
Incidence rate = the number of claims in which the 5th day of incapacity was determined (in
a year) X 100 divided by the number of FTE employees (in that year).
Please note that the results provided for the current year are cumulative, and will increase
toward the final outcome over the course of the year.
Parameters: This report represents claims that have had their 5th day of incapacity
determined in each financial year. The target is calculated by averaging the agencies
performance in the first three years and then from that point setting the target at a 40%
reduction.
Fields:
Field Description
Month/Year The period other fields within report relate to.
No. Claims The number of claims that meet the criteria of the column.
Target Claims The goal number of claims to meet the Comcare 2012 targets. Report
31.T1 the target is a 40% reduction in claims over 10 years based on
the average number of claims in the 2001/2002, 2002/2003 financial
years.
Example Report: following page

Guide to Understanding Customer Reports - May 2012
26
11. T1 - numbers of workplace injury and disease
A Sample Agency
representing claims with a 5th day of incapacity determined in each financial year
T1 - numbers of workplace injury and disease
WARNING: The results provided for the current year are cumulative, and will increase toward the final outcome over the course of the year.
Month/Year No. Claims Target Claims
2001/02 143 130
2002/03 132 125
2003/04 141 120
2004/05 168 114
2005/06 182 109
2006/07 163 104
2007/08 108 99
2008/09 173 94
2009/10 148 88
2010/11 122 83
2011/12 0 78

Guide to Understanding Customer Reports - May 2012
27
12. T3 - weeks lost time
Description: It displays the total number of weeks of incapacity determined in each
financial year period, commencing 2001-2002 against the target of reducing the number of
weeks lost by 40 percent by 2012.
Access Level Required: Management level access (Drill down functionality requires Case
Manager Detail Level Access).
Export options: .pdf, .rtf
Benefits: When viewed online, this report allows the user to drill down into the details of a
claim affecting a column on the chart. The report itself allows agencies to track time lost
and assess performance against the target indicator.
Parameters: This report represents claims (commuting claims excluded) that have had
incapacity determined in each financial year. The target is calculated by averaging the first
3 years worth of performance and from that point setting the target at a 40% reduction.
Fields:
Field Description
Month/Year The period other fields within report relate to.
Total wks
incap
The total number of incapacity weeks determined in the period.
Target wks The goal number of incapacity weeks to meet the Comcare 2012 targets.
Report 32.T3 the target is a 40% reduction over 10 years. In report 33.T4
the target is to reach 2 weeks by 2012, some claims are excluded from this
calculation such as claims with over 1000 days difference between their S36
service date and date of injury.
Example Report: following page

Guide to Understanding Customer Reports - May 2012
28
12. T3 - weeks lost time
A Sample Agency
representing claims with incapacity determined in each financial year
T3 - weeks lost time
WARNING: The results provided for the current year are cumulative, and will increase toward the final outcome over the course of the year.
Month/Year Total Wks Incap Target Wks
2001/02 4.30 26.80
2002/03 30.78 25.72
2003/04 22.21 24.65
2004/05 31.05 23.58
2005/06 31.86 22.51
2006/07 24.84 21.44
2007/08 74.33 20.36
2008/09 29.55 19.29
2009/10 93.92 18.22
2010/11 122.36 17.15
2011/12 0.00 16.08

Guide to Understanding Customer Reports - May 2012
29
13. T4 - Average weeks for Return to Work activity to commence
Description: This report displays the average time taken (in calendar weeks) from date of
injury to the date the first rehabilitation assessment service is provided. It also shows how
performance needs to improve in order to reach the target of two weeks or less by 30 June
2012.
Access Level Required: Management level access (Drill down functionality requires Case
Manager Detail Level Access).
Export options: .pdf, .rtf
Benefits: This report measures early intervention performance for each financial year.
When viewed online, this report allows the user to drill down into the details of a claim
affecting a column on the chart. The report itself allows agencies to track time lost and
assess performance against the target indicator.
Parameters: This report displays the average amount of time between claims injury date
and its first rehabilitation service date in each financial year. The rehabilitation service date
is defined by the first s36 service date in our claims management database. The target is
set at 2 weeks for all agencies.
Fields:
Field Description
Month/Year The period other fields within report relate to.
Avg wks to RTW
activity
Claims that have had and we have recorded the first S36 service date
minus Date of Injury divided by total number of claims that have had
the first S36 service date in the financial year.
Target wks The goal number of incapacity weeks to meet the Comcare 2012
targets. Report 32.T3 the target is a 40% reduction over 10 years. In
report 33.T4 the target is to reach 2 weeks by 2012, some claims are
excluded from this calculation such as claims with over 1000 days
difference between their S36 service date and date of injury.
Example Report: following page

Guide to Understanding Customer Reports - May 2012
30
13. T4 - average weeks for RTW activity to commence
A Sample Agency
representing claims with the first rehabilitation service date in each financial year
T4 - average weeks for RTW activity to commence
Month/Year Avg Wks to RTW Activity Target Wks
2004/05 10.57 2.00
2001/02 0.00 2.00
2005/06 88.43 2.00
2007/08 27.21 2.00
2003/04 5.10 2.00
2008/09 6.00 2.00
2009/10 0.00 2.00
2006/07 3.00 2.00
2002/03 9.14 2.00
2010/11 46.00 2.00
2011/12 0.00 2.00

Guide to Understanding Customer Reports - May 2012
31
14. Occupation by mechanism of incident - Claims
Description: This report lists the number of claims with a date of injury in the specified
period, sorted by both occupation and mechanism of injury.
Access Level Required: Management level access
Export options: .pdf, .rtf
Benefits: This report enables senior mangers, middle managers, and health and safety
managers to monitor occupational trends in injury incidence. This assists in identifying
particular risk areas within the agency which require improved injury prevention and case
management strategies.
Parameters: This report represents accepted claims with a date of injury within the period
chosen.
Fields:
Field Description
Occupation The category of occupation the claimant works as.
Falls, Trips and slips The major group used in the Type of Occurrence
Classification System to differentiate how claimants have
been injured.
Hitting objects with body The major group used in the Type of Occurrence
Classification System to differentiate how claimants have
been injured.
Being hit by moving objects The major group used in the Type of Occurrence
Classification System to differentiate how claimants have
been injured.
Sound and pressure The major group used in the Type of Occurrence
Classification System to differentiate how claimants have
been injured.
Body Stressing The major group used in the Type of Occurrence
Classification System to differentiate how claimants have
been injured.
Heat, Elec + other enviro fact The major group used in the Type of Occurrence
Classification System to differentiate how claimants have
been injured.
Chemicals and other
substances
The major group used in the Type of Occurrence
Classification System to differentiate how claimants have
been injured.
Biological factors The major group used in the Type of Occurrence
Classification System to differentiate how claimants have
been injured.
Mental stress The major group used in the Type of Occurrence
Classification System to differentiate how claimants have
been injured.
Other and unspecified The major group used in the Type of Occurrence
Classification System to differentiate how claimants have
been injured.
Total The sum of previous fields on the report.
Example Report: following page

Guide to Understanding Customer Reports - May 2012
32
14. Occupation by mechanism of incident - claims
A Sample Agency
Period(s): [01/01/2010 - 31/12/2010]
representing accepted claims with a date of injury in period chosen
Total Claim Numbers by Occupation
Occupation Falls, Trips and
Slips
Hitting Objects
with Body
Being Hit by
Moving Objects
Sound and
Pressure
Body Stressing
Heat, Elec + Other Envir
o Fact
Chemicals and Other
Substances
Biological Factors
Mental Stress
Other and Unspecified
Total
Managers & Administrators
35 6 10 0 67 1 3 0 17 5 144
Professionals 37 8 10 2 122 4 7 2 31 10 233
Adv Clerical & Service
241 52 74 22 761 10 9 6 155 32 1362
Int Clerical, Sales & Service
0 2 0 0 7 0 0 0 2 1 12
Elem Clerical, Sales & Service
7 5 6 1 25 1 1 0 2 0 48
Total 320 73 100 25 982 16 20 8 207 48 1799

Guide to Understanding Customer Reports - May 2012
33
15. Occupation by mechanism of incident - total cost
Description: This report lists the total cost (cost to date plus outstanding liability) of
claims with a date of injury in the specified period sorted by both occupation and
mechanism of injury.
Access Level Required: Management level access
Export options: .pdf, .rtf
Benefits: This report enables managers to obtain a breakdown of total cost by occupation
and Mechanism of Incident group. It can provide early identification of occupational groups
which may require preventative education programs.
Parameters: This report represents accepted claims with a date of injury within the period
chosen.
Fields:
Field Description
Occupation The category of occupation the claimant works as.
Falls, Trips and slips The major group used in the Type of Occurrence Classification
System to differentiate how claimants have been injured.
Hitting objects with
body
The major group used in the Type of Occurrence Classification
System to differentiate how claimants have been injured.
Being hit by moving
objects
The major group used in the Type of Occurrence Classification
System to differentiate how claimants have been injured.
Sound and pressure The major group used in the Type of Occurrence Classification
System to differentiate how claimants have been injured.
Body Stressing The major group used in the Type of Occurrence Classification
System to differentiate how claimants have been injured.
Heat, Elec + other
enviro fact
The major group used in the Type of Occurrence Classification
System to differentiate how claimants have been injured.
Chemicals and other
substances
The major group used in the Type of Occurrence Classification
System to differentiate how claimants have been injured.
Biological factors The major group used in the Type of Occurrence Classification
System to differentiate how claimants have been injured.
Mental stress The major group used in the Type of Occurrence Classification
System to differentiate how claimants have been injured.
Other and unspecified The major group used in the Type of Occurrence Classification
System to differentiate how claimants have been injured.
Total The sum of previous fields on the report.
Example Report: following page

Guide to Understanding Customer Reports - May 2012
34
15. Occupation by mechanism of incident - total cost
A Sample Agency
Period(s): [01/01/2010 - 31/12/2010]
representing accepted claims with a date of injury in period chosen Total Cost: as at date of case estimates, sum of costs til then and likely
future cost.
Total Cost by Occupation
Occupation Falls, Trips and
Slips
Hitting Objects
with Body
Being Hit by Moving
Objects
Sound and
Pressure
Body Stressing
Heat, Elec + Other Enviro Fact
Chemicals and Other
Substances
Biological Factors
Mental Stress
Other and Unspecified
Total
Managers & Administrators
62965 642 61 0 472437 0 0 0 79630 22437 638172
Professionals 3172286 34702 1062935 28258 5314986 0 648715 0 1949851 265080 12476814
Adv Clerical & Service
1065340 191137 315353 0 2583834 66348 6884 23413 1534295 51519 5838123
Int Clerical, Sales & Service
0 0 0 0 0 0 0 0 0 0 0
Elem Clerical, Sales & Service
160344 8145 30028 0 512372 0 0 0 0 4422 715311
Total 4460935 234626 1408377 28258 8883629 66348 655599 23413 3563776 343458 19668420

Guide to Understanding Customer Reports - May 2012
35
16. Age group by mechanism of incident - claims
Description: This report lists the number of claims with a date of injury in the specified
period sorted by both age profile and mechanism of injury.
Access Level Required: Management level access
Export options: .pdf, .rtf
Benefits: This report enables managers to identify any age related trends in injury
incidence for particular Mechanism of Incident groups. This can assist in development of
effective injury prevention and case management strategies.
Parameters: This report represents accepted claims with a date of injury within the period
chosen.
Fields:
Field Description
Age Group The age group of the claimant at time of injury
Falls, Trips and slips The major group used in the Type of Occurrence
Classification System to differentiate how claimants have
been injured.
Hitting objects with body The major group used in the Type of Occurrence
Classification System to differentiate how claimants have
been injured.
Being hit by moving objects The major group used in the Type of Occurrence
Classification System to differentiate how claimants have
been injured.
Sound and pressure The major group used in the Type of Occurrence
Classification System to differentiate how claimants have
been injured.
Body Stressing The major group used in the Type of Occurrence
Classification System to differentiate how claimants have
been injured.
Heat, Elec + other enviro fact The major group used in the Type of Occurrence
Classification System to differentiate how claimants have
been injured.
Chemicals and other
substances
The major group used in the Type of Occurrence
Classification System to differentiate how claimants have
been injured.
Biological factors The major group used in the Type of Occurrence
Classification System to differentiate how claimants have
been injured.
Mental stress The major group used in the Type of Occurrence
Classification System to differentiate how claimants have
been injured.
Other and unspecified The major group used in the Type of Occurrence
Classification System to differentiate how claimants have
been injured.
Total The sum of previous fields on the report.
Example Report: following page

Guide to Understanding Customer Reports - May 2012
36
16. Age group by mechanism of incident - claims
A Sample Agency
Period(s): [01/07/2010 - 30/06/2011]
representing accepted claims with a date of injury in period chosen
Total Claim Numbers by Age Group
Age Group
Falls, Trips and
Slips
Hitting Objects
with Body
Being Hit by
Moving Objects
Sound and
Pressure
Body Stressing
Heat, Elec + Other Enviro Fact
Chemicals and Other
Substances
Biological Factors
Mental Stress
Other and Unspecified
Total
< 25 2 1 5 0 1 0 0 0 0 0 9
25 - 35
11 4 4 0 15 1 1 0 0 1 37
35 - 45
16 7 11 0 36 1 2 1 7 3 84
45 - 55
23 7 16 0 41 0 1 0 11 3 102
55 - 65
16 4 6 0 19 2 0 1 6 1 55
> 65 3 1 0 0 0 0 0 0 0 1 5
Total 71 24 42 0 112 4 4 2 24 9 292

Guide to Understanding Customer Reports - May 2012
37
17. Age group by mechanism of incident - total cost
Description: This report lists the total cost (cost to date plus outstanding liability) of
claims with a date of injury in the specified period sorted by both age profile and
mechanism of injury group.
Access Level Required: Management level access
Export options: .pdf and .rtf
Benefits: This report enables managers to obtain a breakdown of total cost by age and
mechanism of incident group. It can be used to identify employee4s who may be at risk of
injury and assist in developing specific injury prevention programs and case management
strategies.
Parameters: This report represents accepted claims with a date of injury within the period
chosen.
Fields:
Field Description
Age Group The age group of the claimant at time of injury
Falls, Trips and slips The major group used in the Type of Occurrence
Classification System to differentiate how claimants have
been injured.
Hitting objects with body The major group used in the Type of Occurrence
Classification System to differentiate how claimants have
been injured.
Being hit by moving objects The major group used in the Type of Occurrence
Classification System to differentiate how claimants have
been injured.
Sound and pressure The major group used in the Type of Occurrence
Classification System to differentiate how claimants have
been injured.
Body Stressing The major group used in the Type of Occurrence
Classification System to differentiate how claimants have
been injured.
Heat, Elec + other enviro fact The major group used in the Type of Occurrence
Classification System to differentiate how claimants have
been injured.
Chemicals and other
substances
The major group used in the Type of Occurrence
Classification System to differentiate how claimants have
been injured.
Biological factors The major group used in the Type of Occurrence
Classification System to differentiate how claimants have
been injured.
Mental stress The major group used in the Type of Occurrence
Classification System to differentiate how claimants have
been injured.
Other and unspecified The major group used in the Type of Occurrence
Classification System to differentiate how claimants have
been injured.
Total The sum of previous fields on the report.
Example report: following page

Guide to Understanding Customer Reports - May 2012
38
17. Age group by mechanism of incident - total cost
A Sample Agency
Period(s): [01/10/2010 - 31/03/2011]
representing accepted claims with a date of injury in period chosen Total Cost: as at date of case estimates, sum of costs til then and likely
future cost.
Total Cost by Age Group
Age Group
Falls, Trips and
Slips
Hitting Objects
with Body
Being Hit by
Moving Objects
Sound and
Pressure
Body Stressing
Heat, Elec + Other Enviro Fact
Chemicals and Other
Substances
Biological Factors
Mental Stress
Other and Unspecified
Total
< 25 48111 107110 2396 0 6470 0 0 0 0 0 164087
25 - 35
248207 3942 0 0 160132 13969 0 0 0 11953 438203
35 - 45
427473 53456 27232 0 406430 0 0 23413 0 0 938003
45 - 55
193286 0 416010 0 521793 0 0 0 19605 8701 1159395
55 - 65
297273 0 18410 0 165638 8517 0 0 0 0 489839
> 65 0 642 0 0 0 0 0 0 0 470 1112
Total 1214350 165150 464048 0 1260464 22486 0 23413 19605 21124 3190640

Guide to Understanding Customer Reports - May 2012
39
18. Duty status by mechanism of incident - claims
Description: This report lists the number of claims with a date of injury in the specified
period, sorted by both duty status and mechanism of injury group.
Access Level Required: Management level access
Export options: .pdf and .rtf
Benefits: Enables managers to identify the injury profile of their agency. it can alert
management to the most high-risk activities and identify the need for organisational policy
and guidelines to assist in effective injury prevention.
Parameters: This report represents accepted claims with a date of injury within the period
chosen.
Fields:
Field Description
Duty status The task the claimant was performing when injured.
Falls, Trips and slips The major group used in the Type of Occurrence
Classification System to differentiate how claimants have
been injured.
Hitting objects with body The major group used in the Type of Occurrence
Classification System to differentiate how claimants have
been injured.
Being hit by moving objects The major group used in the Type of Occurrence
Classification System to differentiate how claimants have
been injured.
Sound and pressure The major group used in the Type of Occurrence
Classification System to differentiate how claimants have
been injured.
Body Stressing The major group used in the Type of Occurrence
Classification System to differentiate how claimants have
been injured.
Heat, Elec + other enviro fact The major group used in the Type of Occurrence
Classification System to differentiate how claimants have
been injured.
Chemicals and other
substances
The major group used in the Type of Occurrence
Classification System to differentiate how claimants have
been injured.
Biological factors The major group used in the Type of Occurrence
Classification System to differentiate how claimants have
been injured.
Mental stress The major group used in the Type of Occurrence
Classification System to differentiate how claimants have
been injured.
Other and unspecified The major group used in the Type of Occurrence
Classification System to differentiate how claimants have
been injured.
Total The sum of previous fields on the report.
Example report: following page

Guide to Understanding Customer Reports - May 2012
40
18. Duty status by mechanism of incident - claims
A Sample Agency
Period(s): [01/01/2010 - 31/12/2010]
representing accepted claims with a date of injury in period chosen
Total Claim Numbers by Duty Status
Duty Status
Falls, Trips and
Slips
Hitting Objects
with Body
Being Hit by Moving
Objects
Sound and
Pressure
Body Stressing
Heat, Elec + Other Enviro Fact
Chemicals and Other
Substances
Biological Factors
Mental Stress
Other and Unspecified
Total
While working 95 27 67 3 178 3 10 2 52 11 448
MTA while working
1 0 0 0 0 0 0 0 0 12 13
Working elsewhere
16 1 3 1 10 1 1 0 0 2 35
While on break 0 0 0 0 0 1 0 0 0 0 1
Travelling to/from work
0 0 0 0 0 0 0 0 0 1 1
Approved study 0 1 0 0 0 0 0 0 0 0 1
Authorised sport
0 0 0 0 1 0 0 0 0 0 1
Other 4 1 4 0 7 0 1 0 1 0 18
Home based work
0 0 0 0 1 0 0 0 0 0 1
All diseases 0 0 0 0 0 0 0 0 0 0 0
Total 116 30 74 4 197 5 12 2 53 26 519

Guide to Understanding Customer Reports - May 2012
41
19. Duty status by mechanism of incident - total cost
Description: This report lists the total cost (cost to date plus outstanding liability) of
claims with a date of injury in the specified period sorted by both duty status and
mechanism of injury group.
Access Level Required: Management level access
Export options: .pdf and .rtf
Benefits: This report can be used in conjunction with report 18 to identify the total cost
estimates by duty status for a Mechanism of Incident group. By comparison with the actual
incidences in these categories in Report 18, it is possible to identify the cost drivers and
therefore focus prevention and case management strategies more effectively.
Parameters: This report represents accepted claims with a date of injury in period chosen.
The total cost is as at date of Case Estimates, sum of costs until then and likely future costs.
Fields:
Field Description
Duty status The task the claimant was performing when injured.
Falls, Trips and slips The major group used in the Type of Occurrence
Classification System to differentiate how claimants have
been injured.
Hitting objects with body The major group used in the Type of Occurrence
Classification System to differentiate how claimants have
been injured.
Being hit by moving objects The major group used in the Type of Occurrence
Classification System to differentiate how claimants have
been injured.
Sound and pressure The major group used in the Type of Occurrence
Classification System to differentiate how claimants have
been injured.
Body Stressing The major group used in the Type of Occurrence
Classification System to differentiate how claimants have
been injured.
Heat, Elec + other enviro fact The major group used in the Type of Occurrence
Classification System to differentiate how claimants have
been injured.
Chemicals and other
substances
The major group used in the Type of Occurrence
Classification System to differentiate how claimants have
been injured.
Biological factors The major group used in the Type of Occurrence
Classification System to differentiate how claimants have
been injured.
Mental stress The major group used in the Type of Occurrence
Classification System to differentiate how claimants have
been injured.
Other and unspecified The major group used in the Type of Occurrence
Classification System to differentiate how claimants have
been injured.
Total The sum of previous fields on the report.
Example Report: following page

Guide to Understanding Customer Reports - May 2012
42
19. Duty status by mechanism of incident - total cost
A Sample Agency
Period(s): [01/01/2010 - 31/12/2010]
representing accepted claims with a date of injury in period chosen Total Cost: as at date of case estimates, sum of costs til then and likely
future cost.
Total Cost by Duty Status
Duty Status Falls, Trips and Slips
Hitting Objects
with Body
Being Hit by
Moving Objects
Sound and
Pressure
Body Stressing
Heat, Elec + Other Enviro Fact
Chemicals and Other Substanc
es
Biological
Factors
Mental Stress
Other and Unspecifie
d
Total
While working
15772859 2157479 3758534 547896 46262996 278360 294697 250419 27100365 2867891 99291497
MTA while working
2206 0 6321 0 143845 0 0 0 18624 380971 551966
Working elsewhere
3257932 776973 292603 11286 3344615 6832 40945 153928 140970 26307 8052390
While on break
202288 12999 402433 0 1220 0 0 11149 0 13983 644072
Travelling to/from work
305822 0 0 0 187802 0 0 0 0 32270 525894
Approved study
226687 1668 207758 0 305712 0 0 0 722994 9661 1474479
Total 21548044 2983594 4821964 564971 53610913 289460 335641 415496 28991027 4548770 118109880

Guide to Understanding Customer Reports - May 2012
43
20. Claims and total cost by age group
Description: This report displays a graph showing the number of claims and the
associated total costs by age groupings.
Access Level Required: Management level access
Export options: .pdf and .rtf
Benefits: This report can be of benefit when assessing the highest risk age group in your
agency, bearing in mind the age spread of agency population.
Parameters: This report represents accepted claims with a date of injury in the period
chosen.
Fields:
Field Description
Period This field displays the date range the report was generated for.
Age Group The age group of the claimant at time of injury
Cost to Date ($) The total of costs incurred on the claim as of yesterday.
Future Cost Estimate
($)
The estimate of future costs on the claim as of the case
estimate date. The future cost estimate is determined by a
complex calculation that takes into account a wide array of
factors.
Avg. Cost to Date ($) The cost to date of all claims within the given period divided by
the number of claims meeting the given caveat within the same
period.
No. Claims The number of claims that meet the criteria of the column.
Example Report: following page

Guide to Understanding Customer Reports - May 2012
44
20. Claims and total cost by age group
A Sample Agency
Period(s): [01/01/2010 - 31/12/2010] [01/01/2011 - 31/12/2011]
representing accepted claims with a date of injury in period chosen
Claims and total cost by age group
NOTE: When comparing recent periods with previous years data it should be noted that the data on the current period is the least mature and may not give a definitive view of related performance
Period Age Group Cost To Date($) Future Cost Estimate($) Avg. Cost To Date($) No. Claims
01/2010-12/2010 < 25 168202.35 759848.00 3364.05 50
01/2010-12/2010 25 - 35 3024071.13 18520987.00 8217.58 368
01/2010-12/2010 35 - 45 5094606.70 26566723.00 8937.91 570
01/2010-12/2010 45 - 55 8482613.79 41907361.00 10062.41 843
01/2010-12/2010 55 - 65 3968355.74 14331069.00 8721.66 455
01/2010-12/2010 > 65 1052054.85 488499.00 30942.79 34
01/2010-12/2010 Total 21789904.56 102574487.00 9392.20 2320

Guide to Understanding Customer Reports - May 2012
45
21. Mechanism of injury by costs, incapacity and claims
Description: This report provides Mechanism of Injury information on accepted claims with
a date of injury in the chose period, by Costs, Incapacity and number of claims. Graphs and
charts are provided for each.
Access Level Required: Management level access
Export options: .pdf and .rtf
Benefits: This can be used as a quick summary of the average cost, number of claims, and
incapacity data of each major category or Mechanism of Incident. This information can be
useful to identify priority areas for injury prevention and case management strategies. It
can also be utilised to monitor performance trends over time.
Parameters: This report represents accepted claims with a date of injury in period chosen.
Total Cost: as at date of case estimates, sum of costs til then and likely future cost. This
report can be run for up to 4 periods.
Available charts: When run for a single period, this report provides eight (8) different
graphs and charts, however when run for more than a single period, the pie charts are not
available due to the complexity of the data.
Fields:
Field Description
Period This field displays the date range the report was generated for.
Mechanism Injury Major
Group
Refers to the classification groups within the Type of
occurrence classification system.
Tot. Cost ($) The sum of the cost to date and future cost estimate on the
most recent estimate date
Avg. Tot. Cost ($) The sum of the cost to date and future cost estimate on the
most recent estimate date divided by the number of accepted
claims in the period.
Cost to Date ($) The total of costs incurred on the claim as of yesterday.
Weeks Lost Total number of weeks lost for accepted claims in the period
Avg. Weeks Lost Total number of weeks lost divided by the total number of
accepted claims in the period
No. Accepted Claims The total number of accepted claims in the period.
Example Report: following page

Guide to Understanding Customer Reports - May 2012
46
21. Mechanism of Injury by Costs, Incapacity and Claims
A Sample Agency
Period(s): [01/01/2010 - 31/12/2010]
representing accepted claims with a date of injury in period chosen Total Cost: as at date of case estimates, sum of costs til then and likely
future cost.

Guide to Understanding Customer Reports - May 2012
47
Period Mechanism Injury Major
Group Tot. Cost($) Avg. Tot. Cost($)
Cost to Date($)
Weeks Lost
Avg. Weeks Lost
No. Accepted
Claims
01/2010-12/2010
Falls, Trips and Slips 21548043.89 51304.87 4105488.59 1801.08 4.29 420
01/2010-12/2010
Hitting Objects with Body 2983593.74 27625.87 519216.38 264.53 2.45 108
01/2010-12/2010
Being Hit by Moving Objects
4821964.12 29950.09 866967.40 335.72 2.09 161
01/2010-12/2010
Sound and Pressure 564970.71 16142.02 188187.45 22.65 0.65 35
01/2010-12/2010
Body Stressing 53610913.34 44124.21 9602286.01 3903.33 3.21 1215
01/2010-12/2010
Heat, Elec + Other Enviro Fact
289459.81 12585.21 35677.81 20.51 0.89 23
01/2010-12/2010
Chemicals and Other Substances
335641.37 10488.79 696799.97 18.81 0.59 32
01/2010-12/2010
Biological Factors 415495.61 27699.71 62930.36 66.83 4.46 15
01/2010-12/2010
Mental Stress 28991027.47 126598.37 4571291.12 2580.11 11.27 229
01/2010-12/2010
Other and Unspecified 4548770.28 55472.81 1141059.47 391.67 4.78 82
01/2010-12/2010
Total 118109880.34 50909.43 21789904.56 9405.24 4.05 2320

Guide to Understanding Customer Reports - May 2012
48
22. Cost centre structure report
Description: This report provides details on the Agency’s cost centre structure and
associated contacts reflected on Comcare’s database system.
Access Level Required: Management level access
Export options: .pdf and .rtf
Benefits: This report will assist customers in identifying cost centres for allocation to
claims and subsequent targeted reporting. It will also assist in maintaining current contact
details.
Parameters: Represents all active cost centres and their relationships.
Fields:
Field Description
Level No. This number denotes which level in the hierarchy the cost centre sits. If you think of the hierarchy like an organisational chart, the cost centres
that have a level number of 1 would be the top level of the structure and then subsequently the cost centres with number 2 would be below.
Parent CC No. This denotes the relationships between the cost centres. The parent cost centre number listed identifies which cost centre is above this one in the structure.
CC No. This is the unique identifier of the cost centre.
CC name 1 The name of the cost centre. Only cost centres that are level 1 cost
centres have their name in this field.
CC name 2 The name of the cost centre. Only cost centres that are level 2 cost
centres have their name in this field.
CC name 3 The name of the cost centre. Only cost centres that are level 3 cost centres have their name in this field.
CC name 4 The name of the cost centre. Only cost centres that are level 4 cost centres have their name in this field.
CC name 5+ The name of the cost centre. Only cost centres that are level 5 cost centres have their name in this field.
CC Short Name The abbreviated name for the cost centre
Cust. Ref The reference supplied by the customer for the individual cost centre
Liable Ind. Can only be 2 values ‘Y’ = the cost centre can be registered as the liable
cost centre on a claim. ‘N’ = The cost centre cannot be used as a liable cost centre.
Payroll Ind. Can only be 2 values ‘Y’ = the cost centre can be registered as the payroll
cost centre on a claim. ‘N’ = The cost centre cannot be used as a payroll cost centre. The payroll cost centre receives various reports on incapacity determinations.
Chq Rec. Ind Can only be 2 values ‘Y’ = the cost centre can be registered as the cheque receiving cost centre on a claim. ‘N’ = The cost centre cannot be used as a cheque receiving cost centre. The cheque receiving cost centre receives
cheques and remittance advice.
Title The title of the contact on the cost centre.
Given Name The given name of the contact on the cost centre.
Surname The surname of the contact on the cost centre.
Phone The phone number of the contact on the cost centre.
Mail address The mail address of the contact on the cost centre.
Example Report: following page

Guide to Understanding Customer Reports - May 2012
49
22. Cost Centre Structure
A Sample Agency
This report may best be printed in landscape orientation
Level no
Parent CC no
CC no
CC name 1
CC name 2
CC name 3
CC name 4
CC name 5+
CC short name
Cust ref.
Liable ind
Payroll ind
Chq rec. ind
Title Given name
Surname Phone Mail address
23. Case Manager Details by Customer report
Description: Provides details of all case managers Comcare has listed against a particular
agency.
Access Level Required: Management level access
Export options: .pdf and .rtf
Benefits: This report assists the agency in managing their Comcare Case Managers, and
maintaining currency of their contact details. This is also utilised for Case Manager Audits.
Parameters: This report represents all active case managers for the agency.
Fields:
Field Description
Customer The agency that the case manager represents.
Case Manager No. The unique identifier of the case manager’s profile within
Comcare’s database.
Title The title of the contact on the case manager.
Given Name The given name of the contact on the case manager.
Surname The surname of the contact on the case manager.
Tel. No. The phone number of the contact on the case manager.
Fax. No. The fax number of the contact on the case manager.
Address The mail address of the contact on the case manager.
Example Report:
23. Case manager details by customer
A Sample Agency
Customer Case Mgr No
Title Given name Surname Tel No Fax No Address

Guide to Understanding Customer Reports - May 2012
50
24. CIS user access list
Description: Provides details of all CIS users within an agency.
Access Level Required: CIS administrator level access
Export options: .pdf and .rtf
Benefits: This report assists the agency in managing who has access to the data in CIS.
Parameters: This report represents all active CIS users for the agency.
Fields:
Field Description
Userid The username the user uses to log into CIS. Will always be an email
address.
Surname The surname of the user.
Given Name The given name of the user.
Management Denotes whether the user has access to the reports under the
'management' category in CIS
Case
Management
Denotes whether the user has access to the reports under the 'case
management' category in CIS
Admin Denotes whether the user is authorised to grant other users access and
whether the user can amend other users cost centre restrictions.
Finance Denotes whether the user has access to the reports under the 'finance'
category in CIS

Guide to Understanding Customer Reports - May 2012
51
Section 2 - Case Management Reports
Designed to support an Agency’s Case Management team, this suite of reports provides
more detailed claims information to assist an agency with the ongoing management of their
workers compensation claims. This also allows for enhanced management of claims with
extended periods of incapacity, and those with Return to Work activity (as recorded in
Comcare’s central database).
A number of the reports in this section are larger customer data reports, which can be
generated in .csv (spreadsheet) format, to allow an agency to perform detailed claims
analysis.
Report Content
All reports provide a number of content and presentation options. For example, reports can
usually provide data by:
All (whole of agency)
Cost Centre
Cost Centre View (grouping of cost centres created by Comcare on request)
Reporting Periods
There are a number of reporting period options available for selection:
Financial year
Calender year
Other, as required
The number of periods available for selection varies between each report - some reports will
allow a comparison of 4 periods on the one report, others 1 or 2.
Data currency
The claims information within the Management Reports is updated on a daily basis, with
data as at close of business. This means that on any day, CIS will be reporting with data as
at close of business on the day immediately prior. Information about total costs, including
likely future costs, is updated on a monthly basis.
All reports are available through the Comcare Customer Information System via the
Comcare Website, or can be produced on request as required.
Important notes:
Reports 50, 51, and 52 are of particular relevance for an Agency when monitoring
claims which may have an impact on the Agency’s premium.
Reporting on Reconsideration and Appeal cases is now available
The number of Customer Data Reports has been increased, including the addition of
report 32 - Customisable Data Report. Based on report 66, this will provide an
Agency with greater flexibility in reporting.

Guide to Understanding Customer Reports - May 2012
52
66. Customer Data Report - Claim Detail
Description: This report provides a complete record of all claims for your agency.
Access Level Required: Case Management Detail level access
Export options: .csv
Benefits: Enables you to run your own analysis and reporting to produce tailored reports
to meet your own requirements.
Parameters: This report displays claims related data for all claims that the agency is liable
for.
Fields:
Field Name Description
Surname Employee's surname.
Given Names Employee's first name/s.
Empl No A unique eight digit claim identification number allocated by
Comcare. for each claimant.
Suffix A two digit number identifying the claim sequence number i.e. if the claimant has had two previous claims then these last two digits of the claim number for their third claim would be 03.
Date Resignation/ Termination
Date of effect if employee is no longer a Commonwealth employee
Date of Birth Employee's date of birth.
Gender Employee's gender.
Post code The post code relevant to the claimant’s address.
Date of Injury The date of injury i.e. the specific day on which the claimed injury occurred or a disease was first medically diagnosed.
Comcare Receipt Date The date the claim was received by Comcare.
Liability Status
The current liability status for the injury or disease. This can change throughout the life of the claim - only the current value is
listed
Note Premium calculation includes claims with a Liability Status of
'A' at the time of the data extraction for Likely Future Costs.
The valid values for this field are:
(A)ccepted Liability has been accepted for this claim, e.g. medical claims etc. can be paid.
(D)eleted Claim has been deleted.
(N)on-Compliance Does not meet the requirements of the legislation, e.g. medical certificate missing,
inadequate etc. Claims are received by Comcare (Date of Receipt), then when all legislative requirements for the claim are met the Date of Compliance is set. For most claims, Date of Compliance equals Date of Receipt.
(R)ejected The claim is not accepted as a liability for
Comcare, i.e. injury is not covered by the workers compensation Act.
(U)ndetermined Liability for a claim is yet to be determined by Comcare.
(W)ithdrawn The claimant has withdrawn the claim.
Decision Date Date of most recent liability decision made by Comcare
Claim Status The Open/Closed/Reopened status of the claim.
Status Date The date when the Claim Status field was last changed.
Liable Cust & Liable Cost Ctr Customer and cost centre liable for the injury. Usually the current
employer as at the 'Date of Injury'

Guide to Understanding Customer Reports - May 2012
53
Field Name Description
Payroll Cust & Payroll Cost Ctr This is the Comcare code for the current employer. This may or
may not be the same as the code for the liable employer.
Case Manager Agency contact responsible for rehab on claim
Claim Manager Comcare contact responsible for the management of the claim
First Rehab assessment Date of first Rehab assessment
Month 5th day incap detd Month in which the 5th day of incapacity was determined
Claim Lodged with Employer Date the claim was lodged with the liable employer
Employee sign date Date the employee signed the claim form
Agree with claim Does the employer agree with the claim
Body Location (code & description)
The Body Location Of Injury/Disease classification is intended to identify the part of the body affected by the most serious injury or disease. These codes are based on the Type of Occurrence Classification System (TOOCS).
Nature of Injury (code & description)
The Nature of Injury classification is intended to identify the most serious injury or disease sustained or suffered by the worker.
These codes are based on the TOOCS
Occupation (code & description)
The Occupation classification is intended to identify the occupation of the claimant at the time of the injury. These codes are based on the TOOCS. The codes reported in the CDS are the first two digits
of the six digit TOOCS code recorded by Comcare.
Agency of Accident The Agency of Accident classification is intended to identify the object, substance, or
(code & description) Circumstance that was principally involved in, or most closely
associated with, the point at which things started to go wrong and which ultimately led to the most serious injury or disease. These codes are based on the TOOCS
Mechanism of Incident (code & description)
The Mechanism of Incident classification is intended to identify the action, exposure, or event, which was the direct cause of the most serious injury or disease. These codes are based on the TOOCS
Duty Status The location of the employee in relation to their employment at the
time of injury. Length: 1 character. The valid values for this field are:
A - working at usual workplace;
B - traffic accident whilst working;
C - while working elsewhere;
D - while having a break;
E - while travelling to or from work;
F - while attending approved course of study;
G - during an authorised sporting activity;
H - other;
X - all diseases.
Claim Cust Reference The employer's reference number for this claim.
Payroll code The employer’s internal payroll code for this claim
Total Weeks Incap Paid This is the total incapacity recorded against the claim. This field is
the sum of all periods of incapacity to date. The calculation is
based on standard hours worked and is expressed in decimal weeks.
NWE Normal Weekly Earnings of employee
Total Incap Total Incapacity Cost. This is the total cost of Incapacity payments
received from Comcare from 1/12/88 to date.
Total Medical Total Medical Cost. This is the total cost of Medical payments from 1/12/88 to date.
Total Other This is the total of all payments not specified elsewhere from
1/12/88 to date. This amount includes AAT & legal costs.

Guide to Understanding Customer Reports - May 2012
54
Field Name Description
Total Travel Total Travel Cost. This is the total cost of Travel payments from
1/12/88 to date.
Total Rehab Total Rehab Cost. This is the total cost of Rehabilitation payments from 1/12/88 to date excluding any GST amount claimable by Comcare as an Input Tax Credit.
Costs to Date Total Cost. of claim to date. This is the sum of Total Incap, Total Medical, Total Subseq, Total Travel and Total Rehab excluding any GST amount claimable by Comcare as an Input Tax Credit.
Likely Future Costs Actuarial assessment of the possible future costs of the claim for the life of that claim.
AGS No Employee’s AGS number
30. Customer Data Report - claims by cost centre and case manager
Description: This report lists claim detail for all claims attached to a specified case
manager, cost centre or customer structure (Cost Centre grouping).
Access Level Required: Case Management Detail level access
Export options: .csv
Benefits: Containing the same data fields as report 66, this report is a valuable tool for
Case Mangers to review claims assigned to them, without having to export the entire
Customer Data Report. This is of particular benefit for larger agencies for whom the size of
report 66 can be prohibitive.
Parameters: This report displays claims related data for claims that the agency is liable for
and groups these claims by cost centre and case manager.
Fields: See above – Report 66. Customer Data Report – Claim Detail.
31. Customer Data Report - Open Claims
Description: This report lists claim detail for all Open claims (with a status of O - Open
and R - Reopened) for the selected agency.
Access Level Required: Case Management Detail level access
Export options: .csv
Benefits: Containing the same data fields as report 66, this report displays only those
claims with an Open or Reopened status, without having to export the entire Customer Data
Report. This is of particular benefit for larger agencies for which the size of report 66 can
be prohibitive.
Parameters: This report displays claims related data for open claims that the agency is
liable for.
Fields: See above – Report 66. Customer Data Report – Claim Detail.

Guide to Understanding Customer Reports - May 2012
55
32. Customisable Customer Data Report
Description: This report is a customisable version of Report 66, allowing you to select the
fields that you wish to display for all claims for your agency.
Access Level Required: Case Management Detail level access
Export options: .csv
Benefits: Report 66 is one of the most used reports within CIS, although its size can be
prohibitive for larger agencies.
This customisable version of the report allows you to select the columns that you want to
display in the final report, with Employee Number, Given Names, Suffix and Surname being
the only mandatory columns.
You can then filter the report further by Claim Status, Date of Injury, Liability Status, Liable
Cost Centre, and Payroll Cost Centre. For example, you may want to run a report for a
certain number of columns, where the Date of Injury is between 1 June 2010 and 30
September 2011, where the Claim Status is Reopened (R), and the Liability Status is
Accepted (A).
Parameters: The report allows to choose which data is pulled from the claim listing of all of
the claims the agency is liable for.
Fields: User selects fields from the list available in report 66. Customer Data Report –
Claim Detail.

Guide to Understanding Customer Reports - May 2012
56
33. Accepted claims by date
Description: This report provides a listing of all claims accepted within the chosen period.
Access Level Required: Case Management Detail level access
Export options: .csv
Benefits: This report allows the user generate a list of claim that have been accepted in
the specified period.
Parameters: This report represents claims that have been accepted in the specified period.
Fields: This report is based on Report 66 - for a listing of the fields included in this report,
please refer to page 52 of this Guide.

Guide to Understanding Customer Reports - May 2012
57
34. Claims incurring payment
Description: This report provides a list of claims that Comcare has recently processed
payments for.
Access Level Required: Case Management Detail level access
Export options: .csv, .rtf, .pdf
Benefits: This summary listing of invoices paid within a given period allows the user to see
which claims have been active within the time period. It can provide insight for a case
manager on which claims to take particular notice of. Additional information can then be
sought on individual claims through the View Claim function.
Parameters: Claims that have any Comcare determination date on an invoice within the
selected period. A summary of the invoices for each claim appears.
Fields:
Field Description
Claim
Number
The unique number that identifies a claim.
Claimant
Name
The name of the injured employee.
Liable
cost
centre
The reporting group that has been allocated to the claim. Usually this is
the business area or region the employee worked in when they were
injured. Liable cost centres are supplied by the customer and the level of
detail is dependant on the customers reporting needs.
Case Mgr The name of the case manager
Claim Status
The Open/Closed/Reopened status of the claim.
Invoice
Category
The category of the invoice. INC - Incapacity. RHB - Rehabilitation. MED -
Medical. TRA - Travel. SUB - All others.
No. of
Invoices
The number of invoices Comcare has determined.
Invoice
Amt Paid
The sum amount of the invoice category
Invoice
Amt
Recovered
The sum amount recovered by invoice category.
Total The sum of the total of invoice amount paid and invoice amount
recovered.
Example Report:
34. Claims incurring payment
A Sample Agency
Quarter = Oct-2010 to Dec-2010
lists claims incurring payments in period
Claim No Claimant Name
Liable Cost Ctr
Case Mgr Claim Stat
Invoice Category
No of Invoices
Invoice Amt Paid
Invoice Amt Recovered
Total

Guide to Understanding Customer Reports - May 2012
58
36. Open Return to Work Plan
Description: This report allows a customer to identify all of their open return to work plans
by case manager.
Access Level Required: Case Management Detail level access
Export options: .csv, .rtf, .pdf
Benefits: Enables the agency to closely monitor open Return to Work Plans.
Parameters: This report represents all return to work plans that are open.
Fields:
Field Description
Employee
Name
The name of the injured employee.
Claim Number The unique number that identifies a claim.
Case Manager The person within the agency responsible for management of the claim.
RTWP Start
Date
The date that the return to work plan commenced.
RTWP End Date The date that the return to work plan is due to be finalised.
Est. Final Goal The outcome that the return to work plan hopes to achieve.
s37 Cost to
Date
The sum of all Section 37 costs to date.
Cost to date
($)
The total of costs incurred on the claim as of yesterday.
Provider The contracted provider responsible for implementing the return to work
plan.
Example Report:
36. Open return to work plan
A Sample Agency
Employee Name
Claim No
Case manager
RTWP start date
RTWP end date
Est. final goal
S37 cost to date
Cost to Date
Provider

Guide to Understanding Customer Reports - May 2012
59
37. Claim activity post return to work
Description: This report looks at all closed Return to Work plans, and provides information
about incapacity and medicals since the closure of the Return to Work plan. Records are
listed in date order.
Access Level Required: Case Management Detail level access
Export options: .csv, .rtf, .pdf
Benefits: A successful Return to Work plan will result in a reduction in incapacity
payments, and eventually a reduction in the need for medical treatments. This report helps
an agency to measure that outcome.
Parameters: This report represents return to work plans that have a closure date within
the period chosen by the user.
Fields:
Field Description
Employee Name The name of the injured employee.
Claim Number The unique number that identifies a claim.
Incap Wks Post RTW
Close
The number of weeks of incapacity that have occurred after the
closure of the return to work plan.
Total Incap Cost The sum of all incapacity costs on the claim.
No. Med payments since
RTW Closure
The number of medical payments determined by Comcare after
the closure of the return to work plan.
Total Medical Cost($) The sum of all medical costs associated with the claim.
Future cost estimate ($) The estimate of future costs on the claim as of the case
estimate date. The future cost estimate is determined by a
complex calculation that takes into account a wide array of
factors.
RTW Closure Date The date that the return to work plan was finalised.
Claim Status The Open/Closed/Reopened status of the claim.
Example Report:
37. Claim activity post RTW
A sample agency
Period(s): [01/01/2010 - 31/12/2010]
representing RTW plans with a closure date in the period chosen
Employee Name
Claim Number
Incap wks
post RTW close
Total incap cost
No. Meds since
RTW closure
Total medical cost
Likely future cost estimate
RTW closure date
Claim status
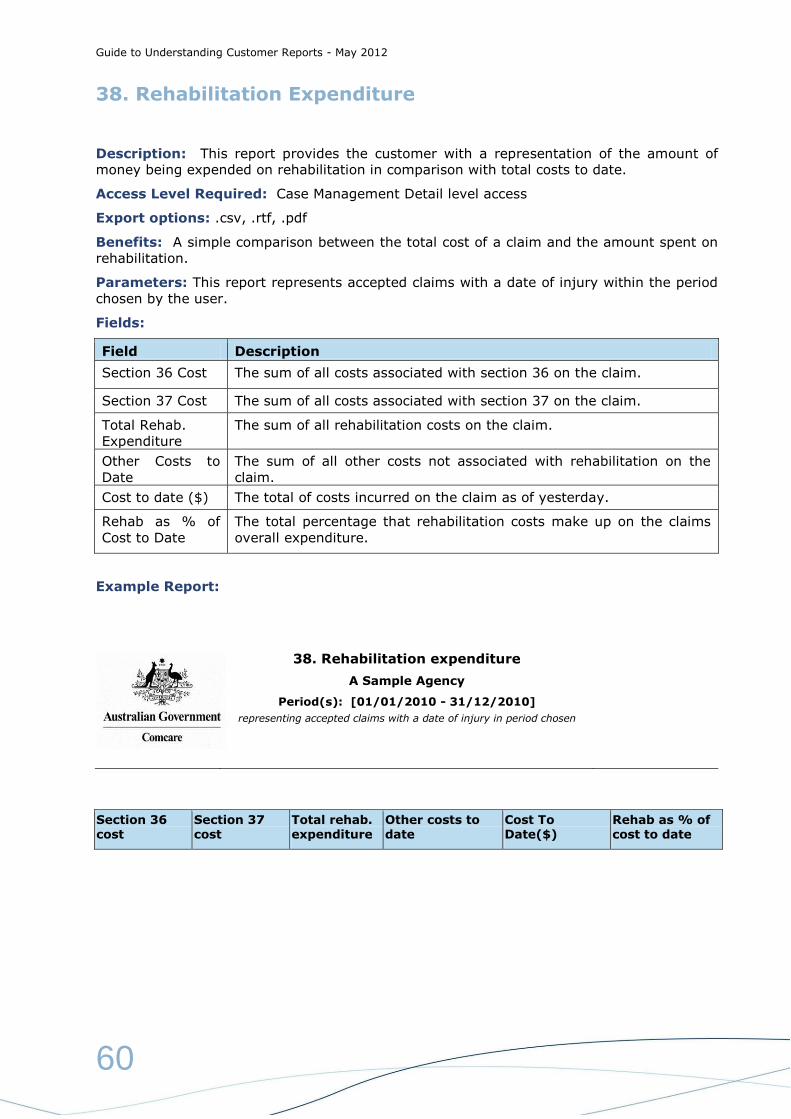
Guide to Understanding Customer Reports - May 2012
60
38. Rehabilitation Expenditure
Description: This report provides the customer with a representation of the amount of
money being expended on rehabilitation in comparison with total costs to date.
Access Level Required: Case Management Detail level access
Export options: .csv, .rtf, .pdf
Benefits: A simple comparison between the total cost of a claim and the amount spent on
rehabilitation.
Parameters: This report represents accepted claims with a date of injury within the period
chosen by the user.
Fields:
Field Description
Section 36 Cost The sum of all costs associated with section 36 on the claim.
Section 37 Cost The sum of all costs associated with section 37 on the claim.
Total Rehab.
Expenditure
The sum of all rehabilitation costs on the claim.
Other Costs to
Date
The sum of all other costs not associated with rehabilitation on the
claim.
Cost to date ($) The total of costs incurred on the claim as of yesterday.
Rehab as % of
Cost to Date
The total percentage that rehabilitation costs make up on the claims
overall expenditure.
Example Report:
38. Rehabilitation expenditure
A Sample Agency
Period(s): [01/01/2010 - 31/12/2010]
representing accepted claims with a date of injury in period chosen
Section 36 cost
Section 37 cost
Total rehab. expenditure
Other costs to date
Cost To Date($)
Rehab as % of cost to date

Guide to Understanding Customer Reports - May 2012
61
39. Open/expired return to work plan
Description: This report provides the customer with a listing of all their Return to Work
(RTW)) plans where the plan end date has expired with no recorded lodgement of a RTW
plan amendment or closure form.
Access Level Required: Case Management Detail level access
Export options: .csv, .rtf, .pdf
Benefits: This enables agencies to identify RTW plans that may require extension or
closure.
Parameters: This report represents all return to work plans that have passed their
scheduled end date, but have not had a recorded lodgement to amend the plan or a
lodgement to advise the plan has closed.
Fields:
Field Description
Case Manager The person within the agency responsible for management of the claim.
Provider The contracted provider responsible for implementing the return to work
plan.
Claim Number The unique number that identifies a claim.
RTWP Start
Date
The date that the return to work plan commenced.
RTWP End Date The date that the return to work plan is due to be finalised.
Liable cost
centre
The reporting group that has been allocated to the claim. Usually this is
the business area or region the employee worked in when they were
injured. Liable cost centres are supplied by the customer and the level
of detail is dependant on the customers reporting needs.
Example Report:
39. Open/Expired return to work plan
A Sample Agency
Case
Manager
Provider Claim no Claimant
name
RTWP start
date
RTWP end
date
Liable
Cost
centre
Case,
Manager
Rehab
Profile
888888/01 Surname, F 21/09/2009 28/02/2010 Example
Cost
Centre

Guide to Understanding Customer Reports - May 2012
62
40. RTWP average cost and duration
Description: This report provides the customer with a representation of the average cost
and duration of their closed Return to Work (RTW) programs.
Access Level Required: Case Management Detail level access
Export options: .csv, .rtf, .pdf
Benefits: This report enables agencies to view the average cost and duration of RTW
programs by injury group.
Parameters: This report represents return to work plans that have a registered start date
within the period chosen by the user.
Fields:
Field Description
Period This field displays the date range the report was generated for.
Mechanism Injury
Major Group
The major group used in the Type of Occurrence Classification
System to differentiate how claimants have been injured.
Avg. RTWP cost The average cost of Return To Work Plans with a start date in the
specified period.
Avg. RTWP duration
(days)
The average length of Return To Work Plans with a start date in
the specified period.
Example Report: following page

Guide to Understanding Customer Reports - May 2012
63
40. RTWP average cost and duration
A Sample Agency
Period(s): [01/01/2009 - 31/12/2009]
representing RTW plans with a start date in the period chosen
RTWP average cost and duration
Period Mechanism Injury Major Group Avg. RTWP cost Avg. RTWP duration (days)

Guide to Understanding Customer Reports - May 2012
64
41. Early Intervention
Description: This report details open claims with 5 or more days of incapacity with no
section 37 costs incurred.
Access level required: Case Management Detail level access.
Export options: .csv, .rtf, .pdf
Benefits: The purpose of this report is to highlight claims that have had incapacity but no
record of rehabilitation intervention. This report allows case managers to target claims early
in an effort to reduce overall costs.
Parameters: This report represents open claims that have had 5 or more days of incapacity
but have not yet recorded any s37 costs.
Fields:
Field Description
Date of Injury The date that claimants injury occurred.
Employee Name The name of the injured employee.
Claim Number The unique number that identifies a claim.
Incapacity Weeks The total number of incapacity weeks accrued as of yesterday.
Total Cost The sum of the future cost estimate and costs to date on the day
the estimate is made.
Liable cost centre The reporting group that has been allocated to the claim. Usually
this is the business area or region the employee worked in when
they were injured. Liable cost centres are supplied by the customer
and the level of detail is dependant on the customers reporting
needs.
Case Manager The person within the agency responsible for management of the
claim.
Last Incap Date The last date that the employee was off work due to incapacity.
Cost to date ($) The total of costs incurred on the claim as of yesterday.
Future cost estimate
($)
The estimate of future costs on the claim as of the case estimate
date. The future cost estimate is determined by a complex
calculation that takes into account a wide array of factors.
MOI Major Group The major group used in the Type of Occurance Clasification
System to deferentiate how claimants have been injured.
Claim Status The Open/Closed/Reopened status of the claim.
Example Report: following page

Guide to Understanding Customer Reports - May 2012
65
41. Early intervention
A Sample Agency
representing open claims with >= 5 days incap and no S37 cost incurred Total Cost: as at date of case estimates, sum of costs til then and likely
future cost. This report may be best printed in landscape orientation
Injury date Employee
name
Claim number Incapacity
weeks
Total cost($) Cost centre
22/03/1988 Surname,
Firstname
888888/02 993.20 268751.38 273
13/06/2008 Surname,
Firstname
777777/02 2.00 35936.14 463
08/01/1988 Surname,
Firstname
666666/01 1094.34 563179.53 273
Continued from above…
Case
manager
Last incap date Cost to
date($)
Future cost
estimate($)
MOI Major Group Claim
status
Manager, Case 29/11/2006 231954.22 39285.00 Other and Unspecified O
Manager, Case 18/07/2008 15567.86 22318.00 Body Stressing R
Manager, Case 11/01/2009 481431.39 82727.00 Other and Unspecified O

Guide to Understanding Customer Reports - May 2012
66
42. Provider Performance
Description: This report details Return to Work plan goals and outcomes by Provider.
Access level required: Case Management Detail level access.
Export options: .csv, .rtf, .pdf
Benefits: The purpose of this report is to highlight the performance of rehabilitation
providers being utilised by an agency.
Parameters: This report represents return to work plans that have been closed but have a
start date within the period chosen by the user.
Fields:
Field Description
Provider The contracted provider responsible for implementing the return to work
plan.
Employee Name The name of the injured employee.
Claim Number The unique number that identifies a claim.
RTWP Start Date The date that the return to work plan commenced.
RTWP End Date The date that the return to work plan is due to be finalised.
RTWP Duration The length of the return to work plan. From the start date to end date.
Section 37 Cost The sum of all costs associated with section 37 on the claim.
RTW Goal The outcome that the return to work plan hopes to achieve.
Example Report:
42. Provider performance
A Sample Agency
Period(s): [01/01/2010 - 31/12/2010]
representing closed RTW plans with a start date in the period chosen
Provider Employee name
Claim no RTWP start date
RTWP end date
RTWP duration
Section 37 cost
RTW goal

Guide to Understanding Customer Reports - May 2012
67
43. Claims with multiple RTW plans
Description: A listing of all open claims with more than 1 Return to Work plan.
Access level required: Case Management Detail level access.
Export options: .csv, .rtf, .pdf
Benefits: The report assists agencies in evaluating the effectiveness of their Return to
Work plan activity and policies.
Parameters: This report represents claims that have more than one return to work plan
registered against it.
Fields:
Field Description
Employee Name The name of the injured employee.
Claim Number The unique number that identifies a claim.
Liable cost centre The reporting group that has been allocated to the claim. Usually
this is the business area or region the employee worked in when
they were injured. Liable cost centres are supplied by the customer
and the level of detail is dependant on the customers reporting
needs.
Date of Injury The date that claimants injury occurred.
Provider The contracted provider responsible for implementing the return to
work plan.
RTW Start Date The date that the return to work plan commenced.
RTW End Date The date that the return to work plan is due to be finalised.
Cost to date ($) The total of costs incurred on the claim as of yesterday.
Future cost estimate
($)
The estimate of future costs on the claim as of the case estimate
date. The future cost estimate is determined by a complex
calculation that takes into account a wide array of factors.
Case Manager The person within the agency responsible for management of the
claim.
Example Report:
43. Claims with multiple RTW plans
A Sample Agency
representing open claims with more than one RTW plan This report may be best printed in landscape orientation
Employee name
Claim number
Cost centre
Injury date
Provider name
Provider status
RTW start date
RTW end date
Cost to date
Case estimate
Case manager

Guide to Understanding Customer Reports - May 2012
68
44. Customer Data Report - Return to Work
Description: A complete record of all claims with a Return to Work plan for your agency.
Access level required: Case Management Detail level access.
Export options: .csv, .rtf, .pdf
Benefits: This report enables you to run your own analysis and reporting to produce
tailored reports to suit your requirements.
Parameters: This report is a data dump of all return to work records for the selected
agency.
Fields:
Field Name Description
Surname Employee's surname.
Given Names Employee's first name.
Empl No A unique eight digit claim identification number allocated by Comcare Australia. for each claimant.
Suffix A two digit number identifying the claim sequence number i.e. if the
claimant has had two previous claims then these last two digits of the claim number for their third claim would be 03.
Date of Birth Employee's date of birth.
Gender Employee's gender.
Date of Injury The date of injury i.e. the specific day on which the claimed injury occurred or a disease was first medically diagnosed.
Liable Customer Employer at date of injury.
Plan Id This code is assigned by Comcare to uniquely identify a RTWP. The first plan for a claim is always “A” and subsequent plans are assigned alphabetically.
Rehab Assessment Date
The date the plan was assessed by the Service Provider.
Plan Start Work Status The working status of the employee at the time of RTWP creation. The
valid values for this field are: W - Wage and Salary earner C - Ceased M - Modified duties R - Reduced hours B - Both Modified duties and reduced hours N - No Change
X - Off work E - Employers and self-employed O - Other
Plan Start Date RTWP start date as specified on the RTWP Form
Date Plan Signed The day the plan was signed by the case manager and employee.
Comcare Receipt Date The date the RTWP form is received in Comcare.
Plan End Date RTWP end date as specified on the RTWP Form
Plan Current Status Indicates current status of Comcare's agreement to the RTWP. The valid values for this field are: A - Acknowledge D - Deleted I - Ignore N- Non-compliant
R - Review W - Waiting

Guide to Understanding Customer Reports - May 2012
69
Field Name Description
X - Closed at migration
Z - Rehab not required
Plan Closure Date The date the Closure Report is signed by the Case Manager.
Plan Closure Reason Code identifying the reason for closure of the RTWP. The valid values for this field are: A - Deceased B - Back at Work C - Rehab Authority (usually employer) cessation of program
D - Deferred E - Employee withdrew from program or declined work I - “R” and “N” status has not been changed to “A” so ignore P - Provider Cessation of Involvement R - Redundancy T - Totally and permanently incapacitated for work U - Partial incapacity - unable to place in suitable employment
V - Voluntary retirement X - Closed at migration 19 May 1993
Z - Rehab not required
Expected RTW Date The date the injured employee is expected to return to work in any capacity ie. full time or reduced hours.
Actual RTW Date The date on which the employee commenced employment, as reported on the Closure Report, following a Rehabilitation Program. This date is also for those employees who, while on a rehabilitation program, commence on a Graduated Return To Work.
Plan Estimated Cost The total estimated cost of the return to work plan as detailed at Part 2 of the RTWP form.
Plan Actual Cost RTWP costs to date
Receipt Claim form in
Comcare
Receipt date of original claim form in Comcare

Guide to Understanding Customer Reports - May 2012
70
45. Open Claims by Cost Centre by Mechanism of Incident
Description: This report provides details for claims with a date of injury in the specified
period, sorted by liable cost centre and then mechanism of injury.
Access Level Required: Case Management Detail Level Access
Export Options: .csv, .rtf, .pdf
Benefits: As this report only lists OPEN or REOPENED claims it allows managers to focus on
the currently active claims which have the potential to impact most significantly on agency
premium programs. The weeks lost field is a useful indicator of the likely long term cost of a
claim and can alert managers of the need to develop return to work strategies for the
injured employee.
Parameters: This report represents accepted claims with a date of injury within the period
chosen by the user.
Fields:
Field Description
Liable cost
centre
The reporting group that has been allocated to the claim. Usually this is
the business area or region the employee worked in when they were
injured. Liable cost centres are supplied by the customer and the level
of detail is dependant on the customers reporting needs.
MOI Major
Group
Refers to the classification groups within the Type of occurrence
classification system.
Employee
Name
The name of the injured employee.
Claim Number The unique number that identifies a claim.
Injury Date The date that claimants injury occurred.
Cost to date
($)
The total of costs incurred on the claim as of yesterday.
Future cost
estimate ($)
The estimate of future costs on the claim as of the case estimate date.
The future cost estimate is determined by a complex calculation that
takes into account a wide array of factors.
Incapacity
Weeks
The total number of incapacity weeks accrued as of yesterday.
Example Report:
45. Open Claims by Cost Centre by Mechanism of Incident
*A Sample Agency
Period(s): [01/07/2010 - 30/06/2011]
representing accepted claims with a date of injury in period chosen This report may be best printed in landscape orientation
Liable Cost Centre
MOI Major Group Employee Name Claim Number
Injury Date Cost to Date
Likely Future Cost
Weeks Lost
Claim Status
2 Body Stressing Surname, F 99999/1 09/11/2010 704.00 2675.00 0.00 Open
3 Being Hit by Moving Objects
Surname, F 88888/1 25/12/2010 1637.56 5434.00 0.00 Open
Total 2341.56 8109.00 0.00

Guide to Understanding Customer Reports - May 2012
71
46. Claim Details by Nature of Injury/Disease
Description: This report lists claims details by the eleven major TOOCS categories of
Nature of Injury, which is intended to identify the most serious injury or disease
sustained/suffered.
Access Level Required: Case Management Detail Level Access
Export Options: .csv, .rtf, .pdf
Benefits: This report can be used to view detailed claim information, including cost and
incapacity information, but most importantly identifies the type of injury/disease for each
claim occurring within the period specified by the user.
Parameters: This report represents accepted claims within the period chosen by the user.
Fields:
Field Description
Nature of Injury The type of injury sustained by the claimant
Claim Number The unique number that identifies a claim.
Employee Name The name of the injured employee.
Sex The gender of the claimant.
Liable cost centre
No.
The number identifying the cost centre
Liable cost centre The reporting group that has been allocated to the claim. Usually
this is the business area or region the employee worked in when
they were injured. Liable cost centres are supplied by the customer
and the level of detail is dependant on the customers reporting
needs.
Injury Date The date that claimants injury occurred.
Incapacity Weeks The total number of incapacity weeks accrued as of yesterday.
Cost to date ($) The total of costs incurred on the claim as of yesterday.
Future cost
estimate ($)
The estimate of future costs on the claim as of the case estimate
date. The future cost estimate is determined by a complex
calculation that takes into account a wide array of factors.
Total Cost ($) The sum of the cost to date and future cost estimate on the most
recent estimate date
Example Report:
46. Claim Details by Nature of Injury/Disease
*A Sample Agency
Period(s): [01/01/2010 - 31/12/2010]
representing accepted claims with a date of injury in period chosen Total Cost: as at date of case estimates, sum of costs til then and likely future cost. This report may be best printed in landscape orientation
Nature Of Injury
Claim No.
Employee Name
Sex Liable Cost Centre No.
Liable Cost Centre
Injury Date Incapacity Weeks
Cost to Date
Future Cost Estimate
Total Cost
Trauma To Muscles
9999/02 Surname, Firstname
F 1 Central Office
29/04/2010 0.00 866.25 1432.00 2298.25
Total 0.00 866.25 1432.00 2298.25

Guide to Understanding Customer Reports - May 2012
72
47. Claim Details by Agency Of Injury/Disease
Description: Lists the claim details by the nine major TOOCS categories of Agency of
Injury, which is intended to identify the object, substance or circumstance that was
principally involved in or mostly closely associated with inflicting the injury or disease.
Access Level Required: Case Management Detail Level Access
Export Options: .csv, .rtf, .pdf
Benefits: The principal benefit of this report is that allows the user to determine what has
caused injuries to claimants with accepted claims within the specified date range.
Parameters: This report represents accepted claims within the period chosen by the user.
Fields:
Field Description
Agency of Injury The type of injury sustained by the claimant
Claim Number The unique number that identifies a claim.
Employee Name The name of the injured employee.
Sex The gender of the claimant.
Liable cost centre No. The number identifying the cost centre
Liable cost centre The reporting group that has been allocated to the claim.
Usually this is the business area or region the employee
worked in when they were injured. Liable cost centres are
supplied by the customer and the level of detail is dependant
on the customers reporting needs.
Injury Date The date that claimants injury occurred.
Incapacity Weeks The total number of incapacity weeks accrued as of yesterday.
Cost to date ($) The total of costs incurred on the claim as of yesterday.
Future cost estimate ($) The estimate of future costs on the claim as of the case
estimate date. The future cost estimate is determined by a
complex calculation that takes into account a wide array of
factors.
Total Cost ($) The sum of the cost to date and future cost estimate on the
most recent estimate date
Example Report:
47. Claim Details by Agency of Injury/Disease
Aboriginal Hostels Ltd
Period(s): [01/07/2010 - 30/06/2011]
representing accepted claims with a date of injury in period chosen Total Cost: as at date of case estimates, sum of costs til then and likely
future cost. This report may be best printed in landscape orientation
Agency of Injury
Claim No. Employee Name
Sex Liable Cost Centre No.
Liable Cost Centre
Injury Date Incapacity Weeks
Cost to Date
Likely Future Cost
Total Cost
Kitchen Food Preparation Appliances
111111/01 Surname, Firstname
M 3 Victoria 25/12/2010 0.00 1637.56 5434.00 5434.00
Total 0.00 1637.56 5434.00 5434.00

Guide to Understanding Customer Reports - May 2012
73
48. Claims with Reconsiderations
Description: This report provides details of claims that have a reconsideration requested
within the chosen period.
Access Level Required: Case Management Detail Level Access
Export Options: .csv, .rtf, .pdf
Benefits: This is a new report added to the suite of reports to allow agency users to
monitor pending reconsiderations.
Parameters: This report represents claims that have a reconsideration requested within
the specified period.
Fields:
Field Description
Employee Name The name of the injured employee.
Claim Number The unique number that identifies a claim.
Claim Status The Open/Closed/Reopened status of the claim.
Date of Injury The date that claimants injury occurred.
Recon Received
Date
The date Comcare received the request to reconsider the claim.
Recon Decision
Date
The date Comcare determined the outcome of the reconsideration
request.
Issue The end result of the reconsideration process.
Outcome Displays whether the original decision has been affirmed or not.
Recon Officer Name of the assigned Comcare Reconsideration Officer.
Example Report:
48. Claims with Reconsiderations
*A Sample Agency
Period(s): [01/01/2010 - 31/12/2010]
representing claims that have had a reconsideration decision within the specified period.
Employee Name
Claim No Claim Status
Date of Injury
Recon Received Date
Status Recon Decision Date
Issue Outcome Recon Officer
Surname, Firstname
1111111/01 O 02/07/2007 31/03/2010 Completed 18/05/2010 Denied Benefits - other
medical
Affirm Firstname Lastname
Surname, Firstname
2222222/10 O 30/04/2009 24/06/2010 Completed 09/09/2010 Accept benefits - pharmacy
Vary favourably

Guide to Understanding Customer Reports - May 2012
74
49. Claims with AAT Case Decision
Description: This report provides the details of claims that have had AAT referrals within
the chosen period.
Access Level Required: Case Management Detail Level Access
Export Options: .csv, .rtf, .pdf
Benefits: This is a new report that allows agencies to track pending AAT claim disputes.
Parameters: This report represents claims that have filed an AAT appeal within the
specified period.
Fields:
Field Description
Employee Name The name of the injured employee.
Claim Number The unique number that identifies a claim.
AAT Notice Date The date the AAT was notified of the dispute.
S29 Received Date The date the initiator filed the dispute.
Status Current status of the appeal
Recon Decision
Date
The date Comcare determined the outcome of the reconsideration
request.
Initiator The party who filed the dispute.
Decision The end result of the AAT process.
Decision Date The date of the decision.
Instructing Officer Name of the assigned Comcare Instructing Officer
Example Report:
49. Claims with AAT case decisions
*A Sample Agency
Period(s): [01/01/2010 - 31/12/2010]
representing claims that have filed an AAT appeal within the specified period
Employee Name
Claim No AAT Notice Date
S29 Received Date
Status Recon Decision Date
Initiator Decision Decision Date
Instructing Officer
Surname, Firstname
1111111/01 29/07/2010 05/07/2010 Completed 08/09/2010 Claimant Conceded 08/09/2010 Firstname Lastname
Surname, Firstname
2222222/02 23/04/2010 24/03/2010 Completed 01/10/2010 Claimant Set Aside 01/10/2010 Firstname Lastname

Guide to Understanding Customer Reports - May 2012
75
50. Top 50 Claims by Cost to Date
Description: This report provides a listing of claim details for the top 50 high cost claims to
date with a date of injury in the specified period.
Access Level Required: Case Management Detail Level Access
Export Options: .csv, .rtf, .pdf
Benefits: This report can be used as a way of identifying priority claims for review. This
allows agencies and case managers in particular, to focus on the key claims and maximise
their case management strategies.
Parameters: This report represents the top 50 (by cost to date) accepted claims with a
date of injury within the specified period.
Fields:
Field Description
Mechanism of Injury
Major Group
Refers to the classification groups within the Type of occurrence
classification system.
Cost to date ($) The total of costs incurred on the claim as of yesterday.
Claim Number The unique number that identifies a claim.
Date of Injury The date that claimants injury occurred.
Employee Name The name of the injured employee.
Liable cost centre The number of the liable cost centre where the employee was
injured. This can be cross referenced with report 22. Liable cost
centres are supplied by the customer and the level of detail is
dependant on the customers reporting needs.
Incapacity Weeks The total number of incapacity weeks accrued as of yesterday.
Claim Status The Open/Closed/Reopened status of the claim.
Example Report:
50. Top 50 claims by cost to date
*A Sample Agency
Period(s): [01/01/2010 - 31/12/2010]
representing accepted claims with a date of injury in period chosen
Mechanism Injury Major Group
Cost To Date($)
Claim Number
Date of Injury Employee Name
Liable Cost Centre No.
Incapacity Weeks
Claim Status
Falls, Trips and Slips
78183.56 111111/1 05/05/2010 Surname, Firstname
66 27.67 Open
Falls, Trips and Slips
61465.09 666666/6 14/05/2010 Surname, Firstname
142 39.36 Open
Falls, Trips and Slips
42501.07 888888/4 09/06/2010 Surname, Firstname
12 24.40 Reopened

Guide to Understanding Customer Reports - May 2012
76
51. Claims with a Date of Injury within the Last Four Years
Description: This report is a statement of accepted claims with a date of injury in the last
four experience years.
Access Level Required: Case Management Detail Level Access
Export Options: .rtf, .pdf
Benefits: This report helps inform agencies of the costs of their employees' claims so that
they can initiate appropriate action to contain those costs. As it is sorted by liable cost
centre it can also be used by managers to identify injury levels and trends in particular
workplaces.
Parameters: The report represents accepted claims with a date of injury within the last
four calendar years.
Fields:
Field Description
Liable cost centre
No.
The number of the liable cost centre where the employee was
injured. This can be cross referenced with report 22. Liable cost
centres are supplied by the customer and the level of detail is
dependant on the customers reporting needs.
Employee Name The name of the injured employee.
Claim Number The unique number that identifies a claim.
Date of Injury The date that claimants injury occurred.
NWE Stands for 'Normal Weekly Earnings'. This is the amount the
claimant would normally earn in a week.
Incap Cost Refers to the total amount of incapacity
Cost to date ($) The total of costs incurred on the claim as of yesterday.
Incap Status The current incapacity status of the claim: A-At work(claim open), I-
Incapacitated, G-Graduated return to work or partial incapacity, D-
Deceased, C-At work claim closed, E-Error code treated as
incapacity, F-Error code treated as at work.
Incap Transpired The number of calendar days lapsed, including week-ends, since the
date the claimant's incapacity status last changed.
Incapacity Weeks The total number of incapacity weeks accrued as of yesterday.
Incap Duration The number of calendar days on benefit due to incapacity excluding
the current spell.
Example Report:
51. Claims influencing future premiums
*A Sample Agency
Period(s): [01/07/2010 - 30/06/2011]
This report may be best printed in landscape orientation
Liable Cost Ctr
Employee Name
Claim No Claim Stat
Date of Injury NWE Incap Cost
Cost to date
Incap Status
Incap Transpired
Incap Duration
2 Surname, Firstname
22222/02 O 21/08/2009 1427.46 26819.15 43586.04 I 51 300

Guide to Understanding Customer Reports - May 2012
77
52. High Cost Claims
Description: This report provides a listing of open/active claims which have an estimated
total liability of over $10K. The claims are identified in broad total liability categories and
are listed in descending order of total liability.
Access Level Required: Case Management Detail Level Access
Export Options: .csv, rtf, pdf
Benefits: Focuses on high cost claims which impact significantly on premiums, so that
appropriate action to contain these costs can be initiated.
Parameters: This report represents open claims that have an estimated liability over
$10,000.
Fields:
Field Description
Case Mgr Name The name of the employee within the claimants agency looking after
the claim.
CTD + FCE ($) Stands for Cost to Date + Future Cost Estimate. Distinct from 'Total
Costs' because it includes incurred up to yesterday in addition to the
estimate formulated on the case estimate date.
Employee Name The name of the injured employee.
Claim Number The unique number that identifies a claim.
Date of Injury The date that claimants injury occurred.
Mechanism of
Injury Major Group
Refers to the classification groups within the Type Of Occurrence
Classification System.
Liable cost centre
No.
The number of the liable cost centre where the employee was
injured. This can be cross referenced with report 22. Liable cost
centres are supplied by the customer and the level of detail is
dependant on the customers reporting needs.
RTWP Status This indicates the current Return to Work Plan Status of the claim.
The valid values for this field are: O = There is currently an open
RTWP for this claim. C = There is a closed RTWP for this claim. N =
There is no RTWP registered for this claim
Medical CTD($) This is the total cost to date of Medical payments made on this
claim.
Incap CTD($) This is the total cost to date of Incapacity payments made on this
claim.
Rehab CTD($) This is the total cost to date of Rehabilitation payments made on this
claim.
Travel CTD($) This is the total cost to date of Travel payments made on this claim.
Other CTD($) This is the total cost to date of all other payments not already
defined on this claim.
Total CTD($) The total costs of all payments made on this claim.

Guide to Understanding Customer Reports - May 2012
78
Notes: These high cost claims are those most likely to have a significant impact on
premiums. The report re-directs attention to the Return to Work Plan (RTWP) status for
each claim. Where the status is C (closed) or N (no RTWP registered for claim) agencies
may consider developing a RTWP in an endeavour to reduce further incapacity and resultant
costs.
The report includes claims data relating to an agencies current employees. In some cases
liability for specific claims may rest with a former or other employer. It also includes pre-
premium claims.
Example Report:
52. High Cost Claims
*A Sample Agency
Estimated future costs valid as at date of case estimates update This report may be best printed in landscape orientation
Case Mgr Name CTD + FCE($)
Employee Name
Claim No Date of Injury
Mechanism Injury Major Group
Liable Cost Centre No.
CaseManager, A 1321748 Surname, F 111111/01 28/06/2005 Other and Unspecified
1
CaseManager, A 1585415 Surname, F 222222/01 08/10/1995 Being Hit by Moving Objects
85
Continued from above…
RTWP Status
Medical CTD($) Incap CTD($) Rehab CTD($) Travel CTD($)
Other CTD($) Total CTD($)
C 34113.10 409825.63 7799.00 2529.25 0.00 454266.98
C 316919.11 423270.21 45888.49 1821.50 63813.64 851712.95
Guide to Understanding Customer Reports - May 2012
79
Section 3 - Financial Reports
Designed to support an Agency’s payroll and financial management team, this suite of
reports provides detailed remittance advice and a listing of incapacity determinations to
assist an agency with the ongoing management of their workers compensation claims.
Some of the reports in this section are larger data reports, which can be generated in .csv
(spreadsheet) format, to allow an agency to perform detailed claims analysis.
Report Content
All reports provide a number of content and presentation options. For example, reports can
usually provide data by:
All (whole of agency)
Cost Centre
Reporting Periods
There are a number of reporting period options available for selection:
Financial year
Calender year
Other, as required
The number of periods available for selection varies between each report - some reports will
allow a comparison of 4 periods on the one report, others 1 or 2.
Data currency
The claims information within the Management Reports is updated on a daily basis, with
data as at close of business. This means that on any day, CIS will be reporting with data as
at close of business on the day immediately prior.
All reports are available through the Comcare Customer Information System via the
Comcare Website, or can be produced on request as required.
Important notes:
Report 70 has been amended to include withdrawn incapacities to give the agency the
entire view of determinations.

Guide to Understanding Customer Reports - May 2012
80
70. Incapacity Determinations
Description: This report is a statement of incapacity determinations made within a chosen
period, allowing both individual daily reports as well as cumulative fortnightly reports. The
report can be run for individual cost centres as well as for all cost centres within the agency.
Access Level Required: Finance Level Access
Export Options: .csv
Benefits: This report allows agencies to view new incapacity determinations, and changes
to existing determinations. The report is especially useful for viewing incapacity
determinations applicable to the current pay period, and aligns with the paper incapacity
report. Finance areas can utilise this report to reconcile employees pay and expected
reimbursements from Comcare.
Parameters: This report represents incapacity determinations made by Comcare within the
specified period, and can be run for a maximum of twelve months.
Fields:
Field Description
Cost Ctr No Payroll Cost Centre for the Employee
Name Name of the Payroll Cost Centre
Claim No Employee number and claim suffix against which the incapacity
was paid
Employee Name Name of the Employee with incapacity
Cust Ref The payroll cost centre customer reference
Payroll Code The employee's payroll code for the given claim, if entered on
the claim
Incap Det No Comcare's unique number assigned for the incapacity
determination
Lost Wks-HH:MM The number of incapacity weeks, hours and minutes, lost as a
consequence of the incapacity
Incap Status The status of the incapacity determination:
A An incapacity accepted for payment
D An unpaid incapacity that was deleted
R An unpaid incapacity that was rejected
U An incapacity was entered but not accepted
(undetermined). For instance, the claim may still be
undetermined.
V A paid incapacity was voided
Weekly Rate The weekly rate utilised for the incapacity liability calculation,
specific to a determination
Start Date Date on which the incapacity determination commenced
Start Time Time at which the incapacity determination commenced,
relevant to the Start Date
End Date Date on which the incapacity determination ended.
End Time Time at which the incapacity determination ended, relevant to
the End Date.
Liability The liable amount determined for the period of incapacity
Actual Earnings Total amount earned in the period, not including incapacity
Actual Worked HH:MM Actual total hours worked in the period
Section Section of the SRC Act incapacity determined under
Std Wkly HH:MM Normal working hours
Current Total Incap
Durn
Total amount of incapacity determined so far on the claim,
expressed in weeks.

Guide to Understanding Customer Reports - May 2012
81
71. Payment Remittance Detail Report by Date
Description: This report gives details of reimbursements made in a specified date range.
Access Level Required: Finance Level Access
Export Options: .csv
Benefits: This report allows the user to define a date period and then view all of the
remittance advices relating to that period, which in turn allows for reconciliation of
incapacity reimbursements.
Parameters: This report represents all payments made to the agency within the specified
date range.
Fields:
Field Description
Payee Name Name of the payee (agency)
Payee No Comcare’s payee number (agency/cheque receiving cost centre
numbers)
Account paid For EFT payments this is BSB/Account number.
Chq/EFT no Payment reference. A leading C indicates a cheque; E indicates an EFT
payment.
Payment date Date the payment was issued
Payment total Total (nett) payment amount
Payroll Cost
Centre
Employee’s payroll cost centre
Cust Reference Customer reference for payroll cost centre (if any)
Name Name of payroll cost centre
Employee
Name
Name of employee reimbursed for incapacity
Claim no Employee’s claim number
State Employee’s state
Injury Date Date of injury for Employee’s claim
AGS/Payroll
No.
Employee’s AGS or payroll number
Comcare
Invoice no
Comcare’s invoice reference
Start date Incapacity determination starting date
End date Incapacity determination end date
Item Amount Amount paid or recovered (negative if recovery.)

Guide to Understanding Customer Reports - May 2012
82
72. Payment Remittance Detail Report by Payment Number
Description: This report gives details of incapacity payments made within a specified date
range, by payment number.
Access Level Required: Finance Level Access
Export Options: .csv
Benefits: This report allows the user to enter a specific Payment Number and then view the
remittance advice relating to that number.
Parameters: This report represents payments to the agency that correspond with the
entered Payment Number.
Fields:
Field Description
Payee Name Name of the payee (agency)
Payee No Comcare’s payee number (agency/cheque receiving cost centre
numbers)
Account paid For EFT payments this is BSB/Account number.
Chq/EFT no Payment reference. A leading C indicates a cheque; E indicates an EFT
payment.
Payment date Date the payment was issued
Payment total Total (nett) payment amount
Payroll Cost
Centre
Employee’s payroll cost centre
Cust Reference Customer reference for payroll cost centre (if any)
Name Name of payroll cost centre
Employee
Name
Name of employee reimbursed for incapacity
Claim no Employee’s claim number
State Employee’s state
Injury Date Date of injury for Employee’s claim
AGS/Payroll
No.
Employee’s AGS or payroll number
Comcare
Invoice no
Comcare’s invoice reference
Start date Incapacity determination starting date
End date Incapacity determination end date
Item Amount Amount paid or recovered (negative if recovery.)

Guide to Understanding Customer Reports - May 2012
83
73. Payment Remittance Summary Report
Description: This report provides a summary of payments made within a specified date
range.
Access Level Required: Finance Level Access
Export Options: .csv, .rtf, .pdf
Benefits: This report allows a summary view of the payments Comcare has made to an
agency.
Parameters: This report represents total amounts for cheque and EFT payments made by
Comcare to the agency within the specified period.
Fields:
Field Description
Payee Name Name of the Payee (agency)
Payee No Comcare’s payee number (agency number & cheque receiving cost
centre)
Account paid For EFT payments, this is the BSB and Account number.
Chq/EFT no Payment reference. A leading C indicates a cheque; E indicates an EFT
payment.
Payment date Date the payment was issued
Payment total (Nett) payment amount

Guide to Understanding Customer Reports - May 2012
84
74. Claims approaching 45 weeks incapacity
Description: This report provides a list of claims for an agency that are approaching 45
weeks of incapacity.
Access Level Required: Case Management Detail level access
Export options: .csv, .rtf, .pdf
Benefits: The claims listed within this report will have between 35 and 55 weeks of
incapacity determined. This will assist case managers with the identification and
management of claims approaching and just passing 45 weeks of incapacity.
Parameters: This report represents claims that have had between 35 and 55 weeks of
incapacity determined.
Fields:
Field Description
Payroll Cost Centre No. The unique number that identifies the payroll cost centre where
the claim is currently registered.
Payroll cost centre name Name of the reporting group that has been allocated to the
claim. This is the business area or region the employee is
currently aligned with. Payroll cost centres are supplied by the
customer and the level of detail is dependant on the customers
reporting needs.
Claim Number The unique number that identifies a claim.
Employee Name The name of the injured employee.
Incapacity Weeks The total number of incapacity weeks accrued as of yesterday.
Example Report:
74. Claims approaching 45 weeks incapacity
A Sample Agency
lists claims approaching 45 wks incap
Payroll Cost
Centre No
Payroll Cost Centre Name Claim No Employee Name Incapacity
Wks
7 Sample Cost Centre C 09999999/04 Sample Employee A 54.95
1 Sample Cost Centre A 07777777/01 Sample Employee E 49.55
13 Sample Cost Centre B 08888888/01 Sample Employee B 44.69
13 Sample Cost Centre B 08889999/01 Sample Employee C 36.36
1 Sample Cost Centre A 09999988/01 Sample Employee D 36.14

Guide to Understanding Customer Reports - May 2012
85
Section 4 – Using the CIS
The CIS is a widely used tool throughout Comcare’s jurisdiction. This section of the guide is
to provide basic first line assistance to new or inexperienced users in the fundamentals of
the system. The CIS provides 4 functions to approved users.
The ability to generate a report.
The ability to view individual claim details.
The ability for CIS agency administrators to manage cost centre restrictions.
And; the ability for users to manage their preferences such as, secret question
and answers, passwords, and favourite reports.
Generating a report
Generating a report in CIS is a streamlined process.
Step 1
Select ‘Generate Report’ from the initial CIS home screen and then click on ‘Execute’.
Step 2
Follow the prompts on the screen to generate a report:
1. Choose the group that you would like to report on (it will turn a shade of blue once
selected).
2. Choose the report category and then the report you would like to run (each selection is
confirmed by the text turning a shade of blue).
3. Once a report is selected the report generation toolbar at the top will provide you with
all the options you need to run a report. Including:
i. Filter: After clicking on this button a pop up screen will appear with a number of
caveats that you can restrict the report by.
ii. Previous Filters: Clicking on this button will apply the filters that you last used to
run a report. It will apply the filters as best as possible as some reports display
wildly different information, this option may not be applicable across all reports.

Guide to Understanding Customer Reports - May 2012
86
iii. Generate: Clicking on this button will create the report and make it visible in the
web browser. For some reports this option may not be available because some
reports cannot be created within the browser and must be immediately exported
to .CSV (excel format). In that instance only the ‘Export’ button will be available.
iv. Export: The export button allows you to create the report in a number of formats,
including PDF, CSV, and RTF. (The formats that are available for each report are
dependant on their content – not all reports can be generated in CSV for
example).
v. Add to Favourites: Clicking this button will add the report to the favourite’s
category in ‘Step 2 – Choose Report’. This is beneficial if the user runs the same
reports on a regular basis.
4. Your report will appear in the main window or be exported into your chosen format.
1. Select your
group.
2. Select the report you want to run.
3. Choose the filters you would like to apply to the
report or simply hit generate/export to run the report. See above for a description of each button.

Guide to Understanding Customer Reports - May 2012
87
Viewing a claim
Viewing a claim is an easy way case managers can get detailed information pertaining to
specific claims, including Comcare contact information, claim costs and estimates and a
complete listing of incapacity determinations for the claim.
Step 1
Select ‘View Claim’ from the initial CIS home screen and then click on ‘Execute’.
Step 2
Search for the claim you would like to view.
1. You can search by claim number or by the claimant’s name.
2. Once the name or claim number is entered select ‘Search’ at the bottom.
3. The search results will appear in blank middle section of the screen. Select the claim
you require - it will turn a shade of blue when selected.
4. Click ‘Next’ to access the detail of the claim.
1. Search by claim number or name.
2. Click
‘Search’ to find the claim
3. A listing of claims will
appear here after searching. Select the claim you
require.
4. After selecting the claim click next.

Guide to Understanding Customer Reports - May 2012
88
Step 3
The view claim screen provides details on claim registration and condition, the employee,
the agency that is liable for the employee’s injuries, financial information and incapacity
determinations. For privacy reasons there is no detail that can be shown in this guide.
Note: printing a list of incapacity determinations
The View Claim function has been updated to allow for the export of the list of incapacity
determinations for the claim being viewed. To export and print the list of incapacity
determinations:
- Select the Incapacity tab on the View Claim Screen
- Use the Export button on the right hand side of the screen (it appears next to the
date field “reached 45 weeks”)
- On the Export window that pops up, choose the format that you would like to
export the list into (.csv, .pdf, and .rtf are all available).
- Use the Export button on the pop-up window - just like generating a report, this
will produce the data in a stand-alone document.
The information available in view claim can be viewed through these 5 tabs.

Guide to Understanding Customer Reports - May 2012
89
Cost Centre Restrictions
The ‘manage cost centre access’ section of CIS allows CIS administrators who administer
agencies that have chosen to restrict user access by cost centre the ability to control the
access of users within their agency.
Step 1
Select ‘Manage Cost Centre Access’ from the initial CIS home screen and then click on
‘Execute’.
Step 2
Select your agency from the list - it is likely there will only be one selection available. Once
selected the agency name will turn a shade of blue.
The CIS agency administrator can then choose to administer access by 2 ways. Through
Manage User – Which allows the administrator to select a user and assign cost centres to
them. OR Manage Cost Centre – Which allows the administrator to select a cost centre and
assign particular users to it.
1 - Select the agency. 2 - Then select either ‘Manage
User’ OR ‘Manage Cost Centre’.

Guide to Understanding Customer Reports - May 2012
90
Preferences
The preferences screen is where the user can reset their password, create their own secret
question and answers for automatic password resets, and manage their favourite reports.
Step 1
The preferences screen can be accessed from any screen within the CIS application. It is
always a link in the top left hand corner near help.
Step 2
There are 3 tabs that are accessible through preferences - ‘Password’, ‘Security Questions’
and ‘Favourite Reports’. The password screen allows the user to reset their current
password.
Password Tab – To change your password type the password you used to log into CIS into
the ‘Current Password’ field. Then enter a new password that is at least 8 characters long
and containing at least 4 alpha characters and 2 numerical characters into the ‘new
password’ and ‘confirm password’ fields. Click ‘Save’ to save the password OR click ‘Clear’ to
start again. The ‘OK’ button will take you back to CIS.
Preferences can always be accessed through this
link.
Preferences has 3 tabs. 1 – Password. 2 - Security Questions. 3 – Favourite Reports.

Guide to Understanding Customer Reports - May 2012
91
Security Questions Tab – The ‘Security Question’ tab allows the user to create 3 secret
questions that can be asked if the user forgets their password. By answering a secret
question the user can automate the password reset which will send the user a new
password via without having to contact the CIS helpdesk.
Favourite Reports Tab – The ‘Favourite Reports’ tab allows the user to manage which
reports appear in the report category ‘Favourites’. This is particularly useful if a user logs on
periodically to run the same reports, for example for a monthly report to management. To
create a listing of your favourite reports:
Step 1 – Select the report you wish to ‘Favourite’ from the ‘Available’ list of reports.
Step 2 – Click on the ‘Add’ button. The report should now appear in the ‘Current’
window.
Step 3 – Click ‘Save’ to save your reports or clear to start again.
Step 1 – Select the report you would to make a favourite from the available field.
Step 2 – Click ‘Add’ and the report will move to the ‘Current’ side
Step 3 – Click ‘Save’ and the changes will be saved.

Guide to Understanding Customer Reports - May 2012
92
Section 5 – CIS Glossary of Terms
A detailed listing of each field within reports can be found under the help material for each
individual report. Below is listing of common terminology used within Comcare and as such
within CIS.
Term Definition
Agency of Injury Classification intended to identify the object, substance, or
circumstance that was principally involved in, or most closely
associated with, the point at which things started to go wrong and
which ultimately led to the most serious injury or disease.
Body Location Classification intended to identify the part of the body affected by
the most serious injury or disease.
Calendar Year January to December.
Case Manager Workplace-based manager appointed and trained by the employer
to undertake Case Management activities. Responsible for
initiating, co-ordinating and monitoring the rehabilitation process.
Cheque Receiving Cost
Centre
The cost centre to which Comcare sends the incapacity
reimbursement cheques.
CIS Customer Information System
Claims Manager Comcare employee responsible for management of the claim.
Closed Claims Claims can either be closed manually, or automatically by Pracsys
when they meet specific criteria (i.e. no activity for a specified
period of time).
Common Law Payments Amounts paid to an injured worker as a result of Third Party or
Common Law action.
Cost to Date Payments made to date (payments as at the date of extraction
minus recoveries) on claims excluding any GST amount claimable
by Comcare as an Input Tax Credit. Unpaid liabilities against a
claim (eg outstanding incapacity payments) will not be included in
cost to date.
Determination A decision accepting or rejecting a claim made by Comcare
Australia in accordance with specific sections of the SRC Act.
Financial Year July to June.
Incapacity Incapacity is:
An inability to engage in any work.
An inability to work at the same level as undertaken immediately
before the injury.
Incapacity benefit Incapacity benefit is a payment made by Comcare Australia,
directly or indirectly, by way of income maintenance.

Guide to Understanding Customer Reports - May 2012
93
Term Definition
Incapacity Status The current incapacity status of the claim as recorded on
PRACSYS:
A At work (claim open)
I Incapacitated
G GRTW (graduated return to work) or partial incapacity
D Deceased
C At Work (claim closed)
D Error code, treated as incapacity
F Error code, treated as at work
Incapacity Duration The number of calendar days on benefit due to incapacity
excluding the current spell.
Incapacity Spells The number of separate periods on benefit due to incapacity.
Periods which occur one day or less are not counted.
Liable Cost Centre This is the Cost Centre which has accepted liability for a claim ie.
the claimant was attached to this cost centre at the date of injury.
Mechanism of Incident
(MOI)
Classification to identify the action, exposure, or event which was
the direct cause of the most serious injury or disease.
Nature of Injury Classification to identify the most serious injury or disease
sustained or suffered by the injured worker.
Non-Incapacity Includes medical, rehabilitation, lump sum and travel costs.
Open Claims Currently active claims
Payroll Cost Centre The daily incapacity advices are generally sent to the Personnel
sections in agencies. These are called Payroll Cost Centers and
each claim needs to have one of these recorded against it.
PRACSYS Comcare’s workers' compensation data warehouse for registering
and processing claims, records benefit payment and OHS
notification/reporting statistics, and provides management
information reports.
Premium The premium charged by Comcare is the contribution of an
agency in respect of the estimated costs of that agency's workers'
compensation costs for a given financial year. It is based on fully
funded principles and is designed to be responsive to the agency's
claims experience.
Pre-Premium Claims Claims with dates of injury prior to the introduction of Comcare’s
premium system on 1 July 1989. These claims and the resulting
expenditure may also be called 'uninsured'.
Rehabilitation A program offered to injured employees to assist them to return
to their pre-injury employment status, or as close as possible to
that status. Rehabilitation is only one aspect of Comcare’s return
to work program for injured employees.
Re-Opened Claims Claims that have been closed and re-activated.

Guide to Understanding Customer Reports - May 2012
94
Term Definition
Return to Work Plan A document detailing an injured employee’s rehabilitation
program including return to work objectives, time frames and a
breakdown of proposed services and costs.
TOOCS Codes Type of Occurrence Classification System v 3 (NOHSC, NDS
Codes)
Total Cost Claim Cost to date plus the likely future cost as at the date of the
latest case estimate update.
View (Pracsys) Cost Centre grouping specified by your agency and set up by
Comcare (i.e regional or state structure).

Guide to Understanding Customer Reports - May 2012
1300 366 979 | COMCARE.GOV.AU