Guide for Benchmarking Residential Energy Efficiency ... · New program managers will find that...
49
Residential Program Benchmarking Guide 1 DRAFT – November 14, 2014 Guide for Benchmarking Residential Energy Efficiency Program Progress Prepared for the Building Technologies Office Energy Efficiency and Renewable Energy U.S. Department of Energy by Vermont Energy Investment Corporation Under contract to Eastern Research Group REVIEW OPPORTUNITY Home energy upgrade programs are being sought to review this draft Guide for Benchmarking Residential Energy Efficiency Program Progress. Your participation in this phase of the Guide’s development will be help lay the foundation for a future Better Buildings Residential Network Benchmarking initiative. You can help make program progress benchmarking more common among residential energy efficiency programs and gain new insights from the sharing of consistent information across programs. The Guide will help residential program managers: - Identify metrics that measure their goals - Develop a program benchmarking plan to identify their program's strengths and weaknesses - Measure progress for years to come by establishing a baseline of performance - Gain insights from comparing to peers - Communicate success with key stakeholders Please send comments to: Dale Hoffmeyer | [email protected].
Transcript of Guide for Benchmarking Residential Energy Efficiency ... · New program managers will find that...

Residential Program Benchmarking Guide 1 DRAFT – November 14, 2014
Guide for Benchmarking Residential
Energy Efficiency Program Progress
Prepared for the Building Technologies Office Energy Efficiency and Renewable Energy
U.S. Department of Energy
by Vermont Energy Investment Corporation
Under contract to Eastern Research Group
REVIEW OPPORTUNITY
Home energy upgrade programs are being sought to review this draft Guide for Benchmarking
Residential Energy Efficiency Program Progress. Your participation in this phase of the Guide’s
development will be help lay the foundation for a future Better Buildings Residential Network
Benchmarking initiative. You can help make program progress benchmarking more common among
residential energy efficiency programs and gain new insights from the sharing of consistent
information across programs.
The Guide will help residential program managers:
- Identify metrics that measure their goals - Develop a program benchmarking plan to identify their program's strengths and
weaknesses
- Measure progress for years to come by establishing a baseline of performance - Gain insights from comparing to peers - Communicate success with key stakeholders
Please send comments to: Dale Hoffmeyer | [email protected].

Residential Program Benchmarking Guide 2 DRAFT – November 14, 2014
Table of Contents
Executive Summary ...................................................................................................................................... 3
Introduction.................................................................................................................................................... 4
Step 1. Use Program Goals to Guide Benchmark Planning ......................................................................... 4
Step 2. Identify Potential Metrics that Measure Your Goals ......................................................................... 6
Step 3. Determine How You Will Collect Information ................................................................................... 8
Step 4. Assess the Level of Effort and Finalize Metrics .............................................................................. 12
Step 5. Put the Process in Place and Get Started! ..................................................................................... 14
Step 6. Share Results Effectively ................................................................................................................ 16
Step 7. Benchmarking Against Peer Programs .......................................................................................... 18
Additional Resources and References ........................................................................................................ 21
Appendix A – Recommended Benchmarking Metrics ................................................................................ 23
I. Table 1: Gross Program Outcome Metrics ................................................................................ 27
II. Table 2: Normalized Program Progress Metrics ........................................................................ 33
Appendix B – BBNP Peer Group Benchmarking Examples ....................................................................... 39
Appendix C – Planning Worksheets ........................................................................................................... 47
Special appreciation to Ashley Fournier, Southeast Energy Efficiency Alliance; Paul Grimyser and Carter
Dedolph, Focus on Energy; Lawrence Masland, Massachusetts Department of Energy Resources; Alice
Rosenberg, Consortium for Energy Efficiency; and Vince Schueler and Emily Salzberg, Washington State
University for commenting on the first draft.
DISCLAIMER
This document was prepared as account of work sponsored by an agency of the United States
Government. Neither the United States government nor any agency thereof, nor any of their employees,
makes any warranty, express or implied, or assumes any legal liability or responsibility for the accuracy,
completeness, or usefulness of any information, apparatus, product, or process disclosed, or represents
that its use would not infringe privately owned rights. Reference herein to any specific commercial
product, process, or service by trade name, trademark, manufacturer, or otherwise, does not necessarily
constitute or imply its endorsement, recommendation, or favoring by the United States government or any
agency, contractor or subcontractor thereof. The views and opinions of authors expressed herein do not
necessarily state or reflect those of the United States Government or any agency, contractor or
subcontractor thereof.

Use Program Goals to Guide
Benchmark Planning
Step 1
Identify Potential Metrics
that Measure Your Goals
Step 2
Determine How You Will
Collect Information
Step 3
Assess the Level of Effort
and Finalize Metrics
Step 4
Put the Process in Place and
Get Started!
Step 5
Share Results Effectively
Step 6
Consider Benchmarking
Against Peer Programs
Step 7
Residential Program Benchmarking Guide 3 DRAFT – November 14, 2014
Guide for Benchmarking Residential Energy Efficiency Program Progress
Executive Summary
In order to effectively engage customers and achieve savings,
the most-successful Residential Energy Efficiency Programs
continually assess their performance and enhance their
programs. Program benchmarking provides valuable
information that can lead to better program design and delivery
decisions. This Guide provides an inventory of recommended
Residential Program Progress Metrics, describes approaches
for using them effectively, and gives examples of peer
benchmarks from the Better Buildings Neighborhood Program
for comparison. In addition, the Guide lays out a step-by-step
action plan for developing an internal Benchmarking Plan for
your residential program. Information is presented in the form
of high-level, actionable guidance on key topics that need to be
addressed.
The recommended benchmarking metrics described in this
Guide include 26 indicators of total program impact. They
provide information on participation, saving, and spending as
well as other program and market performance. An additional
21 metrics, calculated from the program impact data, offer
standardized information useful for comparing year-to-year or
with other programs. These can also guide design
improvements through a better understanding of program
efficiency, energy savings, marketing and sales performance,
and customer benefits.
In order to provide information that is clearly understood,
consistent over time, and comparable to others, these
recommended metrics are based on standard definitions.
Guidance is also given on establishing internal consistency and
tailoring the metrics to meet the characteristics of individual
programs.
Depending on your current operations and level of experience,
you may not need to implement all of these steps, but each
should be considered when developing a benchmarking plan.
New program managers will find that this Guide offers a clear
pathway to effectively measuring your program’s
progress. While more-experienced managers are likely already
measuring program performance, reviewing the metrics given
here may help you identify additional useful information to add
to your current plan.

Residential Program Benchmarking Guide 4 DRAFT – November 14, 2014
Introduction
Program benchmarks are extremely important for effective energy
efficiency upgrade programs to set realistic goals, measure
progress over time, and identify areas for improvement. In recent
years, hundreds of communities have worked to promote energy
efficiency upgrades in homes through utility-sponsored programs,
Home Performance with ENERGY STAR, and the Better Buildings
Neighborhood Program (BBNP). Their challenge – to address
financial, educational, and service access barriers that stand in the
way of making home improvements that save heating fuel and
electricity and reduce homeowner energy costs. Delivering
programs to address these challenges in a way that is effective
and efficient provides the best chance for making a difference. But
it may be hard from year to year to determine success when
budgets, markets, and program delivery are evolving. The result of
integrating benchmarking into your program design planning is
better information that can lead to more-effective programs, higher
impact, and a stronger basis to secure future funding.
Identifying good information to track requires thoughtful
consideration of what you want to learn. Putting a system and
process in place to gather that information and to use it wisely can
be costly and time consuming. Like all such efforts, deliberate
planning as you lay out your process will provide benefits down the
road. Follow the step-by-step procedures laid out below to:
identify metrics that will provide useful information to
strengthen your programs;
put an effective process in place to collect, track, and
analyze data;
develop benchmarks that reflect your program performance
across time and in comparison to others; and
report about your performance in effective ways.
Step 1. Use Program Goals to Guide Benchmark Planning
Re-visit your program objectives
Benchmarking is a powerful tool to help gather feedback about progress toward meeting your program
objectives. Keeping those objectives front and center as you design a benchmarking strategy provides a
focus for making decisions. Start the process by specifically listing your program objectives. Worksheet
#1, provided in the Resources section, gives you a template to use for this.
As the manager of an energy efficiency program, you are often asking questions about the performance
of your program. Am I succeeding or failing? How do I really know? Is my program becoming more
effective compared to last quarter, or last year? Are my goals too low or too high compared to my peers?
Ultimately, all program managers are accountable to funders and regulators (e.g., governor, city council,
board, legislature, utility, public utility commission) and to other stakeholders (homeowners, community
leaders, contractors, media, etc.), who all want to see progress toward program objectives in terms of
measurable outputs: the results produced through your program activities.
ABOUT BENCHMARKING
Benchmarking is the process of gathering, tracking, and assessing a program’s current performance against past results in order to measure progress over time, or to compare results to a peer group.
Why benchmark? By making performance measurable and visible, program administrators can improve the design and delivery of their programs and enhance program successes. Benchmarking will:
Help you set realistic goals and define success.
Allow you to communicate progress.
Assist with program management by:
Letting you assess where to adjust program design and delivery.
Establishing the cost necessary to achieve program outcomes.
Supporting and justifying continued investment in your program.

Residential Program Benchmarking Guide 5 DRAFT – November 14, 2014
Prepare a list of questions relevant to those objectives
The figure below illustrates a useful way to go about moving from the high level of identifying program
objectives to the detailed level of finding measurable outcome metrics to track. In this example, a program
with an energy saving goal established by their state legislature might ask these two questions to
determine how well they are meeting that goal. Thinking about the information that would be needed to
answer these questions points to appropriate data to collect and analyze.
At this early stage in your planning, it is effective to re-frame your program objectives as questions to help
make this leap to suitable metrics. Prepare a list of the questions that are relevant to your objectives –
brainstorm about all the things that would be useful to know, without worrying at this point about how you
answer them (more about useful ways to do that in Step 2). Think about which are most important, or
perhaps which seem hardest to answer given your current understanding of how your program is doing.
You might use a simple table like that in Worksheet 1 in Appendix C to help organize your thinking. An
example of Worksheet 1 is filled out below with some common program objectives, and a few questions
about each, and outcome metrics for illustration (these are just examples – see Step 2 for a more-
complete discussion of metrics to consider).
Program Objective Questions to Answer Example Outputs to Measure
Step 1 Step 2
Meet savings target
Were energy savings targets
achieved?
Are more participants or deeper
savings per participant needed to
achieve energy savings goals?
Annual energy saved by fuel type
Lifetime energy saved by fuel type
Program Objective
Meet Savings Target
Questions to Answer
Were energy savings targets
achieved?
Are more participants or
deeper savings per participant needed to achieve energy
savings goals?
Example Outputs to Measure
Annual Energy Saved
by fuel type
Lifetime Energy Saved
by fuel type
# Program Participants

Residential Program Benchmarking Guide 6 DRAFT – November 14, 2014
Program Objective Questions to Answer Example Outputs to Measure
Step 1 Step 2
Provide customer benefit
What was the average reduction in
customer bills?
How much energy was saved
compared to the total energy
used? Was it a significant change?
Energy bill savings
Percent energy saved
Increase market penetration
How effective are program
marketing campaigns and
contractors’ sales efforts?
What percentage of the
market/available stock was
improved?
Conversion rates from leads to
assessments to upgrade projects
Number of buildings upgraded
Optimize program efficiency /
cost-effectiveness
Did the total investment in building
improvements exceed the amount
invested to encourage those
improvements?
Program costs
invoiced project cost
Support workforce development
Is the professional workforce
growing?
What is the supply of the active
workforce?
Number of individuals (assessors,
raters, and contractors)
Step 2. Identify Potential Metrics that Measure Your Goals
Choose metrics to consider for your benchmarking plan
The next step is to develop a preliminary list of metrics to help track progress toward your goals. You may
find it helpful to use the Worksheet you filled out in Step 1 as a tool for choosing potential metrics to
assess. Review the questions you identified, and list all the metrics that could provide information to
answer them. Do not worry about data availability,
feasibility, or stakeholder feedback at this stage – you will
address these issues later (Step 3). Just think about what
information would be useful.
Before you start this task, we want to draw your attention
to two tables in Appendix A. These were specifically
developed to make it easy for you to complete Step 2 by
presenting an extensive set of potential metrics to
consider. The metrics tables are preceded by a set of
standard definitions and include recommended
calculations and data collection guidance.
Program output metrics
Table 1 in Appendix A provides a list of gross program
output metrics. You may already track or report many of
these to funders or other stakeholders. As such, they are
the basic descriptive information about your program and
have value as indicators of total program size and impact.
In addition, they represent the raw data necessary to
calculate the progress metrics listed in Table 2 (see
below). Table 1 lists these Gross Program Output Metrics,

Residential Program Benchmarking Guide 7 DRAFT – November 14, 2014
CUSTOM METRIC DEVELOPMENT
While programs share many objectives in common, some programs have specialized objectives established by
their funders or by the unique characteristics of the markets and constituents they serve – for example, a particular
focus on economic development or a mission to address the needs of local low-income residents. In such cases,
outcome metrics should be specially designed in order to assess progress toward these goals. Think about the
types of things that are good proxies for the information you need, be sure that they are specific and measureable,
and that the data needed are readily available. Here are two examples of custom program metrics:
A program that wants to increase the comprehensiveness of the upgrade projects it supports tracks:
Average air leakage per project;
Percent of projects with sq. feet of insulation added equal to at least 50% of a home's finished sq. feet of
floor area; and
Percent of projects with both shell measures and heating system measures installed.
A program that wants to support the development of a high-quality local workforce tracks:
Training budget (in total, and average per participating contractor), and
Number of workers that achieve professional certification.
Consider whether there are other metrics your program might track that are valuable internally for program
management, even if they are difficult to aggregate across programs or use as a peer benchmark.
the value of each toward measuring the success of your program, challenges you may face collecting
data, and recommendations on standard approaches.
Metrics useful for progress comparisons
It is important to measure your program’s gross output, but gross outputs have limited value in
benchmarking your program progress over time, or compared to similar programs in another locations
(peer programs). For example, an increase or decrease in the number of participants may be explained
by differences in budget, market size, or program design. These differences in underlying context make
direct comparisons difficult.
In order to facilitate comparisons, output metrics can be expressed in some relevant per-unit way, or
normalized. Table 2 in Appendix A lists Normalized Progress Metrics, designed to facilitate comparison
across years and across programs. In order to help you select metrics for your plan, Table 2 also lists the
potential value of each metric, and comments on data collection and analysis It also gives the method for
calculating the metric (calculations are based on the metrics found in Table 1).

Residential Program Benchmarking Guide 8 DRAFT – November 14, 2014
Step 3. Determine How You Will Collect Information
Now that you have identified what you would like to know about your program, you should establish how
you will gather this information.
Review characteristics of effective data systems
Many different options exist to collect, track, and analyze data. To efficiently measure your progress, your
data collection and analysis process should be:
Reliable – so that you can have confidence in the quality of your data.
Easy – to help increase buy-in from stakeholders and facilitate finding staff to perform the data
collection.
Consistent – to ensure that changes (for example, in staffing) do not affect the data collection effort
or quality over time, and so that you can be confident that the data you will analyze is what you
expect it to be.
Timely – so that the data collected can be used to assess program performance without delay, and
so that analyses can be available for any reporting requirements.
Transparent – so that definitions of assumptions are clear and the information collected allows for
comparisons over time and across peer programs, even if analyses and reporting requirements
change.
Outline your data collection and analysis needs
The following steps provide some guidance for outlining your data collection and analysis effort.
1. The output metrics selected for benchmarking dictate the data required to calculate them, so the first
step is to identify all the data inputs required.
2. Determine the granularity and collection frequency that your chosen metrics will require to be of
greatest value. Make the level of detail appropriate for your needs. For example, should you track
savings at the program level, contractor level, project level, or energy efficiency measure level?
Should you assess how metrics evolve from year to year, quarterly, monthly, or weekly? Avoid
collecting details that you will not subsequently use.
3. Identify who owns the data and who will be providing it – internal program staff; contractors; utilities;
finance partners; etc. It is important to identify the datasets necessary for benchmarking. This could
include internal program and budget information, energy project measures and timelines, project
invoice and cost information, and energy consumption data. Collecting this information is aided by
establishing clear roles and identifying avenues for data access. Delegating collection responsibilities
may help create a more manageable process and can empower end users in the decision-making
process.
TIP: Want to maximize the chances that your data collection system works smoothly and is used by all stakeholders in the way you hoped? Interview data providers, vendors, and others as you design the process to assure that it is feasible and meets their needs as well. For example, ask:
Data owners (e.g., contractors, building owners, utility)
Is the information available/accessible? How is it being tracked and collected now? Are you willing to provide it? What is the burden/cost to provide it? Will you want to see the results?
Other program managers and third-party data solution vendors
What is available? What is being used? Will it reduce a burden? How? How soon? What will it cost? How flexible is it? Does it provide benefits for multiple program objectives?

Residential Program Benchmarking Guide 9 DRAFT – November 14, 2014
A table like the one below can help you organize all this information (and provides a basis for later steps
as well), as follows:
Start by listing each metric that you are considering (from Step 2).
For each, identify all the data needed to calculate it, along with specific definitions to clarify
exactly what is required.
Specify the level at which the data should be tracked – program, contractor, measure, etc.
Identify the source or owner of each part of the information, and how often it should be reported.
We will revisit this table again in Step 4 to add information on feasibility and cost of collection, and to
prioritize the metrics. Data needed to characterize average customer savings is shown as an example in
the form below; a blank worksheet version of this table is available in Appendix C to help you consolidate
this information (see Worksheet 2).
Metric Data Needed to
Calculate (Definition) Data Collection
Level Data Owner
Collection Frequency
Step 2 Step 3
EXAMPLE: Average customer monetary savings per upgrade across program
Estimated Annual Energy Bill Savings in Dollars
Per Home Upgrade Project
Home Assessor Contractor
Each Occurrence
Unique Home Upgrade Project Identifier
Per Home Upgrade Project
Home Assessor Contractor
Each Occurrence
Upgrade Completion Date (define this as the date of invoice)
Per home upgrade project
Contractor Each Occurrence
Develop data collection procedures and identify tools
Procedures and tools for data collection, processing, and analysis can span a wide range of options from
simple to elaborate, so think about what will meet your needs, and how much time and money you
realistically want to devote to it. Tools can be as simple as a custom-made spreadsheet that allows you to
keep all your data in one place, or a more-complex database designed to store data and produce custom
reports. At the more-sophisticated end of the spectrum, you could also choose to purchase third-party
software designed specifically to track home improvement program data, allowing you to collect a wide
range of data at the customer, contractor, and program level. Programs like Clean Energy Works
leverage investment in software that tracks project, customer, and lender data. This provides information
for reporting to funders and lenders, feedback for program design, and operational efficiencies such as
managing contractor timeliness in terms of responding to homeowners.
Investing time and resources to thoughtfully plan a data collection, transfer, and storage system will be
worth the effort and is less costly than working out the process as it is developed and implemented. It is
beyond the scope of this Guide to provide technical-level details on designing a data system. However,
these are the key topics that should be addressed as you plan out your processes. Consider:
Data collection – Data may come in through paper documentation, online forms, contractor surveys,
software input tools, etc. As much as possible, use templates, checklists, or input forms and
processes already in place to leverage efforts. Be sure to use data that is “stable” – at the point of
the invoice or later – and that information is provided by reliable sources.

Residential Program Benchmarking Guide 10 DRAFT – November 14, 2014
Data quality and completeness – Final outcomes are only as good as the data that goes into the
system. Consider adding data review and verification steps to the process.
Data transfer – Be sure that formats are compatible and that security and confidentiality of any data
transfers from one collection platform or process to final tracking and analysis tools is a priority.
Data aggregation and storage – Inventory the type of tools that you will use as the data repository.
Determine whether you will only need to aggregate data at the whole-program level, or whether you
want to retain information aggregated by sub-categories (e.g., by contractor or by type of upgrade
measure) for use in targeted metrics about performance of these groups.
Calculations, analysis, and data visualization – consider what output you may want to generate,
and the best tools to develop.
TIP: Consider involving your external evaluators in your data system design process. They will be one of the principal reviewers of the results of your data collection and analysis, so they will have recommendations on useful ways to collect and track information. In addition, they have worked with many other programs, and can therefore help you identify more (and less!) effective systems and processes.
Some processes may appear low-cost and easy to use, but may prove to add to staff time or become
cumbersome when implemented at the program scale. For example, paper- or spreadsheet-based
information collection processes are often simple to develop and roll-out, but they may become
cumbersome when aggregating and storing data from many sources. More-sophisticated software
products can be expensive, whether developed internally or purchased, but they may be worth
considering if they provide value in multiple ways, such as saving staff time, improving coordination, and
professionalizing reporting. For example, some are designed to standardize data collection in the field,
track and report on project timeline and performance for both contractors and customers, and capture and
analyze a large array of important project information.

Residential Program Benchmarking Guide 11 DRAFT – November 14, 2014
Data Collection in Action
The Local Energy Alliance Program (LEAP) is an organization doing Home Performance with ENERGY STAR
efficiency upgrades in Virginia. They collected data on their program performance, marketing efforts, contractor
performance, and their customers’ experience using a variety of tools, including:
Better Buildings Neighborhood Program reporting Excel sheets – for reporting to funders.
Internally designed residential summary Excel spreadsheets – for monthly program summaries.
Third-party software – for individual customer energy profiles, project management tools, and savings, costs,
and measure data for upgrades.
Their performance data tracking system allows them to monitor many of the important metrics recommended in this
guidebook. For example, they track program costs using an Excel tool. They also monitor assessment-to-enrolled
customer conversion rates using third party software that lets them track results and manage program data:
Clean Energy Works Oregon (CEWO) has grown since its inception and now handles over 1,500 simultaneous
projects. Project, customer, and lender data are all integrated into third-party project data-tracking software that
contractors, customers, program managers, and lenders can access.
The software used also allows them to track many metrics, including conversion rates, average time at each project
stage, volume of applicants and project, program spending, economic impact of the program, and marketing campaign
success data. The data platform also allows them to compare forecasted metrics and actual results, report performance
to program partners (city, state, DOE), and identify needed tweaks to program design. Data collection and tracking can
take a variety of forms and can involve a combination of several tools, providing a range of outputs in table of graphic
format, as illustrated below
.

Residential Program Benchmarking Guide 12 DRAFT – November 14, 2014
Step 4. Assess the Level of Effort and Finalize Metrics
There will be tradeoffs in cost and value for every
metric you consider. Because the objective of
benchmarking is not just to collect lots of data but rather
to inform program decisions, you will want to select the
most-effective approach, balancing the value and
relevance of the data against the costs and burden of
collection and analysis before you finalize your list of
metrics.
Assess the feasibility, burden, and cost of data
collection and analysis
Collecting and aggregating all the data necessary to
measure program outcomes can present operational
and resource challenges. Be sure to consider the
feasibility of each metric – that is, how available is it
now, or how easy would it be to collect in the future –
as well as any additional burden collecting and tracking it will place on the current process.
Estimate total costs of data collection and analyses, along with ability to collect good-quality data. Make
sure you consider the following costs:
Labor costs, including:
o Labor costs that will be incurred by contractors or data aggregators who own or manage the
data.
o Training costs for staff to learn how to use new data management tools or processes.
o Labor costs for your program staff to aggregate, compile, and analyze the data.
o Labor costs associated with data quality verification.
Tools and processes, including the cost to:
o Develop any in-house tools and processes.
o Purchase and maintain software licenses.
o Contract to receive data from data owners.
In addition, be sure to consider opportunities provided by tools and processes that support multiple data
needs. For example, a third-party project management and tracking tool may appear quite costly at first
glance. However, providing a structured format for collecting reliable information about all the details of a
project – cost, savings, measures installed, time line, contractor information – may justify its up-front
investment, particularly if the data are made available in a format that integrates easily with other program
processes.
Take another look at the Worksheet you began in Step 3 (Worksheet 2 in Appendix C). Capture
information on feasibility, burden, and cost in the additional columns provided, as illustrated in the sample
worksheet below (page 14). Determine the general level of cost, as well the level of burden added to your
processes for each data row. These determinations do not need to be precise – a qualitative ranking,
such as a low, medium, or high rating, should be sufficient to help identify your final priorities.
Pros Cons
Quality of data
Burden
Cost
Level of Stakeholder
Interest
Value to Program Objective

Residential Program Benchmarking Guide 13 DRAFT – November 14, 2014
SEED Data Platform
The Standard Energy Efficiency Data (SEED) Platform is a web-enabled software application that helps
organizations and state and local governments easily manage data on the energy performance of large groups of
buildings. Users can combine data from multiple sources, clean and validate it, and share the information with
others.
This software application provides an easy, flexible, and cost-effective method to improve the quality and
availability of data to help demonstrate the economic and environmental benefits of energy efficiency, to implement
programs, and to target investment activity.
You can find more information about SEED on the DOE Office of Energy Efficiency and Renewable Energy
website: Buildings.Energy.Gov/SEED
BEDES and HPXML
The Building Energy Data Exchange Specification (BEDES, pronounced "beads" or /bi:ds) provides a common
data format, definitions, and an exchange protocol for building characteristics, efficiency measures, and energy use
to support analysis of measured energy performance of commercial, multifamily, and residential buildings. BEDES
functions as a common data specification that a range of tools and platforms can either utilize or map.
The Building Performance Institute (BPI) Standard for Home Performance-Related Data Transfer, commonly
known as HPXML, is a specific data specification developed by the home performance industry. It is one example
of BEDES compliant standard that helps to increase interoperability among tools by mitigating the ambiguity and
transaction costs associated with sharing and aggregating data.
You can find more information about BEDES on the DOE Office of Energy Efficiency and Renewable
energy website: Buildings.Energy.Gov/BEDES
Consider the value and relevance of each metric
Because data collection and analysis is costly, you should plan to measure those metrics that will have
the highest value for assessing your program objectives. At this point, highlight those metrics that provide
the best guidance for your top-priority program objectives on the Worksheet.
Once you have filled out the matrix for all your proposed metrics, you should have the information needed
to identify the most-effective ways to invest your benchmarking funds. Make several iterations if needed,
and keep refining your metrics list until you are satisfied with your selection.
In addition, you have now gathered information in the Worksheet that will be useful as you put your plan
in place and discuss the importance of this effort with others in your organization (see Step 5). This
additional information for our example metric is shown in the table below.

Residential Program Benchmarking Guide 14 DRAFT – November 14, 2014
Metric & Value
Data Needed to Calculate (Definition)
Data Collection
Level Data Owner
Collection Frequency
Feasibility Burden Cost
Step 2 Step 3 Step 4
EXAMPLE:
Average customer monetary savings per upgrade across program
Estimated Annual Energy Bill Savings in Dollars
Per Home Upgrade Project
Home Assessor Contractor
Each Occurrence
Need to specify a method to estimate savings
Need to train on estimating savings. May add to time to business process, but can also be presented to customer as a benefit.
Unique Home Upgrade Project Identifier
Per Home Upgrade Project
Home Assessor Contractor
Each Occurrence
Need a process for assigning. Could be provided or assigned by program.
Low – add a project identifier field to records
Upgrade Completion Date (define this as the date of invoice)
Per home upgrade project
Contractor Each Occurrence
Available on paper or electric form of receipt.
Common business practice
For Assessing Value, Burden, and Cost: LOW MEDIUM HIGH
Step 5. Put the Process in Place and Get Started!
Now that you have selected the data you want to collect and the metrics you want to track, put all your
findings together into a Benchmarking Plan. This formal framework for your benchmarking effort will help
map out the information and resources needed, communicate expectations to staff and stakeholders, and
provide specific direction for all parties to use as the project is rolled out. Consider the following steps as
you finalize your plan.
Secure buy-in from leadership, staff, and stakeholders
Present the results of your metric selection review and your recommendations for the process to your
members or to leadership to make the case for support for your benchmarking effort. This support will
provide legitimacy, resources, and recognition to the process. If needed, be prepared to justify your metric
selection – for example, have multiple scenarios handy to explain why you made the selections that you
made, and stress the value this effort will bring to meeting program objectives.
Formalize your Benchmarking Plan
You can maximize the chances of a successful implementation of your benchmarking plan by mapping
out the steps that need to be taken ahead of time. The full technical details for implementing a data
collection and analysis process are beyond the scope of this Guide. However, the following key steps

Residential Program Benchmarking Guide 15 DRAFT – November 14, 2014
should be included to maximize your chances of a successful roll-out. In addition, the worksheet you
developed in Steps 3 and 4 provides a good source of information for the implementation plan and may
be useful in drafting a statement of work or data system requirements.
1. Build a Benchmarking or Data and Reporting Team, with clearly identified common goals and
purpose, and well-defined roles and responsibilities. This should include internal staff as well as
appropriate external parties – contractors, utility contacts, etc.
TIP: Justifying extra, or different, work to staff and contractors may be easier if the processes and tools put in place make their lives easier or their customers happier – be sure to keep this in mind when designing!
2. Map out an action plan for building and using the system. Consider the following elements:
Tools: Develop, or purchase, the tools and software to facilitate data collection and management.
Consider using templates, tracking processes, and benchmarking tool(s) if available (see additional
resources highlighted at the end of this document). Develop new tools if you do not already have
processes that meet your needs. Engage third-party vendors to assess their products.
Process and procedures: Identify the steps and processes needed to track data and complete
analyses. Provide and enforce use of your chosen, standardized data collection tool and processes.
This will limit data input errors and help assure complete and timely information. Write down data
collection and analysis steps for consistency over time.
Standards: Be sure to provide clear definitions and standardization for data. For example, if a
customer receives an assessment, and later completes a home upgrade, does this count as one or
two “program participants”? When in the process is an upgrade considered “complete”? The more
specific you are the cleaner and more comparable your data will be, even when collected by
different individuals.
Data quality: Be sure to identify the places in the data collection, aggregation, and analysis steps
where data quality and completeness can be assessed. Build steps to reconcile and review data
into the process, and establish protocols to estimate or otherwise deal with missing data.
Training: Ensure staff members, contractors, and other members of the team are trained, which is
one of the best ways to ensure quality reporting from the ground up.
3. Establish timelines and data-transfer protocols that identify who has the data, who needs to send
and/or receive it, and exactly what information is required.
Identify appropriate formats for each type of data transfer and other communication (verbal, emails,
formal memo, template, checklist, software upload, etc.).
Be sure that information is provided in the formats – fields, data type, etc. – that facilitate easy
integration into the program’s data collection framework.
4. Establish a plan for reporting results. Consider who should know about the initial benchmarking plan
and to whom the results will be reported. Map out the type of internal and external reporting and the
information required for each (see Step 6 for more on Reporting).
Plan for feedback and change
Set a timeline to revisit the process at regular intervals. Compile the feedback received from the re-
appraisal process. Plan to re-evaluate current capabilities and the need for additional training or staffing.
Review other tools and processes that may enhance your benchmarking activities. Identify possible gaps,
and update the plan.
Build these questions into your review process:
o Are the metrics being tracked still valuable?
o Is the data quality adequate?

Residential Program Benchmarking Guide 16 DRAFT – November 14, 2014
o Has the type of available data changed?
o Is data being received and tracked in a timely way so as to be useful for planning and project
execution?
o Have the program delivery methods or objectives changed substantively?
o Has the information indeed been valuable in helping to meet program objectives?
o Who is responsible for approving any changes to the benchmarking plan, and does that need to
be updated?
Check-in periodically with contractors and other stakeholders.
o Is the benchmarking process and information useful? That is, does it assist in informed decision
making?
o Is it accessible and usable for external communications with their customers (e.g., progress
toward a goal) as well as their internal planning?
Launch your Benchmarking Effort
Once your plan is in place, test every part using realistic data. Once you are satisfied with the test results,
you can begin data collection and analyses following the strategy you have established. Build a project
timeline with milestones and check the milestones as you reach them to retain the momentum and to feel
that you are making progress towards getting your program benchmarked!
Step 6. Share Results Effectively
Benchmarking involves synthesizing a large amount of data and presenting it in a way that is useful for
making decisions. Therefore, the effort will be most beneficial if you effectively communicate to others not
only your results but also the context of your progress in ways that are meaningful to them. Here are
things to keep in mind as you design ways to present clear and useful results.
Present information in effective ways
Present information in ways that will speak to your target audiences. You will need to interpret the
information appropriately, and provide it through channels (for example, in-person meeting, report,
webinar, posting on Web page, etc.) that best match the specific audience and intended purpose.
Internal information can be more technical and detailed and will usually focus on progress and on
results that inform the work going forward.
Presenting aggregate results to your data owners (e.g. home assessor, participating contractors)
can be valuable feedback and improve data quality when delivered early and often.
Results to be shared with the public are often illustrated at a more-general level, and may be most
effective in summary tables or graphics.
Highlighting how reported data contributes to program results or policy changes can illustrates the
value and may help improve data quality.

Residential Program Benchmarking Guide 17 DRAFT – November 14, 2014
Use appropriate levels of detail in your communications
Details are important for explaining the full picture about the results, but should be used wisely. Define
technical terms used in your communications to minimize the potential for misunderstanding. Be sure to
provide information on units, calculations, assumptions, etc., or other factors that affect your performance,
so that your audience interprets your data correctly. The standard definitions provided with the
Recommended Metrics in Appendix A are a good starting point for common definitions and assumptions
to use. This clarity is also important if you want others to be able to compare your results to theirs.
Provide context for your results
Determine how to present results in a way that will best illustrate the program’s achievements to the
reader, without glossing over important caveats. For example, the wider context can be incorporated by
adding historical events or program highlights as milestones on a graph (see two examples of illustrations
of program performance with milestones below), or by presenting region-wide or national averages side-
by-side with data specific to your case. Determine and share whether circumstances or events unrelated
to the program contributed to or limited its success. Be sure to describe your program thoroughly (LBNL’s
recent Policy Brief on EE Program Typology – see Additional Resources and References section below –
gives detailed characterizations of common program types), and include and explain anything you would
like to say about your program that your results do not tell. Finally, when preparing external reports of
your performance, be sure to give all the program context information described in Step 7 below so that
others will know whether your program is similar to theirs when considering benchmarking against your
results.
TIP – Consider developing and using a program dashboard – a regularly updated, easily accessed
summary report of key metrics – to help monitor program progress toward your goals. Depending on goals
and needs, a dashboard could include energy savings, program satisfaction, jobs created, and cost of
service delivery. They can include detailed graphs with lots of information, or simple meters to quickly
indicate progress, as in the examples below.
Dashboards can be particularly effective for internal feedback. Before designing external dashboards for
any potential users (contractors, customers), understand their needs and level of interest in using them.
TIP – Make sure every table or graph includes units, clearly labeled data points, and a footnote with any other information needed to understand the data in context. The reader should be able to understand a stand-alone table or graph with its caption without referring to the report’s text.

Residential Program Benchmarking Guide 18 DRAFT – November 14, 2014
Step 7. Benchmarking Against Peer Programs
Consider the benefits and challenges of comparing your performance to others
The tables in Appendix A are designed to help you identify possible metrics to use for benchmarking your
own program’s progress over time. You may also want to compare your program’s results to those from
other programs.

Residential Program Benchmarking Guide 19 DRAFT – November 14, 2014
Peer comparisons, or peer benchmarking, can be challenging for two reasons. First, another program
may have used calculations and analysis methodologies, assumptions, or even basic definitions that
differ from yours. The only chance of having useful comparative results is to standardize these elements
of determining values as much as possible.
In the last column of Table 2 in Appendix A, we have identified those
metrics that are most likely to be suitable for comparisons across peer
programs. In order to make such comparisons possible, we have also
proposed standardized definitions and data collection methods for use
when calculating these metrics. Using these standard definitions and
methods will facilitate peer benchmarking. There are a number of other
current regional and national efforts to develop standard glossaries and
assumption sets – links to several of these are listed in the Additional
Resources and References section of this Guide.
The second challenge to peer benchmarking comes from the
identification of suitable peers. There are many reasonable
explanations for differences in program performance that lie in the
context and environment in which the programs are delivered. Here are
several:
The demand for and success of efficiency efforts is often more
comparable within geographic regions because of a number of
shared characteristics within regions:
o Climate affects the types of measures demanded and the
associated savings – air conditioning is more widespread in
the warmer parts of the country; fuel oil and wood make up a
large part of the heating fuel in the northeast.
o Electric rates often depend on local electric generation type and are quite different in different
parts of the country – customers may be more responsive to energy efficiency measures where
energy costs are higher..
o Housing stock age, quality, and type of construction are different across the country – upgrade
projects will naturally have different characteristics.
Regulatory requirements set by state legislation or public utility commissions may prescribe
whether programs may address one or many fuel types, one or several building types (single
family, multifamily of various definitions, or all), and low-income or not. They may also establish the
percentage of budget expenditures on program implementation, evaluation, or incentives.
Program size, age, and complexity – these factors can affect absolute levels of performance
because of economies of scale, comprehensiveness of offerings, staffing decisions, and just plain
experience.
Market characteristics – efficiency potential, market penetration, and features of the labor pool and
economic climate affect program performance.
The most informative peer comparisons will come from programs that share as many of these
characteristics as possible with your program. However, it is rare to find a program that is an exact peer.
Therefore, we recommend that you clearly communicate some basic program characteristics so that
others can understand the degree to which your program may be a peer. Provide information about your
climate, average electric and heating fuel rates, building sectors served, average energy consumption,
and total budget when reporting your results. (Publically available resources to assist in determining this
information are provided in the Additional Resources and References section of this Guide.) Look for or
Better Buildings Neighborhood
Program Peer Benchmarking
Examples
As an experiment in developing peer
benchmarks, data reported from
home energy upgrade programs in
DOE’s Better Buildings Neighborhood
Program were used to create program
benchmarks for 9 normalized
progress metrics in Appendix A.
Information from at least 30 programs
was used to derive the metrics in
Appendix B include:
Average Invoiced Cost/Upgrade
Average Loan Amount/Upgrade
Average Estimated Energy Cost Savings/Upgrade
Average Estimated Energy Savings/Upgrade
.

Residential Program Benchmarking Guide 20 DRAFT – November 14, 2014
ask for this type of information if you use metrics from other programs that you want to use to benchmark
to your program performance.

Residential Program Benchmarking Guide 21 DRAFT – November 14, 2014
Additional Resources and References
Glossaries and definitions
Home Performance with ENERGY STAR Sponsor Guide and Reference Manual – includes a
section on Tracking and Reporting, and a Glossary of Common Terms:
http://www.energystar.gov/index.cfm?c=home_improvement.hpwes_sponsor_guide
Lawrence Berkeley National Lab (LBNL) Policy Brief – Energy Efficiency Program Typology and
Data Metrics: Enabling Multi-State Analyses Through the Use of Common Terminology:
http://emp.lbl.gov/sites/all/files/lbnl-6370e.pdf
Northeast Energy Efficiency Partnerships (NEEP) EM&V Forum Glossary of Terms and Acronyms:
http://www.neep.org/emv-forum/forum-products-and-guidelines/index#glossary
NEEP Regional Energy Efficiency Database (REED) Glossary: http://neep-reed.org/Glossary.aspx
SEE Action Energy Efficiency Program Impact Evaluation Guide:
https://www4.eere.energy.gov/seeaction/publication/energy-efficiency-program-impact-evaluation-
guide
DOE and other public resources to reduce cost and effort of data collection and analysis
Data collection tools and processes
Building Energy Data Exchange Specification (BEDES): http://energy.gov/eere/buildings/building-
energy-data-exchange-specification-bedes
Standard for Home Performance –Related Data Transfer (HPXML) – Building Performance Institute
2100-S-2013: http://hpxmlonline.com/
Standard Energy Efficiency Data Platform (SEED): http://energy.gov/eere/buildings/standard-
energy-efficiency-data-platform
Green Button, an effort to provide electricity customers with easy access to their energy usage data
in a consumer-friendly and computer-friendly format via a "Green Button" on electric utilities'
websites: http://www.greenbuttondata.org/greenabout.html
Home Performance with ENERGY STAR Sponsor Guide and Reference Manual:
http://www.energystar.gov/index.cfm?c=home_improvement.hpwes_sponsor_guide
Savings calculations and analysis
DOE Uniform Methods Project for Determining Energy Efficiency Program Savings:
http://energy.gov/eere/about-us/initiatives-and-projects/uniform-methods-project-determining-
energy-efficiency-program-savings
Lifetime and levelized savings calculations: LBNL – The Program Administrator Cost of Saved
Energy for Utility Customer-Funded Energy Efficiency Programs (pg. 14):
http://emp.lbl.gov/publications
Information for program context
Population and demographic information: American Community Survey
o https://www.census.gov/acs/www/
Information on climate zones:
o http://energy.gov/eere/buildings/climate-zones
https://www4.eere.energy.gov/seeaction/publication/energy-efficiency-program-impact-evaluation-guide

Residential Program Benchmarking Guide 22 DRAFT – November 14, 2014
Information on average electric rates: Use Table 5.6.B of EIA’s Electric Power Monthly Report to
determine the average retail price of electricity for the state where your program operates.
o http://www.eia.gov/electricity/monthly/
Information on average natural gas rates: Use EIA Average Annual Residential Price by State
(Dollars per thousand cubic feet, except where noted).
o http://www.eia.gov/dnav/ng/ng_pri_sum_a_EPG0_PRS_DMcf_a.htm
Information on average energy consumption: Use the Residential Energy Consumption Survey
(RECS) "Per Household (million Btu) Site Energy Consumption" for your state or census division if
state information is not available.
o RECS Survey Data, Consumption and Expenditures: http://www.eia.gov/consumption/residential/data/2009/index.cfm?view=consumption
Housing stock characteristics: American Community Survey
o http://factfinder2.census.gov/faces/nav/jsf/pages/index.xhtml###
Comparative Program Performance Reports:
American Council for an Energy-Efficient Economy (ACEEE) – The Best Value for America’s
Energy Dollar: A National Review of the Cost of Utility Energy Efficiency Programs:
http://www.aceee.org/research-report/u1402
Consortium for Energy Efficiency (CEE) Annual Industry Reports: http://www.cee1.org/annual-
industry-reports
LBNL – The Program Administrator Cost of Saved Energy for Utility Customer-Funded Energy
Efficiency Programs: http://emp.lbl.gov/publications
Find related lessons, resources, and knowledge for residential energy efficiency programs at the Better Buildings Residential Program Solution Center:
Home page: http://energy.gov/rpsc - Information and Handbooks on:
o Market Position & Business Model
o Program Design & Customer Experience
o Evaluation and Data Collection

Residential Program Benchmarking Guide 23 DRAFT – November 14, 2014
Appendix A – Recommended Benchmarking Metrics
The tables given in this Appendix are designed to provide standardized metrics that can be valuable
benchmarks for your program performance. The tables themselves are preceded by a list of definitions
used and guidelines on tailoring the metrics to meet the characteristics of your program.
Table 1: Gross Program Outcome Metrics – provides a listing of metrics that have value as indicators
of total program impact and are likely reported to funders/stakeholders. These are also the primary data
used to calculate the Normalized Program Progress Metrics provided in Table 2.
Table 2: Normalized Program Progress Metrics – useful for comparisons over time or to a peer group,
which are calculated using the metrics provided in Table 1.
Common Terms and Definitions
In order to provide information that is clearly understood, consistent over time, and comparable to others,
we recommend using the following standard definitions when collecting and calculating the metrics
presented in the tables below. In addition, some metrics assume use of a consistent definition within your
program reporting – for example, what constitutes the “completion” of an upgrade project? Decisions
about these items should be made early in the data collection process design.
Standard Definitions
Annual energy savings (also called first-year savings) – A single year of gross annualized incremental
savings (kWh or MMBtu) from program activities and installed measures.
Contractor – A business that provides specific services or installations to building or business owners
that directly improve building performance.
Conversion rate – Percent of projects that move from one stage of an upgrade process to another (e.g.,
the percent of projects that progress from energy assessments to energy upgrades).
Customer-contracted work – A sales transaction between the contractor and the homeowner resulting
in improvement measures paid for primarily by the homeowner. Customer-contracted work may be
eligible for incentives but is distinguished from direct install work in that the homeowner typically has a
choice of contractors and greater flexibility to customize the scope of work based on their own needs or
wants.
Customer contribution – The portion of the total invoice amount, or total installed cost, of a project that
is out-of-pocket for the customer. Generally determined by the invoiced cost minus any incentives or
rebates made to the customer by the program or by other parties (utilities, etc.) if they are included on the
invoice. This amount represents the participant contribution toward the cost of efficiency products and
activities, in contrast to the contribution from programs. Making this determination requires information
about all incentives received by the customer – those from your program as well as any from other
sources.
Direct install measures – Improvement measures installed under an energy efficiency program design
strategy involving the direct installation of measures in customer premises by a contractor sponsored by
the program at no cost to the customer. Such programs generally involve one-for-one replacement of
existing equipment with more efficient equipment. The installation typically occurs during a home energy
assessment. Direct install measures are typically restricted to a specific set of pre-qualified eligible
measures and/or may be subject to caps or other restrictions to meet the program’s cost-effectiveness
guidelines or other criteria. This is in contrast to “customer contracted work” (see definition). Commonly
includes products such as lighting and low-flow shower heads – may also include services such as air
sealing.

Residential Program Benchmarking Guide 24 DRAFT – November 14, 2014
Energy assessor (Home energy assessor, Home performance assessor) – A person who performs a
series of tests in a building to identify opportunities for improved home performance and/or rate or score
the homes energy performance.
Gross savings – The change in energy consumption resulting from program-related actions taken by
program participants regardless of why they participated. Also means savings as measured at the end-
use site (customer’s meter).
Invoiced cost – Total invoiced cost is the full cost of the installed home energy upgrade project, including
homeowner contribution, incentives, and other rebates. Be sure to the value of any program incentives
and/or incentives from other programs (such as utility rebates, etc.) included in invoice cost in order to
also calculate Customer Contribution (see above).
Lifetime energy savings – The expected gross savings (kWh or MMBtu) over the lifetime of the
measures installed under the program. Calculated by multiplying the savings from each measure by its
measure life (see Additional Resources and References: Savings calculations and analysis section for
calculation assistance).
Measure (or energy measure) - A specific action that a building owner can take to improve a building’s
structure or performance.
Program costs (or spending) – Includes administrative, education, marketing and outreach costs;
evaluation, measurement, and verification (EM&V) costs; and financial incentives paid to customers,
contractors, and other upstream market allies (retailers, manufacturers, etc.). This does not include seed
funding for loan programs, customer costs, or program administrator performance incentives earned for
exceeding goals (or penalties assessed for shortfalls). For example, the following cost categories were
used in the 2013 Annual Report for the Home Performance with ENERGY STAR program.
Program Administration
☐ Marketing, Outreach and Customer Acquisition
☐ Program Administration
☐ Quality Assurance
☐ Research & Evaluation
Total Program Administration
Consumer Incentives
☐ Costs of Direct Install
☐ Other Consumer Incentives & Rebates
☐ Consumer Financing Costs
Total Consumer Incentives
Contractors Incentives
☐ Contractor Training & Certification
☐ Contractor Production Incentives
Total Contractors Incentives
Definitions that require a program-specific decision – make a determination about these
early in your process
Active contractor – You must have a definition for “active contractor” that makes sense in light of the
market and the program delivery structure, such as active contractor companies are those approved by
your program, but it may be more useful to define active contractors as those contractors that actually
reported completing upgrades during the reporting period. When presenting your results, it is important to
present how this has been defined. This definition for active contractors is not intended to define who may

Residential Program Benchmarking Guide 25 DRAFT – November 14, 2014
participate in a program. It is only for the purpose of presenting the results of the program and therefore
best relies on the actual number of contractors that contributed to those results.
Recommendation for peer comparison – Define an active contractor as one that has completed at
least one upgrade during the reporting period.
Energy assessment (Home energy assessment, Home performance assessment) – A series of tests in a
home or building that reveals opportunities for improved energy efficiency, such as poor insulation and air
leaks. Also known as “assessment”, “audit”, or “evaluation.” This definition includes assessments
performed by a trained assessor and excludes on-line or do-it-yourself (DIY) assessments. An energy
assessments performed by a trained assessors may vary based on the type of tests performed: air
leakage test, duct leakage test, combustion safety test and infrared scan.
Recommendation for peer comparison – Define an assessment as one completed by a trained
assessor rather than by the customer.
Home energy upgrade (Energy upgrade, Home performance upgrade) – Individual measures or a group
of measures installed for the customer to make a home or building more energy efficient, provide better
comfort, and/or save money. Includes only customer-contracted upgrades and not direct install measures.
Multiple upgrades may occur on the same house, but at different dates, over a period of time, and by
different contractors. You will need to decide how these will be aggregated. Does each upgrade
transaction (or invoiced project) count, or does a home count once regardless of the number of upgrade
transactions? How this is addressed will affect each metric that is determined on a per-upgrade basis:
ex., estimated energy savings. Projects that include only measures that are directly installed by the
program do not fall into this category (see Direct install upgrades above).
Recommendation for peer comparison – Define an upgrade as an invoiced project or transaction
excluding measures directly installed by the program.
Lead – A potential customer of a program or contractor. Leads can come from direct program marketing,
sales calls made by contractors, on-line referrals, or other methods of identifying interested customers.
Tracking time from lead identification to actual upgrade work, or conversions from lead to assessments or
upgrades, requires that the initial lead have an identifiable customer associated with it (in contrast with
mass marketing activities).
Recommendation for peer comparison – Track leads for outreach types that can identify the
specific customer involved.
Savings for combined-fuel programs – Some programs promote activities designed to reduce
consumption of more than one fuel type (electric and natural gas is the most common combination).
Some measures provide savings for both fuels – appropriate methods should be used to allocate and
track savings for each fuel type.
Recommendation for peer comparison – Track electric, natural gas, and other fuel savings
separately; calculate total savings by converting all to MMBtu and aggregating as well to provide a
single value for the program.
Costs for combined-fuel programs – If the program promotes activities designed to reduce
consumption of more than one fuel type, costs must be allocated across categories if metrics for each fuel
savings are to be calculated separately. Cost data should be tracked separately for activities and
measures that address only one fuel type. Allocations of cost can be made for activities that address
measures that reduce consumption for more than one fuel type.
Recommendation for peer comparison – Track costs that can be related to separate electric,
natural gas, and other fuel saving activities separately. For costs not directly tied to specific
measures (such as admin or marketing costs) or for multiple fuel measures, one commonly used

Residential Program Benchmarking Guide 26 DRAFT – November 14, 2014
method is to allocate any costs that cannot be directly attributed to a specific fuel program in the
same proportion as that fuel’s share of the total savings.
Guidelines for using the Metrics Tables
Program components of interest
Many of the metrics included are represented in general format and may be calculated for any of a
number of program components of interest by inserting the appropriate information as measured for that
component – indicated by RED text in the metrics descriptions in the tables. Decisions about which
components to track should be made as the metrics are chosen so that the necessary data is on hand for
their calculation. The following components can have metrics to assess performance separately if the
needs of the program warrant. If so, their data will need to be tracked separately, as well as aggregated
at the program level.
Measures of interest – direct install measures vs. upgrade projects as a whole vs. specific measure
types included in upgrade projects
Customer groups of interest – full program; low-income customers vs. non-low-income customers
Building types of interest –single-family home vs. multifamily buildings
Fuels of interest – electric, natural gas, other fuels, total fuels
Data collection / tracking level
Information on the performance (e.g. number of complete projects, success achieving savings, customer
satisfaction, etc.) of participating contractors is often welcomed by prospective customers. When
designing your data tracking system, decide whether to track and aggregate specific metrics by contractor
as well as by total program.
A caveat to this level of contractor-specific information – providing multiple summary metrics helps give
the full picture of contractor performance. For example, the average per project savings from a contractor
who only does small jobs will differ from one specializing in large projects, so information on average
project size along with average project savings would be beneficial.

Residential Program Benchmarking Guide 27 DRAFT – November 14, 2014
Table 1: Gross Program Outcome Metrics
All of these have value as indicators of total program impact and are likely reported to funders/stakeholders. They are also the primary data used to
calculate the Normalized Progress Metrics provided in Table 2. Metrics are grouped into the following categories:
Participation metrics – provide basic information about the size of the program. Examples: number of energy assessments; number of home
upgrades; number of specific measures installed.
Savings metrics – provide information on the total savings achieved by the entire program. Examples: annual electricity savings; lifetime electricity
savings; total energy saved from all fuels; total customer electric bill savings.
Spending metrics – provide information on program and customer spending to accomplish energy efficiency activities for the year. Examples: total
program spending; total spent on incentives to customers for upgrade projects; total invoiced costs to customers.
Other program performance and market metrics – provide information on the way the program is delivering programs, and on the local market
served. Examples: number of marketing leads and marketing budget; number of participating contractors and number of certified individuals they
employ; number of eligible homes in the region; levels of customer satisfaction.
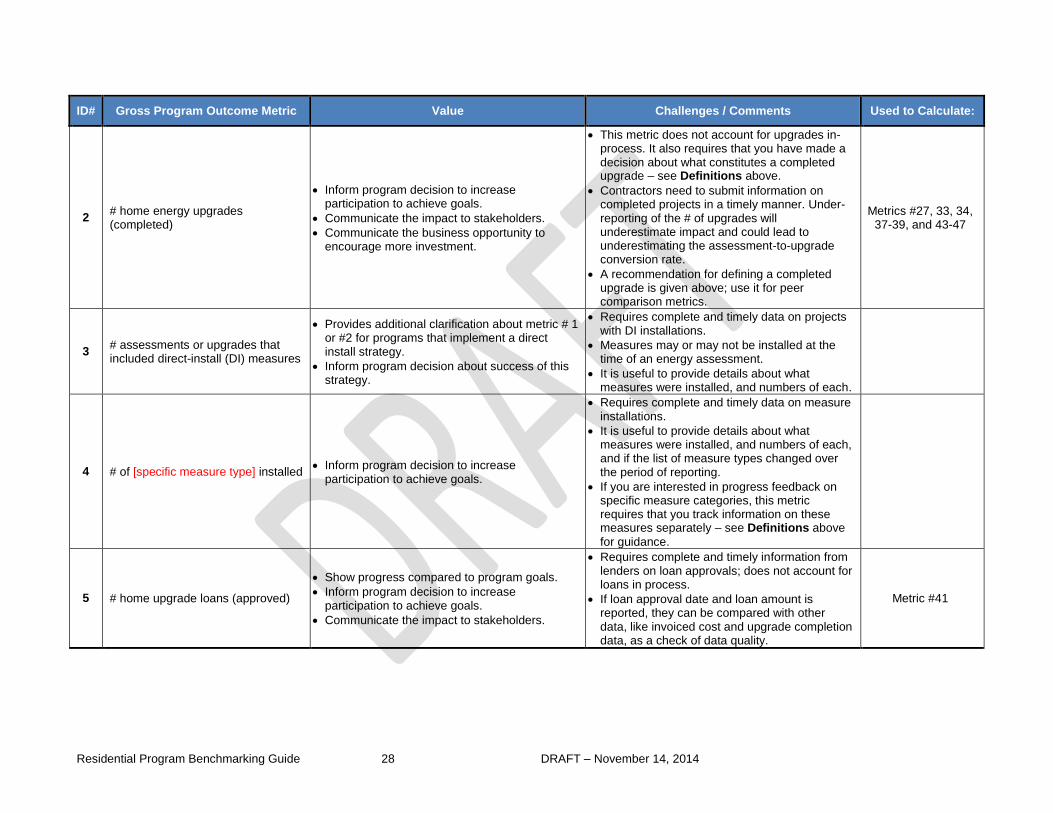
ID# Gross Program Outcome Metric Value Challenges / Comments Used to Calculate:
PARTICIPATION
1 # energy assessments
Inform program design to increase conversion-to-upgrade rate.
Communicate the impact to stakeholders.
Communicate the business opportunity to encourage more investment.
Assessors need to submit information on assessments in a timely manner. Under-reporting of the # of assessments will underestimate impact and could lead to overestimating the assessment-to-upgrade conversion rate.
It is helpful to provide information about the type of assessment. An online DIY assessment is not the same as an in-home Home Energy Score assessment. It is also helpful to know if direct install measures were included.
A recommendation for defining an assessment is given above; use it for peer comparison metrics.
Metrics #36 and 37
Residential Program Benchmarking Guide 28 DRAFT – November 14, 2014
ID# Gross Program Outcome Metric Value Challenges / Comments Used to Calculate:
2 # home energy upgrades (completed)
Inform program decision to increase participation to achieve goals.
Communicate the impact to stakeholders.
Communicate the business opportunity to encourage more investment.
This metric does not account for upgrades in-process. It also requires that you have made a decision about what constitutes a completed upgrade – see Definitions above.
Contractors need to submit information on completed projects in a timely manner. Under-reporting of the # of upgrades will underestimate impact and could lead to underestimating the assessment-to-upgrade conversion rate.
A recommendation for defining a completed upgrade is given above; use it for peer comparison metrics.
Metrics #27, 33, 34, 37-39, and 43-47
3 # assessments or upgrades that included direct-install (DI) measures
Provides additional clarification about metric # 1 or #2 for programs that implement a direct install strategy.
Inform program decision about success of this strategy.
Requires complete and timely data on projects with DI installations.
Measures may or may not be installed at the time of an energy assessment.
It is useful to provide details about what measures were installed, and numbers of each.
4 # of [specific measure type] installed Inform program decision to increase
participation to achieve goals.
Requires complete and timely data on measure installations.
It is useful to provide details about what measures were installed, and numbers of each, and if the list of measure types changed over the period of reporting.
If you are interested in progress feedback on specific measure categories, this metric requires that you track information on these measures separately – see Definitions above
for guidance.
5 # home upgrade loans (approved)
Show progress compared to program goals.
Inform program decision to increase participation to achieve goals.
Communicate the impact to stakeholders.
Requires complete and timely information from lenders on loan approvals; does not account for loans in process.
If loan approval date and loan amount is reported, they can be compared with other data, like invoiced cost and upgrade completion data, as a check of data quality.
Metric #41
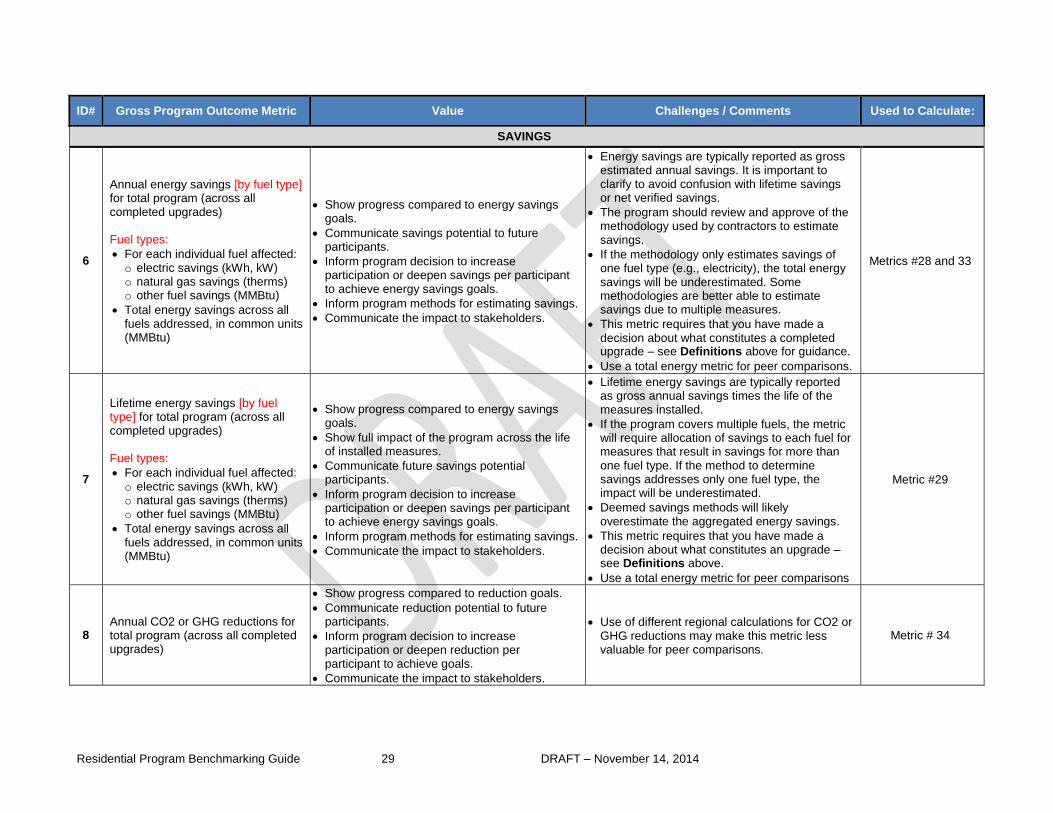
Residential Program Benchmarking Guide 29 DRAFT – November 14, 2014
ID# Gross Program Outcome Metric Value Challenges / Comments Used to Calculate:
SAVINGS
6
Annual energy savings [by fuel type] for total program (across all completed upgrades) Fuel types:
For each individual fuel affected: o electric savings (kWh, kW) o natural gas savings (therms) o other fuel savings (MMBtu)
Total energy savings across all fuels addressed, in common units (MMBtu)
Show progress compared to energy savings goals.
Communicate savings potential to future participants.
Inform program decision to increase participation or deepen savings per participant to achieve energy savings goals.
Inform program methods for estimating savings.
Communicate the impact to stakeholders.
Energy savings are typically reported as gross estimated annual savings. It is important to clarify to avoid confusion with lifetime savings or net verified savings.
The program should review and approve of the methodology used by contractors to estimate savings.
If the methodology only estimates savings of one fuel type (e.g., electricity), the total energy savings will be underestimated. Some methodologies are better able to estimate savings due to multiple measures.
This metric requires that you have made a decision about what constitutes a completed upgrade – see Definitions above for guidance.
Use a total energy metric for peer comparisons.
Metrics #28 and 33
7
Lifetime energy savings [by fuel type] for total program (across all completed upgrades) Fuel types:
For each individual fuel affected: o electric savings (kWh, kW) o natural gas savings (therms) o other fuel savings (MMBtu)
Total energy savings across all fuels addressed, in common units (MMBtu)
Show progress compared to energy savings goals.
Show full impact of the program across the life of installed measures.
Communicate future savings potential participants.
Inform program decision to increase participation or deepen savings per participant to achieve energy savings goals.
Inform program methods for estimating savings.
Communicate the impact to stakeholders.
Lifetime energy savings are typically reported as gross annual savings times the life of the measures installed.
If the program covers multiple fuels, the metric will require allocation of savings to each fuel for measures that result in savings for more than one fuel type. If the method to determine savings addresses only one fuel type, the impact will be underestimated.
Deemed savings methods will likely overestimate the aggregated energy savings.
This metric requires that you have made a decision about what constitutes an upgrade – see Definitions above.
Use a total energy metric for peer comparisons
Metric #29
8 Annual CO2 or GHG reductions for total program (across all completed upgrades)
Show progress compared to reduction goals.
Communicate reduction potential to future participants.
Inform program decision to increase participation or deepen reduction per participant to achieve goals.
Communicate the impact to stakeholders.
Use of different regional calculations for CO2 or GHG reductions may make this metric less valuable for peer comparisons.
Metric # 34

Residential Program Benchmarking Guide 30 DRAFT – November 14, 2014
ID# Gross Program Outcome Metric Value Challenges / Comments Used to Calculate:
9 Customer $$ savings for total program (across all completed upgrades)
Show progress compared to reduction goals.
Inform program decision to increase participation or deepen reduction per participant to achieve goals.
Communicate the impact to stakeholders.
The program should review and approve of methodology used by contractors to determine customer $$ savings.
This metric requires that you have made a decision about what constitutes an upgrade – see Definitions above.
Metrics #44 and 45
SPENDING
10
Total program spending [by fuel type if needed for multiple fuel programs] Fuel types:
For each individual fuel affected, allocate in proportion to: o electric savings (kWh, kW) o natural gas savings (therms) o other fuel savings (MMBtu)
Show progress compared to budgets.
Inform program decision to increase participation or deepen savings per budget $$ to achieve goals.
Communicate the impact to stakeholders.
If program spending is not aligned with program outcomes in organizational accounting systems, it may be difficult to allocate cost to specific categories.
Programs will need to specify that costs be tracked based on cost subcategories (see Metrics #11 – 16) and other program components of interest (see Definitions
above).
Recommended allocation methodology for multiple fuel types is given above (see Definitions).
Metrics #28-32
11 Total program incentives to customers for assessments
Show progress compared to budgets.
Inform program decision to increase participation or deepen savings per budget $$ to achieve goals.
Inform program decision to adjust or revise methods for program delivery.
All require timely incentive requisition and payment processes in order to reflect all incentives paid.
Recommendations for defining assessments and upgrades are given above; use them for peer comparison metrics.
Metric #32
12 Total program incentives to customers for upgrades
Metric #32
13 Total program incentives to contractors for assessments
Metric #32
14 Total program incentives to contractors for upgrades
Metric #32
15 Total program cost for direct-install measures
Must decide whether to include DI installation labor costs along with measure costs, and explain which choice was made when presenting this cost information.
A recommendation for defining direct-install measures is given above; use it for peer comparison metrics.
Metric #32
16 Marketing (or lead generation) spending
Show progress compared to budgets.
Inform program decision to increase marketing budgets to achieve goal.
Communicate the impact to stakeholders.
Requires information on costs of lead generation from contractors, and internal marketing costs.
Metric #40

Residential Program Benchmarking Guide 31 DRAFT – November 14, 2014
ID# Gross Program Outcome Metric Value Challenges / Comments Used to Calculate:
17 Total amount loaned for upgrades
Show progress compared to budgets.
Inform program decision to increase participation or deepen savings per loan $$ to achieve goal.
Communicate the impact to stakeholders.
Requires complete and timely information from lenders on loan approvals; does not account for loans in process.
Although rare, it is possible that an individual could receive more than one loan to pay for one upgrade; if so, a decision must be made on how to account for this.
Metric #41
18 Total invoiced costs for upgrades
Communicate cost (and thus savings potential) to future participants.
Communicate the economic impact to stakeholders.
For completed projects only; requires complete and timely invoice information from contractors.
When underreported, the total economic impact is underestimated.
A recommended definition for invoiced cost is given above; use it for peer comparison metrics.
Metrics #30 and 39
19 Total customer contribution for upgrades
Communicate cost (and thus savings potential) to future participants.
Communicate the economic impact to stakeholders.
For completed projects only; requires complete and timely invoice information from contractors.
When underreported, the total economic impact is underestimated.
Because this is useful when comparing customer investment to program costs, be sure to specify that customer contribution as tracked here should exclude any incentives to the customer from any source.
A recommended definition for customer contribution to costs is given above; use it for peer comparison metrics.
Metrics #30 and 42
OTHER
20 Total # certified individuals within active contractor companies
Show progress compared to workforce development goals.
Communicate the impact to stakeholders.
Must define certification type of interest; requires timely information from contractors.
This metric requires that you have made a decision about what constitutes an “active” contractor – see Definitions above.
21 Customer satisfaction - # complaints; feedback metrics from surveys
Show progress compared to customer satisfaction goals.
Communicate the impact to stakeholders.
Requires a standardized process for tracking customer feedback; any surveys done should be structured so that results can be quantified.
The response rate should be provided when presenting survey results.
Metric #47

Residential Program Benchmarking Guide 32 DRAFT – November 14, 2014
ID# Gross Program Outcome Metric Value Challenges / Comments Used to Calculate:
22 Time from assessment-to-upgrade completion (days) for each home energy upgrade
Show progress compared to customer satisfaction goals.
Inform program decision to decrease project time-to-completion to achieve goals.
Communicate the impact to stakeholders.
Requires complete and timely information from assessors and contractors about assessment start date, upgrade start date, and upgrade completion date.
The time from assessment start date to upgrade start is relevant to understand how long between the first contact (assessment) to start of upgrade project work. The time from upgrade start date to upgrade completion helps you understand how long the projects take to complete.
This metric requires that you have made a decision about what constitutes a completed upgrade – see Definitions above.
A recommendation for defining completed upgrades is given above; use it for peer comparison metrics.
Metrics #43 and 46
23 # marketing leads
Show progress compared to goal.
Inform program decision to increase marketing activity to achieve goal.
Communicate the impact to stakeholders.
Requires a reliable and standardized process for gathering information from contractors and tracking leads from other sources. It is important to explain how this information was collected when presenting the results.
A recommendation for defining a relevant lead is given above; use it for peer comparison metrics.
Metric #36 and 40
24 # active participating contractors Show progress compared to workforce
development goal.
Communicate the impact to stakeholders.
This metric requires that you have made a decision about what constitutes an “active” contractor – see Definitions above.
A recommendation for defining a participating contractor is given above; use it for peer comparison metrics.
Metric #38
25 # eligible homes Inform program design to increase activity to
achieve goal. Requires a definition of what makes a home
“eligible” for the program. Metric #27
26 Total building stock (# buildings in program region)
Inform program design to increase activity to achieve goal.
Usually available from public information.
Regional differences in market size may make this metric less valuable for peer comparisons.
Metric #27

Residential Program Benchmarking Guide 33 DRAFT – November 14, 2014
Table 2: Normalized Program Progress Metrics
Normalized Progress Metrics are useful for apples-to-apples comparisons across time or across peer group. All Normalized Metrics are calculated using
the metrics from Table 1 as indicated. These metrics are grouped into categories that are roughly based on the program objective they help inform.
Program efficiency metrics – provide insights into how effectively your program is achieving results compared to the cost and market penetration
that may prove valuable in considering changes to program design and delivery. Examples: percent of eligible homes improved; annual cost of
saved energy; lifetime cost of a direct-install program component; program administrative costs as a percent of total budget.
Energy savings metrics – provide insights into effectiveness of projects to produce savings. Examples: average annual electric savings per
upgrade; average percent of total customer energy savings across the program.
Marketing and sales performance metrics – provide insights into how effective marketing and sales efforts have been. Examples: energy
assessment-to-upgrade conversion rate; average number of upgrades per contractor; average loan amount for upgrades.
Customer benefit metrics – provide information that may be of particular interest to potential customers as they make decisions about investing in
the program’s activities and about contactors to engage. Examples: average customer dollar savings per upgrade; average time-to-complete for
individual contractors; customer satisfaction levels by contractor.
ID# Normalized Progress Metric Value Challenges / Comments Calculation X = Useful as a Peer
Benchmark
PROGRAM EFFICIENCY
27
% of building stock improved
OR
% of eligible homes improved
Inform program design to increase conversion-to-upgrade rate.
Communicate the impact to stakeholders.
Communicate the business opportunity to encourage more investment.
Depending on the ratio of eligible homes to entire building stock, it may be more informative to the program to calculate % eligible homes improved.
Building stock will be variable across programs, making this metric not very useful as a peer benchmark.
Often effective to compare to past years’ progress by reporting as a cumulative % change over many years.
# home energy upgrades completed / total building stock
[Metric #2 / Metric #26]
OR # home upgrades completed / # eligible homes
[Metric #2 / Metric #25]
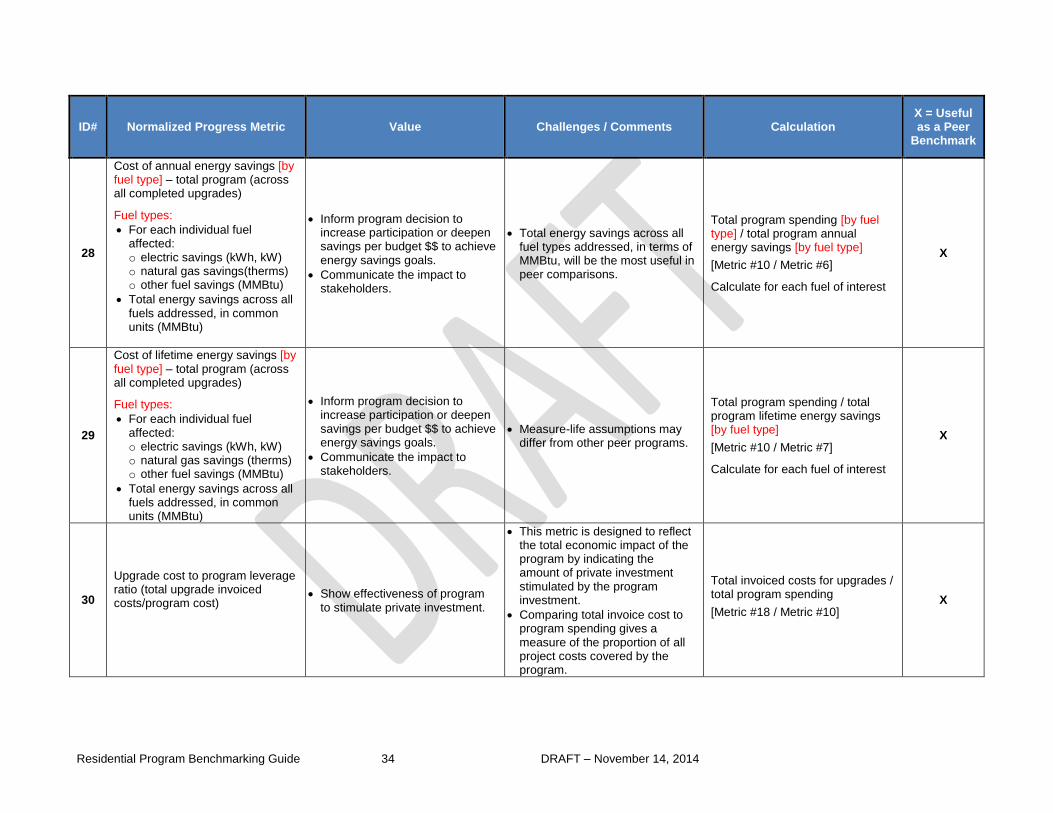
Residential Program Benchmarking Guide 34 DRAFT – November 14, 2014
ID# Normalized Progress Metric Value Challenges / Comments Calculation X = Useful as a Peer
Benchmark
28
Cost of annual energy savings [by fuel type] – total program (across all completed upgrades)
Fuel types:
For each individual fuel affected: o electric savings (kWh, kW) o natural gas savings(therms) o other fuel savings (MMBtu)
Total energy savings across all fuels addressed, in common units (MMBtu)
Inform program decision to increase participation or deepen savings per budget $$ to achieve energy savings goals.
Communicate the impact to stakeholders.
Total energy savings across all fuel types addressed, in terms of MMBtu, will be the most useful in peer comparisons.
Total program spending [by fuel type] / total program annual energy savings [by fuel type]
[Metric #10 / Metric #6]
Calculate for each fuel of interest
X
29
Cost of lifetime energy savings [by fuel type] – total program (across all completed upgrades)
Fuel types:
For each individual fuel affected: o electric savings (kWh, kW) o natural gas savings (therms) o other fuel savings (MMBtu)
Total energy savings across all fuels addressed, in common units (MMBtu)
Inform program decision to increase participation or deepen savings per budget $$ to achieve energy savings goals.
Communicate the impact to stakeholders.
Measure-life assumptions may differ from other peer programs.
Total program spending / total program lifetime energy savings [by fuel type]
[Metric #10 / Metric #7]
Calculate for each fuel of interest
X
30
Upgrade cost to program leverage ratio (total upgrade invoiced costs/program cost)
Show effectiveness of program to stimulate private investment.
This metric is designed to reflect the total economic impact of the program by indicating the amount of private investment stimulated by the program investment.
Comparing total invoice cost to program spending gives a measure of the proportion of all project costs covered by the program.
Total invoiced costs for upgrades / total program spending
[Metric #18 / Metric #10] X

Residential Program Benchmarking Guide 35 DRAFT – November 14, 2014
ID# Normalized Progress Metric Value Challenges / Comments Calculation X = Useful as a Peer
Benchmark
31 Customer to Program Leverage ratio (total customer contribution/program cost)
Show effectiveness of program to stimulate private investment.
Comparing customer contribution to program costs gives information on the amount of customer out-of-pocket $$ leveraged by program spending
Total customer contribution for upgrades / total program spending
[Metric #19 / Metric #10]
X
32 Program admin costs as % of total spending
Assess efficiency of program delivery to improve overall cost-effectiveness.
Requires definition of admin costs; start with all costs except for incentives.
Total program non-incentive costs / total program spending
[(Metric #10 – SUM (Metrics #11-15)) / Metric #10]
X
ENERGY SAVINGS
33
Avg. total annual energy savings [by fuel type] per upgrade
Fuel types:
For each individual fuel affected: o electric savings (kWh, kW) o natural gas savings (therms) o other fuel savings (MMBtu)
Total energy savings across all fuels addressed, in common units (MMBtu)
Show depth of per-project savings.
Communicate savings potential to future participants.
Inform program decision to increase participation or deepen savings per participant to achieve energy savings goals.
Inform program methods for estimating savings.
Communicate the impact to stakeholders.
If projects vary widely in size, a simple average across the program may not be very representative of the majority of the work done. Review data to assess whether to remove outliers, or consider reporting the range and the median instead.
Total energy savings across all fuel types addressed, in terms of MMBtu, will be the most useful in peer comparisons.
Total program annual energy savings [by fuel type] / # home energy upgrades completed
[Metric #6 / Metric #2] Calculate for each fuel of interest
X
34 Avg. annual CO2 or GHG reductions per upgrade
Show depth of per-project reductions.
Communicate reduction potential to future participants.
Inform program decision to increase participation or deepen reductions per participant to achieve goals.
Communicate the impact to stakeholders.
If projects vary widely in size, a simple average across the program may not be very representative of the majority of the work done. Review data to assess whether to remove outliers, or consider reporting the range and the median instead.
Total program CO2 or GHG reductions / # home energy upgrades completed
[Metric #8 / Metric #2]

Residential Program Benchmarking Guide 36 DRAFT – November 14, 2014
ID# Normalized Progress Metric Value Challenges / Comments Calculation X = Useful as a Peer
Benchmark
35 Avg. % of total customer energy saved across program
Show progress compared to savings goal.
Inform program decision to increase participation or deepen savings per participant to achieve goal.
Communicate potential saving to future participants.
Communicate the impact to stakeholders.
Assumes that a % savings is provided for each customer. Program should review and approve of methodology used by contractors to determine customer % savings. Requires complete and timely information from contractor. Total energy usage may come from utility rather than customer/contractor.
Average across the program: estimated percent customer energy saved
MARKETING AND SALES PERFORMANCE
36 Marketing lead-to-assessment conversion rate
Assess effectiveness of marketing/ lead generation.
Inform program decision to increase marketing budgets to achieve goal.
Requires a reliable and standardized process for tracking and matching customers from marketing lead to assessment.
# energy assessments / # marketing leads
[Metric #1 / Metric #23]
X
37 Energy assessment-to-upgrade conversion rate for the total program
Assess effectiveness of follow-through from assessment to completed upgrades.
Inform program decision to increase contractor outreach to achieve goal.
Communicate the impact to stakeholders.
Requires a reliable and standardized process for tracking and matching customers from assessment to upgrade project, even if different contractors are involved.
The assessment completion date and upgrade start and upgrade completion dates can be helpful to determine the time lag in reporting of total assessments and upgrades, which would affect this metric.
Results will be misleading and have little comparative value if all upgrades are required to have an assessment or if all assessments are not reported.
# home energy upgrades completed / # energy assessments
[Metric #2 / Metric #1]
X

Residential Program Benchmarking Guide 37 DRAFT – November 14, 2014
ID# Normalized Progress Metric Value Challenges / Comments Calculation X = Useful as a Peer
Benchmark
38 Avg. # upgrades per contractor (across program)
Inform program decision to increase contractor outreach to achieve goal.
Communicate the impact to stakeholders.
If contractor performance varies widely, a simple average across the program may not be very representative of the majority of the work done. Review data to assess whether to remove outliers, or consider reporting the range and the median instead.
# home energy upgrades completed / # active participating contractors
[Metric #2 / Metric #24]
39 Average invoiced cost per upgrade
Communicate potential cost information to future participants (customers and contractors).
Be sure to define invoiced cost as full installed cost.
Total invoiced costs / # home energy upgrades completed
[Metric #18 / Metric #2]
X
40 Marketing cost per lead
Assess effectiveness of marketing/ lead generation.
Inform program decision to increase marketing budgets to achieve goal.
Requires a reliable and standardized process for tracking leads.
Marketing cost ($)/lead
[Metric #16 / Metric #23]
41 Average loan amount for home upgrades
Inform program decision to increase participation or deepen savings per loan $$ to achieve goal.
Communicate the impact to stakeholders.
If loans vary widely in size, a simple average across the program may not be very representative of the majority of the work done. Review data to assess whether to remove outliers, or consider reporting the range and the median instead.
Total amount loaned for upgrades / # home upgrade loans (approved)
[Metric #17 / Metric #5]
X
42 Customer contribution as a % of total invoiced cost
Inform customers about the relative contribution of program support to project cost.
Communicate the impact to contractors.
Requires information on all incentives received by customer to calculate customer out-of-pocket contribution.
Often used as a proxy for the benefit of the program – encourage a focus on customer $$ savings from energy reductions from project as a more-comprehensive metric.
Total customer contribution for upgrades / total invoiced costs for upgrades
[Metric #19 / Metric #18]
X

Residential Program Benchmarking Guide 38 DRAFT – November 14, 2014
ID# Normalized Progress Metric Value Challenges / Comments Calculation X = Useful as a Peer
Benchmark
43 Average time-to-complete (time from assessment to upgrade completion) across the program
Communicate potential project completion information to future participants (customers and contractors).
Inform program decisions with respect to potential number of upgrades per program year.
Requires complete and timely information from contractor, and may require information from different parties for assessment and upgrade.
Sum of (time to complete per upgrade) for all upgrades / # home energy upgrades completed
[SUM (Metric #22 across all upgrades) / Metric #2]
X
CUSTOMER BENEFIT
44 Average customer $$ savings per upgrade across program
Show depth of per-project customer savings.
Communicate savings potential to future participants.
Inform program decision to increase participation or deepen savings per participant to achieve energy savings goals.
Communicate the impact to stakeholders.
If projects vary widely in size, a simple average across the program may not be very representative of the majority of the work done. Review data to assess whether to remove outliers, or consider reporting the range and the median instead.
Total customer $$ savings / # home energy upgrades completed
[Metric #9 / Metric #2]
X
CUSTOMER BENEFIT – INFORMATION ON INDIVIDUAL CONTRACTOR PERFORMANCE
45 Average Customer $$ savings per upgrade for each contractor
Assess effectiveness and depth of savings achieved for each contractor.
Requires standard customer savings calculation protocols to make contractor information comparable.
Total customer $$ savings for contractor X / # energy upgrades completed by contractor X
[SUM (Metric #9) across upgrades for contractor X / Metric #2 for contractor X]
46 Average of time-to-complete by contractor
Assess effectiveness of individual contractor in supporting project follow-through.
Communicate potential project completion timeframe to future participants (customers and contractors).
May not be comparable across projects of varied sizes, or across contractors who do not track project progress in the same way.
Sum of (time to complete per upgrade) for contractor X / # upgrades completed by contractor X
[SUM (Metric #22 across upgrades for contractor X) / Metric #2 for contractor X]
47 Customer satisfaction - for specific contractors
Communicate customer satisfaction with contractors to future participants.
Requires that contractor information be included in customer feedback.
# complaints (or survey metrics) for contractor X / # upgrades completed by contractor X
[SUM (Metric #21 across upgrades for contractor X) / Metric #2 for contractor X]

Residential Program Benchmarking Guide 39 DRAFT – November 14, 2014
Appendix B – BBNP Peer Group Benchmarking Examples
In 2010, the Better Buildings Neighborhood Program (BBNP) awarded $508 million in federal assistance to 41 organizations to test innovative program
approaches to overcoming barriers in delivering energy efficiency upgrades in homes and other buildings. Award recipients were challenged to test
program approaches targeted all building sectors that reduced total energy use by 15%. Most award recipients focused on the residential market. From
2010 through 2013, BBNP partners reported progress metrics quarterly to DOE1. Although the data collected are not a representative sample of all
residential programs, they do provide a unique opportunity to create example peer group benchmarks for several of the metrics recommended in this
guide.
To create these example benchmarks, DOE aggregated data from multiple programs to determine average values for each metric. The tables below list
example benchmark metrics along with additional contextual information about the dataset (i.e., # of records, minimum value, maximum value, median
value). The methodology used to derive these benchmarks is discussed at the end of this section.
The BBNP data include two types of information: project and program.
Project data were reported for each building energy upgrade project. For example, invoiced cost or estimated energy cost savings was reported
for each energy upgrade project. Data from thousands of projects across multiple programs can be aggregated to provide a national or regional
average per project benchmark. The BBNP project data are useful for this purpose.
The program data included aggregate results and spending for each BBNP partner. However, some partners targeted multiple sectors, and the
data are difficult to disaggregate by sector. Eleven partners targeted the residential sector only, so DOE has grouped these to provide average per
program benchmarks. Because the size of the group is small (11 out of 41 partners) and reflects programs with three years or less from startup,
the BBNP data set is not ideal for this purpose, but we have included the results in this Appendix. Additional sources of program information
include the 2013 Home Performance with ENERGY STAR 2013 Annual Report and the LBNL report on “The Program Administrator Cost of Saved
Energy for Utility Customer-Funded Energy Efficiency Programs”: http://emp.lbl.gov/publications.
1 Better Buildings Neighborhood Program Summary of Report Data is available at http://energy.gov/eere/better-buildings-neighborhood-
program/progress.

Residential Program Benchmarking Guide 40 DRAFT – November 14, 2014
Table 1 Invoiced Cost per Upgrade
Benchmark Metric # of Partners2 # of Records % of Original
Dataset Min Max Mean Median
Average Invoiced Cost Per Upgrade
37 63,363 85.3% $169 $34,080 $6,971 $5,554
Observations: - Three partners comprise of 79.5% of projects with Invoiced Cost between $100 and $1,000. - Two partners comprise of 32.8% of projects with Invoiced Cost between $1,000 and $2,000. - Two partners comprise of 50% of projects with Invoiced Cost between $2,000 and $3,000.
Additional Population Segmentation: US Census Regions
• Northeast 10 24,339 32.8% $355 $34,065 $7,988 $6,700
• Midwest 8 17,495 23.6% $130 $24,360 $3,905 $2,729
• South 9 8,514 11.5% $275 $35,151 $7,680 $6,995
• West 10 12,988 17.5% $169 $39,983 $8,787 $7,000
2 The number of partners changes for each benchmark metric based on the availability of data. If a partner did not report the metric, the projects they
reported would not be included in the records used to calculate the benchmark metric.

Residential Program Benchmarking Guide 41 DRAFT – November 14, 2014
Table 2 Loan Amount per Upgrade
Benchmark Metric # of Partners # of Records % of Original
Dataset Min Max Mean Median
Average Loan Amount Per Upgrade
30 12,085 16.2% $1,464 $29,960 $10,112 $9,019
Observations: - Four partners comprise of 75.4% of projects with Invoiced Cost between $7,000 and $8,000. - One partner comprises of 32.3% of projects with Invoiced Cost between $14,000 and $15,000. - One partner comprises of 32% of projects with Invoiced Cost between $19,000 and $20,000.
Additional Population Segmentation: US Census Regions
• Northeast 9 6,387 8.6% $1,589 $24,993 $9,594 $8,900
• Midwest 8 7,414 1.6% $1,136 $19,991 $7,931 $7,414
• South 7 1,429 1.9% $2,319 $28,254 $8,722 $7,770
• West 6 2,969 4.0% $1,700 $36,560 $12,530 $11,385

Residential Program Benchmarking Guide 42 DRAFT – November 14, 2014
Table 3 Estimated Annual Cost Savings per Upgrade
Benchmark Metric # of Partners # of Records % of Original
Dataset Min Max Mean Median
Average estimated customer annual cost savings per upgrade
36 61,751 83.1% $62 $4,105 $575 $372
Observations: - Two partners comprise of 56.5% of projects with Cost Savings between $250 and $300. - One partner comprises of 31.8% of projects with Cost Savings between $1,150 and $1,200.
Additional Population Segmentation: US Census Regions
• Northeast 9 27,714 37.3% $54 $4,738 $754 $503
• Midwest 8 16,067 21.6% $39 $2,126 $340 $287
• South 9 8,562 11.5% $47 $2,763 $433 $344
• West 10 11,471 15.4% $29 $3,448 $491 $322

Residential Program Benchmarking Guide 43 DRAFT – November 14, 2014
Table 4 Estimated Annual Site Energy Savings
Benchmark Metric # of Partners # of Records % of Original
Dataset Min Max Mean Median
Average estimated annual electric
site savings (kWh) per upgrade 36 37,873 51.0% 328 18,666 2,291 1,300
Average estimated annual natural
gas site savings (therms) per
upgrade
33 46,042 62.0% 21 1,723 287 220
Average estimated total annual
site energy savings (MMBTU) per
upgrade *
37 65,568 88.3% 3 192 30 22
* Total estimated annual energy savings (MMBTU) includes positive and negative savings due to instances of fuel switching to show
cumulative impact.
Observations:
- 1,405 projects have Electricity Savings < 0 kWh.
- 720 projects have Natural Gas Savings < 0 therms.
- 125 projects have Total Estimated Annual Savings < 0 MMBTU.

Residential Program Benchmarking Guide 44 DRAFT – November 14, 2014
All program cost benchmarks are a simple average by program (not weighted) and reflect what results to date by each partner included not cost or
savings realized across all programs. Although most partners had residential programs, most also had programs that targeted other sectors and the
program costs were not disaggregated. The program cost metrics in Table 6 are based on a relatively small subset of the total programs where program
costs and outputs could be easily aligned. These do not adequately represent the results of all BBNP residential programs.
Table 5 Program Metrics
Benchmark Metric # of Partners # of Records % of Original
Dataset Min Max Mean
Program Average days-to-complete (days from assessment completion to upgrade completion)
28 29,999 40% 25 269 116
Energy assessment-to-upgrade conversion rate
20 37,900 51% 14% 70% 42%
Notes for Dates-to-completion: - Excluded negative and 0 days - Excluded partners with Direct Install Projects Reported and Assessment to Upgrade Conversion > 100%
Notes for assessment-to-upgrade conversion rate: - Upgrades completed after September 30, 2013 are not included although assessment completed until this date are included.
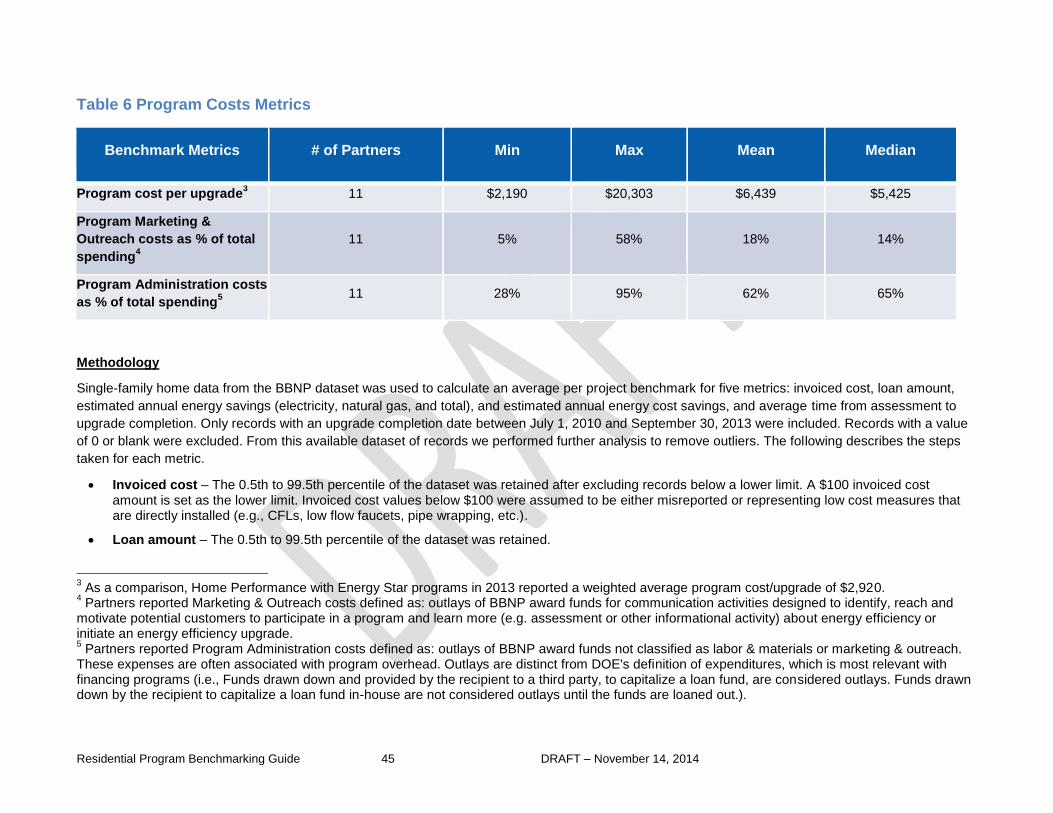
Residential Program Benchmarking Guide 45 DRAFT – November 14, 2014
Table 6 Program Costs Metrics
Benchmark Metrics # of Partners Min Max Mean Median
Program cost per upgrade3 11 $2,190 $20,303 $6,439 $5,425
Program Marketing &
Outreach costs as % of total
spending4
11 5% 58% 18% 14%
Program Administration costs
as % of total spending5
11 28% 95% 62% 65%
Methodology
Single-family home data from the BBNP dataset was used to calculate an average per project benchmark for five metrics: invoiced cost, loan amount,
estimated annual energy savings (electricity, natural gas, and total), and estimated annual energy cost savings, and average time from assessment to
upgrade completion. Only records with an upgrade completion date between July 1, 2010 and September 30, 2013 were included. Records with a value
of 0 or blank were excluded. From this available dataset of records we performed further analysis to remove outliers. The following describes the steps
taken for each metric.
Invoiced cost – The 0.5th to 99.5th percentile of the dataset was retained after excluding records below a lower limit. A $100 invoiced cost amount is set as the lower limit. Invoiced cost values below $100 were assumed to be either misreported or representing low cost measures that are directly installed (e.g., CFLs, low flow faucets, pipe wrapping, etc.).
Loan amount – The 0.5th to 99.5th percentile of the dataset was retained.
3 As a comparison, Home Performance with Energy Star programs in 2013 reported a weighted average program cost/upgrade of $2,920.
4 Partners reported Marketing & Outreach costs defined as: outlays of BBNP award funds for communication activities designed to identify, reach and
motivate potential customers to participate in a program and learn more (e.g. assessment or other informational activity) about energy efficiency or initiate an energy efficiency upgrade. 5 Partners reported Program Administration costs defined as: outlays of BBNP award funds not classified as labor & materials or marketing & outreach.
These expenses are often associated with program overhead. Outlays are distinct from DOE's definition of expenditures, which is most relevant with financing programs (i.e., Funds drawn down and provided by the recipient to a third party, to capitalize a loan fund, are considered outlays. Funds drawn down by the recipient to capitalize a loan fund in-house are not considered outlays until the funds are loaned out.).

Residential Program Benchmarking Guide 46 DRAFT – November 14, 2014
Estimated annual energy savings – The 0.5th to 99.5th percentile of the dataset was retained after excluding records below a lower limit. A lower limit for annual energy savings was determined based on 2.5% of the average annual single-family home energy consumption from the U.S. Energy Information Agency’s 2009 Residential Energy Consumption Survey (RECS)
6.
Estimated annual energy cost savings – The 0.5th to 99.5th percentile of the dataset was retained after excluding records below a lower limit. A lower limit for annual energy cost savings was determined based on 2.5% of the average annual single-family home energy expenditure from the U.S. Energy Information Agency’s 2009 Residential Energy Consumption Survey (RECS)
7.
The table below shows the number of records and the total from the original dataset and the Benchmark dataset after outliers were removed.
BBNP Dataset Used to Calculate Benchmarks
Project Data Element
BBNP Single-Family Home
Original Dataset
BBNP Single-Family Home
Benchmarking Dataset
(with Outliers Removed )
Number of Records in
Dataset with Data Element Total
Number of Records in
Dataset with Data Element Total
Invoiced Cost 64,010 $456,485,512 63,363 $441,726,616
Loan Amount 12,209 $124,527,781 12,085 $122,200,363
Estimated Energy Cost Savings 67,049 $37,340,636 61,751 $35,484,301
Estimated Site Electricity Savings
(kWh) 49,382 93,397,398 37,873 86,748,169
Estimated Site Natural Gas
Savings (therms) 48,526 14,086,872 46,042 13,202,804
Estimated Site Energy Savings
(MMBTU) 68,206 2,082,344 65,568 1,944,100
6 Lower Limit: 2.59 MMBTU (2.5% of average annual single family home energy consumption: 103.60 MMBTU).
7 Lower Limit: $57.68 (2.5% of average annual single family home energy expenditure: $2,307).

Residential Program Benchmarking Guide 47 DRAFT – November 14, 2014
Appendix C – Planning Worksheets
Worksheet #1
Use this template to help identify the types of feedback information that would be useful for documenting success in meeting your program goals.
Common Residential
Program Objectives Questions to Answer Outcomes to Measure
Step 1 Step 2
Meet Savings Targets
EXAMPLES:
Were energy savings targets achieved?
EXAMPLES:
Annual Energy Saved by energy type
Are more participants or deeper savings per participant needed
to achieve energy savings goals?
Lifetime Energy Saved by energy type
# upgrade projects
Meet Savings Targets
Provide Customer Benefit
Increase Market Penetration

Residential Program Benchmarking Guide 48 DRAFT – November 14, 2014
Common Residential
Program Objectives Questions to Answer Outcomes to Measure
Step 1 Step 2
Provide Customer Education
Optimize Program Efficiency /
Cost-effectiveness
Leverage Program Funding
Support Workforce Development
Other
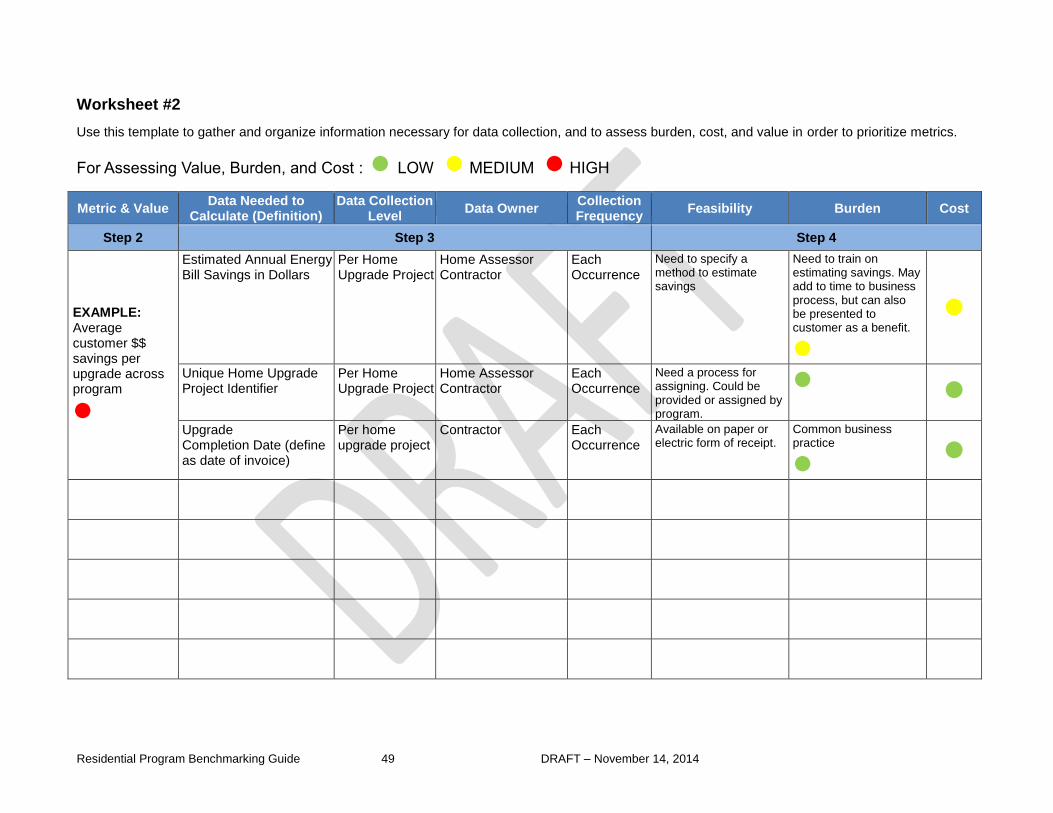
Residential Program Benchmarking Guide 49 DRAFT – November 14, 2014
Worksheet #2
Use this template to gather and organize information necessary for data collection, and to assess burden, cost, and value in order to prioritize metrics.
For Assessing Value, Burden, and Cost : LOW MEDIUM HIGH
Metric & Value Data Needed to
Calculate (Definition) Data Collection
Level Data Owner
Collection Frequency
Feasibility Burden Cost
Step 2 Step 3 Step 4
EXAMPLE: Average customer $$ savings per upgrade across program
Estimated Annual Energy Bill Savings in Dollars
Per Home Upgrade Project
Home Assessor Contractor
Each Occurrence
Need to specify a method to estimate savings
Need to train on estimating savings. May add to time to business process, but can also be presented to customer as a benefit.
Unique Home Upgrade Project Identifier
Per Home Upgrade Project
Home Assessor Contractor
Each Occurrence
Need a process for assigning. Could be provided or assigned by program.
Upgrade Completion Date (define as date of invoice)
Per home upgrade project
Contractor Each Occurrence
Available on paper or electric form of receipt.
Common business practice