
GUIDANCE ON STATISTICAL TECHNIQUES FOR ISO 9001...
29
GUIDANCE ON STATISTICAL TECHNIQUES FOR ISO 9001 :2000 ( First Revision) ICS 03.120.10; 03.120.30 @ BIS 2005 BUREAU OF INDIAN STANDARDS MANAK BHAVAN, 9 BAHADUR SHAH ZAFAR MARG NEW DELHI 110002 &/y 2005 Price Group 1-0
Transcript of GUIDANCE ON STATISTICAL TECHNIQUES FOR ISO 9001...
GUIDANCE ON STATISTICAL TECHNIQUES
FOR ISO 9001 :2000
( First Revision)
ICS 03.120.10; 03.120.30
@ BIS 2005
BUREAU OF INDIAN STANDARDSMANAK BHAVAN, 9 BAHADUR SHAH ZAFAR MARG
NEW DELHI 110002
&/y 2005Price Group 1-0
Quality Management Sectional Committee, MSD 2
FOREWORD
This special publication ( First Revision ) which is identical with lSO/TR 10017:2003 ‘Guidance onstatistical techniques for ISO 9001 :2000’ issued by the International Organization for Standardization( ISO ) was adopted by Bureau of Indian Standards on the recommendations of the Quality ManagementSectional Committee and approval of the Management and Systems Division Council.
This Technical Report referred above has been prepared under the auspices of lSO/TC 176 — QualityManagement and Quality Assurance Technical Committee of ISO, which is responsible for developingand maintaining the ISO 9000 family of International Standards. The main task of technical committeesof ISO is to prepare the International Standards, but in exceptional circumstances a technical committeemay propose the publication of a Technical Report, which is entirely informative in nature. A TechnicalReport does not have to be reviewed until-the data it provides are considered to be no longer valid oruseful. lSO/lR 10017, which is not to .be regarded -as an International Standard, may be updated toreflect future revisions of ISO 9001.
The text of this ISO Tech~ical Report has been approved as suitable to be published as a specialpublication without deviations. Certain conventions are, however, not identical to those used in IndianStandards and special publications. Attention is particularly drawn to the following:
Comma ( , ) has been used as a decimal marker while in Indian Standards, the current practice is touse a point ( . ) as the decimal marker.
In this adopted Technical Report, normative reference appears to an International Standard for which anIndian Standard also exists. The corresponding Indian Standard, which is to be substituted in its place,is given below along with its degree of equivalence for the edition indicated:
International Standard Corresponding Indian Standard Degree of Equivalence
1s0 9001 : 2000 Quality 1s/1s0 9001 : 2000 Quality Identicalmanagement systems — management systems —Requirements Requirements

SP 68:2005
GUIDANCE C)N STATISTICAL TECHNIQUESFOR ISO 9001 :2000
( First Revision)
1 Scope
This Technical Report provides guidance on the selection of appropriate statistical techniques that may beuseful to an organization in developing, implementing, maintaining and improving a quality managementsystem in compliance with ISO 9001. This is done by examining those requirements of ISO 9001 that involvethe use of quantitative data, and then identifying and describing the statistical techniques that can be usefulwhen applied to such data.
The list of statistical techniques cited in this Technical Report is neither complete nor exhaustive, and does notpreclude the use of any other techniques (statistical or otherwise) that are deemed to be beneficial to theorganization. Furthermore, this Technical Report does not attempt to prescribe which statistical technique(s)are to be used; nor does it attempt to advise on how the technique(s) are”to be implemented.
This Technical Report is ‘not intended for contractual, regulatory or certification/registration purposes. It is notintended to be used as a mandatory checklist for compliance with ISO 9001:2000 requirements. Thejustification for using statistical techniques is that their application would help to improve the effectiveness ofthe quality management system.
NOTE 1 The terms “statisticaltechniques”and “statisticalmethods”are often used interchangeably.
NOTE 2 References in this Technical Report to “product”are applicable to the generic productcategories of service,software, hardware and processed materials, or a combinationthereof, in accordance with the definitionof “product”inISO 9000:2000.
2 Normative references
The following referenced documents are indispensable for the application of this document. For datedreferences, only the edition cited applies. For undated references, the latest edition of the referenceddocument (including any amendments) applies.
ISO 9001:2000, Quality management systems — Requirements
3 Identification of potential needs for statistical techniques
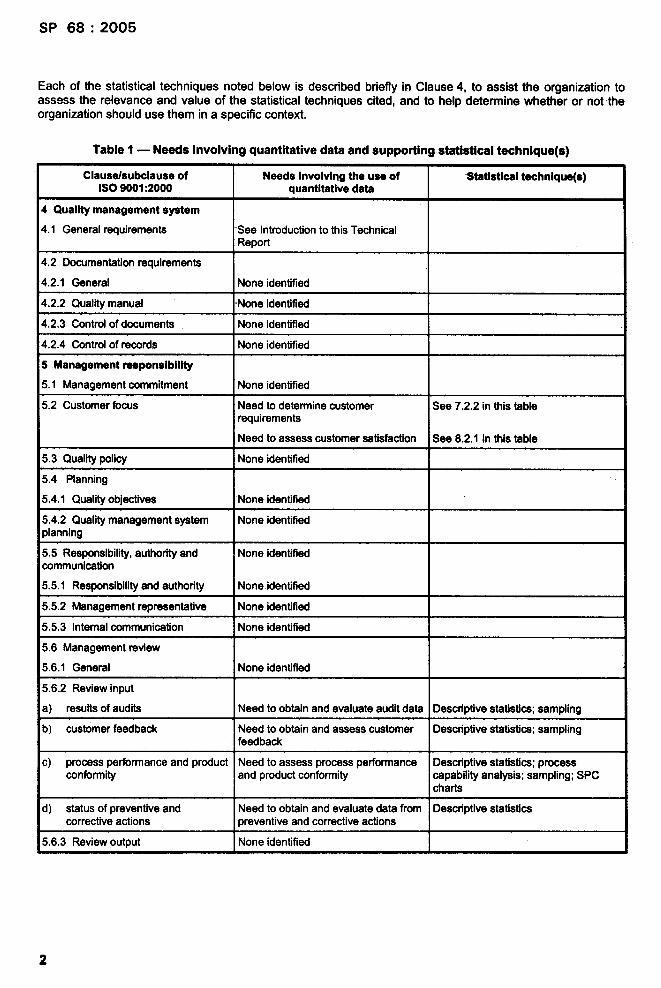
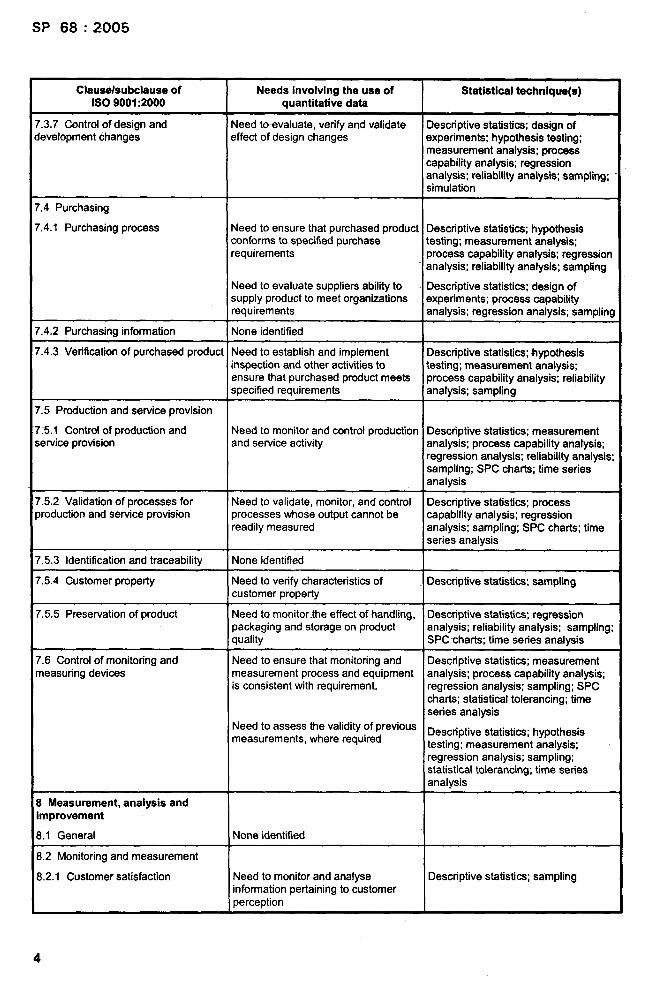
The need for quantitative data that may reasonably be associated with the implementation of the clauses andsub-clauses of ISO 9001 is identified in Table 1. Listed against the need for quantitative data thus identifiedare one or more statistical techniques that could be of potential benefit to the organization, when appropriatelyapplied to such data.
NOTE Statistical techniques can be usefully applied to qualitative data, if such data can be converted intoquantitativedate.
Where no need for quarititative data could be readily associated with a clause or subclause of ISO 9001, nostatistical technique is identified.
The statistical techniques cited in this Technical Report are limited to those that are well known. Likewise, onlyrelatively straightforward applications of statistical techniques are identified here.
1
SP 68:2005
Each of the statistical techniques noted below is described briefly in Clause 4, to assist the organization toassess the relevance and value of the statistical techniques cited, and to helD determine whether or not theorganization should use them in a specific context. “
Table 1 — Needs involving quantitative data and supporting statistical technique(s)
Clause/subclause of I Needs involving the use of I ‘Stetieticel technique(s)1s09001:2000 quantitative date
4 Quality management system
4.1 General requirements See Introductionto thisTechnicalReDort
4,2 Documentationrequirements I I4.2.1 General I None identified I
4.2.2 QuaIii manual I=Noneidentified II I
4.2.3 Controlof documents None identified
4.2.4 Controlof records None identified
5 Management responsibilityI I
5.1 Management commitment I None identified I
5.2 Customerfocus Need to determinecustomer+wcfuiraments
See 7.2.2 in this table
Need to assess customersatisfaction See 8.2.1 in this table
5.3 Qualitypolicy None identified
5.4 Planning
5.4.1 Qualityobjectives None identified
5.4.2 Qualitymanagement system None identifiedplanning
5;5 Responsibility,authorityand None identifiedcommunication
5.5.1 Responsibilityand authority None identified
5.5.2 Management representative None identified
5.5.3 Internalcommunication None identified
5.6 Management review
5.6.1 General None identified
5.6.2 Review input
a) resultsof audits Need to obtainand evaluate auditdata
b) customerfeedback Need to obtainand assess customerfeedback
c) processperformanceand product Need to assess processperformanceconformity and productconformity
d) statusof preventiveand Need to obtainand evaluate data fromcorrectiveactions preventiveand correctiveactions
5.6.3 Reviewoutr)ut None identified
Descriptivestatistics;sampling
Descriptivestatistics;sampling
Descriptivestatistics;processcapabilityanalysis;sampling;SPCcharts
Descriptivestatistics
2

SP 68:2005
Clauea/subclause of I Needs Involving the use of I Statistical technique(s)ISO 900+ ;2000 quantitative data
Resource management
1 Provisionof resources None identified
2 Human resources
2.1 General None identified
2.2 Competence,awareness andlining
2.2 a) None identified
2.2 b) None identified
2.2 c) evaluate the effecthtenessof Need to assess competence,and Deacnptivestatistics;samplinge actionstaken effectivenessof training
2.2 d) None identified
2.2 e) None identified
3 Infrastructure None identified
4 Work environment Need to monitorthe workenvironment Descriptivestatistics;SPC charts
Product realization
1 Planningof productrealization None identified
2 Customer-relatedproceseea
2.1 Determinationof mquiramente None identifiedIatedto the product
2.2 Raviewof requirementsrelated Need to assess the organizstiin’s Descriptivestatistics;measurementthe product abilityto meet defined requirements analysis; processcapabilityanalyais;
sampling;statisticaltolerancing
2.3 Customercommunication None identified
3 Designand development
3.1 Designand devel~ment None identifiedinning
3.2 Designand development inputs None identified
3.3 Designand developmentoutputs Need to verifi that designoutputs Descriptivestatistics;designofsatisfyinputrequirements experiments;hypothesistesting;
measurement analysis;regressionanalysis; reliabilityanalysis;sampling;simulation;time series analysis
3.4 Designand developmentreview None identified
3.5 Designand development Need to verifythat designoutputs Descriptivestatistics;designofxificetion satisfyinputrequimmente experiments;hypothesistesting;
measurement analysis;process ‘capabilityanalysis;regressionanalysis; reliabilityanalysis;sampling;simulation;time series analysis
3.6 Designand development Need to validate that productmeets Descriptivestatistics;designofWdation stated use and needs experiments;hypothesistesting;
measurement analysis;processcapabilityanalysis;regressionanalyais;reliabilityanalysis;sampling;simulation
3
SP 68:2005
Clause/subclause of Needs involving the uae of Statistical technique(s)1s09001:2000 quantitative data
7.3.7 Controlof design and Need to-evaluate,veri~ and validate Descriptivestatistics;design ofdevelopmentchanges effect of designchanges experiments;hypothesis testing;
measurement analysis;processcapabilityanalysis; regressionanalysis; reliabilityanalysis, sampling;simulation
7.4 Purchasing
7.4.1 Purchasingprocess Need to ensure that purchasedproduct Descriptivestatistics;hypothesisconformsto specifiedpurchase testing;measurement analysis;requirements processcapabilityanalysis;regression
analysis; reliabilityanalysis;sampling
Need to evaluate suppliersabilityto Descriptivestatistics;design ofsupplyproductto meet organizations experiments;process capabilityrequirements analysis;regressionanalysis;sampling
7.4.2 Purchasinginformation None identified
7.4.3 Verificationof purchasedproduct Need to establishand implement Descriptivestatistics;hypothesisinspectionand other activitiesto testing;measurement analysis;ensure that purchasedproductmeets processcapabilityanalysis;reliabilityspecifiedrequirements analysis;sampling
7.5 Productionand service provision
7.35.1 Controlof productionand Need to monitorand controlproduction Descriptivestatistics;measurementservice provision and service activity analysis; process capabilityanalysis;
regressionanalysi% reliabilityanalysi%sampling;SPC charts; time seriesanalysis
7.5.2 Validationof processesfor Need to validate, monitor,and control Descriptivestatistics;processproductionand service provision processeswhose outputcannotbe capabilityanalysis; regression
readily measured analysis:sampling;SPC charts;timeseries analysis
7.5.3 Identificationand traceability None identified
7.5.4 Customerproperty Need to verifycharacteristicsof Descriptivestatistics;samplingcustomerproperty
7.5.5 Preservationof product Need to monitorlhe effect of handling, Descriptivestatistics;regressionpackagingand storageon product analysis; reliabilityanalysis; sampling;quality SPC-charts; time series analysis
7.6 Controlof monitoringand Need to ensuFethat monitoringand ‘Descriptivestatistics;measurementmeasuringdevices measurement processand equipment analysis;process capabilityanalysis;
is consistentwith requirement. regressionanalysis;sampling;SPCcharts;statisticaltolerancing;timeseries analysis
Need to assess the validityOfprevious Dmeasurements,where required
escnptivestatistics;hypothesistesting;measurement analysis;regressionanalysis;sampling;statisticaltolerancing;time seriesanalysis
8 Measurement, analysis andimprovement
8.1 General None identified
8.2 Monitoringand measurement
8.2.1 Customersatisfaction Need to monitorand analyse Descriptivestatistics;samplinginformationpertainingto customerperception
4
SP 68:2005
.
Clawse/subclause of Needs involving the use of Statistical technique(s)1s09001:2000 quantitative data
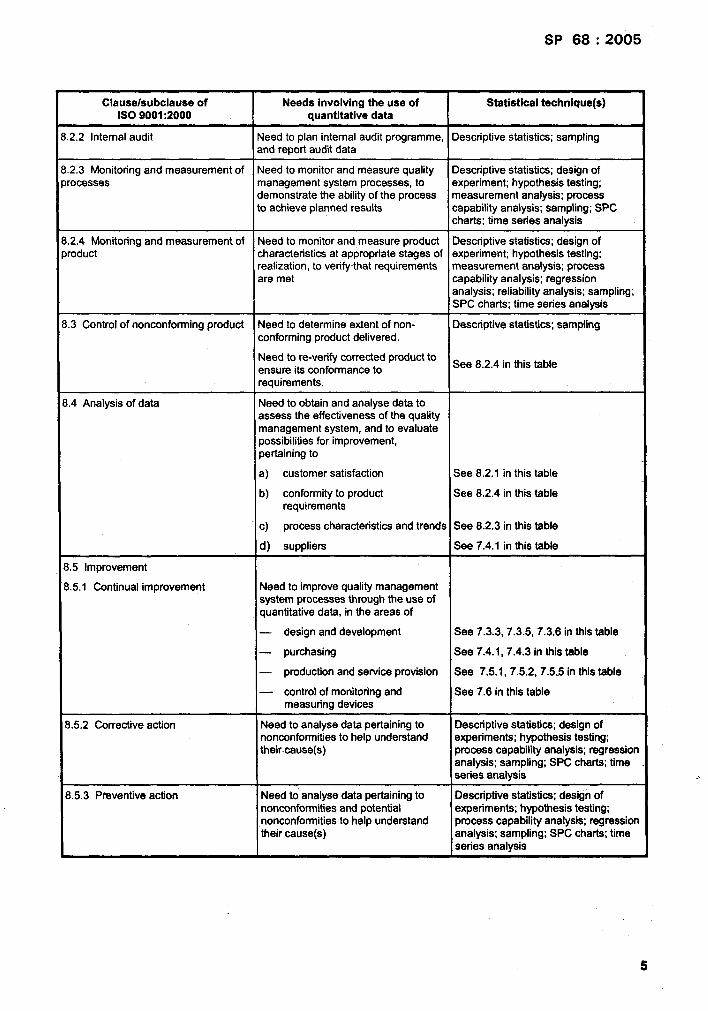
.2.2 Internalaudit Need to plan internalaudit programme, Descriptivestatistics;samplingand reportauditdata
.2.3 Monitoringand measurement of Need to monitorand measure quality Descriptivestatistics;designofrecesses management systemprocesses,to experiment;hypothesistesting;
demonstratethe abilityof the process measurement analysis;processto achieve planned results capabilityanalysis sampling;SPC
charts;time series analysis
.2.4 Monitoringand measurement of Need to monitorand measure product Descriptivestatistim;designof,roduct characteristicsat appropriatestages of experiment;hypothesistesting;
realization,to verifythat requirements measurement analysis;processare met capabilityanalysis;regression
analysis; reliabilityanalysis;sampling;SPC charts;time series analysis
.3 Controlof nonconformingproduct Need to determineextentof non- Descriptivestatisti=, samplingconformingproductdelivered.
Need tore-verify correctedproductto see ~.2 ~ in this~b,eensure itsconformancetorequirements.
L4 Analysisof data Need to obtainand.analyse data toassess the effectivenessof the qualitymanagement system, and to evaluatepossibilitiesfor improvement,pertainingto
a) customer satisfaction See 8.2.1 in this table
b) conformityto product See 8.2.4 in thistablerequirements
c) processcharacteristicsandIrends See 8.2.3 in this table
d) suppliers See 7.4.1 in thistable
1.5 Improvement
1.5.1 Continualimprovement Need to improvequalitymanagementsystem processesthroughthe use ofquantitativedate, in the areas of
— designand development See 7.3.3,7 .3.5,7.3.8 in thistable
— purchasing See 7.4.1 ,7.4.3 in thistable
— productionand serviceprovision See 7.5.1, 7.5.2,7.5.5 in thistable
— controlof monitoringand See 7.6 in thistablemeasuringdevices
3.5.2 Correctiveaction Need to analyse data pertainingto Descriptivestatistics;designofnonconforrnitiesto help understand experiments;hypothesistesting;their-cause(s) processcapabilityanalysis;regression
analysis;sampling;SPC charts;timeseries analysis
6.5.3 Preventiveaction Need to analyse data pertainingto Descriptivestatistics;designofnonconformitiesand potential experiments;hypothesistesting:nonconformitiesto help understand processcapabilityanalysis;regressiontheircause(s) analysis;sampling;SPC charts;time
series analysis
5

SP 68:-2005
4 Descriptions ofstatistical techniques identified
4.1 General
The following statistical techniques, or families of techniques, that might help an organization to meet. itsneeds, are identified in Table 1:
—
—
—
—
—
—
—
—
—
—
—
—
descriptive statistics;
design of experiments;
hypothesis testing;
measurement analysis;
process capability analysis;
regression analysis;
reliability analysis;
sampling;
simulation;
statistical process control (SPC) charts;
statistical tolerancing;
time series analysis.
Of the various statistical techniques listed above, it is worth noting that descriptive statistics (which includesgraphical methods) constitutes an important aspect of many of these techniques.
As stated earlier, the criteria used in selecting the techniques Iistad above are that the techniques are wellknown and widely used, and their application has resulted in benefit to users.
The choice of technique and the manner of its application will depend on the circumstances and purpose ofthe exercise, which will differ from case to case.
A brief description of each statistical technique, or family of techniques, is provided in 4.2 to 4.13. Thedescriptions are intended to assist a lay reader to assess the potential applicability and benefit of using thestatistical techniques in implementing the requirements of a quality management system.
The actual application -of statistical techniques cited here will require more guidance and expertise than isprovided by this Technical Report. There is a large body of information on statistical techniques available inthe public domain, -such as textbooks, journals, reports, industry handbooks and other sources of information,which may assist the organization in the effective use of statistical techniques’). However it is beyond thescope of this Technical Report to cite these sources, and the search for such information is left to individualinitiative.
1) ~st~ in the Mbliographyare ISO and IEC Standards and Technical Reportsrelated to StatkXiCd techniques. They are
cited here for information;thisTechnical Reportdoes not specifycompliancewiththem.
6
SP 68:2005
4.2 Descriptive statistics
4.2.1 What it is
The term descriptive statistics refers to procedures for summarizing and presenting quantitative data in amanner that reveals the characteristics of the distribution of data.
The characteristics of data that are typically of interest are their central value (most often described by theaverage), and spread or dispersion (usually measured by the range or standard deviation). Anothercharacteristic of interest is the distribution of data, for which there are quantitative measures that describe theshape of the distribution (such as the degree of “skewness”, which describes symmetry).
The information provided by descriptive statistics can often be conveyed readily and effectively by a variety ofgraphical methods, which include relatively simple displays of data such as
— a trend chart (also celled a “run chart”), which is a plot of a characteristic of interest over a period of time,to observe its behaviour over time,
— a scatter plot, which helps to assess the relationship between two VaFiableS by plotting one variable onthe x-axis and the corresponding value of the other on the y-axis, and
— a histogram, which depicts the distribution of values of a characteristic of interest.
There is a wide array of graphical methods that can aid the interpretation and analysis of data. These rangefrom the relatively simple tools described above (and others such as bar-charts and pie-charts), to techniquesof a more complex nature, including those involving specialised scaling (such as probability plots), andgraphics involving multiple dimensions and vaimbles.
Graphical methods are useful in that they can often reveal unusual features of the data Ihat may not be readilydetected in quantitative analysis. They have extensive use in data analysis when exploring or verifyingrelationships between variables, and in estimating the parameters that describe such relationships. Also, theyhave an important application in summarizing and presenting complex data or data relationships in aneffective manner, especially for non-specialist audiences.
Descriptive statistics (including graphical methods) are implicitly invoked in many of the statistical techniquescited in this Technical Report, and should be regarded as a fundamental component of statistical analysis.
4.2.2 What it is used for
Descriptive statistics is used for summarizing and characterizing data. It is usually the initial step in theanalysis of quantitative data, and often constitutes the first step towards the use of other statistical procedures.
The characteristics of sample data may serve as a basis for making inferences Fegarding the characteristics ofpopulations from which the samples were drawn, with a prescribed margin of error and level of confidence.
4.2.3 Benefits
Descriptive statistics offers an efficient and relatively simple way of summarizing and characterizing date, andalso offers a convenient way of presenting such information. In particular, graphical methods are a veryeffective way of presenting data, and communicating information.
Descriptive statistics is potentially applicable to all situations that involve the use of data. It can aid theanalysis and interpretation of data, and is a valuable aid in decision rrmkin~
4.2.4 Limitations and cautions
Descriptive &atistics provides quantitative measures of the characteristics (such as the average and standarddeviation) of sample data. However these measures are subject to the limitations of the sample size and
7
SP 68:2005
sampling method employed. Aiso,characteristics of the populationassumptions are satisfied.
4.2.5 Examples of applications
these quantitative measures cannot be assumed to be valid estimates offrom which the sample was drawn, unless the underlying statistical
Descriptive statistics has useful application in almost all areas where quantitative data are collected. It canprovide information about the product, process or some other aspect of the quality management system, andmay be used in management reviews. Some examples of such applications are as follows:
—
—
—
—
—
—
—
—
summarizing key measures of product characteristics (such as the central value and spread);
describing the performance of some process parameter, such as oven temperature;
characterizing delivery time or response time in the service industry
summarizing data from customer surveys, such as customer satisfaction or dissatisfaction;
illustrating measurement data, such as equipment calibration data;
displaying the distribution of a process characteristic by a histogram, against the specification limits forthat characteristic;
displaying product performance results over a period of time by means of a trend cha~
assessing the possible relationship between a process variable (eig. temperature) and yield by a scatterplot.
4,3 Design of experiments (D.OE)
4.3.1 What it is
Design of experiments refers to investigations carried out in a planned manner, and which rely on a statisticalassessment of results to-reach conclusions at a stated level of confidence.
DOE typically involves inducing change(s) to the system under investigation, and statistically assessing theeffect of such change .on the system. Its objective may be to validate some characteristic(s) of a system, or itmaybe to investigate the influence of one or more factors on some characteristic(s) of a system.
The specific arrangement and manner in which the experiments are to be carried out constitute the design ofthe experiment, and such design is governed by the objective of the exercise and the conditions under whichthe experiments are to be conducted.
There are several techniques that may be used to analysetechniques, such as the “analysis of variance” (ANOVA),“probability plots”.
4.3.2 What it is used for
experiment data. These range from analyticalto those more graphical in nature, such as
DOE may be used for evaluating some characteristic of a product, process or system, for the purpose ofvalidation against a specified standard, or for comparative assessmey of several systems.
DOE is particularly useful for investigating complex systems whose outcome may be influenced by apotentially large number of factors. The objective of the experiment may be to maximize or optimize acharacteristic of interest, or to reduce its variability. DOE maybe used to identify the more influential factors ina system, the magnitude of their influence, and therelationships (i.e. interactions), if any, between the factors.The findings may be used to facilitate the design and development of a product or process, or to control orimprove an existing system.
8

SP 68:2005
The information from a designed experiment may be used to formulate a mathematical model that describesthe system characteristic(s) of interest as a function of the influential factors; and with certain limitations (citedbriefly in 4.3.4). Such a model maybe used for purposes of prediction.
4.3.3 Benefits
When estimating or validating a characteristic of interest, there is a need to assure that the results obtainedare not simply due to chance variation. This applies to assessments made against some prescribed standard,and to an even greater degree in comparing two or more systems. DOE allows such assessments to be madewith a prescribed level of confidence.
A major advantage of DOE is its relative efficiency and economy in investigating the effects of multiple factorsin a process, as compared to investigating each factor individually. Also, its ability to identify the interactionsbetween certain factors can lead to a deeper understanding of the process. Such benefds are especiallypronounced when dealing with complex processes (i.e. processes that involve a laFge number of potentiallyinfluential factors).
Finally, when investigating a system there is the risk of incorrectly assuming causality where there may beonly chance correlation between two or more variables. The risk of such error can be reduced through the useof sound principles of experiment design.
4.3.4 Limitations and cautions
Some level of inherent variation (often aptly described as “noise”) is present in all systems, and this cansometimes cloud the results of investigations and lead to incorrect conclusions. Other potential sources oferror include the confounding effect of unknown (or simply unrecognised) factors that may be present, or theconfounding effect of dependencies between the various factors in a system. The risk posed by such errorscan be mitigated by well designed experiments through, for example, the choice of sample size or by otherconsiderations in the design of the experiment. These risks can never be eliminated and therefore should be-borne in mind when forming conclusions.
Atso, strictly speaking, the experiment findings are valid only for the factors and the range of valuesconsidered in the experiment. Therefore, caution should be exercised in extrapolating (or interpolating) muchbeyond the range of values considered in the experiment.
Finally, the theory of DOE makes certain fundamental assumptions (such as the existence of a canonicalrelationship between a mathematical model and the physical reality being studied) whose validity or adequacyare subject to debate.
4.3.5 Examples of applications
A familiar application of DOE is in assessing products or processes as, for example, in validating the effect ofmedical treatment, or in assessing the relative effectiveness of several types of treatment. Industrial examplesof such applications include validation tests of products against some specified performance standards.
DOE is widely used to identify the influential factors in complex processes and thereby to control or improvethe mean value, or reduce the variability, of some characteristic of interest (such as process yield, productstrength, durability, noise level). Such experiments are frequently encountered in the production, for example,of electronic components, automobiles and chemicals. They are also widely used in areas as diverse asagriculture and medicine. The scope of applications remains potentially vast.
4.4 Hypothesis testing
4.4.1 What it is
Hypothesis testing is ‘a statistical procedure to determine, with a prescribed level of risk, if a set of data(typically from a sample) is compatible with a given hypothesis. The hypothesis may pertain to an assumptionof a particular statistical distribution or model, or it may pertain to the value of some parameter of a distribution(such as its mean value).

SP 68:2005
The procedure for hypothesis testing involves assessing the evidence (in the form of data) to decide whethera given hypothesis regarding a statistical model or parameter should orshould not be rejected.
The hypothesis test is explicitly or implicitly invoked in many of the statistical technques cited in this TechnicalReport, such as sampling, SPC charts, design of experiments, regression analysis and measurement analysis.
4.4.2 What .it is used for
Hypothesis testing is widely used to enable one to conclude, at a stated level of confidence, whether or not ahypothesis regarding a parameter of a population (as estimated from a sample) is valid. The procedure maytherefore be applied to test whether or not a population parameter meets a particular standard; or it may beused to test for differences in two or more populations. It is thus useful in decision making.
Hypothesis testing is also used for testing model assumptions, such as whether or not the distribution of apopulation is normal, or whether sample data are random.
The hypothesis test procedure may also be used to determine the range of values (termed the “ccmfideneeinterval”) which can be said to contain, at a stated confidence level, the true value of the parameterin question.
4.4.3 Benefits
Hypothesis testing allows an assertion to be made about some parameter of a population, with a known levelof confidence. As such, it can be of assistance in making decisions that depend on the parameter.
Hypothesis testing can similarly allow assertions to be made regarding the nature of the distribution of apopulation, as well as properties of the sample data itself.
4.4.4 Limitations and cautions
To ensure the validity of conclusions reached from hypothesis testing, it is essential that the underlyingstatistical assumptions are adequately satisfied, notably that the samples are independently and randomlydrawn. Furthermore, the level of confidence with which the conclusion can be made is governed by thesample size.
At a theoretical level, there is some debate regarding how a hypothesis test can be used to make validinferences.
4.4.5 Examples of applications
Hypothesis testing has general application when an assertion must be made about a parameter or thedistribution of one or more populations (as estimated by a sample) or in assessing the-sample data itself. Forexample, the procedure may be used in the following ways:
— to test whether the mean (or standard deviation) of a population meets a given value, such as a target ora.standard;
— to test whether the means of two (or more) populations are different, as when comparing different batchesof components;
. to test that the proportion of a population with defects does not exceed a given value;
— to test for differences in the proportion of defective units in the outputs of two processes;
— to test whether the sample data have been randomly drawn from a single population;
— to test if the distribution of a population is normal;
— to test whether an observation in a sample is an “outlier”, i.e. an extreme value of questionable validi~
— to test if there has been an improvement in some product or process characteristi~
10
SP 68:2005
— to determine the sample size required to accept or reject a hypothesis, at a stated level of confideflce;
— using sample data, to determine a confidence interval within which the true population average might lie.
4.5 Measurement analysis
4.5.1 What it is
Measurement analysis (also referred to as “measurement uncertainty analysis” or “measurement systemanalysis”) is a set of procedwes to evaluate the uncertainty of measurement systems under the range ofconditions in which the system operates. Measurement errors may be analysed using the same methods asthose used to analyse product characteristics.
4.5.2 What it is used for
Measurement uncertainty should be taken into account whenever data are collected. Measurement analysis isused for assessing, at a prescribed level of confidence, whether the measurement system is suitable for itsintended purpose. It is used for quantifying variation from various sources such as variation due to theappraiser (i.e. the person taking the measurement), or variation from the measurement process or from themeasurement instrument itself. It is also used to describe the variation due to the measurement system as aproportion of the total process variation, or the total allowable variation.
4.5.3 Benefits
Measurement analysis provides a quantitative and cost-effective way of selecting a measurement instrument,or for deciding whether the instrument is capable of assessing the product or process parameter beingexamined.
Measurement analysis provides a basis for comparing and reconciling differences in measurement, byquantifying variation from various sources in measurement systems themselves.
4.5.4 Limitations and cautions
In all but the simplest cases, measurement analysis needs to be conducted by trained specialists. Unless careand expertise are used in its application, the results of measurement analysis could encourage false andpotentially costly over-optimism, both in the measurement results and in the acceptability of the product.Conversely, over-pessimism can result in the unnecessary replacement of adequate measurement systems.
4.5.5 Examples of applications
4.5.5.1 Measurement uncertainty determination
The quantification of measurement uncertainties can serve to support an organization’s assurance to itscustomers (internal or external) that its measurement processes are capable of adequately measuring thequality level to be achieved. Measurement uncertainty analysis can often highlight variability in areas that arecritical to product quality, and hence guide an organization in allocating resources in such areas to improve ormaintain quality.
-4.5.5.2 Selectien of new instmments
Measurement analysis can help guide the choice of a new instrument by examining the proportion of variationthat is associated with the instrument.
4.5.5.3 Determination of the characteristics of a particular method (trueness, precision, repeatability,reproducibility, etc.)
11

SP 68:2005
This allows the selection of the most appropriate measurement method(s) to be used in support of assuringproduct quality. It may also allow an organization to balance the cost and effetilveness of variousmeasurement methods against their effect on product quality.
4.5.5.4 Proficiency testing
An organization’s measurement system may be assessed and quantified by comparing its measurementresults with those obtained from other measurement systems. Also, in addition to providing assurance tocustomers, this may help an organization to improve its methods or the training of its staff with regard tomeasurement analysis.
4.$ Process capability analysis
4.6.1 What it is
Process capability anaiysis is the examination of the inherent variability and distribution of a process, in orderto estimate its ability to produce output that conforms to the range of variation permitted by specifications.
When the data are measurable variables (of the product or process), the inherent variability of the process isstated in terms of the “spread” of the process when it is in a state of Watisticai control (see 4.11), and isusually measured as six standard deviations (6c+ of the process distribution. If the process data are anormally distributed (“bell shaped”) variable, this spread -will (in theory) encompass 99,73 YO of the population.
Process capability can be conveniently expressed as an index, which reiates the actuai process variability tothe tolerance permitted by specifications. A widely used capability index for variable data is C (a ratio of thetotal tolerance divided by 60-), which is a measure of the theoretical capability of a process hat is perfectlyfcentred between the specification limits. Another widely used index is ‘+ which describes the actuaicapability of a process which may or not be centred; c~k is especially applicable to situations involving one-sided specifications. Other capability indices have been devised to account for long- and short-term variabilitybetter and for variation around the intended process target value.
When the process data involve “attributes” (e.g. percent nonconforming, or the number of nonconformities),process capability is stated as the average proportion of nonconforming units, or the average rate ofnonconformities.
4.6.2 What it is used for
Process capability analysis is used to assess the ability of a process to produce outputs that consistentlyconform to specifications, and to estimate the amount of nonconforming product that can be expected.
This concept may be applied to assessing the capability of any sub-set of a process, such as ‘a specificmachine. The analysis of “machine capability” may be used, for example, to evaluate specific equipment or to-assess its contribution to overall process capability.
4.6.3 Benefits
Process capability analysis provides an assessment of the inherent variability of a process and an estimate ofthe percentage of nonconforming items that can be expected. This enables the organization to estimate thecosts of nonconformance, and can help guide decisions regarding process improvement.
Setting minimum standards for process capability can guide the organization in selecting processes andequipment that should produce acceptable product.
4.6.4 Limitations and cautions
The concept of capability strictiy appiies to a process in a state of statistical control. Therefore, processcapability analysis should be performed in conjunction with control methods to provide ongoing verification ofcontrol.
12

SP 68:2005
Estimates of the percentage of nonconforming product are subject to assumptions of normality. When strictnormality is not realised in practice, such estimates should be treated with caution, especially in the case ofprocesses with high capability ratios.
Capability indices can be misleading when the process distribution is substantially not normal. Estimates ofthe percentage of nonconforming units should be based on methods of analysis developed for appropriatedistributions for such data. Likewise, in the case of processes that are subject to systematic assignablecauses of variation, such as tool wear, specialized approaches should be used to calculate and interpretcapability.
4.6.5 Examptes of applications
Process capability is used to establish rational engineering specifications for manufactured products byensuring that component variations am consistent with allowable tolerance build-ups in the assembled product.Conversely, when tight tolerances are necessary, component manufacturers are required to achieve specifiedlevels of process capability to ensure high yields and minimum waste.
High process capability goais (e.g. C > 2) are sometimes used at the component and subsystem Ievei toJ“””achieve desired cumulative quality an rehablhty of complex systems.
Machine capability analysis is used to assess the ability of a machine to produce or perform to statedrequirements. This is helpful in making purchase or repair decisions.
Automotive, aerospace, electronics, food, pharmaceutical and medicai device .manufacturera routinely useprocess capability as a major criterion to assess suppliers and products. This allows the manufacturer tominimize direct inspection of purchased products and materials.
Some companies in manufacturing and service industries track process capability indices to identify the needfor process improvements, or to verify the effectiveness of such improvements.
4.7 Regression analysis
4.7.1 What it is
Regression analysis relates the behaviour of a characteristic of interest (usually called the “responsevariable”) with potentially causal factors (usually called “explanatory variables”). Such a relationship isspecified by a model that can come from science, economics, engineering, etc, or it can be derived empirically.The objective is to help understand the potential cause of variation in the response, and to explain how mucheach factor contributes to that variation. “This is achieved by statistically relating variation in the responsevariable with variation “in the explanatory variables, and obtaining the best fit by minimizing the deviationsbetween the predicted and the actual response.
4.7.2 What it is used for
Regression analysis allows the user to do the following:
—
—
—
—
to test hypotheses about the influence of potential explanatory variables on the response, and to use thisinformation to describe the estimated change in the response for a given change in an explanatoryvariable;
to predict the value of the response variable, for specific values of the explanatory variables;
to predict (at a stated level of confidence) the range of values within which the response is expected to lie,given specific values for the explanatory variables;
to estimate the direction and degree of association between the response variable and an explanatoryvariable (although such an association does not imply causation). Such information might be -used, forexample, to determine the effect of changing a factor such as temperature on process yield, while otherfactors are held constant.
13
SP 68:2005
4.7.3 Benefits
Regression analysis can provide insight into the relationship between various factors and the response ofinterest, and such insight can help guide decisions related to the process under study and ultimately improvethe process.
The insight yielded by regression analysis follows from its ability to describe patterns in response dataconcisely, compare different but related subsets of data, and analyse potential cause-and-effect relationships.When the relationships are modelled well, regression analysis can provide an estimate of the relativemagnitudes of the effect of explanatory variables, as well as the relative strengths of those variables. Thisinformation is potentially valuable in controlling or improving process-outcomes.
Regression analysis can also provide estimates of the magnitude and source of influences on the responsethat come from factors that are either unmeasured or omitted in the analysis. This information maybe used toimprove the measuring system or the process.
Regression analysis may be used to predict the value of the ‘response variable, for given values of one ormore explanatory variables; likewise it may be used to forecast the effect of changes in explanatory variables-on an existing or predicted response. It may be useful to conduct such analyses before investing time ormoney in a problem when the effectiveness of the action is not known.
4.7.4 Limitations and cautions
When modelling a process, skill is required in specifying a suitable regression model (e.g. linear, exponential,multivariate), and in using diagnostics to improve the model. The presence of omitted variables, measurementerror(s), and other sources of unexplained variation in the response can complicate modelling. Specificassumptions behind the regression model in question, and characteristics of the available data, determinewhat estimation technique is appropriate in a regression analysis problem.
A problem sometimes encountered in developing a regression model is the presence of data whose validity isquestionable. The validity of such data should be investigated where possible, since the inclusion or omissionof the data from the analysis could influence the estimates of the model parameters, and thereby the response.
Simplifying the model, by minimizing the number of explanatory variables, is important in modelling. Theinclusion of unnecessary variables can cloud the influence of explanatory variables and reduce the precision.of model predictions. However, omitting an important explanatory variable may seriously limit the model andthe usefulness of the results.
4.7.5 Examples of applications
Regression analysis is used to model production characteristics such as yield, throughput, quality ofperformance, cycle time, probability of failing a test or inspection, and various patterns of deficiencies inprocesses. Regression analysis is used to identify the most important factors in those processes, and themagnitude and nature of their contribution to variation in the characteristic of interest.
Regression analysis is used to predict the outcomes from an experiment, or from controlled prospective orretrospective study of variation in materials or production conditions.
Regression analysis is used to verify the substitution of one measurement method by another, for example,replacing a destructive or time-consuming method by a non-destructive or time-saving one.
Examples of applications of non-linear regression include modelling drug concentrations as functions of timeand weight of respondents; modelling chemical reactions as a function of time, temperature and pressure.
14

SP 68:2005
4.8 Reliability analysis
4.8.1 What it is
Reliability .analysis is the application of engineering and anal~lcal methods to the assessment, prediction andassurance of problem-free performance over time of a product or system under studyz).
The techniques used in reliability analysis often require the use of statistical methods to deal with uncertainties,random characteristics or probabilities of occurrence (of failures, etc.) over time, Such ana~ysis generallyinvolves the use of appropriate statistical models to characterize variables of interest, such as the time-to-failure, or time- between-failures. The parameters of these statistical models are estimated from empirical dataobtained from laboratory or factory testing or from field operation.
Reliability analysis encompasses other techniques (such as fault mode and effect analysis) which focus on thephysical nature and causes of failure, and the prevention or reduction of”failures.
4.8.2 What it is used for
Reliability analysis is used for the following purposes:
— to verify that specified reliability measures are met, on tke basis of data from a test of limited duration andinvolving a specified number of test units;
— to predict the probability of problem-free operation, or other measures of reliability such as the failure rateor the mean-time-between-failures of components or systems;
— to model failure patterns and operating scenarios of product or service performance;
— to provide statistical data on design parameters, such as stress and strength, useful for probabilisticdesign;
— to identify critical or high-risk components and the probable failure modes and mechanisms, and tosupport the search for causes and preventive measures.
The statistical techniques employed in reliability analysis allow statistical confidence levels to be attached ‘tothe estimates of the parameters of reliability models that are developed, and to predictions made using suchmodels.
4.8:3 Benefits
Reliability analysis provides a quantitative measure of product and service performance against failures orservice interruptions. Reliability activities are closely associated with the containment of risk in systemoperation. Reliability is often an influencing factor in the perception of product or service quality, and incustomer satisfaction.
The benefits of using statistical techniques in reliability analysis include
— the ability to predict and quantify the likelihood of failure and other reliability measures within statedconfidence limits,
— the insights to guide decisions regarding different design alternatives using different redundancy andmitigation strategies,
2) Reliability analysia is closely related to the wider field of “dependability”which also inctudes maintainabiiiiyandavailability.These, and other related techniquesand approaches,are deftnedand discussedin tha IEC publicationscitedin the Bibliography.
15
SP 68:2005
the development of objective acceptance or rejection criteria for performing compliance tests todemonstrate that reliability requirements are met,
the capability to plan optimal preventive maintenance and replacement schedules based on the reliabilityanalysis of product performance, sewice and wearout data, and
the possibility of.improving design to achieve a reliability objective economically.
4.8.4 Limitations and cautions
A basic assumption of reliability analysis is that the performance of a system under study can be reasonablycharacterized by a statistical distribution. The accuracy of reliability estimates will therefore depend on thevalidity of this assumption.
The complexity of reliability analysis is compounded when multiple failure modes are present, which may ormay not conform to the same statistical distribution. Also, when the number of failures observed in a reliabilitytest is small, this can severely affect the statistical confidence and precision attached to estimates of reliability.
The conditions under which the reliability test is conducted are critically important, particularly when the testinvolves some form of “accelerated stress” (i.e. stress that is significantly greater than that which the productwill experience in normal usage). It may be difficult to determine the relationship between the failuresobserved under test and product performance under normal operating conditions, and this will add to theuncertainty ofreliabilit y predictions.
4.8.5 Examples of applications
Typical examples of applications of reliability analysis include
— verification that components or products can meet stated reliability requirements,
— projection of product life cycle cost based on reliability analysis of data from tests at new productintroduction,
— guidance indecisions to make or buy off-the-shelf products, based on the analysis of their reliability, andthe estimated effect on delivery targets and downstream costs related to projected failures,
— projection of software product maturity based on test results, quality improvement and reliability growth,and establishing software release targets compatible with market requirements, and
— determination -of the dominant product wearout characteristics to help improve product design, or to planthe appropriate service maintenance schedule and effort required.
4.9 Sampling
4.9.1 What it is
Sampling is a systematic statistical methodology for obtaining information about some characteristic of apopulation by studying a representative fraction (i.e. sample) of the population. There are various sampfingtechniques that may be employed (such as simple random sampling, stratified sampling, systematic sampling,sequential sampling, skip-lot sampling), and the choice of technique is determined by the purpose of thesampling and the conditions under which it is to be conducted.
4.9.2 What it is used for
Sampling can be loosely divided into two broad nonexclusive areas: “acceptance sampling” and “suweysampling”.
16

SP 68:2005
Acceptance sampling is concerned with making a decision with regard to accepting or not accepting a “lot”(i.e.a grouping of items) based on the result of a sample(s) selected from that lot. A wide range of acceptancesampling plans are available to satisfy specific requirements and applications.
Survey sampling is used in enumerative or analytical studies for estimating the values -of one or morecharacteristics in a population, or for estimating how those characteristics are distributed across thepopulation. Survey samplings often associated with polls where information is gathered on people’s opinionson a subject, as in customer surveys. It can equally be applied to data-gathering for other purposes, such asaudits.
A specialized form of survey sampling is exploratory sampling, which is used in enumerative studies to gaininformation about a characteristic(s) of a population or a subset of the population. So is production sampling,which may be carried out to conduct say, a process capability analysis.
Another application is the bulk sampling of materials (e.g. minerals, liquids and gases) for which samplingplans have been developed.
4.9.3 Benefits
A properly constructed sampling plan offers savings in time, cost and Iabour when compared with either acensus of the total population or 100 YO inspection of a lot. Where product inspection involves destructivetesting, sampling is the only practical way of obtaining pertinent information.
Sampling offers a cost-effective and timely way of obtaining preliminary information regarding the value ordistribution of a characteristic of interest in a population.
4.9.4 Limitations and cautions
When constructing a sampling plan, close attention should be paid to decisions regarding sample size,sampling frequency, sample selection, the basis of sub-grouping and various other aspects of samplingmethodology.
Sampling requires that the sample be chosen in an unbiased fashion (i.e. the sample is representative of thepopulation from which it is drawn). If this is not done, it will result in poor estimates of the populationcharacteristics. In the case of acceptance sampling, non-representative samples can result in either theunnecessary rejection of acceptable quality lots or the unwanted acceptance of unacceptable quality lots.
Even with unbiased samples, information derived from samples is subject to a degree of error. The magnitudeof this error can be reduced by taking a larger sample size, but it cannot be eliminated. Depending on thespecific question and context of sampling, the sample size required to achieve the desired level of confidenceand precision may be too large to be of practical value.
4.9.5 Examples of applications
A frequent application of survey sampling is in market research, to estimate (say) the propotion of apopulation that might buy a particular product. Another application is in audits of inventory to estimate thepercentage of items that meet specified criteria.
Sampling is used to conduct process checks of operators, machines or products in order to monitor variition,and to define corrective and preventive actions.
Acceptance sampling is extensively used in industry to provide some level OT assurance that ificomingmaterial satisfies prespecified requirements.
By means of bulk sampling, the amount or the properties of constituents in bulk material (e.g. minerals, liquidsand gases) can be estimated.
17
SP 68:2005
4.10 Simulation
4.10.1 Whatitis
Simulation is a collective term for procedures by which a (theoretical or empirical) System is representedmathematically by a computer program for the solution of a problem. If the representation involves concepts ofprobability theory, in particular random variables, simulation maybe called the “Monte-Carlo method”.
4.10.2 What it is used for
In the context of theoretical science, simulation is used if no comprehensive theory for the solution of aproblem is known (or, if known, is impossible or difficult to solve), and where the solution can be obtainedthrough brute computer force. In the empirical context, simulation is used if the system can be adequatelydescribed by a computer program. Simulation is also a helpful tool in the-teaching of statistics.
The evolution of relatively inexpensive computing capability is resulting in the increasing application ofsimulation .to problems that hitherto have not been addressed.
4.10.3 Benefits
.Within theoretical sciences, simulation (in particular the Monte-Carlo method) is used if explicit calculations ofsolutions to problems are impossible or too cumbersome to carry out directly (e.g. n-dimensional integration).Similarly, in the empirical context, simulation is used when empirical investigations are impossible or too costly.The benefit of simulation is that it allows a solution with saving of time and money, or that it allows a solutionat ail.
The use of simulation in the teaching of statistics is that it can effectively illustrate random variation.
4.10.4 Limitations and cautions
Within theoretical science, proofs based on conceptual reasoning are to be preferred over simulation, sincesimulation often provides no understanding of the reasons for the result,
Computer simulation of empirical models is subject to the limitation that the model may not be adequate (i.e. itmay not represent the problem sufficiently). Therefore, it cannot be considered a substitute for actual empiricalinvestigations and experimentation.
4.10.5 Examples of applications
Large-scale projects (such as the space programme) routinely use the Monte-Carlo method. Applications arenot limited to any specific type of indust~. Typical areas of applications include statistical tolerencing, processsimulation, system optimization, reliability theory and prediction. Some specific applications are
—
—
—
—
modelling variation in mechanical sub-assemblies,
modelling vibration profiles in complex assemblies,
determining optimal preventive maintenance schedules, and
conducting cost and other analyses in design and production processes to optimize allocation ofresources.
4.11 Statistical process control (SPC) charts
4.11.1 What it is
An SPC chart, or “control chart”, is a graph of data derived from samples-that are periodically drawn from aprocgss and plotted in sequence. Also noted on the SPC chart are “control limits” that describe the inherent
18
SP 68:2005
variability of the process when it is stable. The function of the control chart is to help assess the stability of theprocess, and this is done by examining the plotted data in relation to the control limits.
Any variable (measurement data) or attribute (count data) representing a characteristic of interest of a productor process may be plotted. In the case of variable data, a control chad is usually used for monitoring changesin the process centre, and a separate control chart is used for monitoring changes in process variability.
For attribute data, control charts are commonly maintained of the number or proportion of nonconforming unitsor of the number of rronconformities found in samples drawn from the process.
The conventional form of control chart for variable data is termed the “Shewhart” chart. There are other formsof control charts, each with properties that are suited for applications in special circumstances. Examples ofthese include “cusum charts” that allow for increased sensitivity to small shifts in tha process, and “movingaverage charts” (uniform or weighted) that serve to smooth out shott-term -variations to reveal persistenttrends.
4.11.2 What Mis used for
An SPC chart is used to detect changes in a process. The plotted data, which maybe an individual reading orsome statistic such as the sample average, are compared with the control limits. At the simplast level, aplotted-point that falls outside the control limits signals a possible change in the process, possibly due to some“assignable cause”. This identifies the need to investigate the cause of the “out-of-control” reading, and makeprocess adjustments where necessary. This helps to maintain process stability and improve processes in thelong run.
The use of control charts may be refined to yield a more rapid indication of process changes, or increasedsensitivity to small changes, through the use of additional criteria in interpreting the trends and patterns in theplotted data.
4.11.3 Benefits
In addition to presenting Ihe data in a visible form to the user, control charts facilitate the appropriate responseto process variation by helping the user to distinguish the random variatiin that is inherent in a stable processfrom variation that may be due to “assignable causes” (i.e. to which a specific cause maybe assigned) whosetimely detection and correction may help improve the process. Examples of the role and value of controlcharts in process related activities are given below.
—
—
—
—
—
Process control: variable control chatis are used to detect changes in the process centre or processvariability and to trigger corrective adlon, thus maintaining or restoring process stability.
Process capability analysis: if the process is in a stable state, the date from the control chart may be usedsubsequently to estimate process capability.
Measurement system analysis: by incorporating control limits that reflect the inherent variability of themeasurement system, a control chart can show whether the measurement system is capable of detecthgthe variability of “the process or product of interest. Control charts may also be used to monitor themeasurement process itself.
Cause and effect analysis: a correlation between process events and control chart patterns can help toinfer the underlying assignable causes andAo plan effective action.
Continuous improvement control charts are used to monitor process variation, and they help to identiiand address the cause(s) of variation. They are found to be especially effective when they are used aspart of a systematic programme of continual improvement within an organization.
19
SP 68:2005
4.11.4 Limitations and cautions
It is important to draw process samples in a way that best revealsthe variation of interest, and such a sampleis termed a “rational subgroup”. This is central to the affective use and interpretation of SPC charts, and tounderstanding the sources of process variation.
Short run processes present special difficulties as sufficient data are seldom present to establish theappropriate control limits.
There is a risk of “false alarms” when interpreting control charts (i.e. the risk of concluding that a change hasoccurred when this is not the case). There is also the risk of failing to detect a change that has occurred.These risks can be mitigated but never eliminated.
4.11.5 Examples of applications
Companies in automotive, electronics, defence and other sectors often utilize control charts (for criticalcharacteristics) to achieve and demonstrate continuing process stability and capability. If nonconformingproducts are received, the charts are used to help establish the risk and determine the scope of ccwetilveaction.
Control charts are used in problem solving in the work place. They have been applied at all levels oforganizations to support problem recognition and root cause analysis.
Control charts are used in machining industries to reduce unnecessary process intervention (over-adjustment)by enabling employees to distinguish between variation that is inherent to the process and variation that canbe attributed to an “assignable cause”.
Control charts of sample characteristics, such as average response time, error rate and complaint frequency,are used to measure, diagnose and improve performance in service industries.
4.12 Statistical toierarwing
4.12.1 What it is
Statistical tolerancing is a procedure based on certain statistical principles, used for establishing tolerances. Itmakes use of the statistical distributions of relevant dimensions of components to determine the overalltolerance for the assembled unit.
4.12.2 What it is used for
When assembling multiple individual components into one module, the critical factor or requirement in termsof assembly and interchangeability of such modules is often not the dimensions of the individual componentsbut instead the total dimension achieved as a result of assembly.
Extreme values for the total dimension (i.e. very large or small values) only occur if the dimensions of allindividual components lie either at the lower or upper end of their relevant individual ranges of tolerances.Within the framework of .a chain of tolerances, if the individual tolerances are added up into a total dimensiontolerance, then one refers to this as the arithmetical overall tolerance.
For statistical determination of overall tolerances, it is assumed that in assemblies involving a large number ofindividual components, dimensions from one end of the range of individual tolerances will be balanced bydimensions from the other end of the tolerance ranges. Far example, an individual dimension lying at thelower end of the tolerance range maybe matched with another dimension (or combination of dimensions) atthe high end of the tolerance range. On statistical grounds, the total dimension will have an approximatelynormal distribtiion under certain circumstances. This fact is quite independent of the distribution of theindividual dimensions, and may therefore be used to estimate the tolerance range of the total dimension of theassembled module. Alternatively, given the overall dimension tolerance, it may be used to determine thepermissible tolerance rZmge of the individual components.
20

SP 68:2005
4.12.3 Benefits
Given a set of individual tolerances (which need not be the same), the calculation of statistical overalltolerance will yield an overall dimensional tolerance that will usually be significantly smaller than the overalidimensional tolerance calculated arithmetically.
This means that, given an overail dimensional toierance, statistical toierancing wiii permit the use of widertolerances for individual dimensions than those determined “by arithmetical caicuiatiin. in practkal terms, thiscan be a significant benefit, since wider tolerances are associated with simpier and more cost-effectivemethods of production.
4.12.4 Limitations and cautions
Statistical toierancing requires one to first establish what proportion of assembied moduies couid acceptablyiie outside the tolerance range of the totai dimension. The foiiowing prerequisites must then be met forstatistical toterancing to be practicable (without necessitating advanced methods):
— the individual actuai dimensions can be considered as uncorreiated random variabies;
— the dimensional chain is linear;
— the dimensional chain has at ieast four units;
— the individual tolerances are of the same order of magnitude;
— the distributions of the individual dimensions of the dimensional chain are known.
it is obvious that some of these requirements can oniy be met if the manufacture of the individual componentsin question can be controlled and continuously monitored. In the case of a product stiii under development,experience and engineering knowiedge shouid guide the application of statistical tolerancing.
4.12.5 Examples of applications
The theory of statistical toierancing is routineiy applied in the assembiy of parts that involve additive reiationsor cases invoiving simple subtraction (e.g. shaft and hoie). Industrial sectors that use statistical toiarancinginclude mechanical, electronic and chemicai industry. The theory is aiso appiied in computer simulation todetermine optimum tolerances.
4.13 Time series analysis
4.13.1 What it is
Time series anaiysis is a famiiy of methods for studying a collection of observations made sequentially cwertime. Time”series anaiysis is used hereto refer to analytical techniques in applications such as
finding “iag” patterns by statistically iooking at how each observation is correlated with the observationimmediately before it, and repeating this for each successive lagged period,
finding patterns that are cyciicai or seasonal, to understand how causai factors in the past might haverepeated influences in the future, and
using statistical toois to predict future observations or to understand which causai factors havecont~buted most to variations in the time series.
While the techniques empioyed in time series anaiysis can inciude simple “trend charts”, in this TechnicaiReport such elementary piots are iisted among the simpie graphicai methods cited in “Descriptive statistics”(4.2.1).
21
SP 68:2005
4.13.2 What it is used for
Time series analysis is used to describe patterns in time sarias data, for identifying “outliara” (i.e. extremevalues whose valid~ should be investigated) either to help understand the patterns or to make adjustments,and for detecting turning points in a trend, Another use is to axplain patterns in one time series with those ofanother time series, with all the objectives inherent in regression analysis.
Time series analysis is used to predict future values of time series, typkdly with some upper and lower limitsknown as tha forecast interval. It has extensive usa in tha area of control and is often applied to automatedprocesses. In this case, a probability model is fitted to the historical time series, future values are predicted,and then specific process parameters are adjusted to keep the process on target, with as little variation aspossible.
4.13.3 Benefits
Time series analysis methods are useful in planning, in control engineering, in identifying a change in aprocass, in generating forecasts and in measuring the effect of some outside intervention or action.
Time series analysis is also useful for comparing the projected performance of a process with predictedvalues in the time series if a spec”fic change were to be made.
Time series methods may provide insights into possible cause-and-effect patterns. Methods exist forseparating systematic (or assignable) causes tlom chance causes, and for breaking down patterns in a timesaries into cyclical, seasonal and trend components.
Time saries analysis is otlan usaful for understanding how a process will behave under specified conditions,and what adjustments (if any) could influence the process in the diredon of some target value, or whatadjustments could reduce-process variability.
4.13A Limitations and cautions
The limitations and cautions cited for regression analysis also apply to time series analysis. When modelling aprocess in order to understand causes and effects, a significant Ieval of skill is required to select the mostappropriate model and for using diagnostic tools to improve the model.
Whether included or omitted from the analysis, a singla observation or a small sat of obsewations can have asignificant influence on the model. Therefore influential observations should be understood and distinguishedfrom “outliers” in the data.
Different time-series estimation techniques can have varying degreas of success, depending on the patternsin the time series and on the number of periods for which predictions afe desired, relative to the number oftime pariods for which time-saries data are available. The choice of a model should consider the objactive ofthe analysis, the nature of the data, the relative cost, and the analytical and predictive properties of tha variousmodels.
4.13.5 Examples of applications
Time series analysis is applied to study patterns of performance over time, for example, processmeasurements, customer complaints, nonconformance, productivity and test results.
Forecasting applications include predicting spare parts, absenteeism, customer orders, materials needs,electric power consumption.
Causal time-series analysis is used to develop predictive models of demand. For example, in tha context ofreliability, it is used to predict the number of events in a given time period and the distribution of time intervalsbetween events such as equipment outages.
22

SP 68:2005
Bibliography
ISO publications related to statistical techniques
[1]
[2]
[3]
[4]
[5]
[6]
[n
[8]
[9]
[10]
[11]
[12]
[13]
[14]
[15]
‘[16]
[171
[18]
[19]
ISO 2602:1980, Statisfica/ interpretation of test results — Estimation of theinterval
ISO 2854:1976, Statistic/ interpretation of data — Techniques of estimationmeens and variances
mean — Confidence
and tests relating to
ISO 2859-0:1995, Sampling procedures for inspection by attributes — Part O: Introduction to the ISO2859 attribute sampling system
ISO 2859-1:1999, Sampling procedures for inspection by attributes — Part 1: Sampling schemesindexed by acceptance quality limit (AQL) for lot-by-lot inspection
ISO 2859-2:1985, Sampling procedures for inspection by attributes — Patt 2: Sampling plans indexedby limiting quality (LQ) for isolated lot inspection
ISO 2859-3:1991, Sampling procedures for inspection by attributes — Part 3: Skip-lot samplingprocedures
ISO 2859-4:2002, Sampling procedures for inspection by attributes — Part 4: Procedures forassessment of declared quality levels
ISO 3207:1975, Statk#@e/ interpretation of data — Determination of statistical tolerance interval
ISO 3301:1975, Statistical interpretation of data — Comparison of two means in the case of pairadobsenrations
ISO 3494:1976, Statistic/interpretation of data — Power of tests relating to means and variances
ISO 3534-1:1993, Statistics — Vocabulary and symbo/s — Pati 1: Probability and general statisticalterms
ISO 3534-2:1993, Statistics — Vocabulary and symbols — Parf 2: Statistic/ quality contmd
ISO 3534-3:1999, Statistics — Vocabulary and symbols — Patt 3: Design of experiments
ISO 3951; 1989, Sampling ptvcedures and chatis for inspection by variablas for percent nonconforming
ISO 5479: 1“997, Statistical interpretation of data — Tests for departure from the normal distribution
ISO 5725-1:1994, Accuracy (truaness and precision) of measurement methods and results — Pad 1:General principles and definitions
ISO 5725-2:1994, Accuracy (trueness and precision) of measurement methods and results — Part 2:Basic method for determination of repeatability and reproducibility of a standard measurement method
ISO 5725-3:1994, Accuracy (trueness and precision) of measurement methods and results — Pan 3:Intannediate measures.of the precision of a standard measurement method
ISO 5725-4:1994, Accuracy (trueness and precision) of measurement methods and results — Pari 4:Basic methods for the detemnination of the trueness of a standard measurement method
23

SP 68:2005
[20]
[21]
[22]
[23]
[24]
[25]
[26]
[27]
[28]
[29]
[30]
[31]
[32]
[33]
[34]
[35]
[36]
p7]
[38]
[39]
[40]
[41]
[42]
ISO 5275-51998, Accuracy (trueness and precision) of measurement methods and results — Pati 5:Alternative methods for the determination of the precision of a standard measurement method
ISO 5725-6:1994, Accuracy (trueness and precision) of measurement methods and results — Part 6:Use in practice of accuracy values
ISO 7870:1993, Contro/ charts — General guide and introduction
lSO/TR 7871:1997, Cumulative sum charts — Guidance on quality control and data analysis usingCUSUM techniques
ISO 7873:1993, Control charts for arithmetic average with warning limits
ISO 7966:1993, Acceptance control charts
ISO 8258: t991, Shewhad-control charts
ISO 8422:1991, Sequential sampling plans for inspection.by attributes
ISO 8423:1991, Sequential sampling plans for inspection by variabies for percent nonconforming(known standard deviation)
lSO/TR 8550:1994, Guide for selection of an acceptance sampling system, scheme or plan forinspection of discrete items in lots
ISO 85951989, Interpretation of statistic/ data — Estimation of a median
ISO 9001:2000, Quality managementsystems — Requirements
ISO 9004:2000, Quality management systems — Guidelines for performance improvements
ISO 10012, Measurement management systems — Requirements for measurement processes andmeasuring equipment
ISO 10725:2000, Acceptance sampling plans and procedures for the inspection of bulk materials
ISO 1t095:l 996, Linear calibration using reference materials
ISO 11453:1996, Statistic/ interpretation of data —proportions
ISO 11462-1:2001, Guidelines for implementation ofElements of SPC
Tests and confidence intewals ralating to
statistical process control (SPC) — Pad l;”
ISO 11648-2, Statistical aspects of sampling from bulk materials — Part 2: Sampling of particulatematerials
ISO 11843-1:1997, Capability of detection — Pad 1: Terms and definitions,
ISO 11843-2:2000,Capability of detection — Part 2: Methodology in the linear calibration case
lSO/TR 13425:1995, Guide for the selection of statistical methods in standardization and specification
ISO 14253-1:1998, Geometric Product Specifications (G6S) — Inspection by measurement ofworkplaces and measuring equipment — Part 1: Decision rules for proving conformance or non-conformance with specifications
24

SP 68:2005
[43]
[44]
[45]
[46]
[47]
[48]
[49]
lSOiTS 142532:1999, Geometric Product Specifications (GPS) — inspection by measurement ofworkplaces and measuring equipment — Part 2: Guide to the estimation of uncertainty in GPSmeasurement, in calibration of measuring equipment and in product verification
ISO 16269-7:2001,Statistical interpretation of data — Part 7: Median — Estimation and confidenceintervals
ISO Guide 33:2000, Uses of certified reference materials
ISO Guide 35:1989, Certification of reference materials — General and statistical principles
lSO/lEC Guide 43-1:1997, Proficiency testing by interlaboratory comparisons — Patt 1: Developmentand operation of proficiency testing
lSO/lEC Guide 43-2:1997, Proficiency testing by interlaboratory comparisons — Pert 2: Selection anduse of proficiency testing schemes by Iaboratofy accreditation bodies
1S0 Standards Handbook:2000, Statistical methods for quality control
Volume 1: Terminology and symbols — Acceptance sampling
Volume 2: Measurement methods and results — Interpretation of statistical data — Process control
IEC publications related to reliability analysis
[50] IEC 60050-191:1990, /nternationa/ Hectrotechnical Vocabulary — Chapter 191: Depandabi/ity andquality of service
[51] IEC 60300-1:1993, Dependability management — Patf 1: Dependability programme management
[52] IEC 60300-2:1995, Dependability management — Part 2: Dependability programme elements andtasks
[53] tEC 60300-3-9:1995, Dependability management — Part 3: Application guide — Section 9: Riskanalysis of technological systems
[54] IEC 60812:1985, Analysis techniques for system re/iabi/ity — Procedure for failure mode and effectsanalysis (FMEA)
[55] IEC 60863:1986, Presentation of reliability, maintainability and availability predictions
[56] IEC 6~014:1989, Programmed for reliability growth
[571 IEC 61025:1990, Fault tree analysis (HA)
[58] IEC 61070:1991, Compliance test procedures for steady-state avai/abi/ity
[59] IEC 61078:1991, Analysis techniques for dependability – Reliability block diagmm method
[60] IEC 61123:1991, Re/iabi/ity testing – Compliance test p/ans for success ratio
[61] IEC 61124:1997, Reliability testing — Compliance tests for constant failure rate and constant failureintensity
[62] IEC 61163-1:1995, Re/iabi/ity stress screening — Part 1: Repairable items manufactured in lots
[63] IEC 61163-2: Ed 10, Re/iabi/ity stress screening – Part 2: Electronic components
[64] IEC 61164:1995, Re/iabi/ity growth — Statistical test and estimation methods
25

SP 68:2005
[65] IEC 61165:1995, Application of Markov techniques
[66] IEC 61649:1997, Goodness-of-fit tests, confidence intervals and lower confidence limits & Weibulldistributed data
[67] IEC 61650:1997, Reliability data analysis techniques — Procedures for comparison of two constantfailure rates and two constant failure (event) intensities
Other publications
[68] ISO 9000:2000, Qua/ity management systems — Fundamentals and vocabula~
[69] GUtUl:1993, Guide to the expression of uncertainty in measurement. BIPM, IEC, IFCC, ISO, IUPAC,IUPAP and OIML
26
Bureau of Indian Standards
BIS is a statutory institution established under the Bureau of/ndiarI StandardsAct, 1986 to promoteharmonious devehlpment of the activities of standardization, marking and quality certification ofgoods and attendihg to connected matters in the country.
Copyright
BIS has the copyright of all its publications. No part of these publications maybe reproduced in anyform without the prior permission in writing of BIS. This does not preclude the free use, in the courseof implementing the standard, of necessary details, such as symbols and sizes, type or gradedesignations. Enquiries relating to copyright be addressed to the Director (Publications), 61S.
Review of Indian Standards
Amendments are issued to standards as the need arises on the basis of comments. Standards.arealso reviewed periodically; a standard along with amendments is reaffirmed when such reviewindicates that no changes are needed; if the review indicates that changes are needed, it is takenup for revision. Users of Indian Standards should ascertain that they are in possession of the latestamendments or edition by referring to the latest issue of ‘BIS Catalogue’ and ‘Standards : MonthlyAdditions’.
This Indian Standard has been developed from Doc : No. MSD 2 ( 299 ).
Amendments Issued Since Publication
Amend No. Date of Issue Text Affected
BUREAU OF INDIAN STANDARDS
Headquarters:
Manak Bhavan, 9 Bahadur Shah Zafar Marg, New Delhi 110002Telephones :23230131, 23233375, 23239402 Website : www.bis.org. in
Regional Offices :
Central :
Eastern :
Northern :
Southern :
Western :
Branches:
Manak Bhavan, 9 Bahadur Shah Zafar MargNEW DELHI 110002
1/14 C. 1. T. Scheme Vll M, V. 1. P. Road, KankurgachiKOLKATA 700054
SCO 335-336, Sector 34-A, CHANDIGARH 160022
C. 1.T. Campus, IV Cross Road, CHENNAI 600113
Manakalaya, E9 MlDC, Marol, Andheri (East)MUMBAI 400093
Telephones
{
2323761723233841
{
23378499,2337856123378626,23379120
{
26038432609285
{
2254 1216, 2254 “14422254 2519,2254 2315
{
28329295,2832785828327891,28327892
AHMEDABAD. BANGALORE. BHOPAL. BHUBANESHWAR. COIMBATORE.FARIDABAD. GHAZIABAD. GUWAHATI. HYDERABAD. JAIPUR. KANPUR.LUCKNOW. NAGPUR. NALAGARH. PATNA. PUNE. RAJKOT. THIRUVANANTHAPURAM.VISAKHAPATNAM.
Printedat New India PrintingPress, Khuria,India