Guidance for Industry #35 - Bioequivalence Guidance, revised ...
28
35 Guidance for Industry BIOEQUIVALENCE GUIDANCE (This version of the guidance replaces the version titled “Bioequivalence Guidance” that was made available on October 9, 2002. This document has been revised to update the contact information and typographical errors in the equation) Section III.A. of this guidance has been superceded by CDER's guidance entitled "Bioanalytical Method Validation". Any general questions regarding the application of the Bioanalytical Method Validation guidance to new animal drugs should be directed to Marilyn Martinez, Center for Veterinary Medicine, Food and Drug Administration, 7500 Standish Pl., Rockville, MD 20855, (240)276-8357, [email protected] . Any questions regarding analytical methods for tissue residues should be directed to Valerie Reeves, 7500 Standish Pl., Rockville, MD 20855, (240)276-8207, [email protected] . This document is intended to provide guidance for the design and analysis of in vivo bioequivalence studies. This revision to the version that was made available in April 1996 adds an illustrative example of how to calculate confidence bounds when log transformed data are used. Comments and suggestions regarding this guidance document should be submitted to the Divison of Dockets Management (HFA-305), Food and Drug Administration, 5630 Fishers Lane, rm. 1061, Rockville, MD 20852. All comments should be identified with the Docket Number (94D- 0401). Additional information on the 1996 guidance document can be found in the Federal Register (Vol. 61, No. 102, May 24, 1996). Comments will be accepted at any time. For questions regarding this guidance document, contact Ken J. Harshman, Center for Veterinary Medicine (HFV-104), Food and Drug Administration, 7500 Standish Place, Rockville, MD 20855. U.S. Department of Health and Human Services Food and Drug Administration Center for Veterinary Medicine (CVM) November 8, 2006
Transcript of Guidance for Industry #35 - Bioequivalence Guidance, revised ...

35
Guidance for Industry
BIOEQUIVALENCE GUIDANCE
(This version of the guidance replaces the version titled “Bioequivalence Guidance” that was made available on October 9, 2002. This document has been revised to update the contact information and typographical errors in the equation)
Section III.A. of this guidance has been superceded by CDER's guidance entitled "Bioanalytical Method Validation". Any general questions regarding the application of the Bioanalytical Method Validation guidance to new animal drugs should be directed to Marilyn Martinez, Center for Veterinary Medicine, Food and Drug Administration, 7500 Standish Pl., Rockville, MD 20855, (240)276-8357, [email protected]. Any questions regarding analytical methods for tissue residues should be directed to Valerie Reeves, 7500 Standish Pl., Rockville, MD 20855, (240)276-8207, [email protected] .
This document is intended to provide guidance for the design and analysis of in vivo bioequivalence studies. This revision to the version that was made available in April 1996 adds an illustrative example of how to calculate confidence bounds when log transformed data are used.
Comments and suggestions regarding this guidance document should be submitted to the Divison of Dockets Management (HFA-305), Food and Drug Administration, 5630 Fishers Lane, rm. 1061, Rockville, MD 20852. All comments should be identified with the Docket Number (94D-0401). Additional information on the 1996 guidance document can be found in the Federal Register (Vol. 61, No. 102, May 24, 1996). Comments will be accepted at any time.
For questions regarding this guidance document, contact Ken J. Harshman, Center for Veterinary Medicine (HFV-104), Food and Drug Administration, 7500 Standish Place, Rockville, MD 20855.
U.S. Department of Health and Human Services Food and Drug Administration
Center for Veterinary Medicine (CVM) November 8, 2006

BIOEQUIVALENCE GUIDANCE
Docket No. 94D-0401
This guidance document represents the agency's current thinking on this matter. It does not create or confer any rights for or on any person and does not operate to bind the FDA or public. An alternative approach may be used if such approach satisfies the requirements of the applicable statute, regulations or both.
PREAMBLE
In 1996, the Center for Veterinary Medicine (CVM) revised a document entitled “April 1990 Bioequivalence Guideline.” The revised document, “Bioequivalence Guidance (Final) 1996”, was issued in final form following notice and comment.
Many of the changes in the “Bioequivalence Guidance (Final) 1996” were based upon reports from panel presentations at the 1993 Veterinary Drug Bioequivalence Workshop in Rockville, Maryland, sponsored by the Center for Veterinary Medicine (CVM), the Animal Health Institute (AHI), the American Academy of Veterinary Pharmacology and Therapeutics (AAVPT), and the Animal Drug Alliance1. Some new topics were introduced into the guidance as a result of issues identified in the review of bioequivalence protocols and studies.
The major new topics in the guidance were as follows:
1. Higher than approved dose bioequivalence studies.
2. Bioequivalence testing for multiple strength solid oral dosage forms.
3. Assay considerations for bioequivalence studies.
4. AUC and CMAX as the pivotal parameters for bioequivalence determination.
5. Blood level bioequivalence studies to be accompanied by tissue residue depletion studies for generic products for food-producing animals.
CVM has revised the “1996 Bioequivalence Guidance” to add an illustrative example of how to calculate confidence bounds when log transformed data are used. The guidance has also been revised in accordance with FDA’s Good Guidance Practices (GGPs, found in the Federal Register of February 27, 1997, 62 FR 8961). With the exception of the addition of information on how to calculate confidence bounds when log transformed data are used, minor revisions made to comply with the GGPs (e.g., addition of a cover sheet), and revisions to the Preamble,
2
3
the document is the same as the document issued in 1996. In September 2000, FDA revised the guidance to clarify sources of information more clearly.
A person may follow the guidance or may choose to follow alternate procedures or practices. If a person chooses to use alternate procedures or practices, that person may wish to discuss the matter further with the agency to prevent an expenditure of money and effort on activities that may later be determined to be unacceptable to FDA. Although this guidance document does not bind the agency or the public, and it does not create or confer any rights, privileges, or benefits for or on any person, it represents FDA's current thinking on bioequivalence testing for animal drugs. When a guidance document states a requirement imposed by statute or regulation, the requirement is law and its force and effect are not changed in any way by virtue of its inclusion in the guidance.

TABLE OF CONTENTS
I. INTRODUCTION...............................................................................................6
II. GENERAL CONSIDERATIONS .....................................................................7
A. Selection of Reference Product for Bioequivalence Testing ..........................7
B. Criteria for Waiver of In Vivo Bioequivalence Study....................................7
C. Selection of Blood Level, Pharmacologic End-point, or Clinical End-point
Study ....................................................................................................................8
D. Species Selection ............................................................................................8
E. Dose Selection ................................................................................................8
F. Multiple Strengths of Solid Oral Dosage Forms............................................9
G. Manufacturing of Pilot Batch ("Biobatch") ...................................................9
III. BLOOD LEVEL STUDIES..............................................................................9
A. Assay Consideration .......................................................................................9
B. General Experimental Design Considerations.............................................12
1. Dosing by Labeled Concentration..............................................................12
2. Single Dose vs Multiple Dose Studies.......................................................12
3. Subject Characteristics ...............................................................................12
4. Fed vs Fasted State.....................................................................................13
C. Pharmacokinetic and Statistical Considerations in Study Design...............13
4

5
1. Sampling Time Considerations ..................................................................13
2. Protein Binding ..........................................................................................14
3. Subject Number..........................................................................................14
4. Cross-over and Parallel Design Considerations.........................................14
5. Duration of Washout Time for Cross-over Study......................................15
6. Pivotal Parameters for Blood Level Bioequivalence .................................16
D. Statistical Analysis .......................................................................................17
IV. PHARMACOLOGIC END-POINT STUDIES..............................................22
A. General Design Aspects................................................................................22
B. Statistical Analysis........................................................................................22
V. CLINICAL END-POINT STUDIES ...............................................................23
A. General Design Aspects................................................................................23
B. Subject Characteristics and Data Collection ...............................................23
C. Statistical Analysis .......................................................................................23
VI. HUMAN FOOD SAFETY CONSIDERATIONS..........................................24
APPENDIX: CONFIDENCE BOUNDS ON THE LOGARITHM SCALE .........................26
BIBLIOGRAPHY/ENDNOTES ....................................................................................28

6
I. INTRODUCTION
This document is intended to provide guidance for the design and analysis of in vivo bioequivalence studies. The guidance is an update of the April 12, 1990 Bioequivalence Guideline. Many of the changes in the guideline are based upon reports from panel presentations at the 1993 Veterinary Drug Bioequivalence Workshop1.
Two products are considered to be bioequivalent when they are equally bioavailable; that is, equal in the rate and extent to which the active ingredient(s) or therapeutic ingredient(s) is (are) absorbed and become(s) available at the site(s) of drug action.
The Generic Animal Drug and Patent Term Restoration Act (GADPTRA) signed into law on November 16, 1988, permits sponsors to submit an Abbreviated New Animal Drug Application (ANADA) for a generic version of any off-patent approved animal drug (with certain exceptions noted in the law) regardless of whether the drug was approved prior to 1962 and subject to the National Academy of Sciences / National Research Council / Drug Effectiveness Study Implementation (NAS/NRC/DESI) review.
Bioequivalence studies are used in a variety of situations, most often when a sponsor proposes manufacturing a generic version of an approved off-patent product. A bioequivalence study may also be part of a new animal drug application (NADA) or supplemental NADA for approval of an alternative dosage form, new route of administration, or a significant manufacturing change which may affect drug bioavailability.
The Center has concluded that the tissue residue depletion of the generic product is not adequately addressed through bioequivalence studies. Therefore, sponsors of ANADA's for drug products for food-producing animals will generally be asked to include bioequivalence and tissue residue studies (21 USC 360 b (n) (1) (E)). A tissue residue study should generally accompany clinical end-point and pharmacologic end-point bioequivalence studies, and blood level bioequivalence studies that can not quantify the concentration of the drug in blood throughout the established withdrawal period (21 USC 360 b (n) (1) (A) (ii)).
Bioequivalence studies (i.e., blood level, pharmacologic end-point, and clinical end-point studies) and tissue residue depletion studies should be conducted in accordance with good laboratory practice (GLP) regulations (21 CFR Part 58).
Whereas the focus of the guidance is bioequivalence testing for ANADA approval, the general principles also apply to relative bioavailability studies conducted for NADA's.
Sponsors should consult with the Center early in the product development process to facilitate the design of studies adequate for drug approval. The Center urges sponsors to submit protocols for review prior to conducting studies.
7
II. GENERAL CONSIDERATIONS
A. Selection of Reference Product for Bioequivalence Testing
As a general rule, the proposed generic product should be tested against the original pioneer product.
If the original pioneer product is no longer marketed, but remains eligible to be copied, then the first approved and available generic copy of the pioneer should be used as the reference product for bioequivalence testing against the proposed new generic product.
If several approved NADA's exist for the same drug product, and each approved product is labeled differently (i.e., different species and/or claims), then the generic sponsor must clearly identify which product label is the intended pioneer. Bioequivalence testing should be conducted against the single approved product which bears the labeling that the generic sponsor intends to copy.
The generic sponsor should consult with CVM regarding selection of the appropriate reference product before conducting the bioequivalence study.
B. Criteria for Waiver of In Vivo Bioequivalence Study
The requirement for the in vivo bioequivalence study may be waived for certain generic products (21 USC 360 b (n) (1) (E)). Categories of products which may be eligible for waivers include, but are not limited to, the following:
1. Parenteral solutions intended for injection by the intravenous, subcutaneous, or intramuscular routes of administration.
2. Oral solutions or other solubilized forms.
3. Topically applied solutions intended for local therapeutic effects. Other topically applied dosage forms intended for local therapeutic effects for non-food animals only.
4. Inhalant volatile anesthetic solutions.
In general, the generic product being considered for a waiver contains the same active and inactive ingredients in the same dosage form and concentration and has the same pH and physico-chemical characteristics as an approved pioneer product.
However, the Center will consider bioequivalence waivers for non-food animal topical products with certain differences in the inactive ingredients of the pioneer and generic products.
If a waiver of the in vivo bioequivalence and/or the tissue residue study/studies is granted for a food animal drug product, then the withdrawal period established for the pioneer product will be assigned to the generic product.

8
Sponsors may apply for waivers of in vivo bioequivalence studies prior to submission of the ANADA's.
C. Selection of Blood Level, Pharmacologic End-point, or Clinical End-point Study
In vivo bioequivalence may be determined by one of several direct or indirect methods. Selection of the method depends upon the purpose of the study, the analytical method available, and the nature of the drug product. Bioequivalence testing should be conducted using the most appropriate method available for the specific use of the product.
The preferred hierarchy of bioequivalence studies (in descending order of sensitivity) is the blood level study, pharmacologic end-point study, and clinical end-point study. When absorption of the drug is sufficient to measure drug concentration directly in the blood (or other appropriate biological fluids or tissues) and systemic absorption is relevant to the drug action, then a blood (or other biological fluid or tissue) level bioequivalence study should be conducted. The blood level study is generally preferred above all others as the most sensitive measure of bioequivalence. The sponsor should provide justification for choosing either a pharmacologic or clinical end-point study over a blood-level (or other biological fluids or tissues) study.
When the measurement of the rate and extent of absorption of the drug in biological fluids can not be achieved or is unrelated to drug action, a pharmacologic end-point (i.e., drug induced physiologic change which is related to the approved indications for use) study may be conducted. Lastly, in order of preference, if drug concentrations in blood (or fluids or tissues) are not measurable or are inappropriate, and there are no appropriate pharmacologic effects that can be monitored, then a clinical end-point study may be conducted, comparing the test (generic) product to the reference (pioneer) product and a placebo (or negative) control.
D. Species Selection
A bioequivalence study generally should be conducted for each species for which the pioneer product is approved on the label, with the exception of "minor" species (as defined in section 514.1 (d) (1) of Title 21 of the Code of Federal Regulations) on the label.
E. Dose Selection
Dose selection will depend upon the label claims, consideration of assay sensitivity, and relevance to the practical use conditions of the reference product. A blood level bioequivalence study should generally be conducted at the highest dose approved for the pioneer product.
However, the Center will consider a bioequivalence study conducted at a higher than approved dose in certain cases. Such a study may be appropriate when a multiple of the highest approved dose achieves measurable blood levels, but the highest approved dose does not. In general, the study would be limited to 2-3x the highest dose approved for the pioneer product. The pioneer product should have an adequate margin of safety at the higher than approved dose level. The generic sponsor should also confirm (e.g., through literature) that the drug follows linear kinetics. A higher than approved dose bioequivalence study in food animal species would be accompanied by a tissue residue withdrawal study conducted at the highest approved dose for the

9
pioneer product.
For products labeled for multiple claims involving different pharmacologic actions at a broad dose range (e.g., therapeutic and production claims), a single bioequivalence study at the highest approved dose will usually be adequate. However, multiple bioequivalence studies at different doses may be needed if the drug is known to follow nonlinear kinetics. The sponsor should consult with CVM to discuss the bioequivalence study or studies appropriate to a particular drug.
F. Multiple Strengths of Solid Oral Dosage Forms
The generic sponsor should discuss with CVM the appropriate in vivo bioequivalence testing and in vitro dissolution testing to obtain approval for multiple strengths (or concentrations) of solid oral dosage forms.
CVM will consider the ratio of active to inactive ingredients and the in vitro dissolution profiles of the different strengths, the water solubility of the drug, and the range of strengths for which approval is sought.
One in vivo bioequivalence study with highest strength product may suffice if the multiple strength products have the same ratio of active to inactive ingredients and are otherwise identical in formulation.
In vitro dissolution testing should be conducted, using an FDA approved method, to compare each strength of the generic product to the corresponding strength of the reference product.
G. Manufacturing of Pilot Batch ("Biobatch")
A pilot batch or "biobatch" should be the source of the finished drug product used in the pivotal studies (i.e., bioequivalence studies and tissue residue studies), stability studies and the validation studies for the proposed analytical and stability indicating methods (refer to CVM's guidance number 42, "Animal Drug Manufacturing Guidelines").
III. BLOOD LEVEL STUDIES
Blood level bioequivalence studies compare a test (generic) product to a reference (pioneer) product using parameters derived from the concentrations of the drug moiety and/or its metabolites, as a function of time, in whole blood, plasma, serum (or in other appropriate biological fluids or tissues). This approach is particularly applicable to dosage forms intended to deliver the active drug ingredient(s) to the systemic circulation (e.g., injectable drugs and most oral dosage forms). Generally, the study should encompass the absorption, distribution, and depletion (elimination) phases of the drug concentration vs time profiles.
A. Assay Consideration
A properly validated assay method is pivotal to the acceptability of any pharmacokinetic study. Sponsors should discuss any questions or problems concerning the analytical methodology with CVM before undertaking the bioequivalence studies. The ANADA submission should contain adequate information necessary for the CVM reviewer to determine the validity of the analytical

10
method used to quantitate the level of drug in the biological matrix (e.g., blood).
The following aspects should be addressed in assessing method performance:
1. Concentration Range and Linearity
The quantitative relationship between concentration and response should be adequately characterized over the entire range of expected sample concentrations. For linear relationships, a standard curve should be defined by at least 5 concentrations. If the concentration response function is non-linear, additional points would be necessary to define the non-linear portions of the curve. Extrapolation beyond a standard curve is not acceptable.
2. Limit of Detection (LOD)
The standard deviation of the background signal and LOD should be determined. The LOD is estimated as the response value calculated by adding 3 times the standard deviation of the background response to the average background response.
3. Limit of Quantitation (LOQ)
The initial determination of LOQ should involve the addition of 10 times the standard deviation of the background response to the average background response. The second step in determining LOQ is assessing the precision (reproducibility) and accuracy (recovery) of the method at the LOQ. The LOQ will generally be the lowest concentration on the standard curve that can be quantified with acceptable accuracy and precision (see items 5. and 6. below).
4. Specificity
The absence of matrix interferences should be demonstrated by the analysis of 6 independent sources of control matrix. The effect of environmental, physiological, or procedural variables on the matrix should be assessed. Each independent control matrix will be used to produce a standard curve, which will be compared to a standard curve produced under chemically defined conditions. The comparison of curves should exhibit parallelism and superimposability within the limits of analytical variation established for the chemically defined standard curve.
5. Accuracy (Recovery)
This parameter should be evaluated using at least 3 known concentrations of analyte freshly spiked in control matrix, one being at a point 2 standard deviations above the LOQ, one in the middle of the range of the standard curve ("mid-range") and one at a point 2 standard deviations below the upper quantitative limit of the standard curve. The accuracy of the method, based upon the mean value of 6 replicate injections, at each concentration level, should be within 80-120% of the nominal concentration at each level (high, mid-range, and LOQ).

11
6. Precision
This parameter should be evaluated using at least 3 known concentrations of analyte freshly spiked in control matrix, at the same points used for determination of accuracy. The coefficient of variation (CV) of 6 replicates should be ± 10% for concentrations at or above 0.1 ppm (0.1 µ g/mL). A CV of ± 20% is acceptable for concentrations below 0.1 ppm.
7. Analyte Stability
Stability of the analyte in the biological matrix under the conditions of the experiment (including any period for which samples are stored before analyses) should be established. It is recommended that the stability be determined with incurred analyte in the matrix of dosed animals in addition to, or instead of, control matrix spiked with pure analyte. Also, the influence of 3 freeze-thaw cycles at 2 concentrations should be determined.
Stability samples at 3 concentrations should be stored with the study samples and analyzed through the period of time in which study samples are analyzed. These analyses will establish whether or not analyte levels have decreased during the time of analysis.
8. Analytical System Stability
To assure that the analytical system remains stable over the time course of the assay, the reproducibility of the standard curve should be monitored during the assay. A minimal design would be to run analytical standards at the beginning and at the end of the analytical run.
9. Quality Control (QC) Samples
The purpose of QC samples is to assure that the complete analytical method, sample preparation, extraction, clean-up, and instrumental analysis perform according to acceptable criteria. The stability of the drug in the text matrix for the QC samples should be known and any tendency for the drug to bind to tissue or serum components over time should also be known.
Drug free control matrix, e.g., tissue, serum, etc. that is freshly spiked known quantities of test drug, should be analyzed contemporaneously with test samples, evenly dispersed throughout each analytical run. This can be met by the determination of accuracy and precision of each analytical run (Items 5 and 6).
10. Replicate and Repeat Analyses
Single rather than replicate analyses are recommended, unless the reproducibility and/or accuracy of the method are borderline. Criteria for repeat analyses should be determined prior to running the study and recorded in the method SOP.
11. Summary of Samples to Be Run With Each Analysis

12
a. Accuracy estimate (Item 5) b. Precision estimate (Item 6) c. Analytical system stability (Item 8) d. Analyte stability samples (Item 7)
B. General Experimental Design Considerations
1. Dosing by Labeled Concentration
The potency of the pioneer and generic products should be assayed prior to conducting the bioequivalence study to ensure that FDA or compendial specifications are met. The Center recommends that the potency of the pioneer and generic lots should differ by no more than ±5% for dosage form products.
The animals should be dosed according to the labeled concentration or strength of the product, rather than the assayed potency of the individual batch (i.e., the dose should not be corrected for the assayed potency of the product). The bioequivalence data or derived parameters should not be normalized to account for any potency differences between the pioneer and generic product lots.
2. Single Dose vs Multiple Dose Studies
A single dose study at the highest approved dose will generally be adequate for the demonstration of bioequivalence. A single dose study at a higher than approved dose may be appropriate for certain drugs (refer to the section on Dose Selection).
A multiple dose study may be appropriate when there are concerns regarding poorly predictable drug accumulation, (e.g. ,a drug with nonlinear kinetics) or a drug with a narrow therapeutic window. A multiple dose study may also be needed when assay sensitivity is inadequate to permit drug quantification out to 3 terminal elimination half-lives beyond the time when maximum blood concentrations (CMAX) are achieved, or in cases where prolonged or delayed absorption2 exist. The determination of prolonged or delayed absorption (i.e., flip-flop kinetics) may be made from pilot data, from the literature, or from information contained with FOI summaries pertaining to the particular drug or family of drugs.
3. Subject Characteristics
Ordinarily, studies should be conducted with healthy animals representative of the species, class, gender, and physiological maturity for which the drug is approved. The bioequivalence study may be conducted with a single gender for which the pioneer product is approved, unless there is a known interaction of formulation with gender.
An attempt should be made to restrict the weight of the test animals to a narrow range in order to maintain the same total dose across study subjects.
The animals should not receive any medication prior to testing for a period of two weeks or more, depending upon the biological half-life of the ancillary drug.

13
4. Fed vs Fasted State
Feeding may either enhance or interfere with drug absorption, depending upon the characteristics of the drug and the formulation. Feeding may also increase the inter- and intrasubject variability in the rate and extent of drug absorption. The rationale for conducting each bioequivalence study under fasting or fed conditions should be provided in the protocol.
Fasting conditions, if used, should be fully described, giving careful consideration to the pharmacokinetics of the drug and the humane treatment of the test animals.
The protocol should describe the diet and feeding regime which will be used in the study.
If a pioneer product label indicates that the product is limited to administration either in the fed or fasted state, then the bioequivalence study should be conducted accordingly. If the bioequivalence study parameters pass the agreed upon confidence intervals, then the single study is acceptable as the basis for approval of the generic drug.
However, for certain product classifications or drug entities, such as enteric coated and oral sustained release products, demonstration of bioequivalence in both the fasted and the fed states may be necessary, if drug bioavailability is highly variable under feeding conditions, as determined from the literature or from pilot data. A bioequivalence study conducted under fasted conditions may be necessary to pass the confidence intervals. A second smaller study may be necessary to examine meal effects. CVM will evaluate the smaller study with respect to the means of the pivotal parameters (AUC, CMAX). The sponsors should consult with CVM prior to conducting the studies.
C. Pharmacokinetic and Statistical Considerations in Study Design
1. Sampling Time Considerations
The total number of sampling times necessary to characterize the blood level profiles will depend upon the curvature of the profiles and the magnitude of variability associated with the bioavailability data (including pharmacokinetic variability, assay error and interproduct differences in absorption kinetics).
The sampling times should adequately define peak concentration(s) and the extent of absorption. The sampling times should extend to at least 3 terminal elimination half-lives beyond TMAX. The sponsor should consult with CVM prior to conducting the pivotal bioequivalence study if the assay is unable to quantify samples to 3 half-lives.
Maximum sampling time efficiency may be achieved by conducting a pilot investigation. The pilot study should identify the general shapes of the test and reference curves, the magnitude of the difference in product profiles, and the noise associated with each blood sampling time (e.g., variability attributable to assay error and the variability between subjects, for parallel study designs, or within subjects, for crossover study designs). This information should be applied to the determination of an optimum blood sampling

14
schedule. Depending upon these variability estimates, it may be more efficient to cluster several blood samples rather than to have samples which are periodically dispersed throughout the duration of blood sampling.3
2. Protein Binding
In general, product bioequivalence should be based upon total (free plus protein bound) concentrations of the parent drug (or metabolite, when applicable). However, if nonlinear protein binding is known to occur within the therapeutic dosing range (as determined from literature or pilot data), then sponsors may need to submit data on both the free and total drug concentrations for the generic and pioneer products.
Similarly, if the drug is known to enter blood erythrocytes, the protocol should address the issue of potential nonlinearity in erythrocyte uptake of the drug administered within the labeled therapeutic dosing range.
The bioequivalence protocol or completed study report should provide any information available from the literature regarding erythrocyte uptake and protein binding characteristics of the drug or drug class, including the magnitude of protein binding and the type of blood protein to which it binds.
3. Subject Number
Pilot studies are recommended as a means of estimating the appropriate sample size for the pivotal bioequivalence study. Estimated sample size will vary depending upon whether the data are analyzed on a log or linear scale. Useful references for sample size estimates include Westlake4, Hauschke5, and Steinijans6.
4. Cross-over and Parallel Design Considerations
A two-period cross-over design is commonly used in blood level studies. The use of cross-over designs eliminates a major source of study variability: between subject differences in the rates of drug absorption, drug clearance, and the volume of drug distribution.
In a typical two-period cross-over design, subjects are randomly assigned to either sequence A or sequence B with the restriction that equal numbers of subjects are initially assigned to each sequence. The design is as follows: Sequence A Sequence B _________________________________________ Period 1 Test Reference Period 2 Reference Test

15
A crucial assumption in the two-period cross-over design is that of equal residual effects. Unequal residual effects may result, for example, from an inadequate washout period. Another assumption of the cross-over (or extended period) design is that there is no subject by formulation interaction. In other words, the assumption is that all subjects are from a relatively homogeneous population and will exhibit similar relative bioavailability of the test and reference products. If there are subpopulations of subjects, such that the relationship between product bioavailability is a function of the subpopulation within which they are being tested, then a subject by formulation interaction is said to exist.
A one-period parallel design may be preferable in the following situations:
a. The drug induces physiological changes in the animal (e.g., liver microsomal enzyme induction) which persist after total drug clearance and alter the bioavailability of the product administered in the second period.
b. The drug has a very long terminal elimination half-life, creating a risk of residual drug present in the animal at the time of the second period dosing.
c. The duration of the washout time for the two-period cross-over study is so long as to result in significant maturational changes in the study subjects.
d. The drug follows delayed or prolonged absorption (flip-flop kinetics2), where the slope of the [[beta]]-elimination phase is dictated by the rate of drug absorption rather than the rate of drug elimination from one or both products.
Other designs, such as the two-period design with four treatment sequences (Test/Test, Reference/Reference, Test/Reference and Reference/Test) or the extended period design may be appropriate depending on the circumstances. The use of alternative study designs should be discussed with CVM prior to conducting the bioequivalence study. Pilot data or literature may be used in support of alternative study designs.
5. Duration of Washout Time for Cross-over Study
For drugs which follow a one or two compartment open body model, the duration of the washout time should be approximately 10x the plasma apparent terminal elimination half-life, to provide for 99.9% of the administered dose to be eliminated from the body.
If more highly complex kinetic models are anticipated (e.g., drugs for which long withdrawal times have been assigned due to prolonged tissue binding), or for drugs with the potential for physiologic carryover effects, the washout time should be adjusted accordingly.
The washout period should be sufficiently long to allow the second period of the cross-over study to be applicable in the statistical analysis. However, if sequence effects are noted, the data from the first period may be evaluated as a parallel design study.

16
6. Pivotal Parameters for Blood Level Bioequivalence
The sponsor is encouraged to calculate parameters using formulas which involve only the raw data (i.e., so-called model independent methods).
a. Area Under the Curve (AUC) Estimates
The extent of product bioavailability is estimated by the area under the blood concentration vs time curve (AUC). AUC is most frequently estimated using the linear trapezoidal rule. Other methods for AUC estimation may be proposed by the sponsor and should be accompanied by appropriate literature references during protocol development.
For a single dose bioequivalence study, AUC should be calculated from time 0 (predose) to the last sampling time associated with quantifiable drug concentration AUC(0-LOQ). The comparison of the test and reference product value for this noninfinity estimate provides the closest approximation of the measure of uncertainty (variance) and the relative bioavailability estimate associated with AUC(0-INF), the full extent of product bioavailability7.
The relative AUC values generally change very little once the absorption of both products has been completed8, 9. However, because of the possibility of multifunctional absorption kinetics, it can not always be determined when the available drug has been completely absorbed. Therefore, CVM recommends extending the duration of sampling until such time that AUC(0-LOQ)/AUC(0-INF) > = 0.80. Generally, the sampling times should extend to at least 3 multiples of the drug's apparent terminal elimination half-life, beyond the time when maximum blood concentrations are achieved.
AUC(0-INF)should be used to demonstrate that the concentration-time curve can be quantitated such that AUC(0-LOQ)/AUC(0-INF) >= 0.80. The method for estimating the terminal elimination phase should be described in the protocol and the final study report. The AUC(0-LOQ)/AUC(0-INF) is calculated to determine whether AUC(0-LOQ) adequately reflects the extent of absorption.
The sponsor should consult with CVM if AUC(0-LOQ)/AUC(0-INF) is determined to be < 0.80. If AUC(0-LOQ)/AUC(0-INF) is <0.80, then a multiple dose study to steady state may be needed to allow an accurate assessment of AUC(0-INF) (where AUC(0-INF) = AUC(0-t) at steady state and t is the dosing interval).
In a multiple dose study, the AUC should be calculated over one complete dosing interval AUC(0-t). Under steady state conditions, AUC(0-t) equals the full extent of bioavailability of the individual dose AUC(0-INF) assuming linear kinetics. For drugs which are known to follow nonlinear kinetics, the sponsor should consult with CVM to determine the appropriate parameters for the bioequivalence determination.
b. Rate of Absorption
The rate of absorption will be estimated by the maximum observed drug concentration

17
(CMAX) and the corresponding time to reach this maximum concentration (TMAX).
When conducting a steady-state investigation, data on the minimum drug concentrations (trough values) observed during a single dosing interval (CMIN) should also be collected. Generally, three successive CMIN values should be provided to verify that steady-state conditions have been achieved. Although CMIN most frequently occurs immediately prior to the next successive dose, situations do occur with CMIN observed subsequent to dosing. To determine a steady state concentration, the CMIN values should be regressed over time and the resultant slope should be tested for its difference from zero.
c. Determination of Product Bioequivalence
Unless otherwise indicated by CVM during the protocol development for a given application, the pivotal bioequivalence parameters will be CMAX and AUC(0-LOQ) (for a single dose study) or AUC(0-t) (for a multiple dose study). To be indicative of product bioequivalence, the pivotal metrics should be associated with confidence intervals which fall within a set of acceptability limits (see Statistical Analysis section of this Guidance.
The sponsor and CVM should agree to the acceptable bounds for the confidence limits for the particular drug and formulation during protocol development.
If studies or literature demonstrate that the pioneer drug product exhibits highly variable kinetics, then the generic drug sponsor may propose alternatives to the generally acceptable bounds for the confidence limits.
TMAX in single dose studies and CMIN in multiple dose studies will be assessed by clinical judgment.
D. Statistical Analysis
CVM advocates the use of 90% confidence intervals, as the best available method for evaluating bioequivalence study data. Papers by Schuirmann10 and Westlake4 compare various methodologies for assessing drug product equivalence and describe the confidence interval approach.
The confidence interval approach should be applied to the individual parameters of interest (e.g., AUC and CMAX). The sponsor may use untransformed or log transformed data. However, the choice of untransformed or log transformed data should be made by the sponsor with concurrence by the Center prior to conducting the study.
1. Untransformed Data
A discussion of how the confidence interval approach should be applied to (normally distributed) untransformed data from a two-period crossover design is given below.

If we let X T1 be the mean for the test drug in period 1, X T 2
the mean for the test drug
in period 2, and X R1and X R2
the respective means for the reference drug, then the
estimates for the drugs averaged over both periods are ( )XXX TTT 21)2/1( += for the
test drug and ( )XXX RRR 21)2/1( += for the reference drug. Although both sequence
groups usually start with the same number of animals, the number of animals in each sequence group (nA and nB) that successfully finish the study may not be equal. The formulas above utilize the marginal or least squares estimates of μT and μR, the corresponding means in the target population. These means are not a function of the sample size in each sequence.
An analysis of variance is needed to obtain the estimate of σ2, the error variance. The estimator, s2, which will be used in the calculation of the 90% confidence interval should be obtained from the "error" mean square term found in the following ANOVA table. Source Degrees of Freedom ______________________________________________________________ Sequence 1 Animal (Sequence) nA+nB-2 Period 1 Formulation 1 Error nA+nB-2 Total 2nA+2nB-1
Lower and upper 90% confidence intervals are then found by formulas based on Student's t-distribution.
( ) ⎟⎟⎠
⎞⎜⎜⎝
⎛+−−=
−+ nntXXBA
RTsnnL
BA
1121
05.0;2
18

( ) ⎟⎟⎠
⎞⎜⎜⎝
⎛++−=
−+ nntXXBA
RTsnnU
BA
1121
05.0;2
The procedure of declaring two formulations bioequivalent if the 90% confidence interval is completely contained in some fixed interval, is statistically equivalent to performing two one-sided statistical tests (α = .05) at the end-points of the interval.
Consider the following example with L = 3, U = 17, X T= 110 and X R
= 100. By the
traditional hypothesis testing approach, the result would be considered statistically significant since the confidence interval does not include 0. Using the confidence interval approach, the entire confidence interval lies within 17% of X R
. (The lower end of the
confidence interval lies within L/ X R = 3/100 = 3% of X R
, while the upper end of the
confidence interval lies within U/ X R = 17/100 = 17% of X R
.) If it were determined
by CVM that only differences larger than 20% were biomedically important, then using the confidence interval approach the results of this study would be considered adequate to demonstrate bioequivalence.
Now consider an example with L = -4, U = 24, X T = 110 and X R
= 100. In this case,
by the traditional hypothesis testing approach the result would not be considered statistically significant since the confidence interval includes 0. However, the confidence interval extends as far as 24% from X R
. (The lower end of the confidence interval lies
within L/ X R = -4/100 = -4% of X R
, while the upper end of the confidence interval
extends to U/ X R = 24/100 = 24% of X R
.) If it were determined by CVM that only
differences larger than 20% were biomedically important, then the results of this study would be considered inadequate to demonstrate bioequivalence, since the entire confidence interval is not within 20% of X R
.
2. Logarithmically transformed data
This section discusses how the 90% confidence interval approach should be applied to log-transformed data. In this situation the individual animal AUC and CMAX values are log-transformed and the analysis is done on the transformed data. For a two-period crossover study, as described in D.1, the ANOVA model used to calculate estimates of the error variance and the least square means are identical for both transformed and untransformed data. The procedural difference comes after the lower and upper 90% confidence intervals are found by formulas based on Student’s t-distribution.
The lower and upper confidence bounds of the log-transformed data will then need to be
19

back-transformed in order to be expressed on the original scale of the measurement. One thing to keep in mind when moving between the logarithm scale and the original scale is that the back-transformed mean of a set of data that has been transformed to the logarithm scale is not strictly equivalent to the mean that would be calculated from the data on the original scale of measurement. This back-transformed mean is known instead as the geometric mean.
It may help to see the calculations involved. If the AUC from each animal has been transformed to the logarithm scale, we can express the transformed AUC as LnAUC. Then the mean on the logarithm scale is as follows:
LnAUC LnAUCnt
it
i
n
==∑
1 where the subscript t represents the AUC determinations for
the test article, i is the AUC of the ith animal, and n is the total number of animals receiving the text article. When this mean is back-transformed, it becomes the geometric
mean: ( )e LnAUCt
. This geometric mean will be on the original scale of the measurement. It will be close to but not exactly equal to the mean obtained on the original scale of the measurement.
The back-transformation of the confidence bounds is accomplished in the following way:
Lower bound (expressed as a percentage)
= ( )Le − ×1 100
Upper bound (expressed as a percentage)
= ( )Ue − ×1 100
Where L is the lower 90% confidence interval as given in Section III D 1 and calculated on the log-transformed data;
U is the upper 90% confidence interval as given in Section III D 1 and calculated on the log-transformed data.
As an example, consider the data for AUC from a hypothetical crossover study in the following table:
Reference Article Test Article
Animal Crossover AUC LogAUC AUC LogAUC
20

Sequence
1 1 518.0 6.25 317.8 5.76
2 1 454.9 6.12 465.0 6.14
3 1 232.8 5.45 548.4 6.31
4 1 311.1 5.74 334.8 5.81
5 2 340.4 5.83 224.7 5.41
6 2 497.7 6.21 249.2 5.52
7 2 652.0 6.48 625.4 6.44
8 2 464.1 6.14 848.7 6.74
Mean 433.8 6.03 451.7 6.02
Standard deviation 133.3 0.33 214.3 0.47
Geometric mean 414.7 410.5
The statistics for AUC will be calculated from the log-transformed data. In this example, L, the lower 90% confidence interval calculated on the log scale is -0.395. U, the upper 90% confidence interval calculated on the log scale is 0.372. To back-transform these intervals and express them as percentages, we do the following:
Back-transformed lower bound: ( ) ( ) ( ) %6.32100326.01001674.01001395.0 −=×−=×−=×−−e
Back-transformed upper bound:
( ) ( ) ( ) %1.45100451.01001451.11001372.0 =×=×−=×−e
21
22
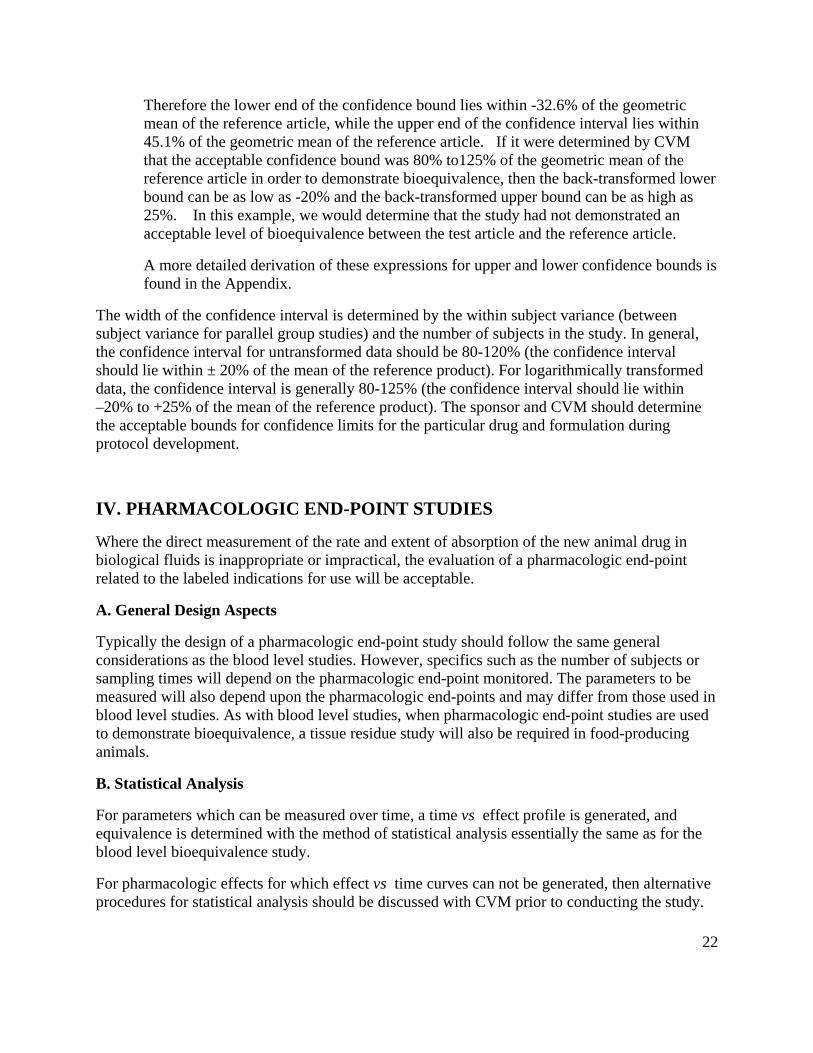
Therefore the lower end of the confidence bound lies within -32.6% of the geometric mean of the reference article, while the upper end of the confidence interval lies within 45.1% of the geometric mean of the reference article. If it were determined by CVM that the acceptable confidence bound was 80% to125% of the geometric mean of the reference article in order to demonstrate bioequivalence, then the back-transformed lower bound can be as low as -20% and the back-transformed upper bound can be as high as 25%. In this example, we would determine that the study had not demonstrated an acceptable level of bioequivalence between the test article and the reference article.
A more detailed derivation of these expressions for upper and lower confidence bounds is found in the Appendix.
The width of the confidence interval is determined by the within subject variance (between subject variance for parallel group studies) and the number of subjects in the study. In general, the confidence interval for untransformed data should be 80-120% (the confidence interval should lie within ± 20% of the mean of the reference product). For logarithmically transformed data, the confidence interval is generally 80-125% (the confidence interval should lie within –20% to +25% of the mean of the reference product). The sponsor and CVM should determine the acceptable bounds for confidence limits for the particular drug and formulation during protocol development.
IV. PHARMACOLOGIC END-POINT STUDIES
Where the direct measurement of the rate and extent of absorption of the new animal drug in biological fluids is inappropriate or impractical, the evaluation of a pharmacologic end-point related to the labeled indications for use will be acceptable.
A. General Design Aspects
Typically the design of a pharmacologic end-point study should follow the same general considerations as the blood level studies. However, specifics such as the number of subjects or sampling times will depend on the pharmacologic end-point monitored. The parameters to be measured will also depend upon the pharmacologic end-points and may differ from those used in blood level studies. As with blood level studies, when pharmacologic end-point studies are used to demonstrate bioequivalence, a tissue residue study will also be required in food-producing animals.
B. Statistical Analysis
For parameters which can be measured over time, a time vs effect profile is generated, and equivalence is determined with the method of statistical analysis essentially the same as for the blood level bioequivalence study.
For pharmacologic effects for which effect vs time curves can not be generated, then alternative procedures for statistical analysis should be discussed with CVM prior to conducting the study.

23
V. CLINICAL END-POINT STUDIES
If measurement of the drug or its metabolites in blood, biological fluids or tissues is inappropriate or impractical, and there are no appropriate pharmacologic end-points to monitor (e.g., most production drugs and some coccidiostats and anthelmintics), then well-controlled clinical end-point studies are acceptable for the demonstration of bioequivalence.
A. General Design Aspects
Generally, a parallel group design with three treatment groups should be used. The groups should be a placebo (or negative) control, a positive control (reference/pioneer product) and the test (generic) product. The purpose of the placebo (or negative) control is to confirm the sensitivity or validity of the study.
Dosage(s) approved for the pioneer product should be used in the study. Dosage(s) should be selected following consultation with CVM and should reflect consideration for experimental sensitivity and relevance to the common use of the pioneer product.
B. Subject Characteristics and Data Collection
Studies should generally be conducted using the target animal species, with consideration for the sex, class, body weight, age, health status, and feeding and husbandry conditions, as described on the pioneer product labeling. In general, the length of time that the study is conducted should be consistent with the duration of use on the pioneer product labeling.
In general, the response(s) to be measured in a clinical end-point study should be based upon the labeling claims of the pioneer product and selected in consultation with CVM. It may not be necessary to collect data on some overlapping claims (e.g., for a production drug which is added at the same amount per ton of feed for both growth rate and feed efficiency, data from only one of the two responses need be collected).
C. Statistical Analysis
When considering sample size, it is important to note that the pen, not the individual animal, is often the experimental unit.
As with blood level bioequivalence studies, CVM is advocating the use of 90% confidence intervals as the best method for evaluating clinical end-point studies. The bounds for confidence limits (e.g., ± 20% of the improvement over placebo [or negative] control) for the particular drug should be agreed upon with CVM prior to initiation of the study.
The analysis should be used to compare the test product and the reference product. In addition, a traditional hypothesis test should be performed comparing both the test and reference products separately to the placebo (or negative) control. The hypothesis test is conducted to ensure that the study has adequate sensitivity to detect differences when they actually occur. If no significant improvement (α = .05) is seen in the parameter (i.e., the mean of the test and the mean of the reference products are each not significantly better than the mean of the placebo [or negative] control), generally, the study will be considered inadequate to evaluate bioequivalence.

24
Assuming that the test and reference products have been shown to be superior to the placebo (or negative) control, the determination of bioequivalence is based upon the confidence interval of the difference between the two products.
Some clinical end-point studies may not include a placebo (or negative) control for ethical and/or practical considerations. If the placebo is omitted, then the response(s) to the test and reference products should each provide a statistically significant improvement over baseline.
If the results are ordered categorical data (e.g., excellent, good, fair or poor), a non-parametric hypothesis test of no difference between test product and placebo (or negative) control and between the reference product and placebo (or negative) control should be performed. As above, if these tests result in significant differences between the test product and control and the reference product and control, then a non-parametric confidence interval on the difference between the test and reference products is calculated.
Another acceptable approach for categorical data is to calculate the confidence interval on the odds ratio between the test and reference products after showing that the test and reference products are significantly better than the control11.
VI. HUMAN FOOD SAFETY CONSIDERATIONS
The toxicology and tolerance developed for the pioneer animal drug are applied to generic copies of the drug.
The Panel on Human Food Safety at the 1993 Veterinary Drug Bioequivalence Workshop addressed tissue residue depletion studies for generic animals drugs1. The Center has concluded that in addition to a bioequivalence study, a tissue residue depletion study should be conducted for approval of a generic animal drug product in a food-producing species. Two drug products may have the same plasma disposition profile at the concentrations used to assess product bioequivalence, but may have very different tissue disposition kinetics when followed out to the withdrawal time for the pioneer product. Therefore, to show the withdrawal period at which residues of the generic product will be consistent with the tolerance for the pioneer product, a tissue residue depletion study is necessary.
The results of a bioequivalence study or tissue residue depletion study in one animal species can not generally be extrapolated to another species. Possible species differences in drug partitioning or binding in tissues could magnify a small difference in the rate or extent of drug absorbed into a large difference in marker residue concentrations in the target tissue. Therefore, for a pioneer product labeled for more than one food-producing species, a bioequivalence study and a tissue residue depletion study will generally be requested for each major food-producing species on the label.
A traditional withdrawal study, as described in CVM's guidance number 3, "General Principles for Evaluating the Safety of Compounds Used in Food-Producing Animals," is considered the best design for collecting data useful for the calculation of a preslaughter withdrawal period for drugs used in food-producing animals. In the traditional withdrawal study, twenty animals are divided into four or five groups of four to five animals each. Groups of animals are slaughtered

25
at carefully preselected time points following the last administration of the test product and the edible tissues are collected for residue analysis. A statistical tolerance limit approach is used to determine when, with 95% confidence, 99% of treated animals would have tissue residues below the codified limits.
For purposes of calculating a withdrawal period for a generic animal drug, only the generic product would be tested (i.e., not the pioneer product), and only the marker residue in the target tissue would be analyzed.
Other study designs will be considered on a case-by-case basis. Sponsors are encouraged to submit the proposed tissue residue depletion protocol for CVM concurrence before proceeding with the withdrawal study.
The generic animal drug will be assigned the withdrawal time supported by the residue depletion data, or the withdrawal time currently assigned to the pioneer product, whichever is the longer. The generic animal drug sponsor may request a shorter withdrawal period for the generic product by supplementing the ANADA and providing tissue residue data necessary to support the shorter withdrawal period request. Such a supplement will be reviewed under the agency's policy for Category II supplements. For a Category II supplement, a reevaluation of the safety (or effectiveness) data in the parent application (i.e., the pioneer NADA) may be required (21 CFR 514.106 (b) (2)). The Center will ordinarily approve a request for a shorter withdrawal period when the residue data are adequate and when no other human food safety concerns for the drug are evident. Under 21 CFR 514.1(b)(7), applications are required to include a description of practicable methods for determining the quantity, if any, of the new animal drug in or on food, and any substance formed in or on food because of its use, and the proposed tolerance or withdrawal period or other use restrictions to ensure that the proposed use of the drug will be safe. For certain drug products, a tissue residue depletion study is not needed to ensure that residues of the test product will be consistent with the codified drug tolerance at the withdrawal time assigned to the reference product. These include but may not be limited to products for which a waiver of in vivo bioequivalence testing is granted, and products for which the assay method used in the blood level bioequivalence study is sensitive enough to measure blood levels of the drug for the entire withdrawal period assigned to the reference product. Other requests for waiver of the tissue residue study will be considered on a case-by-case basis.
CVM will not request that the assay methodology used to determine the withdrawal period for the generic product be more rigorous than the approved methodology used to determine the existing withdrawal period for the pioneer product. If an analytical method other than the approved method of analysis is used, the generic sponsor should provide data comparing the alternate method to the approved method.

APPENDIX: Confidence Bounds on the Logarithm Scale
We want to develop an expression for the confidence bound of the difference between the pharmacokinetic parameter for the test treatment and the reference treatment, expressed as a percentage of the reference treatment. This bound is derived from the 90% confidence interval of the difference between the mean of the test treatment and the mean of the reference treatment. This appendix addresses the case when the data analysis used to calculate the 90% confidence interval has been done with the natural log of the pharmacokinetic parameter as the dependent variable.
For purposes of this illustration we will use Area Under the Curve (AUC) as the pharmacokinetic parameter.
Notation and Distributional Assumptions:
Area under the Curve for Reference Treatment AUCR (1)
Area under the Curve for Test Treatment AUCT (2)
Natural log of AUC LnAUC (3)
26
LnAUCT ~ NT
( , )μ σ 2 and ~ LnAUCR NR
( , )μ σ 2 (4)
LnAUC LnAUCnT
iT
i
n
==∑
1 which estimates
Tμ , similarly for
Rμ
(5)
( )e LnAUCT is the geometric mean of to be denoted by AUCT T
&μ ,
similarly for R&μ
(6)
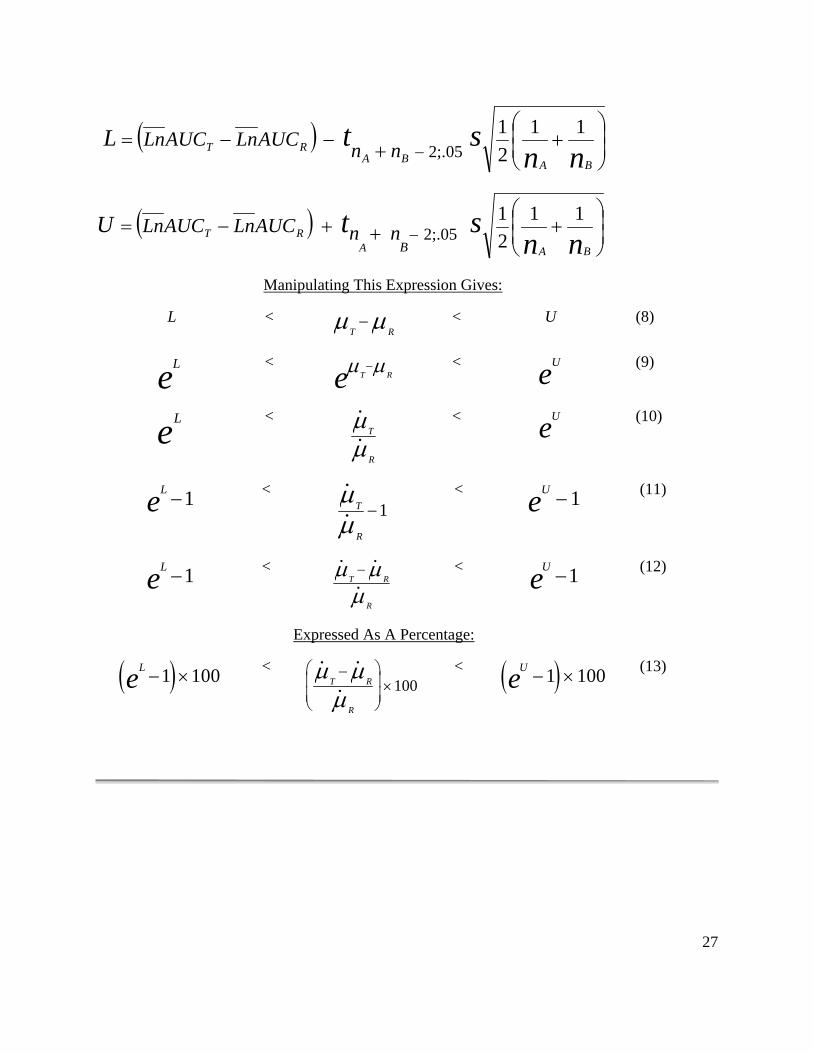
Calculation of the Confidence Interval:
The 90% Confidence Interval of ( )RTμ μ− is denoted by (L, U) and is
calculated from
(7)
( ) ⎟⎟⎠
⎞⎜⎜⎝
⎛++−−=
− nnst
BABART nnAUCLnAUCLnL 11
21
05;.2
( ) ⎟⎟⎠
⎞⎜⎜⎝
⎛+++−= − nn
stBAA
RTB
nnAUCLnAUCLnU 1121
05;.2
Manipulating This Expression Gives:
L < T R
μ μ− < U (8)
Le <
T Reμ μ−
< Ue (9)
Le <
T
R
&&μμ
< Ue (10)
Le −1 <
T
R
&&μμ
−1 < Ue −1
(11)
Le −1 <
T R
R
& &&
μ μμ−
< Ue −1
(12)
Expressed As A Percentage:
( )Le − ×1 100
< T R
R
& &&
μ μμ−⎛
⎝⎜⎜
⎞
⎠⎟⎟×100
< ( )Ue − ×1 100 (13)
27
Bibliography/Endnotes
1. Martinez, M.N. and Riviere, J.E. 1994. "Review of the 1993 Veterinary Drug Bioequivalence Workshop." J. Vet. Pharm. Therap.,17:85-119.
2. Byron, P.R. and Notari, R.E. 1976. "Critical Analysis of "Flip-flop" Phenomenon in Two-Compartment Pharmacokinetic Model." J. Pharm. Sci., 65: 1140-1144.
3. D'Argenio, D.A 1981. "Optimal Sampling Times for Pharmacokinetic Experiments." J. Pharm. Biopharm., 9: 739-756.
4. Westlake, W.J. 1988. "Bioavailability and Bioequivalence of Pharmaceutical Formulations." Biopharmaceutical Statistics for Drug Development, Peace, K. (ed), Marcel Dekker, Inc., pp. 329-352.
5. Hauschke, D., Steinijans, V.W., Diletti, E. and Burke, M. 1992. "Sample Size Determination for Bioequivalence Assessment Using A Multiplicative Model." J. Pharm. Biopharm., 20: 557-561.
6. Steinijans, V.W., Hauck, W.W., Diletti, E., Hauschke, D. and Anderson, S. 1992. "Effect of Changing the Bioequivalence Range From (0.80, 1.20) to (0.80, 1.25) on the Power and Sample Size." J. Clin. Pharm., Therap. and Toxicol., 30: 571-575.
7. Martinez, M.N. and Jackson, A.J. 1991. "Suitability of Various Noninfinity Area Under the Plasma Concentration-Time Curve (AUC) Estimates for Use in Bioequivalence Determinations: Relationship to AUC From Zero to Time Infinity (AUC(0-INF))." Pharm. Res., 8: 512-517.
8. Ronfeld, R.A. and Benet, L.Z. 1977. "Interpretation of Plasma Concentration-Time Curves After Oral Dosing." J. Pharm. Sci., 66: 178-180.
9. Lovering, E., McGilveray, I., McMillan, I. and Tostowaryk, W. 1975. "Comparative Bioavailabilies From Truncated Blood Level Curves." J. Pharm. Sci., 64: 1521-1524.
10. Schuirmann, D.J. 1987. "A Comparison of the Two One-Sided Tests Procedure and the Power Approach for Assessing the Equivalence of Average Bioavailability." J. Pharm. Biopharm., 15: 657-680.
11. Mehta, C.R., Patel, N.R., and Tsiatis, A. A. 1984. Biometrics, 40:819-825.
28