Guidance for Flood Risk Analysis and Mapping - fema.gov · Coastal Wave Runup and Overtopping...
34
Guidance for Flood Risk Analysis and Mapping Coastal Wave Runup and Overtopping February 2018
Transcript of Guidance for Flood Risk Analysis and Mapping - fema.gov · Coastal Wave Runup and Overtopping...
Guidance for Flood Risk Analysis and Mapping
Coastal Wave Runup and Overtopping
February 2018

Coastal Wave Runup and Overtopping February 2018 Guidance Document 89 Page i
Requirements for the Federal Emergency Management Agency (FEMA) Risk Mapping, Assessment, and Planning (Risk MAP) Program are specified separately by statute, regulation, or FEMA policy (primarily the Standards for Flood Risk Analysis and Mapping). This document provides guidance to support the requirements and recommends approaches for effective and efficient implementation.
For more information, please visit the FEMA Guidelines and Standards for Flood Risk Analysis and Mapping webpage (www.fema.gov/guidelines-and-standards-flood-risk-analysis-and-mapping). Copies of the Standards for Flood Risk Analysis and Mapping policy, related guidance, technical references, and other information about the guidelines and standards development process are all available here. You can also search directly by document title at www.fema.gov/library.
Coastal Wave Runup and Overtopping February 2018 Guidance Document 89 Page ii
Document History
Affected Section or Subsection Date Description
Initial version of new transformed guidance. The content was derived from the Guidelines and Specifications for
First Publication February 2018
Flood Hazard Mapping Partners, Procedure Memoranda, and/or Operating Guidance documents. It has been reorganized and is being published separately from the standards.
Coastal Wave Runup and Overtopping February 2018 Guidance Document 89 Page iii
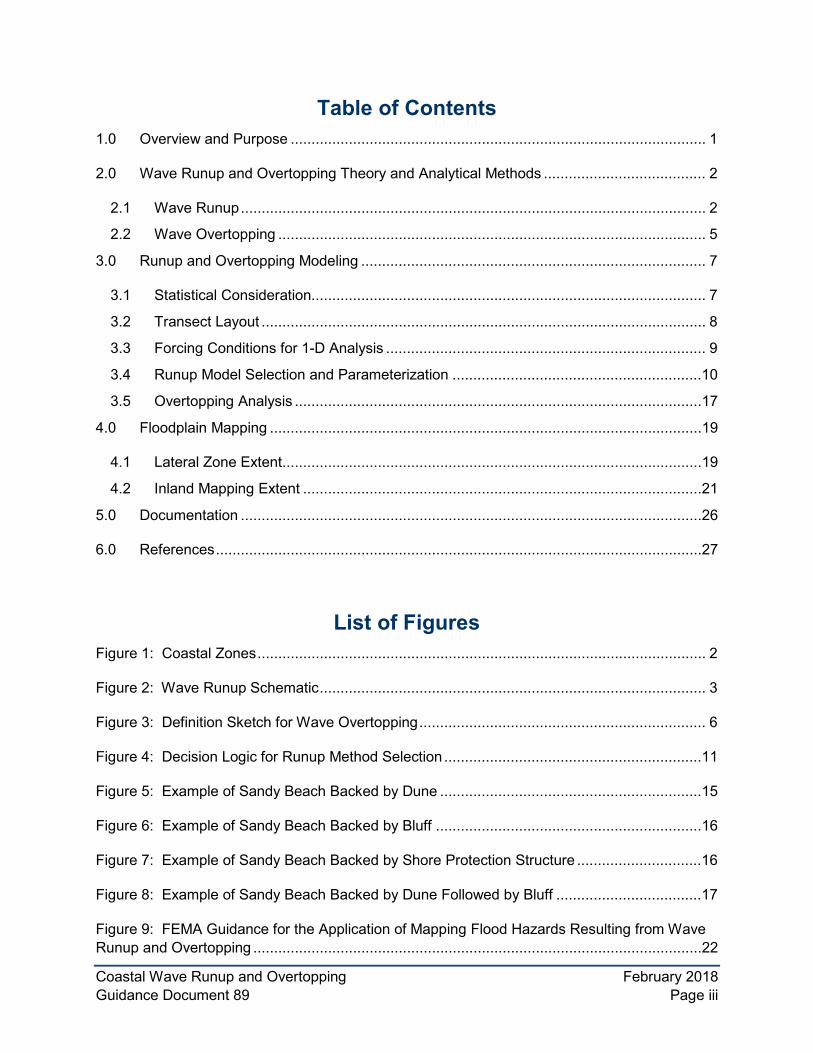
Table of Contents 1.0 Overview and Purpose .................................................................................................... 1
2.0 Wave Runup and Overtopping Theory and Analytical Methods ....................................... 2
2.1 Wave Runup ................................................................................................................ 2
2.2 Wave Overtopping ....................................................................................................... 5
3.0 Runup and Overtopping Modeling ................................................................................... 7
3.1 Statistical Consideration............................................................................................... 7
3.2 Transect Layout ........................................................................................................... 8
3.3 Forcing Conditions for 1-D Analysis ............................................................................. 9
3.4 Runup Model Selection and Parameterization ............................................................10
3.5 Overtopping Analysis ..................................................................................................17
4.0 Floodplain Mapping ........................................................................................................19
4.1 Lateral Zone Extent .....................................................................................................19
4.2 Inland Mapping Extent ................................................................................................21
5.0 Documentation ...............................................................................................................26
6.0 References .....................................................................................................................27
List of Figures Figure 1: Coastal Zones ............................................................................................................ 2
Figure 2: Wave Runup Schematic ............................................................................................. 3
Figure 3: Definition Sketch for Wave Overtopping ..................................................................... 6
Figure 4: Decision Logic for Runup Method Selection ..............................................................11
Figure 5: Example of Sandy Beach Backed by Dune ...............................................................15
Figure 6: Example of Sandy Beach Backed by Bluff ................................................................16
Figure 7: Example of Sandy Beach Backed by Shore Protection Structure ..............................16
Figure 8: Example of Sandy Beach Backed by Dune Followed by Bluff ...................................17
Figure 9: FEMA Guidance for the Application of Mapping Flood Hazards Resulting from Wave Runup and Overtopping ............................................................................................................22

Coastal Wave Runup and Overtopping February 2018 Guidance Document 89 Page iv
Figure 10: Treatment of Runup on a Plateau Feature ...............................................................23
Figure 11: Curves to Compute the Inland Limit of the Adjusted Runup ....................................24
List of Tables Table 1: General Guide for Runup Method Selection ................................................................ 5
Table 2: Recommendation for Interpretation of Mean Wave Overtopping 25................................
List of Equations Equation 1: ................................................................................................................................. 3
Equation 2: ................................................................................................................................. 4
Equation 3: ................................................................................................................................. 4
Equation 4: ................................................................................................................................. 7
Coastal Wave Runup and Overtopping February 2018 Guidance Document 89 Page 1
1.0 Overview and Purpose
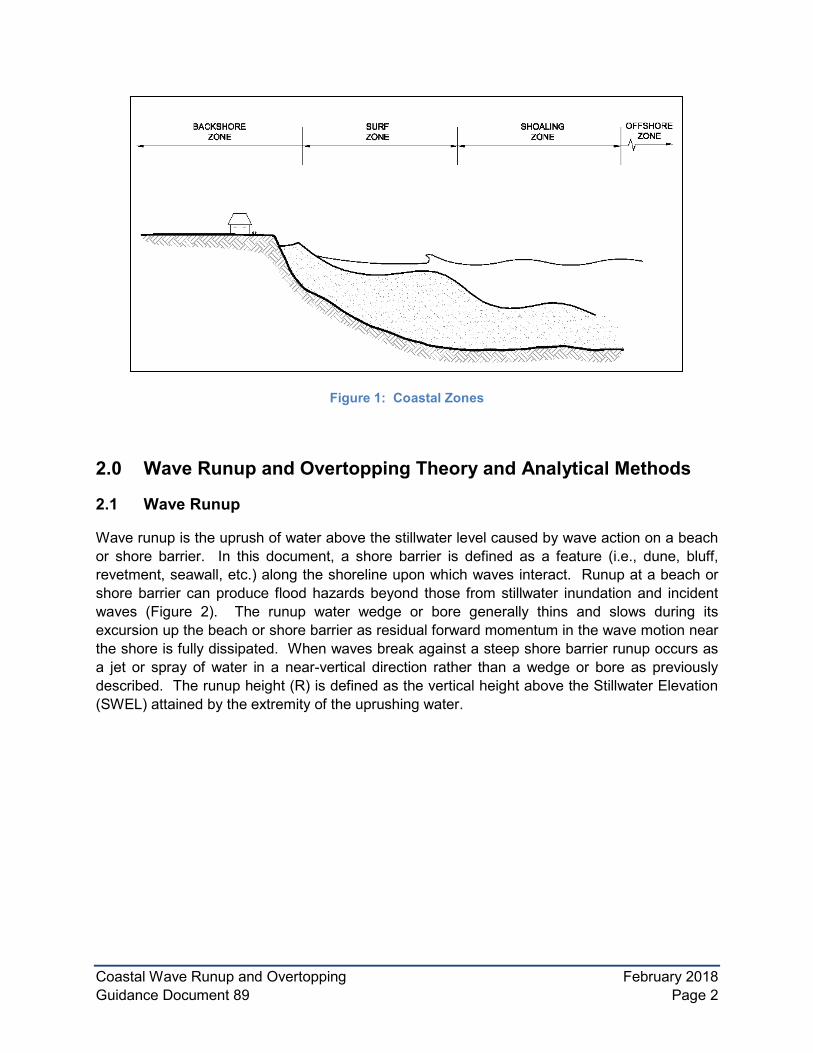
Wave runup and overtopping are wave-induced flood hazards that occur along coastal areas where waves encounter the shoreline and break, resulting in an uprush of water. Figure 1 shows a typical cross-shore profile divided into four coastal zones that are based on different physical processes. Wave runup and overtopping are complex physical processes occurring in the surf and backshore zones. They depend on the local water level, incident wave conditions, and the nature of the beach or structure encountered. In narrow developed coastal floodplains, the process of high velocity wave runup and overtopping puts residential and non-residential structures located above the storm surge levels along the shorelines at an increased flood risk. In these floodplains, wave runup elevations and overtopping rates determine 1-percent-annual-chance Base Flood Elevations (BFEs) as well as flood zone designations and spatial extents of the Special Flood Hazard Area (SFHA).
This guidance document presents the physical processes and theory behind the analysis of wave runup and overtopping. This document also provides a framework for evaluating different methodologies and the considerations and best practices for each method when performing FEMA coastal flood hazard studies in different physical settings.
This document is not intended to be prescriptive or procedural, as there is sufficient guidance within the coastal engineering profession addressing wave runup and overtopping calculation protocols. This document is therefore intended to provide an overarching framework for assessing and mapping coastal flood hazards due to wave runup and overtopping for the production of FEMA Flood Insurance Rate Maps (FIRMs) and Flood Insurance Studies (FISs). It is recommended that the information presented herein be utilized by professionals with a high degree of engineering expertise and understanding of coastal processes. It should also be understood that this document is intended to be a companion to FEMA’s Wave Determination (FEMA, in preparation), which addresses the physical processes in offshore zones and shoaling zones. These two documents, as well as other FEMA guidance and technical literature, should be used to guide wave runup and overtopping analyses and mapping for FEMA flood hazard studies. For any terms that are not locally defined in this document, the user should reference FEMA’s Coastal Notations, Acronyms and Glossary of Terms (FEMA, 2016a).
Coastal Wave Runup and Overtopping February 2018 Guidance Document 89 Page 2
Figure 1: Coastal Zones
2.0 Wave Runup and Overtopping Theory and Analytical Methods
2.1 Wave Runup
Wave runup is the uprush of water above the stillwater level caused by wave action on a beach or shore barrier. In this document, a shore barrier is defined as a feature (i.e., dune, bluff, revetment, seawall, etc.) along the shoreline upon which waves interact. Runup at a beach or shore barrier can produce flood hazards beyond those from stillwater inundation and incident waves (Figure 2). The runup water wedge or bore generally thins and slows during its excursion up the beach or shore barrier as residual forward momentum in the wave motion near the shore is fully dissipated. When waves break against a steep shore barrier runup occurs as a jet or spray of water in a near-vertical direction rather than a wedge or bore as previously described. The runup height (R) is defined as the vertical height above the Stillwater Elevation (SWEL) attained by the extremity of the uprushing water.

Coastal Wave Runup and Overtopping February 2018 Guidance Document 89 Page 3
Figure 2: Wave Runup Schematic
Runup heights are dependent on incoming wave characteristics, specifically, wave height, period, and direction, as well as the physical properties of the surf zone and the shore barrier upon which these waves act. If the shore barrier is an engineered structure, runup is influenced by bathymetry seaward of the structure, structure geometry, porosity/roughness, toe elevations, and core permeability. If the shore barrier is a natural feature such as a dune or bluff, runup is similarly influenced by the bathymetry seaward, geometry, surface roughness, and the toe elevation of the feature. Runup can be influenced by erosion or accretion across the nearshore bathymetry, erosion of natural features (dunes and erodible bluffs), and structure failure. Since runup is sensitive to many physical characteristics as well as variations in shore-approaching wave characteristics and erosion, it can vary considerably along shore. Further, runup can vary locally along a short distance of coastline in response to variations in shore barrier type or characteristics along these distances.
More generally, wave runup elevations are determined by the kinematics of wave breaking and how much wave energy is available. Waves which curl and plunge provide less shoreward momentum to drive wave runup than waves that gently break or surge up the shore unbroken. The non-dimensional parameter describing these kinematics is the Iribarren Number (𝜉𝜉), defined as the ratio of the characteristic profile slope to the wave slope:
Equation 1:
in which 𝑚𝑚 is a representative profile slope and is defined as the beach or shore barrier slope and H and L are the characteristic wave height and length, respectively. The definitions of the characteristic wave height and length depend on the runup methodology applied. The wave energy available to drive wave runup is proportional to the square of the wave height. Recognizing these general characteristics, Hunt (1959) proposed the following empirical formula to estimate the wave runup height (R):
Coastal Wave Runup and Overtopping February 2018 Guidance Document 89 Page 4
Equation 2:
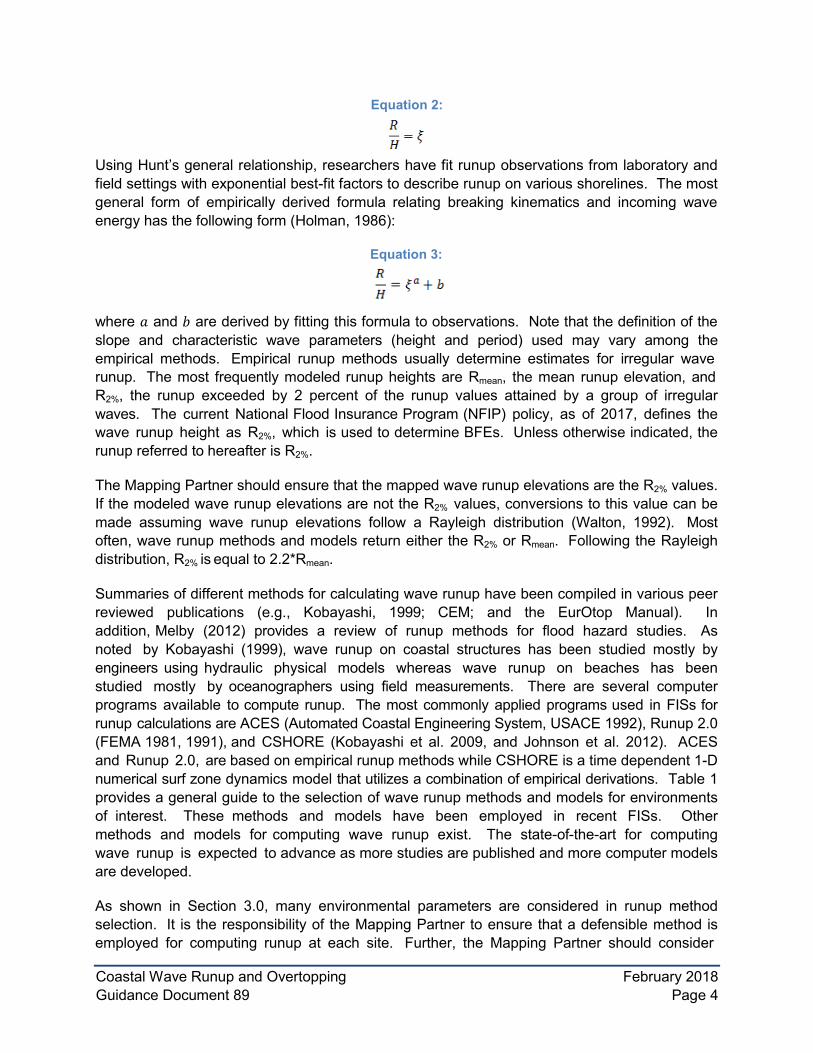
Using Hunt’s general relationship, researchers have fit runup observations from laboratory and field settings with exponential best-fit factors to describe runup on various shorelines. The most general form of empirically derived formula relating breaking kinematics and incoming wave energy has the following form (Holman, 1986):
Equation 3:
where 𝑎𝑎 and 𝑏𝑏 are derived by fitting this formula to observations. Note that the definition of the slope and characteristic wave parameters (height and period) used may vary among the empirical methods. Empirical runup methods usually determine estimates for irregular wave runup. The most frequently modeled runup heights are Rmean, the mean runup elevation, and R2%, the runup exceeded by 2 percent of the runup values attained by a group of irregular waves. The current National Flood Insurance Program (NFIP) policy, as of 2017, defines the wave runup height as R2%, which is used to determine BFEs. Unless otherwise indicated, the runup referred to hereafter is R2%.
The Mapping Partner should ensure that the mapped wave runup elevations are the R2% values. If the modeled wave runup elevations are not the R2% values, conversions to this value can be made assuming wave runup elevations follow a Rayleigh distribution (Walton, 1992). Most often, wave runup methods and models return either the R2% or Rmean. Following the Rayleigh distribution, R2% is equal to 2.2*Rmean.
Summaries of different methods for calculating wave runup have been compiled in various peer reviewed publications (e.g., Kobayashi, 1999; CEM; and the EurOtop Manual). In addition, Melby (2012) provides a review of runup methods for flood hazard studies. As noted by Kobayashi (1999), wave runup on coastal structures has been studied mostly by engineers using hydraulic physical models whereas wave runup on beaches has been studied mostly by oceanographers using field measurements. There are several computer programs available to compute runup. The most commonly applied programs used in FISs for runup calculations are ACES (Automated Coastal Engineering System, USACE 1992), Runup 2.0 (FEMA 1981, 1991), and CSHORE (Kobayashi et al. 2009, and Johnson et al. 2012). ACES and Runup 2.0, are based on empirical runup methods while CSHORE is a time dependent 1-D numerical surf zone dynamics model that utilizes a combination of empirical derivations. Table 1 provides a general guide to the selection of wave runup methods and models for environments of interest. These methods and models have been employed in recent FISs. Other methods and models for computing wave runup exist. The state-of-the-art for computing wave runup is expected to advance as more studies are published and more computer models are developed.
As shown in Section 3.0, many environmental parameters are considered in runup method selection. It is the responsibility of the Mapping Partner to ensure that a defensible method is employed for computing runup at each site. Further, the Mapping Partner should consider
Coastal Wave Runup and Overtopping February 2018 Guidance Document 89 Page 5
models and methods that are generally accepted in coastal modeling practice at the time of study in addition to those listed in Table 1.
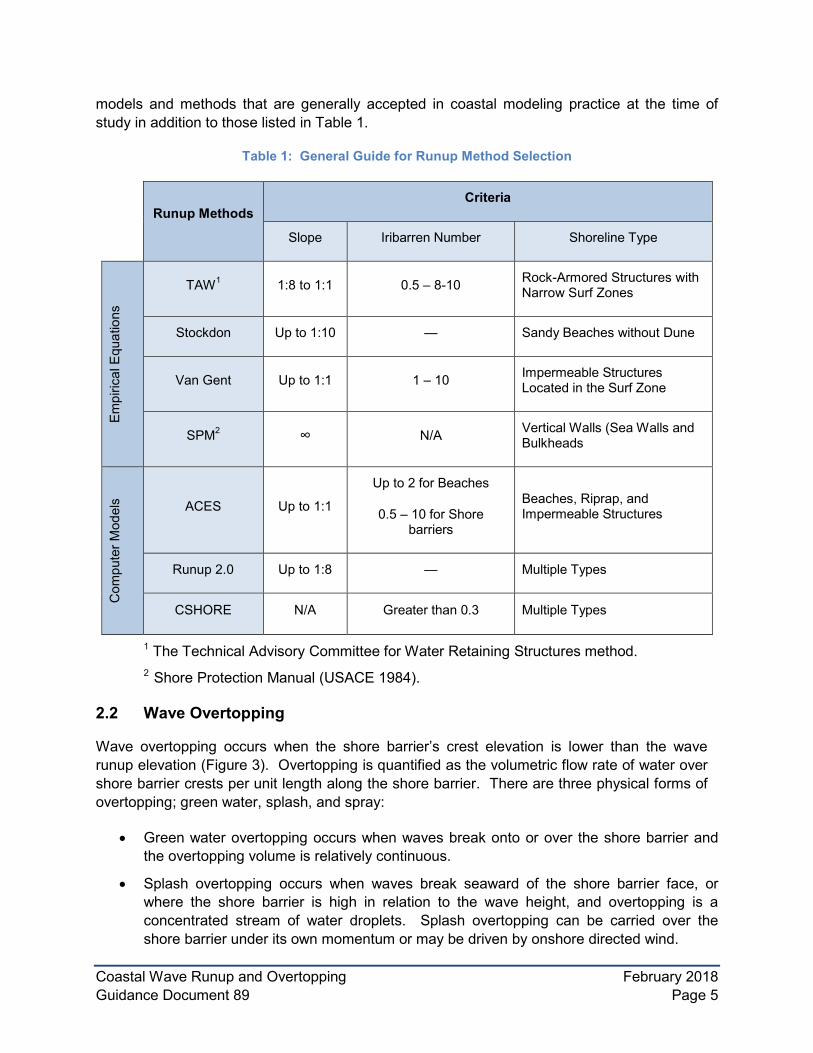
Table 1: General Guide for Runup Method Selection
Runup Methods Criteria
Slope Iribarren Number Shoreline Type
Empi
rical
Equ
atio
ns
TAW1 1:8 to 1:1 0.5 – 8-10 Rock-Armored Structures Narrow Surf Zones
with
Stockdon Up to 1:10 — Sandy Beaches without Dune
Van Gent Up to 1:1 1 – 10 Impermeable Structures Located in the Surf Zone
SPM2 ∞ N/A Vertical Walls Bulkheads
(Sea Walls and
Com
pute
r Mod
els ACES Up to 1:1
Up to 2 for Beaches
0.5 – 10 for Shore barriers
Beaches, Riprap, and Impermeable Structures
Runup 2.0 Up to 1:8 — Multiple Types
CSHORE N/A Greater than 0.3 Multiple Types
1 The Technical Advisory Committee for Water Retaining Structures method. 2 Shore Protection Manual (USACE 1984).
2.2 Wave Overtopping
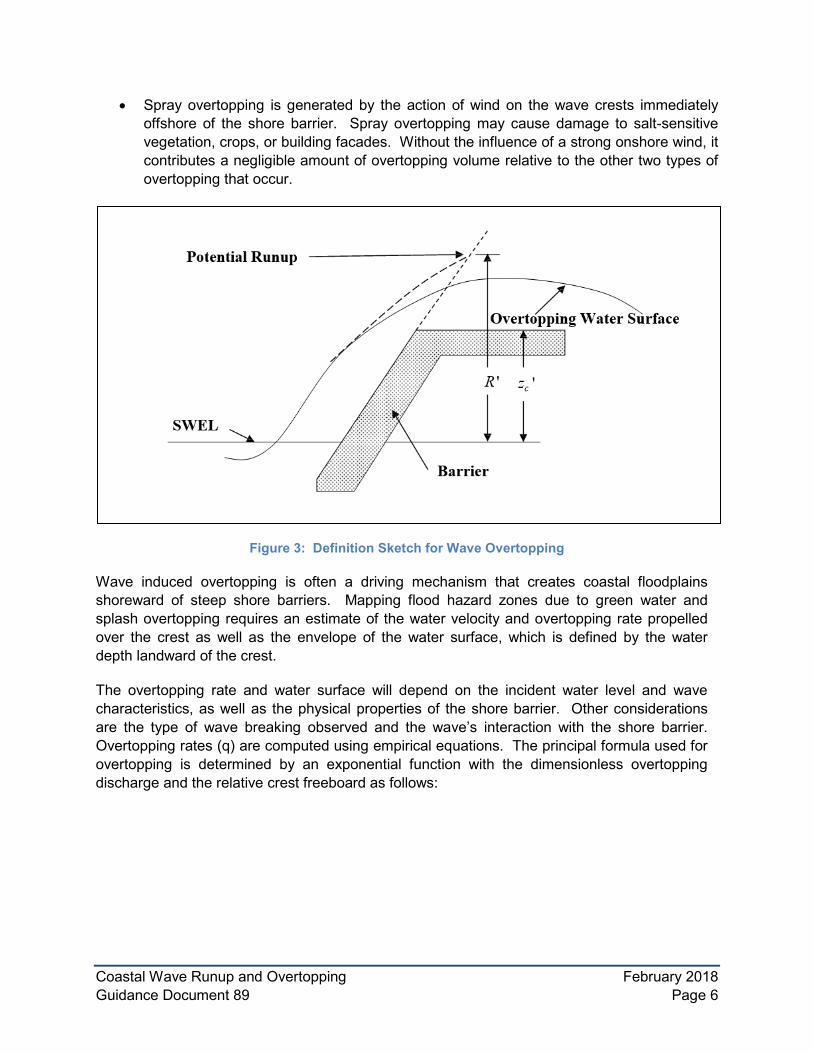
Wave overtopping occurs when the shore barrier’s crest elevation is lower than the wave runup elevation (Figure 3). Overtopping is quantified as the volumetric flow rate of water over shore barrier crests per unit length along the shore barrier. There are three physical forms of overtopping; green water, splash, and spray:
• Green water overtopping occurs when waves break onto or over the shore barrier andthe overtopping volume is relatively continuous.
• Splash overtopping occurs when waves break seaward of the shore barrier face, orwhere the shore barrier is high in relation to the wave height, and overtopping is aconcentrated stream of water droplets. Splash overtopping can be carried over theshore barrier under its own momentum or may be driven by onshore directed wind.
Coastal Wave Runup and Overtopping February 2018 Guidance Document 89 Page 6
• Spray overtopping is generated by the action of wind on the wave crests immediately offshore of the shore barrier. Spray overtopping may cause damage to salt-sensitive vegetation, crops, or building facades. Without the influence of a strong onshore wind, it contributes a negligible amount of overtopping volume relative to the other two types of overtopping that occur.
Figure 3: Definition Sketch for Wave Overtopping
Wave induced overtopping is often a driving mechanism that creates coastal floodplains shoreward of steep shore barriers. Mapping flood hazard zones due to green water and splash overtopping requires an estimate of the water velocity and overtopping rate propelled over the crest as well as the envelope of the water surface, which is defined by the water depth landward of the crest.
The overtopping rate and water surface will depend on the incident water level and wave characteristics, as well as the physical properties of the shore barrier. Other considerations are the type of wave breaking observed and the wave’s interaction with the shore barrier. Overtopping rates (q) are computed using empirical equations. The principal formula used for overtopping is determined by an exponential function with the dimensionless overtopping discharge and the relative crest freeboard as follows:

Coastal Wave Runup and Overtopping February 2018 Guidance Document 89 Page 7
Equation 4:
where q is mean overtopping rate, H is a characteristic wave height, 𝑍𝑍𝑐𝑐 is the freeboard measured as the height from the SWEL to the shore barrier crest elevation, and empirically derived coefficients a and b depend on different coastal structures (i.e., dikes, rubble mounds, revetments, seawalls, etc.) with distinct features (i.e., parapets, toe protection, berms, etc.). A complete description of methods for overtopping calculations can be found in the EurOtop Manual (EurOtop, 2016). The manual also provides methods for computing runup in special scenarios, such as shallow and very shallow foreshores and very steep to vertical walls. The EurOtop Manual equations include contributions from ‘green water’ and ‘splash’ overtopping but neglect spray overtopping.
3.0 Runup and Overtopping Modeling
This section provides a discussion of various factors to be considered when determining runup and overtopping for different physical properties and wave characteristics for the most commonly used methods in effective FIS to date (Table 1). It is acknowledged that more advanced modeling approaches may exist (i.e., fully developed 3-D Boussinesq models) that eliminate the need to conduct 1-D wave analyses. If alternative models are applied, the Mapping Partner must provide documentation that the modeling approach meets or exceeds FEMA’s current standards for flood risk analysis and mapping, which are documented in the NFIP’s regulations 44 CFR 65.6(a)(6). This document provides guidance on modeling overtopping and runup using 1-D transect analysis as this is the approach taken in all FISs to date and is most accessible to Mapping Partners.
3.1 Statistical Consideration
As stated in FEMA’s Coastal General Study Considerations (FEMA, 2017), the primary goal of a FIS is to determine the frequency of recurrence of flood elevations throughout the study area, and to establish the 10 percent-, 4 percent-, 2 percent-, 1 percent-, and 0.2-percent-annual-chance-flood elevations in a study area. Prior to performing a runup and overtopping analysis, the Mapping Partner should determine whether an event selection method or response-based approach will be used, each of which require specific statistical analyses to determine the flood elevations.
As described in FEMA’s Coastal General Study Considerations (FEMA, 2017), the event selection method involves analysis of a single event (or a small number of events), which requires a statistical analysis of the forcing conditions for all storm events prior to runup analysis. Essentially, the event-selection method establishes which forcing combinations (wave height, wave period, SWELs) and, possibly, eroded state of the nearshore profile will produce the 1 percent-annual-chance runup. This forcing combination is used to compute a single runup height equal to the 1 percent-annual-chance runup. On the other hand, the response-based

Coastal Wave Runup and Overtopping February 2018 Guidance Document 89 Page 8
method requires statistical analysis directly on the computed runup for the duration of modeled storm events. Statistical methods used on the forcing conditions for the event selection method or directly on the runup elevations for the response-based method are described in FEMA’s Coastal Flood Frequency and Extreme Value Analysis (FEMA, 2016b).
As described in Section 2.0, incident wave characteristics (height and period) and barrier characteristics (e.g., slope, porosity, etc.) determine wave runup and overtopping at a specific location. Section 2.0 also notes that barrier characteristics may be influenced by erosion or accretion, or by structure failure. A response-based approach can dynamically account for the interconnected physical characteristics of the system during wave runup and overtopping analysis. A typical response-based method utilizes time series of wave heights, wave periods, wave directions and water levels for entire historical (hindcasts) or probabilistic storm events. Within this method, empirical methods or runup and overtopping models may be used to produce a corresponding time series of runup and overtopping for each storm event simulated.
In certain cases, storm results must be removed from the statistical analysis through an optimization process. For historic storm events sampled using the Peak Over Threshold (POT) approach, storm events are typically selected from different locations throughout the study area. Because the study area often covers very large regions, storm events selected at one location might not be an event meeting the selection criteria at other locations. Therefore, resulting runup elevations from all storm events at a particular location might not follow the extreme distribution well. To remove the bias introduced by results from storms that do not meet the selection criteria, one recommended approach is the Q-Q-optimization as described in Melby et al. and Nadal-Caraballo et al. In this approach, the 25- and 75-percent quantile-quantile line from the samples and fitted distribution with reduced samples are compared by continuously ignoring the lowest values. The one aligning the best with the 1:1 line determines the best fit.
3.2 Transect Layout
As mentioned in previous sections, wave runup and overtopping are sensitive to physical properties of beaches or shore barriers and incoming wave characteristics. Cross-shore transects are generally placed along a reach to capture specific shoreline characteristics. In order to accurately capture variations in runup and overtopping along the coastline, transect placement should be refined enough to capture notable variations in the following factors:
• Wave Characteristics (H, T, θ)
• Shoreline Settings
• Beach or Shore Barrier Slope
• Beach or Shore Barrier Surface Roughness
• Shore Barrier Height and Width
These factors are briefly described below. The Mapping Partner is encouraged to document the physical parameters and shoreline changes during the transect placement process in Intermediate Data Submittal (IDS) 3 since this information can aid the runup mapping process (Section 4.0).
Coastal Wave Runup and Overtopping February 2018 Guidance Document 89 Page 9
3.2.1 Wave Characteristics
The wave characteristics influence wave kinematics and the computed runup height (Section 2.0). During transect placement, the Mapping Partner should capture regions where the wave height, period, and direction are anticipated to change as a result of changes in the shoreline orientation as well as the presence of coastal structures or natural offshore obstructions.
3.2.2 Shoreline Settings
The shoreline settings refer to the localized geomorphic characteristics of the surf and backshore zones, including the site-specific geology, profile shape, material composition, and profile erodibility. Transects should be placed to capture distinct runup elevations and overtopping rates owing to changes in the shoreline settings. The following shoreline settings may require distinct methods for computing wave runup heights and/or result in different runup heights and overtopping rates:
• Sandy beach, with or without dune.
• Sandy beach backed by coastal structures.
• Cobble, gravel, shingle beach or mixed grain size beach.
• Coastal bluffs and cliffs.
• Vertical coastal structures (bulkheads, sea walls, etc.).
• Sloped coastal structures (revetments, dikes, levees, etc.).
3.2.3 Shoreline Slope and Roughness
Runup elevations generally increase along steeper shorelines since larger slopes increase the Iribarren number (Equation 1). The surface roughness of the runup feature will also impact runup heights. Rough materials, such as revetment stones, tend to inhibit runup propagation while smooth materials, such as sand and concrete, will not inhibit runup propagation. Transect placement should therefore capture notable changes in shoreline slope and/or roughness that may influence runup heights.
3.2.4 Shore Barrier Height and Width
Variations in the shore barrier height and width influence coastal risk reduction from the 1 percent-annual-chance flood as well as the amount of overtopping flow. Transects should be placed to investigate how notable changes in the shore barrier’s geometry will influence coastal floodplains.
3.3 Forcing Conditions for 1-D Analysis
Conducting 1-D analysis of surf zone and backshore hydrodynamics depends on the SWEL and wave characteristics. These forcing conditions can be obtained from 2-D models. For guidance regarding the generation and propagation of waves from offshore water to the shoreline using 2-D models and guidance on obtaining SWEL and wave conditions if 2-D models are unavailable
Coastal Wave Runup and Overtopping February 2018 Guidance Document 89 Page 10
please reference the companion document, FEMA’s Wave Determination Guidance (FEMA, in preparation).
The underlying assumption for the 1-D transect analysis is longshore uniformity, so there is a reliance on the 2-D model to capture the complex coastal wave processes, such as refraction and shoaling, which are not longshore uniform. Generally, it is expected that 2-D SWEL and wave models adequately resolve waves from offshore through the shoaling zone (Figure 1) but may inadequately resolve wave characteristics within the surf zone. This is true along steep beach profiles with narrow surf zones as wave energy decays over shorter distances, which may not be resolved in the 2-D model used to determine SWEL and wave conditions. Therefore, it is generally the case that the intersection between the surf zone limit and transects represents the location where wave characteristics and SWEL should be extracted from 2-D models for 1-D analyses.
The most straightforward approach to establish the surf zone limit for extracting wave and water level parameters from 2-D models is to define this location based on a representative depth contour or another fixed location based on model results and/or engineering judgment. Other approaches use the 2-D model results to determine the location of the surf zone limit based on the ratio between wave height and water depth or the fraction of breaking waves 𝑄𝑄𝑏𝑏 (SWAN 41.10A).
When establishing a surf zone limit, it is important to consider how this location may vary for different storm events and throughout a given storm event based on SWEL and wave conditions. If the surf zone is expected to vary, the Mapping Partner should consider the impact of selecting a single surf zone limit for all events versus establishing a surf zone limit unique for each event. Generally, if the range in the surf zone limit is wide in relation to the mesh resolution the Mapping Partner should consider changing the surf zone limit corresponding to the actual hydrodynamic conditions.
3.4 Runup Model Selection and Parameterization
When selecting runup models or methods, the Mapping Partner should consider the limitations and applicability of the selected models. The range of applicability based on slope, Irribarren number, and shoreline type of commonly used runup methods are also included in Table 1 (Section 2.0). Figure 4 below provides additional guidance for determining a runup method for an individual transect. In order to apply the flow chart in Figure 4, the information in subsequent sections should be considered. The Mapping Partner should ensure that the selected runup method or model produces results that are defensible.

Coastal Wave Runup and Overtopping February 2018 Guidance Document 89 Page 11
Figure 4: Decision Logic for Runup Method Selection
3.4.1 Runup Behavior
The focus of this section is the physical processes and empirical formulae applicable when runup occurs on beaches or shore barriers. The Mapping Partner should reference the literature associated with the original empirical equation selected for the runup calculation to ensure its applicability and proper calculation during modeling. The guidelines herein are intended to help the Mapping Partner apply common runup methods.
Identifying the runup location along the transect profile is crucial for correct method selection and model parameterization. Wave runup occurs at approximately the intersection of the SWEL and shore barrier profile. If the water levels resulting from the SWEL plus wave setup are not intercepted by a beach or steep barrier and, instead, inundate portions of the backshore zone, wave runup is unlikely to occur. In this instance, wave energy will propagate over the backshore area and dissipate due to land cover and shallow water depths over the backshore terrain and wave runup is not to be assessed (Overland Wave Propagation, FEMA, 2015a). If a response based method is applied, this intersection will vary during a storm and among different storms. Therefore, it may require multiple runup methods as the Iribarren number varies or the runup interacts with different features along the profile. When applying the event selection method, the intersection with the shore barrier is determined by the defined SWEL, and the runup method should correspond to the profile properties near that intersection.
A transect profile may change significantly due to erosion or structure failure. Adjustments to the transect profile slope may change the feature that governs runup physics. The empirical
Coastal Wave Runup and Overtopping February 2018 Guidance Document 89 Page 12
runup method selected should correspond to the runup feature identified from the adjusted shoreline profile. Mechanisms for determining a shoreline’s eroded profile can be determined using Coastal Erosion (FEMA, 2015b). Details for structure failure analysis and the inclusion of the failed profile in runup analyses are included in Coastal Structures (FEMA, 2015c).
3.4.1.1 Runup on Beaches
Runup on natural or man-made beaches is usually expressed in terms of the Iribarren number proposed by Hunt (1959), which is a function of slope, wave height, and wave length (Section 2.0). The definitions of the following runup input parameters are important for properly applying the runup method.
Runup Slope
Runup calculations are sensitive to the characteristic profile slope. However, natural beaches usually do not present a single, uniform slope. The Mapping Partner should follow the definition of the characteristic profile slope provided in the original reference for the selected empirical equation. For example, the beach slope in the Stockdon method is defined as the average slope over a region ±2σ around η, where σ is the standard deviation of the continuous water level record, η(t). Some researchers suggest using the surf zone slope, defined as the slope between the shoreline (the cross-shore position of η) and the cross-shore location of wave breaking. If an empirical method is employed and the slope is defined differently than how it was defined during the derivation of the empirical formula, justification for this disagreement must be provided in the study documentation in IDS 3.
Definition of Wave Height and Period
In nature, waves are irregular such that the individual waves that approach a coastline are seldom of constant characteristics. However, these irregular waves are typically parameterized by a single characteristic height, period, and direction. Typical characteristic wave heights for irregular waves are the significant wave height, which can be computed in the time domain (H1/3) or frequency domain (Hm0), and the root-mean-square wave height (Hrms). Typical characteristic wave periods for irregular waves include the peak wave period (Tp) or the mean wave period (Tm). Also, the values of these representative characteristics vary from offshore and across the shoaling zone. The Mapping Partner should judiciously investigate the definition of wave height (significant wave height versus mean wave height or other) and wave period (peak period versus mean period or other) required for empirical runup methods or models.
Wave Transformation
Wave transformation may be required to determine the appropriate wave characteristics for runup analyses. Empirical methods that require the wave conditions at the breaking location or in deep, offshore water may require transformation of wave heights from the wave conditions at the surf zone limit (Section 3.2). For example, wave conditions in the shoaling zone or near the surf zone limit may need to be deshoaled and unrefracted to yield equivalent deep water wave heights for some runup methods. These waves can be readily transformed to the toe location using linear wave theory. References on how to perform the wave transformation calculations
Coastal Wave Runup and Overtopping February 2018 Guidance Document 89 Page 13
are the Coastal Engineering Manual (CEM) (USACE, 2011) and Water Wave Mechanics for Engineering and Scientists (Dean and Dalrymple, 1991).
Wave Setup
The total water level (TWL) includes SWEL, wave setup, and wave runup. To avoid underestimating (or overestimating) the TWL by missing (or double counting) the wave setup component, the Mapping Partner should verify whether wave setup is included in the runup methodology. Details on estimating wave setup are included in FEMA’s Coastal Wave Setup (FEMA, 2015d).
3.4.1.2 Runup on Shore Barriers
Runup on a shore barrier depends on the height and steepness of the incident wave as well as the shore barrier geometry. Runup on structures can also be affected by structure composition. Because of these complexities, runup on shore barriers is best calculated using equations developed from tests on structures subject to similar wave characteristics. In addition to the definition of the profile slope, wave characteristics, and wave setup discussed above, special considerations should be given to the following:
Empirical Equation Applicability
Due to large variations in the physical and dynamic characteristics (in terms of the Iribarren number) of shore barriers, it is difficult to find one empirical runup equation that applies to all shorelines. Coefficients in the empirical runup equations are typically calibrated for a specific physical setting and wave environment. For example, the TAW method is valid in the range of 0.5 < ξom < 8-10 in terms of the Iribarren number, and valid for structure slopes in the range of 1:8 to 1:1. The Mapping Partner should choose empirical equations developed for barriers with physical properties and wave characteristics similar to the area of interest. It is recommended that the Mapping Partner consult source references for each method to ensure that appropriate parameter ranges are utilized.
Runup Reduction Factors
Most empirical equations for runup on shore barriers require reduction factors to account for roughness, wave directionality, and the presence of a berm. For details, refer to the discussion in Section 2.0 and the source reference for each method chosen for the study. Mapping Partners should consider applying reduction factors as defined in the original documentation for each empirical method. If runup models are employed Mapping Partners must refer to the user’s manuals for those models to check for reduction factors.
Wave Condition at the Toe Location
The wave energy driving runup on shore barriers is typically governed by the wave energy at or near the toe of the shore barrier. Empirical methods that require the wave conditions at the toe location may require transformation of wave heights to the toe location from the wave conditions at the surf zone limit (Section 3.2). These waves can be readily transformed to the toe location using linear wave theory. However, process-based computer models such as CSHORE can also be used to transform waves across the surf zone to the shore barrier toe. Often, the wave

Coastal Wave Runup and Overtopping February 2018 Guidance Document 89 Page 14
heights at the toe of the shore barrier are limited by the depth at the toe (toe depth). The Mapping Partner should consider if wave heights are taken from model results or measurements offshore of the shore barrier.
Toe Depth
Wave conditions at the toe location are typically governed or influenced by the toe depth. Though it is often the case that empirical equations for runup on shore barriers include wave setup in the wave runup value (i.e., runup is to be added to SWEL without wave setup), wave setup will often increase the depth at the toe allowing for greater wave energy at the toe. However, many setup computation methods, such as Direct Injection Method (DIM), determine the setup at the shoreline rather than at the toe of the shore barrier. Care must be taken to derive wave setup at the toe of the shore barrier. In the presence of wave breaking at the toe location, Mapping Partners should also consider toe scour and its influence on water depth at the toe, FEMA’s Coastal Structure (FEMA, 2015c).
Erosion Induced Slope Changes
Coastlines are extremely complex and dynamic environments. At present, FEMA coastal analysis and mapping is limited to risks and losses occurring as the direct result of erosion due to storm events and does not address long-term chronic erosion. During storm events, beach erosion and dune retreat or removal may occur. The type and magnitude of erosion are closely related to coastal exposure and beach setting. Modifications to the transect profile slope due to erosion can change runup behavior. Therefore, it is important to account for and incorporate the expected erosion when performing wave runup analysis. Changes in erodible shore barriers may also impact the inland extent of the coastal floodplain. Examples of coastal settings that can be impacted by erosion are presented in Section 3.4.2. Several methods and models exist to calculate the expected shoreline erosion and additional details on incorporating erosion are included in FEMA’s Coastal Erosion (FEMA, 2015b).
Wave Setup
Though wave setup should be computed to calculate the depth at the toe of the structure during runup calculations on shore barriers, it is often the case that the runup height computed by empirical runup methods are referenced to SWEL. Therefore, the runup height implicitly includes the wave setup contribution. The TWL includes SWEL, wave setup, and wave runup. To avoid underestimating (or overestimating) the TWL by missing (or double counting) the wave setup component, the Mapping Partner should verify whether wave setup is included in the runup methodology.
3.4.2 Examples of Typical Coastal Settings
The following offers examples of typical coastal settings where runup occurs. The Mapping Partner should explore the shoreline types and consider the location of runup as well as the physical processes that the shoreline reach is subject to prior to assigning the runup method.

Coastal Wave Runup and Overtopping February 2018 Guidance Document 89 Page 15
3.4.2.1 Sandy Beach Backed by Dune
One typical coastal environment is a sandy beach backed by a low berm or high dune (Figure 5). The erodible profile shape continuously changes in response to the wave environment along this type of shoreline. Prior to selecting a runup method to compute the flood hazard, the Mapping Partner should determine whether runup will act on the mildly sloping sandy beach or the steeper dune during the 1 percent-annual-chance SWEL or individual storm events. The inland extent of erosion and the associated modifications to the runup slope should also be considered. Depending on the eroded profile, runup may occur on the flattened beach and dune, leading to a flood hazard landward of the dune controlled by runup rather than overtopping.
Figure 5: Example of Sandy Beach Backed by Dune
3.4.2.2 Sandy Beach Backed by Bluff
Another common coastline has narrow to nonexistent beaches backed by high, steep, erodible coastal bluffs and cliffs (Figure 6). The runup behavior will change dramatically depending on whether the water levels and runup extents are intercepted by the sandy beach or if water levels inundate the beach and allow for waves to interact with the steep bluff. If the SWEL plus wave setup does not reach the bluff, waves will runup along the sandy beach as swash. If the SWEL plus wave setup intersects the bluff, however, waves may energetically break and induce runup against the bluff face and pose potential overtopping hazards inland of the bluff’s crest.

Coastal Wave Runup and Overtopping February 2018 Guidance Document 89 Page 16
Figure 6: Example of Sandy Beach Backed by Bluff
3.4.2.3 Sandy Beach Backed by Shore Protection Structure
Figure 7 illustrates a shore protection structure fronted by a sandy beach. If the SWEL plus wave setup does not reach the structure after erosion of the sandy berm is considered, waves will runup along the sandy beach as swash and cause negligible runup on the structure. If the SWEL plus wave setup intersects the structure, waves and energetic wave bores may break against the structure, inducing wave runup along the structure face. Wave setup, which increases the nearshore water level, should only be included in runup analysis if waves break along the transect profile shoreward of the structure. Additionally, if the wave runup exceeds the structure crest, wave overtopping will pose potential flood risks to development that lies in close proximity to the structure crest.
Wave energy may induce scour at the toe of coastal structures and/or induce hydrodynamic loads on the structure, which may cause complete or partial structure failure. Existing guidelines provide methods for deriving a partially failed profile of coastal structures based on scour (Coastal Structures, FEMA, 2015c). The overtopping hazards in a partially failed state may produce more hazardous flooding inland of the structure than a scenario in which the structure is fully intact or completely removed, and vice versa. If it is determined that the coastal structure may fail or partially fail, due to toe scour, runup and overtopping, the structure should be modeled on both scenarios to determine the most hazardous conditions.
Figure 7: Example of Sandy Beach Backed by Shore Protection Structure
Coastal Wave Runup and Overtopping February 2018 Guidance Document 89 Page 17
3.4.2.4 Sandy Beach Backed by Dune Followed by Bluff
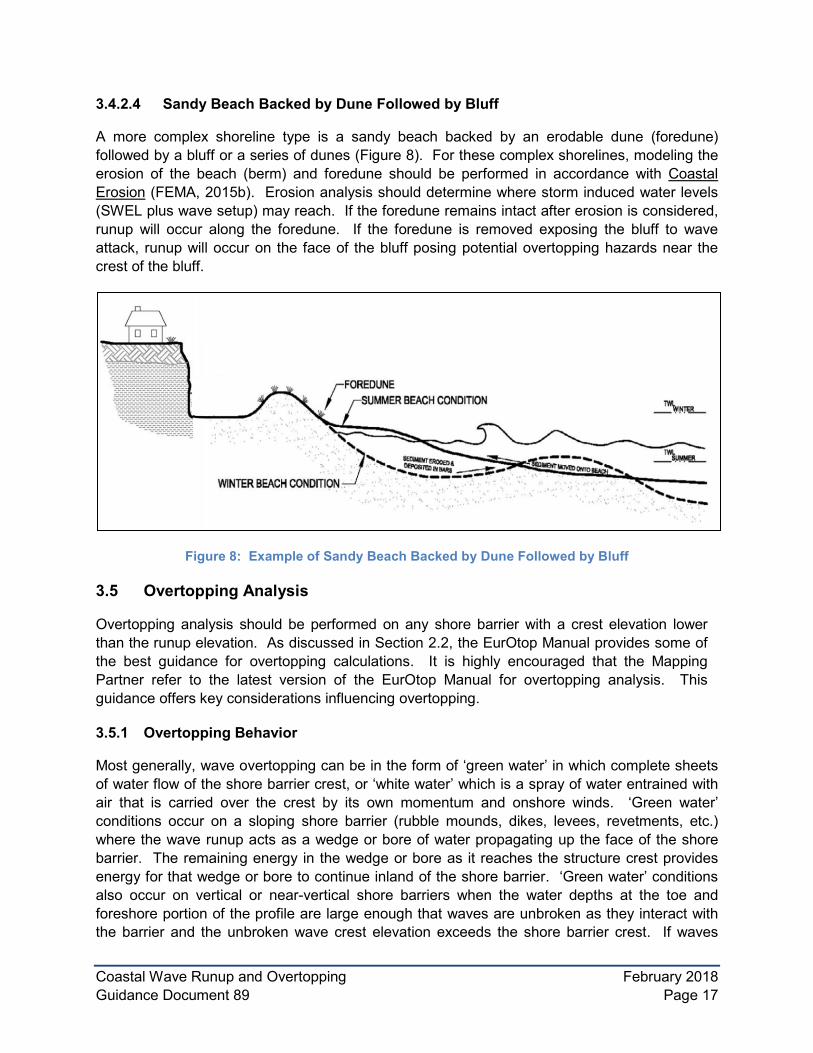
A more complex shoreline type is a sandy beach backed by an erodable dune (foredune) followed by a bluff or a series of dunes (Figure 8). For these complex shorelines, modeling the erosion of the beach (berm) and foredune should be performed in accordance with Coastal Erosion (FEMA, 2015b). Erosion analysis should determine where storm induced water levels (SWEL plus wave setup) may reach. If the foredune remains intact after erosion is considered, runup will occur along the foredune. If the foredune is removed exposing the bluff to wave attack, runup will occur on the face of the bluff posing potential overtopping hazards near the crest of the bluff.
Figure 8: Example of Sandy Beach Backed by Dune Followed by Bluff
3.5 Overtopping Analysis
Overtopping analysis should be performed on any shore barrier with a crest elevation lower than the runup elevation. As discussed in Section 2.2, the EurOtop Manual provides some of the best guidance for overtopping calculations. It is highly encouraged that the Mapping Partner refer to the latest version of the EurOtop Manual for overtopping analysis. This guidance offers key considerations influencing overtopping.
3.5.1 Overtopping Behavior
Most generally, wave overtopping can be in the form of ‘green water’ in which complete sheets of water flow of the shore barrier crest, or ‘white water’ which is a spray of water entrained with air that is carried over the crest by its own momentum and onshore winds. ‘Green water’ conditions occur on a sloping shore barrier (rubble mounds, dikes, levees, revetments, etc.) where the wave runup acts as a wedge or bore of water propagating up the face of the shore barrier. The remaining energy in the wedge or bore as it reaches the structure crest provides energy for that wedge or bore to continue inland of the shore barrier. ‘Green water’ conditions also occur on vertical or near-vertical shore barriers when the water depths at the toe and foreshore portion of the profile are large enough that waves are unbroken as they interact with the barrier and the unbroken wave crest elevation exceeds the shore barrier crest. If waves
Coastal Wave Runup and Overtopping February 2018 Guidance Document 89 Page 18
plunge near the toe of a vertical or near-vertical shore barrier, the collision of the plunging wave against the face of the shore barrier will drive a near-vertical jet of white water up and over the crest of the shore barrier.
3.5.2 Deterministic vs. Probabilistic Overtopping Rates
The EurOtop Manual offers not only the empirical models for the mean overtopping rate estimation, but the associated model uncertainties as well. The model uncertainty is considered to be the accuracy with which a model can describe a physical process or a limited state function. In the EurOtop Manual, model uncertainties are measured by the standard deviation, which is derived from the comparison of the measured data and model predictions. As such, two sets of parameters for all empirical models in the EurOtop Manual are provided corresponding to probabilistic design value and deterministic value. The probabilistic design value describes the mean approach for all underlying data points, while the deterministic design value is given as the mean value plus one standard deviation. Deterministic equations provide conservative overtopping values by taking into account model uncertainty for wave overtopping and should be employed by Mapping Partners when calculating overtopping rates for flood hazard mapping purposes.
3.5.3 Overtopping Reduction Factors
Most empirical equations for overtopping on shore barriers require reduction factors to account for roughness, wave directionality and the presence of a berm along shore barriers. For details, refer to the discussion in Section 2.0 and the source references for the empirical equations chosen for the study. Mapping Partners should consider applying reduction factors as defined in the original documentation for each empirical method. If runup models are employed, Mapping Partners must refer to the user’s manuals for those models to check for reduction factors.
3.5.4 Overtopping Flows
When overtopping is in the form of ‘green water’, bores or sheets of waters can flow over terrain inland of the shore barrier crest. Generally speaking, overtopping flows are driven inland by the momentum contained in the overtopping bore and gravity forces. In some FISs to date, the method proposed in Cox and Machemehl, to calculate the inland limit of overtopping bore was adapted to compute the bore height and velocity profile overland accounting for the slope of the inland terrain. Experimental results of overtopping bore depth and velocities on landward slopes of sea dikes are explained in Chapter 5.5.5 of the EurOtop Manual. This chapter also provides an analytical function of the overtopping flow velocities and sheet flow depth on landward slopes.
3.5.5 Overtopping Volumes
If a response-based modeling method is employed as described in Section 3.1, time series of mean overtopping rates can be computed over the duration of all modeled storms. These time series can be integrated over time and multiplied by the longshore length of the shore barrier to which the overtopping rates apply to yield overtopping volumes. When calculating overtopping volumes, the Mapping Partner should also consider the potential volume of water added by
Coastal Wave Runup and Overtopping February 2018 Guidance Document 89 Page 19
concurrent rainfall and/or the volume of water drained through any drainage infrastructure in the local area.
4.0 Floodplain Mapping
Floodplain mapping is the translation of runup results from the 1-D transect analysis to a 2-D planimetric map or dataset to provide an understanding of flood hazards along the shoreline. Shorelines dominated by runup are generally characterized by high flood elevations and velocities. Therefore, high hazard and high-velocity (VE) zone classifications are typically applied to shorelines susceptible to structural damage, while regions with runup elevations less than 3 ft. above the ground are designated with a less hazardous (AE) flood zone. Inland of feature crests, sheet flow (Zone AO) and ponding (Zone AH) overtopping may occur (Section 4.2.2). Additional information on flood zone classifications is available in FEMA’s Coastal Floodplain Mapping (FEMA, 2015e).
There are many variables along the shoreline contributing to coastal flooding that influence mapping methodologies. Evaluating both the modeled physical characteristics and runup results during the mapping process provides a stronger understanding of the physics occurring along a transect and aids in mapping decisions. The following sections provide guidance on how to evaluate the coastal setting and calculated BFEs for runup and overtopping mapping applications. Coastal Floodplain Mapping (FEMA, 2015e) provides further information on mapping techniques for runup processes and flood zone designations.
4.1 Lateral Zone Extent
Unlike coastlines where overland wave propagation dominates coastal flooding, runup behavior may abruptly change in response to modifications in the physical setting. Transects are generally placed along a reach to capture specific shoreline characteristics (as described in Section 3.2), and the Mapping Partner should ensure mapped transect results apply to shoreline reaches with comparable characteristics. Variability in the calculated runup may result in the appearance of ‘jumps’ in BFEs along the shoreline on a Flood Insurance Rate Map (FIRM), where adjacent VE zones have BFE differences greater than 1 ft. SFHA boundaries on the FIRM dividing areas of VE or AE with different BFEs, are placed between transects at shoreline locations where there are anticipated transitions in runup behavior due to variations in wave characteristics, shoreline settings, slope, and surface roughness. Each of these considerations are discussed below.
4.1.1 Wave Characteristics
Based upon aerial imagery and an understanding of wave mechanics, the Mapping Partner should inspect the coastal environment to develop an understanding of the wave behavior within the study area. This includes evaluating features such as coastal structures (i.e., breakwaters and jetties) that influence wave processes (i.e., wave propagation, refraction, and diffraction).
Coastal Wave Runup and Overtopping February 2018 Guidance Document 89 Page 20
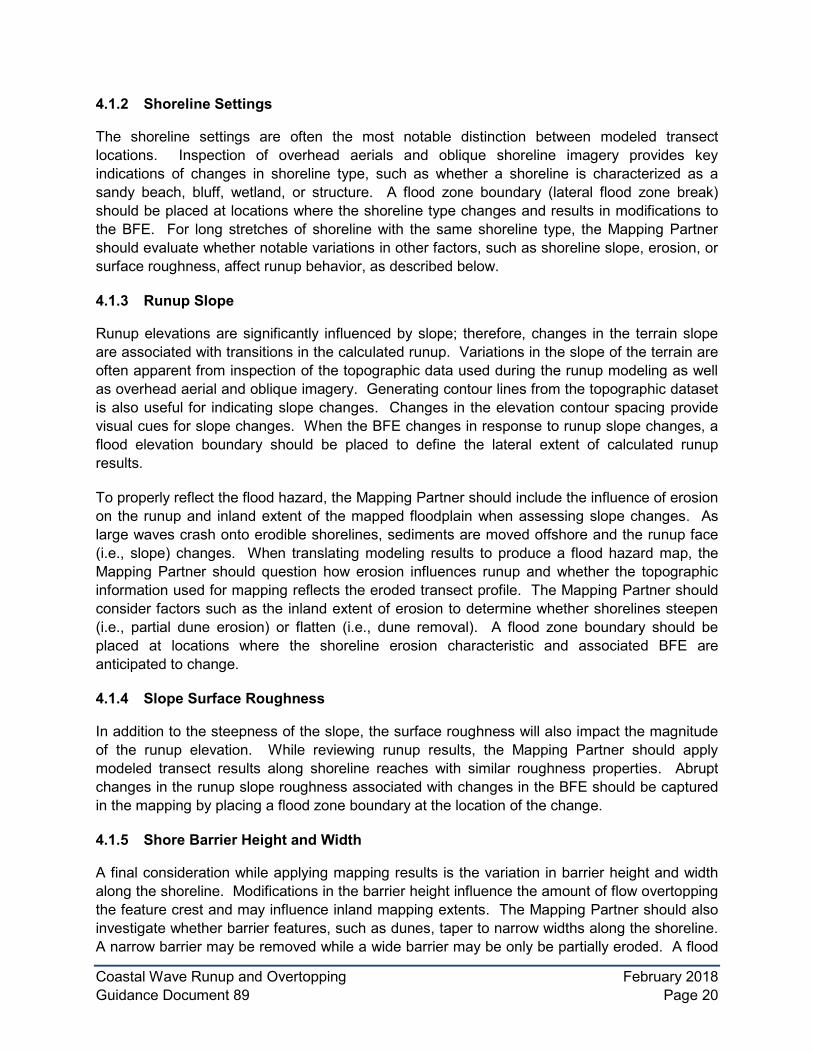
4.1.2 Shoreline Settings
The shoreline settings are often the most notable distinction between modeled transect locations. Inspection of overhead aerials and oblique shoreline imagery provides key indications of changes in shoreline type, such as whether a shoreline is characterized as a sandy beach, bluff, wetland, or structure. A flood zone boundary (lateral flood zone break) should be placed at locations where the shoreline type changes and results in modifications to the BFE. For long stretches of shoreline with the same shoreline type, the Mapping Partner should evaluate whether notable variations in other factors, such as shoreline slope, erosion, or surface roughness, affect runup behavior, as described below.
4.1.3 Runup Slope
Runup elevations are significantly influenced by slope; therefore, changes in the terrain slope are associated with transitions in the calculated runup. Variations in the slope of the terrain are often apparent from inspection of the topographic data used during the runup modeling as well as overhead aerial and oblique imagery. Generating contour lines from the topographic dataset is also useful for indicating slope changes. Changes in the elevation contour spacing provide visual cues for slope changes. When the BFE changes in response to runup slope changes, a flood elevation boundary should be placed to define the lateral extent of calculated runup results.
To properly reflect the flood hazard, the Mapping Partner should include the influence of erosion on the runup and inland extent of the mapped floodplain when assessing slope changes. As large waves crash onto erodible shorelines, sediments are moved offshore and the runup face (i.e., slope) changes. When translating modeling results to produce a flood hazard map, the Mapping Partner should question how erosion influences runup and whether the topographic information used for mapping reflects the eroded transect profile. The Mapping Partner should consider factors such as the inland extent of erosion to determine whether shorelines steepen (i.e., partial dune erosion) or flatten (i.e., dune removal). A flood zone boundary should be placed at locations where the shoreline erosion characteristic and associated BFE are anticipated to change.
4.1.4 Slope Surface Roughness
In addition to the steepness of the slope, the surface roughness will also impact the magnitude of the runup elevation. While reviewing runup results, the Mapping Partner should apply modeled transect results along shoreline reaches with similar roughness properties. Abrupt changes in the runup slope roughness associated with changes in the BFE should be captured in the mapping by placing a flood zone boundary at the location of the change.
4.1.5 Shore Barrier Height and Width
A final consideration while applying mapping results is the variation in barrier height and width along the shoreline. Modifications in the barrier height influence the amount of flow overtopping the feature crest and may influence inland mapping extents. The Mapping Partner should also investigate whether barrier features, such as dunes, taper to narrow widths along the shoreline. A narrow barrier may be removed while a wide barrier may be only be partially eroded. A flood
Coastal Wave Runup and Overtopping February 2018 Guidance Document 89 Page 21
zone boundary should be placed at locations where the runup behavior and BFE are anticipated to change in response to modifications in the barrier geometry.
4.2 Inland Mapping Extent
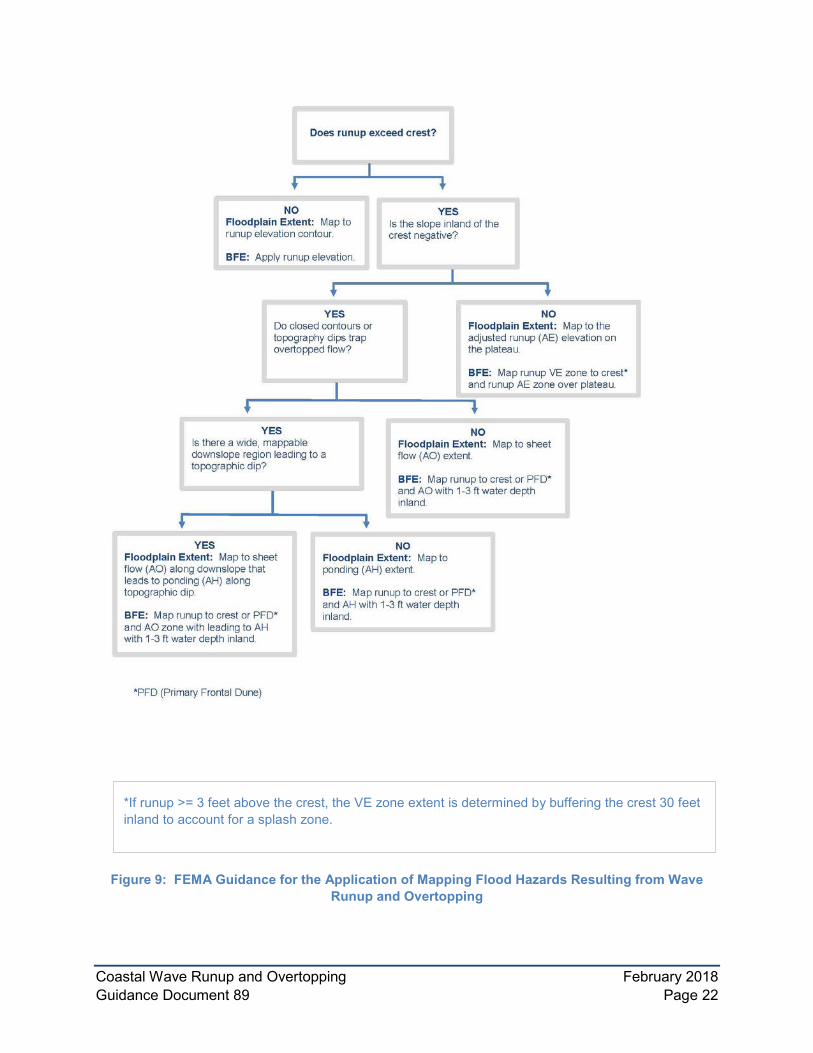
Larger inland floodplain extents are observed in areas of wave runup when overtopping occurs. Guidance on mapping the inland extent of runup and overtopping is provided in the sections below and demonstrated in Figure 9. Sections 4.2.1 and 4.2.2 include additional information on the types of inland flooding.
Coastal Wave Runup and Overtopping February 2018 Guidance Document 89 Page 22
Figure 9: FEMA Guidance for the Application of Mapping Flood Hazards Resulting from Wave Runup and Overtopping
*If runup >= 3 feet above the crest, the VE zone extent is determined by buffering the crest 30 feet inland to account for a splash zone.

Coastal Wave Runup and Overtopping February 2018 Guidance Document 89 Page 23
4.2.1 Runup Dominated Inland Extent
In cases where the runup elevation is less than the crest of the runup feature, the runup elevation dictates the inland extent and BFE at the shoreline. Along non-erodible shorelines, the contour associated with the runup elevation can be applied to map the inland flooding extent. If erosion is applied to the wave runup profile, care must be taken to estimate the correct inland extent of the runup elevation as the topographic information and contours will not be representative of the erosion. Coastal Floodplain Mapping (FEMA, 2015e) provides additional instruction on mapping inland runup floodplain extents given special shoreline protection features, such as mapping to the inland extent of the primary front dune. In these instances, the floodplain should not inundate broad floodplain areas. If the runup elevation contour extends inland of the runup feature crest, it is an indication that overtopping should be mapped and additional analysis may be needed.
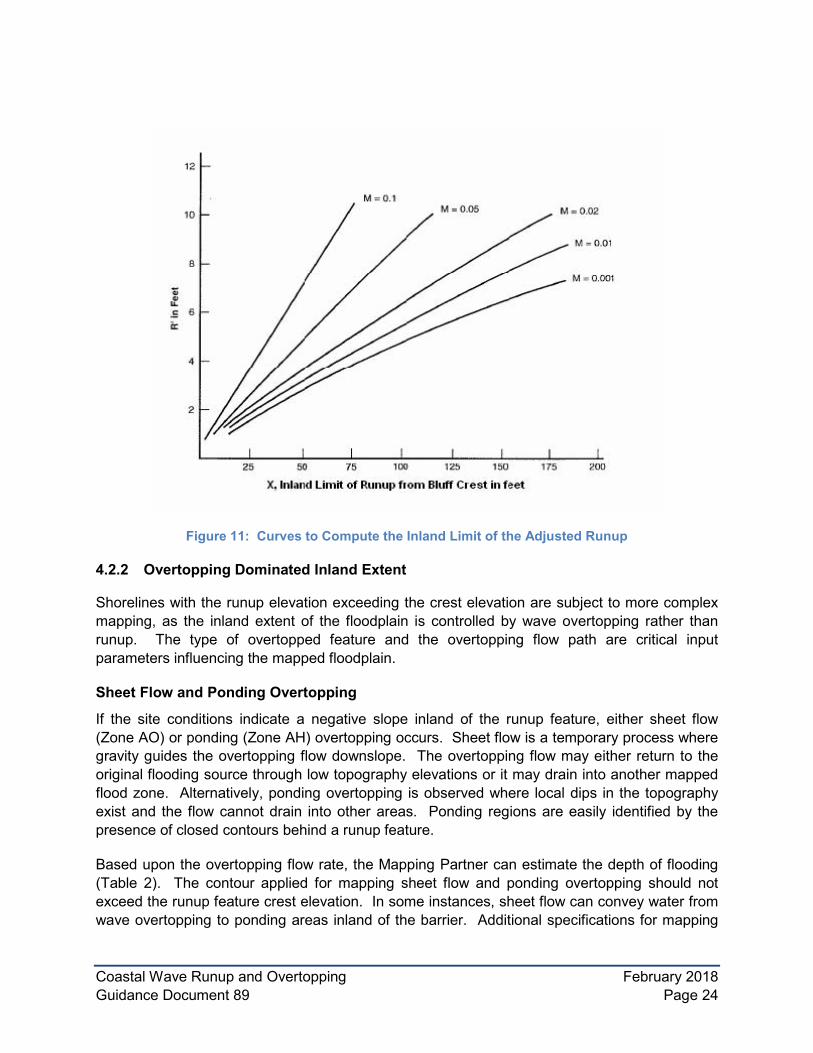
A special consideration for runup dominated inland floodplain extents occurs when runup acts on topographic plateaus, which are features with a flat or mildly positive slope inland of the runup feature crest. The runup elevation along a plateau feature is adjusted to capture runup propagation inland of the barrier crest. French (1982) provides guidance for calculating adjusted runup for plateau overtopping and this guidance has been applied in many coastal flood hazard studies (Figure 10). The inland limit, X, of the adjusted runup is determined using Figure 11.
Figure 10: Treatment of Runup on a Plateau Feature
Coastal Wave Runup and Overtopping February 2018 Guidance Document 89 Page 24
Figure 11: Curves to Compute the Inland Limit of the Adjusted Runup
4.2.2 Overtopping Dominated Inland Extent
Shorelines with the runup elevation exceeding the crest elevation are subject to more complex mapping, as the inland extent of the floodplain is controlled by wave overtopping rather than runup. The type of overtopped feature and the overtopping flow path are critical input parameters influencing the mapped floodplain.
Sheet Flow and Ponding Overtopping
If the site conditions indicate a negative slope inland of the runup feature, either sheet flow (Zone AO) or ponding (Zone AH) overtopping occurs. Sheet flow is a temporary process where gravity guides the overtopping flow downslope. The overtopping flow may either return to the original flooding source through low topography elevations or it may drain into another mapped flood zone. Alternatively, ponding overtopping is observed where local dips in the topography exist and the flow cannot drain into other areas. Ponding regions are easily identified by the presence of closed contours behind a runup feature.
Based upon the overtopping flow rate, the Mapping Partner can estimate the depth of flooding (Table 2). The contour applied for mapping sheet flow and ponding overtopping should not exceed the runup feature crest elevation. In some instances, sheet flow can convey water from wave overtopping to ponding areas inland of the barrier. Additional specifications for mapping

Coastal Wave Runup and Overtopping February 2018 Guidance Document 89 Page 25
sheet flow and ponding overtopping are included in Coastal Floodplain Mapping (FEMA, 2015e).
Once the mean overtopping rate has been estimated for the base flood, determining the resultant flooding landward of the barrier will require the Mapping Partner to evaluate several parameters, including the topography and drainage landward of the overtopped barrier. An estimated ponding elevation can be determined by comparing the overtopping volume to the available storage landward of the barrier. This elevation should be adjusted by the Mapping Partner depending upon drainage features and systems landward of the barrier as well as crest elevations of any features that may allow ponded water to escape. Ponding assumptions and calculations should be reviewed carefully to ensure that overtopping and other potential sources of water trapped behind the barrier are accounted for appropriately. Table 2 provides guidance for mapping typical coastal overtopping scenarios.
In cases of wave overtopping where the potential runup exceeds a barrier crest by 3 feet or more, or in a high-velocity flow zone where the product of depth of flow times the flow velocity squared is greater than or equal to 200 ft3/sec2, the Mapping Partner should limit the mapped BFE to an elevation 3 feet above the barrier crest and map a VE splash zone landward of the crest. The Mapping Partner should consider the overtopping depth and velocity as one factor to determine the landward limit of the VE splash zone.
A final consideration in mapping runup is the representation of the overtopping high velocity hazard. If the computed runup elevation exceeds the runup feature crest by at least 3 feet or if the calculated overtopping rate exceeds 1 cfs/ft, the coastal runup BFE is displaced 30 feet inland from the crest to account for the splash zone hazard of high velocity overtopping.
Table 2: Recommendation for Interpretation of Mean Wave Overtopping
𝑄𝑄 Order of Magnitude Flood Hazard Zone Behind Barrier
<0.0001 cfs/ft Zone X
0.0001-0.01 cfs/ft Zone AO (1 ft depth)
0.01-0.1 cfs/ft Zone AO (2 ft depth)
0.1-1.0 cfs/ft Zone AO (3 ft depth)
>1.0 cfs/ft* 30-ft width+ of Zone VE
(Elevation 3 ft above barrier crest) Landward Zone AO (3 ft depth)
*With estimated 𝑄𝑄 much greater than 1 cfs/ft, removal of barrier from transect representation may be appropriate.
Coastal Wave Runup and Overtopping February 2018 Guidance Document 89 Page 26
+Appropriate inland extent of velocity hazards should take into account barrier characteristics, incident wave conditions, overtopping flow depth and velocity, and other factors.
Flood hazards inland of shore barrier crests are governed by overtopping hydrodynamics. If a study area includes areas of runup dominated inland extents (plateau method), a comparison should be made to the inland extents based on sheet flow and overtopping calculations. Since the distinction between these two is that gravity prevents or facilitates inland bore propagations inland, it should be the case that the SFHA extent derived from overtopping calculations and sheet flow considerations extends further inland than the SFHA extent derived from the plateau method.
5.0 Documentation
The Mapping Partner should document the data, methods, and procedures used to perform runup and overtopping analysis for the determination of the 1-percent-annual-chance flood conditions. Documentation should adhere to guidance detailed in Coastal Data Capture (FEMA, 2014a) and Coastal Study Documentation and Intermediate Data Submittals (FEMA, 2014b). Wave runup and overtopping analysis information is supplied to FEMA in IDS 3. This document provides particular guidance on considerations for mapping runup and overtopping zones. It has been noted that Floodplain Mapping guidance is described more generally in Coastal Floodplain Mapping (FEMA, 2015e). Wave runup and overtopping mapping information is supplied to FEMA in IDS 3.
In addition to the required study documentation, the Mapping Partner should provide a technical report and/or supplemental data that provide details on special considerations and approaches taken to ensure the model results are technically defensible. It is best practice that this technical report and/or supplement data be adequate to allow a third party, with sufficient computing capacity and general knowledge, to replicate the results of the FIS. Considering this, the following require documentation (in a technical report or supplemental data) by the Mapping Partner:
• Selection of the model or methods for each modeling transect.
• A description of how wave characteristics (wave heights, wave periods, and wave directions) for the selected model or method were applied.
• A description of how cross-shore erosion was accounted for in runup and overtopping modeling (if applicable).
• A description of how structure failures were accounted for in runup and overtopping modeling and mapping (if applicable).
• A description of how toe scour was accounted for in runup and overtopping modeling and mapping (if applicable).
• A detailed description of the event-based or response-based method used to model runup and overtopping.
Coastal Wave Runup and Overtopping February 2018 Guidance Document 89 Page 27
• Approaches to determine 1-percent-annual-chance runup elevations and overtopping rates.
6.0 References
Dean R.G. and Dalrymple R. A. 1991. Water Wave Mechanics for Engineers and Scientists. World Scientific, Singapore.
Dewberry and Davis. 1990. Investigation and Improvement of the Capabilities of the FEMA Wave Runup Model (Technical Documentation for RUNUP 2.0), Report and Computer Program. Fairfax, Virginia.
EurOtop. 2016. Wave Overtopping of Sea Defenses and Related Structures: Assessment Manual. Environmental Agency, UK. www.overtopping-manual.com.
Federal Emergency Management Agency. 1981. Manual for Wave Runup Analysis. Coastal Flood Insurance Studies. Stone and Webster Engr. Corp., Boston, pp. 96
Federal Emergency Management Agency. 1991. Investigation and Improvement of Capabilities for the FEMA Wave Runup Model. FEMA, Washington, DC., Prepared by Dewberry and Davis, Inc., pp. 188.
Federal Emergency Management Agency. 2014a. Coastal Data Capture. FEMA, Washington, D.C.
Federal Emergency Management Agency. 2014b. Coastal Study Documentation and Intermediate Data Submittals. FEMA, Washington, D.C.
Federal Emergency Management Agency. 2015a. Overland Wave Propagation. FEMA, Washington D.C., November 2015.
Federal Emergency Management Agency. 2015b. Coastal Erosion. FEMA, Washington D.C., November 2015.
Federal Emergency Management Agency. 2015c. Coastal Structures. FEMA, Washington D.C., November 2015.
Federal Emergency Management Agency. 2015d. Coastal Wave Setup. FEMA, Washington D.C., November 2015.
Federal Emergency Management Agency. 2015e. Coastal Floodplain Mapping. FEMA, Washington D.C., November 2015.
Federal Emergency Management Agency. 2016a. Notations, Acronyms, and Glossary of Terms. FEMA, Washington D.C., May 2016.
Coastal Wave Runup and Overtopping February 2018 Guidance Document 89 Page 28
Federal Emergency Management Agency. 2016b. Flood Frequency and Extreme Value Analysis. FEMA, Washington D.C., November 2016.
Federal Emergency Management Agency. 2017. Coastal General Study Considerations. FEMA, Washington D.C., November 2017.
Federal Emergency Management Agency. In preparation. Wave Determination. FEMA, Washington D.C.
French, J. 1982. Memorandum on Special Computation Procedure Developed for Wave Runup Analysis for Casco Bay. FIS - Maine, 9700-153. Camp Dresser & McKee.
Hunt, I.A. 1959. Design of Seawalls and Breakwaters. J. of Waterways and Harbours Division, ASCE 85 (WW3), 123-152.
Holman, R.A. 1986. Extreme Value Statistics for Wave Run-up on a Natural Beach. Coastal Engineering, Vol 9, No. 6, pp 527-544.
Johnson, B.D., N. Kobayashi, and M.B. Graves. 2011. Cross-Shore numerical model CSHORE for waves, currents, sediment transport and beach profile evolution. ERDC/CHL Technical Report, in press, U.S. Army Engineer R&D Center, Vicksburg, MS.
Kobayashi, N. 1999. Wave runup and overtopping on beaches and coastal structures. Advances in Coastal and Ocean Engineering., Vol. 5, World Scientific, Singapore, 95-154.
Leenknecht, D. A., A.R. Sherlock, and A. Szuwalski. 1995. Automated tools for coastal engineering. J. of Coastal Res., 11(4), Coastal Ed. and Res. Found., Inc., 1108-1124.
Melby, J.A., Nadal-Caraballo, N.C., and Ebersole, B.A. 2012. Lake Michigan: Modeling of Lake Michigan Storm Waves and Water Levels. U.S. Army Corps of Engineers, TR-XX-12.
Melby, J.A., Nadal-Caraballo, N.C., and Ebersole, B.A. 2012. Lake Michigan: Storm Sampling and Statistical Analysis Approach. U.S. Army Corps of Engineers, TR-XX-12.
Stockdon, H.F., R.A. Holman, P.A. Howd, and A.H. Sallenger. 2006. Empirical parameterization of setup, swash, and runup. Coastal Engineerring. 53, Elsevier, 573-588.
The SWAN Team. 2013. SWAN User Manual. Delft University of Technology, the Netherlands.
U.S. Army Corps of Engineers. 2002. Coastal Engineering Manual. EM 1110-2-1100, Washington, D.C., U.S. Army Corps of Engineers. http://www.publications.usace.army.mil/USACE-Publications/Engineer-Manuals/.
U.S. Army Corps of Engineers. 1984. Shore Protection Manual, Dept. of the Army, Waterways Experiment Station; U.S. Army Corps of Engineers, Vicksburg, Mississippi.,
Van Der Meer, J.W., Stam, C.-J.M., 1992. Wave runup on smooth and rock slopes of coastal structures. Journal of Waterway, Port, Coastal, and Ocean Engineering, vol. 118, no. 5. American Society of Civil Engineers, pp. 534 – 550.

Coastal Wave Runup and Overtopping February 2018 Guidance Document 89 Page 29