Guidance Document on Measurement Uncertainty for ... · Guidance Document on Measurement...
110
Guidance Document on Measurement Uncertainty Working Group for Measurement Uncertainty in PCDD/F and PCB Analysis - 2017 1 Guidance Document on Measurement Uncertainty for Laboratories performing PCDD/F and PCB Analysis using Isotope Dilution Mass Spectrometry 2017
Transcript of Guidance Document on Measurement Uncertainty for ... · Guidance Document on Measurement...
Guidance Document on Measurement Uncertainty
Working Group for Measurement Uncertainty in PCDD/F and PCB Analysis - 2017 1
Guidance Document on Measurement Uncertainty for Laboratories performing PCDD/F and PCB Analysis using
Isotope Dilution Mass Spectrometry
2017
Guidance Document on Measurement Uncertainty
Working Group for Measurement Uncertainty in PCDD/F and PCB Analysis - 2017 2
Authorship
Editors
Gauthier Eppe (ULg, Belgium)
Alexander Schaechtele (EU-RL, Germany)
Johannes Haedrich (EU-RL, Germany)
Alwyn Fernandes (Fera Science Ltd., UK)
Members of the Working Group for Measurement Uncertainty in PCDD/F
and PCB Analysis
Gauthier Eppe (Chairman) Centre de Recherche Analytique et Technologique (CART)
University of Liège, Liège, Belgium
Annalisa Abballe Istituto Superiore di Sanità (ISS), Rome, Italy
Thorsten Bernsmann Chemisches und Veterinaeruntersuchungsamt Muensterland-
Emscher-Lippe (CVUA-MEL), Muenster, Germany
Roberta Ceci Istituto Zooprofilattico Sperimentale dell'Abruzzo e del
Molise "G. Caporale", Teramo, Italy
Gianfranco Diletti Istituto Zooprofilattico Sperimentale dell'Abruzzo e del
Molise "G. Caporale", Teramo, Italy
Alessandro di Domenico Independent expert, Italy
Alwyn Fernandes Fera Science Ltd., York, UK
Johannes Haedrich European Union Reference Laboratory (EU-RL) for Dioxins
and PCBs in Feed and Food, Freiburg, Germany
Jerry Hart Independent expert, Manchester, UK
Helge Hove The National Institute of Nutrition and Seafood Research
(NIFES), Bergen, Norway
Anna-Laura Iamiceli Istituto Superiore di Sanità (ISS), Rome, Italy
Stefan van Leeuwen RIKILT -Institute for Food Safety, Wageningen, NL
Leondios Leondiadis National Center for Scientific Research (NCSR)
“Demokritos”, Athens, Greece
Rainer Malisch European Union Reference Laboratory (EU-RL) for Dioxins
and PCBs in Feed and Food, Freiburg, Germany
Philippe Marchand Laboratoire d’Etude des Résidus et Contaminants dans les
Aliments (LABERCA), Nantes, France
Guidance Document on Measurement Uncertainty
Working Group for Measurement Uncertainty in PCDD/F and PCB Analysis - 2017 3
Wolfgang Moche Umweltbundesamt, Vienna, Austria
Alexander Schaechtele European Union Reference Laboratory (EU-RL) for Dioxins
and PCBs in Feed and Food, Freiburg, Germany
Georges Scholl Centre de Recherche Analytique et Technologique (CART)
University of Liège, Liège, Belgium
Giampiero Scortichini Istituto Zooprofilattico Sperimentale dell'Umbria e delle
Marche, Perugia, Italy
Yves Tondeur Independent expert, USA
Irene Vassiliadou National Center for Scientific Research (NCSR)
“Demokritos”, Athens, Greece
Guidance Document on Measurement Uncertainty
Working Group for Measurement Uncertainty in PCDD/F and PCB Analysis - 2017 4
Table of Contents
1. Scope and Field of application ........................................................................................... 7
2. Acronyms ........................................................................................................................... 9
3. Introduction ...................................................................................................................... 10
4. Compliance Assessment ................................................................................................... 12
4.1 General ....................................................................................................................... 12
4.2 Compliance Assessment in PCDD/F and PCB Analysis ........................................... 13
4.2.1 Legal Requirements for official control ........................................................... 13
4.2.2 Expression of Results and Compliance Assessment ........................................ 14
4.3 Estimation of Target Measurement Uncertainty from Legal Requirements .............. 15
5. Grouping of Matrices ....................................................................................................... 17
6. The Empirical or Top-Down Approach ........................................................................... 18
6.1 Precision Studies ........................................................................................................ 20
6.2 Trueness or Bias Studies ............................................................................................ 22
6.2.1 Estimating ubias using a Representative Matrix CRM ...................................... 23
6.2.2 Estimating ubias using Results from Interlaboratory Studies ............................ 24
6.2.3 Estimating ubias from fortification experiments ................................................ 25
6.3 Combined and Expanded Uncertainties ..................................................................... 27
6.4 Moving Time Window Scheme ................................................................................. 28
6.5 Contributions from Current Performance .................................................................. 29
6.5.1 Contributions to MU from LOQs and procedural blanks ................................ 29
7. The Theoretical or Bottom-Up Approach ........................................................................ 31
8. The Semi-empirical Approach ......................................................................................... 33
8.1 Introduction ................................................................................................................ 33
8.2 Estimation of MU using the Semi-empirical Approach ............................................. 34
8.3 Precision Contribution ............................................................................................... 35
8.3.1 Intermediate precision uncertainty ................................................................... 35
8.4 Bias Contribution ....................................................................................................... 36
8.4.1 Bias uncertainty ................................................................................................ 36
8.5 Calibration Curve Uncertainty ................................................................................... 36
8.5.1 Full calibration (Option 1) ................................................................................ 37
8.5.2 Calibration point check (Option 2) ................................................................... 37

Guidance Document on Measurement Uncertainty
Working Group for Measurement Uncertainty in PCDD/F and PCB Analysis - 2017 5
8.6 Additional Contributions ............................................................................................ 38
8.6.1 Volume uncertainty .......................................................................................... 38
8.6.2 Standard solution concentration uncertainty .................................................... 39
8.6.3 Sample aliquot weighing uncertainty ............................................................... 39
8.7 Combined and Expanded Uncertainty ....................................................................... 40
9. Practical Implementation .................................................................................................. 41
9.1 Combined Uncertainty in TEQ from Individual Congeners ...................................... 41
9.2 Laboratories new to Isotope Dilution Analysis .......................................................... 41
9.3 Exclusion of Data ....................................................................................................... 42
9.4 Factors affecting a Timeline-based Evaluation of MU .............................................. 42
9.5 MU Estimation when ad hoc amendments to methods are used ................................ 43
9.6 Rounding of Results and Significant Digits ............................................................... 44
10. Inter-laboratory Studies .................................................................................................... 45
10.1 Information from PT Providers for participating Laboratories .................................. 45
10.2 Evaluation of Participant’s Performance and reported MU: z - and zeta-Scores ...... 45
11. Symbols, Terms and Definitions ...................................................................................... 47
12. References ........................................................................................................................ 58
Annex A – General ................................................................................................................... 62
A.1 Grouping of Matrices ................................................................................................. 62
Annex B – Intermediate Precision Studies ............................................................................... 64
B.1 Evaluation of intermediate precision contribution to MU ......................................... 64
B.2 Evaluation of intermediate precision from various matrices ..................................... 67
Annex C – Trueness (Bias) Studies.......................................................................................... 72
C.1 Evaluation of the bias contribution to MU from CRM .............................................. 72
C.2 Evaluation of the bias contribution to MU from PT results ....................................... 82
C.3 Evaluation of the bias contribution to MU from fortified samples ............................ 84
C.4 Requirements for the uncertainty component of the assigned value in PTs .............. 87
Annex D – Evaluation of contributions from current performance ......................................... 90
D.1 Evaluation of contributions to MU from LOQs and procedural blanks .................... 90
Annex E – Conversion of Specifications to Standard Uncertainties ........................................ 92
E.1 Standard uncertainties from assumed distributions ................................................... 92
E.2 Practical examples ...................................................................................................... 93
Guidance Document on Measurement Uncertainty
Working Group for Measurement Uncertainty in PCDD/F and PCB Analysis - 2017 6
Annex F – Combined Uncertainty in TEQ from Individual Congeners .................................. 95
Annex G – Evaluation of Participant’s Performance: z- and zeta-Scores ................................ 99
Annex H – Measurement Uncertainty: Semi-empirical Approach ....................................... 101
H.1 Description of applied method of analysis ............................................................... 101
H.2 Estimation of measurement uncertainty ................................................................... 103
H.3 Combined and expanded standard uncertainty ........................................................ 108
H.4 Expanded uncertainties for 17 PCDD/F and 12 DL-PCB congeners ...................... 109

Guidance Document on Measurement Uncertainty
Working Group for Measurement Uncertainty in PCDD/F and PCB Analysis - 2017 7
1. Scope and Field of application
This document on measurement uncertainty was developed within the network of the
European Union Reference Laboratory (EURL) for Dioxins and PCBs in Feed and Food and
the respective National Reference Laboratories (NRLs) of member states. Detailed guidance
is given on the evaluation of measurement uncertainty in the quantitative analysis of
polychlorinated dibenzo-p-dioxins and dibenzofurans (PCDD/Fs) and polychlorinated
biphenyls (PCBs), to assist laboratories performing official feed and food control within the
European Union, especially National Reference Laboratories (NRLs) and Official
Laboratories (OFLs). It provides useful key elements contributing to further harmonization of
compliance assessment and outlines practical aspects related to measurement uncertainty
estimation.
A new concept placing special emphasis on the inclusion of current method performance data
is presented. The concept covers the full analytical process from sample receipt at the
laboratory through sample storage, preparation and analysis, to data processing and reporting.
In particular, it focuses on the role of analytical variability generally known as "measurement
uncertainty" (MU) in the interpretation of analytical results for assessment of their compliance
with a specification. Effects from sampling [EURACHEM/CITAC 2007, /18/] and transport
also contributing to MU are acknowledged but not treated within the scope of this document.
Two selected approaches for measurement uncertainty estimation are proposed for the
determination of PCDD/Fs and PCBs in food and feed by gas chromatography-mass
spectrometry (GC-MS) using internal standard stable isotope labelled analogues. An
empirical, or “top-down”, approach combines contributions from intermediate (intra-
laboratory) precision and trueness (expressed as bias) to estimate measurement uncertainty,
both for individual congeners and for sum parameters. The working group recommends the
use of the empirical approach as described in this document as the main option for MU
estimation, because it is designed and developed to cover the whole analytical process and
also includes the opportunity to reassess or update MU on a regular basis.
However, an alternative methodology based on a semi-empirical approach following the
EURACHEM/CITAC guide [EURACHEM/CITAC 2012, /12/] is also presented. It has been
designed for laboratories new to this type of analysis that have generated data from initial
validation studies. In this case the semi-empirical approach may be a good starting point,
however the authors recommend implementing the empirical or top-down approach once
enough data have been gathered.
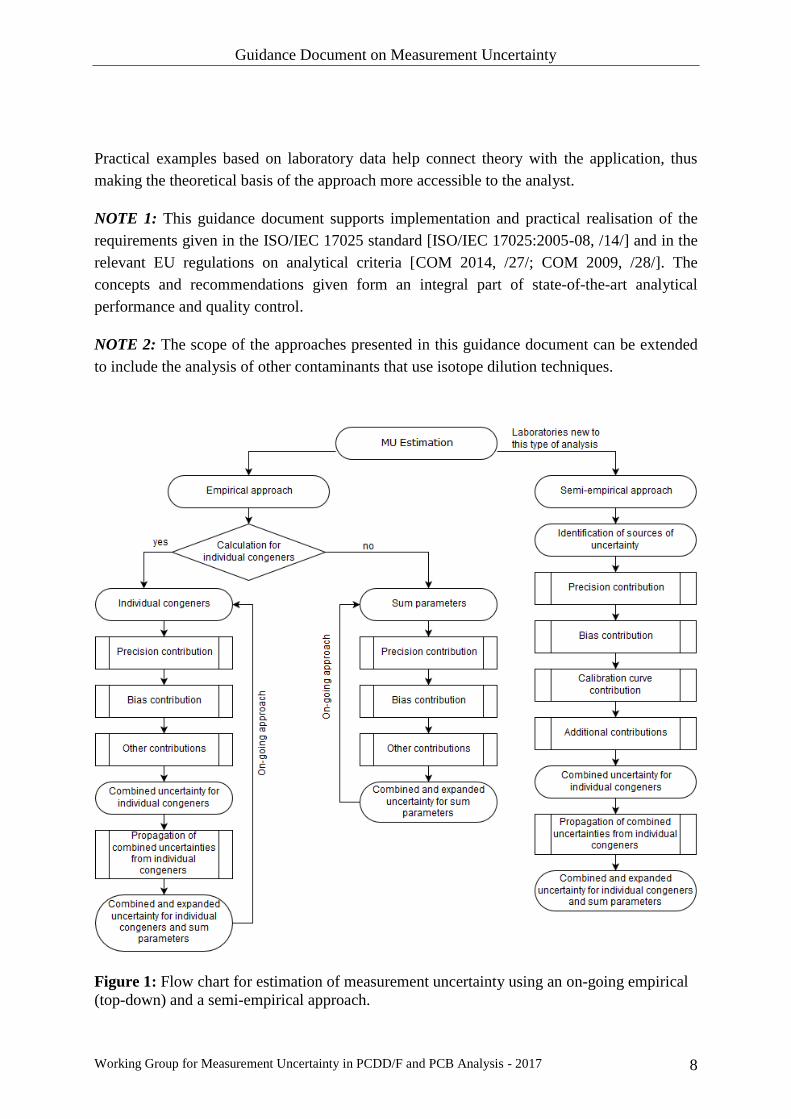
Figure 1 provides a flow chart for the estimation of measurement uncertainty applying the
different approaches described in this document.
Guidance Document on Measurement Uncertainty
Working Group for Measurement Uncertainty in PCDD/F and PCB Analysis - 2017 8
Practical examples based on laboratory data help connect theory with the application, thus
making the theoretical basis of the approach more accessible to the analyst.
NOTE 1: This guidance document supports implementation and practical realisation of the
requirements given in the ISO/IEC 17025 standard [ISO/IEC 17025:2005-08, /14/] and in the
relevant EU regulations on analytical criteria [COM 2014, /27/; COM 2009, /28/]. The
concepts and recommendations given form an integral part of state-of-the-art analytical
performance and quality control.
NOTE 2: The scope of the approaches presented in this guidance document can be extended
to include the analysis of other contaminants that use isotope dilution techniques.
Figure 1: Flow chart for estimation of measurement uncertainty using an on-going empirical
(top-down) and a semi-empirical approach.

Guidance Document on Measurement Uncertainty
Working Group for Measurement Uncertainty in PCDD/F and PCB Analysis - 2017 9
2. Acronyms
Acronym Definition
BIPM International Bureau of Weights and Measures
CITAC Cooperation on International Traceability in Analytical Chemistry
CRM Certified Reference Material
DIN German Institute for Standardization (Deutsches Institut fuer Normung)
EPA Environmental Protection Agency
EU-RL European Union Reference Laboratory
EURACHEM Network of analytical chemistry organisations in Europe
GUM Guide to the Estimation of Uncertainty in Measurement
IEC International Electrotechnical Commission
IFCC International Federation of Clinical Chemistry and Laboratory Medicine
ISO International Standardisation Organisation
IUPAC International Union of Pure and Applied Chemistry
IUPAP International Union of Pure and Applied Physics
NIST National Institute of Standards and Technology
NRL National Reference Laboratory
NT Nordtest (Nordic Innovation)
OIML International Organization of Legal Metrology
OFL Official Laboratory
PCDDs Polychlorinated dibenzo-p-dioxins
PCDFs Polychlorinated dibenzofurans
PCBs Polychlorinated biphenyls
DL-PCBs Dioxin-like polychlorinated biphenyls
NDL-PCBs Non dioxin-like polychlorinated biphenyls
SEMATEC Semiconductor Manufacturing Technology
TEF Toxic equivalency factor
TEQ Toxic equivalency
WHO World Health Organisation
Guidance Document on Measurement Uncertainty
Working Group for Measurement Uncertainty in PCDD/F and PCB Analysis - 2017 10
3. Introduction
Measurement uncertainty is a subject that is both complex and continually evolving.
Scientists generally take great care to identify the types and sources of measurement error to
reduce its impact on results to acceptable levels, and to characterise the extent of residual
measurement uncertainty within a set of data.
The concepts proposed in this guidance document consider the uncertainty associated with the
analytical procedure only. The uncertainties related to, for example, sampling, homogeneity
or stability of the sample also contribute to the total uncertainty but these aspects are
discussed elsewhere [EURACHEM/CITAC 2007, /18/]. An additional and significant element
of uncertainty arising from the use of toxic equivalence factors (WHO-TEFs) to derive WHO-
PCDD/F- and WHO-PCB-TEQ is similarly beyond the scope of this document.
An analytical result cannot be properly interpreted without knowledge about its uncertainty.
Estimation of measurement uncertainty is not only a requirement of ISO/IEC 17025 [ISO/IEC
17025:2005-08, /14/] for testing laboratories. In the feed and food sector, legislation setting
maximum levels addresses how analytical results shall be expressed and interpreted. All
reported analytical results actually take the form ‘x ± U’, where x is the analytical result (the
best estimate of the true value) and U the expanded measurement uncertainty, at a specified
level of confidence (e.g. 95%). Two times U is the range within which the unknown true
value of the real sample analysed is assumed to fall, with a high probability (depending on the
coverage factor k selected). The value of U is the uncertainty generally reported by analysts.
Three general strategies for MU estimation are considered:
- Empirical or top-down approach based on performance data of the whole method
taking into account trueness and precision contributions
- Theoretical or bottom-up approach based on a mathematical model of the
measurement process, estimating individual contributions of the relevant sources of
uncertainty
- Semi-empirical approach based on a combination of the theoretical and empirical
approach
They are based on the following steps: specifying the measurand, identifying the uncertainty
sources, quantifying uncertainty components, and finally combining all individual
contributions to calculate the combined uncertainty [EURACHEM/CITAC 2012, /12/].
In the first sections of this guide, the concept and importance of measurement uncertainty are
introduced, along with a glossary of symbols and definitions. Details are then given of how to
estimate uncertainties in real measurement situations by the empirical (top-down) and semi-
empirical approaches. The main steps involved in calculating the uncertainty for a
measurement are outlined, with examples found in the Annex. Finally, a list of publications

Guidance Document on Measurement Uncertainty
Working Group for Measurement Uncertainty in PCDD/F and PCB Analysis - 2017 11
for further reading is included to direct the reader’s attention towards the next steps in
understanding and calculating measurement uncertainties.
NOTE: Although in this guidance document, U is calculated from individual contributory
terms expressed in relative units to more easily accommodate these terms, e.g. various
concentrations, concentration ranges or various similar matrices, U is expressed in absolute
units when associated with an analytical result for reporting and compliance assessment.
Guidance Document on Measurement Uncertainty
Working Group for Measurement Uncertainty in PCDD/F and PCB Analysis - 2017 12
4. Compliance Assessment
4.1 General
The generally accepted procedure for compliance assessment [EURACHEM/CITAC 2007,
/26/; EC 2004, /34/] is to report samples as containing ‘not less than (x-U)’ in situations
where the statutory limit is a maximum permissible concentration. Here any enforcement
action is only taken when the analyst is sure that the specification limit is exceeded. The
interpretation of results is depicted on Figure 2. In practice, if we are considering a maximum
value in legislation, the analyst will determine the analytical level and estimate the
measurement uncertainty at that level, subtract the uncertainty from the reported
concentration (x-U) and use that value to assess compliance. If that value is larger than the
legislation limit the sample is considered to be non-compliant (for details concerning
PCDD/Fs and PCBs, see chapter 4.2.1). Thus, according to the accepted procedure, only the
result in situation 4 is non-compliant beyond reasonable doubt (Figure 2).
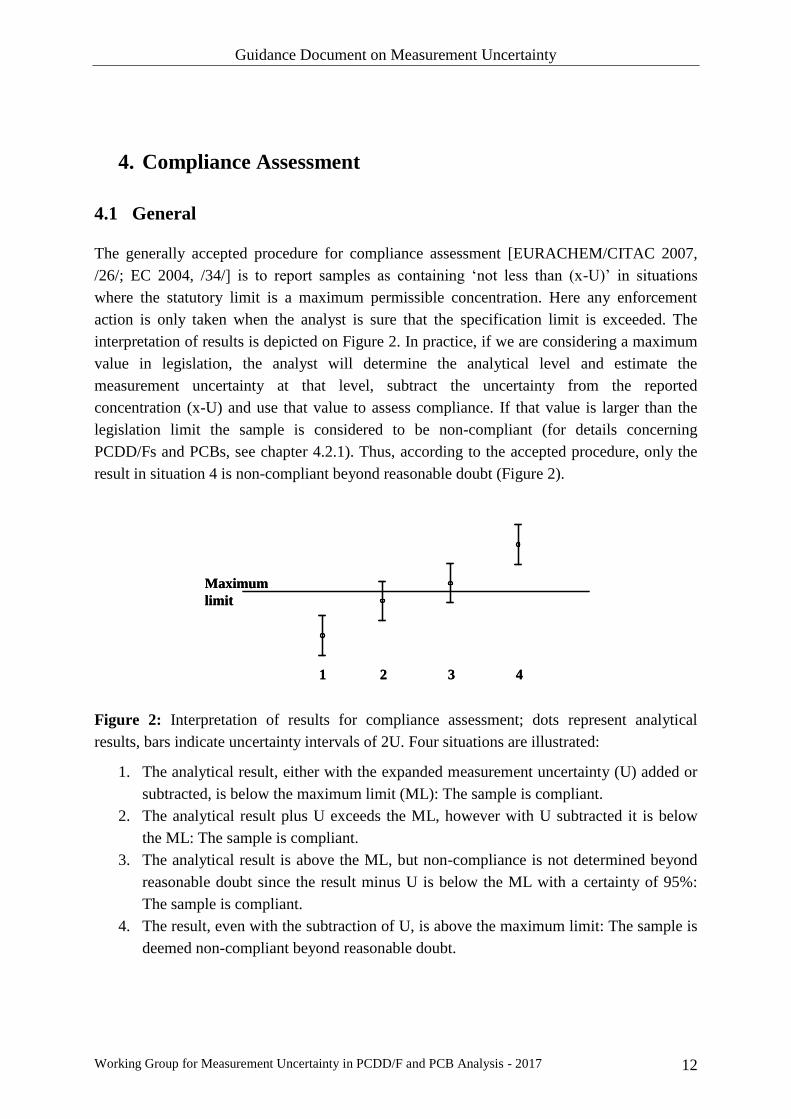
Figure 2: Interpretation of results for compliance assessment; dots represent analytical
results, bars indicate uncertainty intervals of 2U. Four situations are illustrated:
1. The analytical result, either with the expanded measurement uncertainty (U) added or
subtracted, is below the maximum limit (ML): The sample is compliant.
2. The analytical result plus U exceeds the ML, however with U subtracted it is below
the ML: The sample is compliant.
3. The analytical result is above the ML, but non-compliance is not determined beyond
reasonable doubt since the result minus U is below the ML with a certainty of 95%:
The sample is compliant.
4. The result, even with the subtraction of U, is above the maximum limit: The sample is
deemed non-compliant beyond reasonable doubt.
Maximum
limit
1 2 3 4
Maximum
limit
1 2 3 4
Guidance Document on Measurement Uncertainty
Working Group for Measurement Uncertainty in PCDD/F and PCB Analysis - 2017 13
4.2 Compliance Assessment in PCDD/F and PCB Analysis
4.2.1 Legal Requirements for official control
By definition and in principle, measurement uncertainty (MU) is associated with a measurand
(e.g. a congener concentration derived from a signal value). In the specific case of PCDD/Fs
and related dioxin-like compounds, the concept of Toxic Equivalents (TEQs) was introduced
by toxicologists with the objective of obtaining an estimate of the summed PCDD/F and PCB
toxicity of a sample irrespective of its congener pattern. Stricto sensu, this TEQ value is not a
measurand but a sum of individual congener concentrations each multiplied by its assigned
weighting factor, the TEF value [Van den Berg M et al. 2006, /19/]. Within EU legislation,
maximum levels are expressed in TEQs, therefore, MU values must be assessed for these
TEQ sum parameters for decision making and compliance assessment.
For compliance assessment, analytical results of a sample expressed as WHO-PCDD/F-TEQ,
WHO-PCB-TEQ or WHO-PCDD/F-PCB-TEQ are compared with maximum levels and/or
action levels/thresholds given in TEQ units, taking into account measurement uncertainty
[COM 2006, /29/; COM 2013, /30/; DIRECTIVE 2002, /31/].
Legislation [COM 2009, /28/; COM 2014, /27/] further requires:
“The lot is accepted, if the result of a single analysis […] performed by a confirmatory
method does not exceed the respective maximum level of PCDD/Fs and the sum of PCDD/Fs
and dioxin-like PCBs as laid down in Regulation (EC) No 1881/2006 taking into account the
measurement uncertainty.”
“The lot is non-compliant with the maximum level as laid down in Regulation (EC) No
1881/2006, if the upperbound analytical result obtained with a confirmatory method and
confirmed by duplicate analysis, exceeds the maximum level beyond reasonable doubt taking
into account the measurement uncertainty. The mean of the two determinations, taking into
account the measurement uncertainty is used for verification of [non-]compliance. The
duplicate analysis is necessary if the result of the first determination applying confirmatory
methods with the use of 13
C-labelled internal standard for the relevant analytes is not
compliant.”
“The measurement uncertainty may be taken into account […]:
- by calculating the expanded uncertainty, using a coverage factor of 2 which gives a
level of confidence of approximately 95 %. A lot or sublot is non-compliant if the
measured value minus U is above the established permitted level. In case of a separate
determination of PCDD/Fs and dioxin-like-PCBs the sum of the estimated expanded
uncertainty of the separate analytical results of PCDD/Fs and dioxin-like PCBs has to
be used for the estimated expanded uncertainty of the sum of PCDD/Fs and dioxin-
like PCBs.”
Guidance Document on Measurement Uncertainty
Working Group for Measurement Uncertainty in PCDD/F and PCB Analysis - 2017 14
Estimated expanded uncertainty for the sum of PCDD/Fs and dioxin-like PCBs
According to legislation [COM 2009, /28/; COM 2014, /27/], the expanded uncertainty U for
the sum of PCDD/Fs and DL-PCBs may be assessed by summing up both absolute U values
estimated for WHO-PCDD/F-TEQ results, and for WHO-PCB-TEQ results, respectively.
Measurement uncertainty of the mean calculated from results of two separate analyses
In this document, measurement uncertainty is estimated for a result from single analyses.
According to legislation [COM 2009, /28/; COM 2014, /27/], however, a mean result from
duplicate analysis is required for verification of non-compliance.
If the results from two separate determinations differ by no more than the intermediate
precision limit (Rw = 2.8sRw), the individual measurement uncertainties are propagated
according to the following formula:
𝑢𝑐,𝑚𝑒𝑎𝑛 =√𝑢𝑐1
2 +𝑢𝑐22
2 Eq. 1
uc,mean = combined standard uncertainty of the mean from results of two separate analyses
uc1, uc2 = individual combined standard uncertainties of results 1 and 2, with uc1 uc2
NOTE: Equation 1 shows that the combined standard uncertainty of the mean of two separate
results are approximately by √2/2 smaller than the uncertainty of each individual result.
4.2.2 Expression of Results and Compliance Assessment
Reporting of results as TEQ for PCDD/Fs and DL-PCBs and the sum of NDL-PCBs for
compliance assessment shall include the analytical result x and its associated expanded
uncertainty U, including the applied coverage factor for calculation of U. The results are
reported as x ± U, calculated using a coverage factor of 2 (level of confidence of ca. 95%).
In addition, according to EU regulations on analytical criteria [COM 2009, /28/; COM 2014,
/27/], the results for PCDD/Fs and PCBs shall be expressed in the same units and with at least
the same number of significant figures as the maximum levels.
For rounding of results and significant digits, refer to chapter 9.6.

Guidance Document on Measurement Uncertainty
Working Group for Measurement Uncertainty in PCDD/F and PCB Analysis - 2017 15
4.3 Estimation of Target Measurement Uncertainty from Legal
Requirements
In case of PCDD/F and PCB analysis in feed and food, Commission Regulations (EU) No
589/2014 (food) [COM 2014, /27/] and (EC) No 152/2009 (feed) [COM 2009, /28/] require
that confirmatory methods used within official control should not exceed the following
performance criteria for sum-parameters in the range of the maximum level:
- Trueness, expressed as bias, must fall within the range ± 20% for TEQ results, or
± 30% for the sum of PCBs 28, 52, 101, 138, 153 and 180.
- Relative intermediate precision must be less than 15% for TEQ results, or ≤ 20% for
the sum of PCBs 28, 52, 101, 138, 153 and 180.
Further, each laboratory must evaluate the measurement uncertainty associated with the
analytical results that it produces. As maximum acceptable values for measurement
uncertainties are not defined in the above mentioned regulations, practical considerations
suggest definition of a target measurement uncertainty as an additional method performance
parameter [EURACHEM/CITAC 2015, /36/].
The maximum tolerable standard uncertainty uc,max can be calculated by combining the
uncertainty components of the required precision and trueness values specified in the
regulations mentioned above:
𝑢𝑐,𝑚𝑎𝑥 = √𝑢𝑅𝑤,𝑚𝑎𝑥2 + 𝑢𝑏𝑖𝑎𝑠,𝑚𝑎𝑥
2 Eq. 2
𝑢𝑏𝑖𝑎𝑠,𝑚𝑎𝑥 = (𝑏𝑖𝑎𝑠𝑚𝑎𝑥
√3) Eq. 3
where uRw,max is the maximum tolerable intermediate precision expressed as sRw, and biasmax is
the maximum tolerable bias with its corresponding uncertainty component ubias,max. The
uncertainty component ubias,max is calculated from a rectangular distribution which is the half-
width of the full interval (± bias) divided by the square-root of 3 [EURACHEM/CITAC 2015,
/36/].
NOTE: The selection of a rectangular distribution reflects the acceptable bias distribution
within the range of ± 20% for TEQ results, or ± 30% for the sum of PCBs 28, 52, 101, 138,
153 and 180
With a coverage factor of 2, the maximum tolerable expanded measurement uncertainty Umax
becomes:
𝑈𝑚𝑎𝑥 = 2 ∙ 𝑢𝑐,𝑚𝑎𝑥 Eq. 4

Guidance Document on Measurement Uncertainty
Working Group for Measurement Uncertainty in PCDD/F and PCB Analysis - 2017 16
Table 1 shows that in PCDD/F and PCB analysis, the expanded measurement uncertainty
shall not exceed ± 38% for TEQ results, and ± 53% for the sum of PCBs 28, 52, 101, 138, 153
and 180.
In principle, the estimated expanded measurement uncertainty should not exceed the
expanded target measurement uncertainty [EURACHEM/CITAC 2015, /36/].
Table 1: Requirements according to Commission Regulations (EU) No 589/2014 (food),
(EC) No 152/2009 (feed) and discussed amendments for NDL-PCBs, and resulting combined
target standard uncertainty and expanded uncertainty.
Parameter Trueness
biasmax (%)
Precision
sRw (%)
Target standard
uncertainty
umax (%)
Target expanded
uncertainty
Umax (%)
PCDD/Fs and
DL-PCBs
20 15 18.9 38
NDL-PCBs by
isotope dilution*
20 15 18.9 38
NDL-PCBs**
30 20 26.5 53
* when all six
13C-labelled analogues are used as internal standards
** other techniques
Guidance Document on Measurement Uncertainty
Working Group for Measurement Uncertainty in PCDD/F and PCB Analysis - 2017 17
5. Grouping of Matrices
In principle, each matrix in the scope of validation requires individual MU assessment within
the working range. If this is not possible for some matrices, e.g. due to the limited availability
of suitable CRMs or proficiency tests, then these may be grouped with similar matrices (for
which identical or similar analytical procedures provide equivalent performance) in order to
estimate the relative MU.
The assessment of MU for an analytical procedure covering different matrices or
identical/similar procedures providing equivalent performance should be based on a range of
representative matrices and concentration ranges. It may be possible to use a single matrix
that covers all the sample types specified in a particular group if there is evidence to suggest
that the uncertainties are comparable. However, different sample matrices and/or analyte
concentration ranges can behave differently in some cases and would therefore require
separate uncertainty estimates. E.g. the precision may not be proportional to the analyte level
over the entire concentration range as expected and/or the magnitude of the precision may
vary from matrix to matrix at comparable concentrations [Barwick, Ellison 2000, /9/].
A possible grouping of matrices for PCDD/F and PCB analysis according to the applied
methods is given in Annex A.1.
NOTE: Grouping of matrices is recommended for both empirical (top-down) and semi-
empirical approaches developed in this document.

Guidance Document on Measurement Uncertainty
Working Group for Measurement Uncertainty in PCDD/F and PCB Analysis - 2017 18
6. The Empirical or Top-Down Approach
The “top-down” or empirical approach is based on the performance of the full method,
acknowledging trueness and precision contributions to MU.
International bodies recognise historic data from validation processes, interlaboratory studies,
and from the use of RMs and/or CRMs, as a valid basis for estimation of MU in analytical
work. However, such an estimated MU does not necessarily reflect the current uncertainty
associated with daily routine results.
This guide therefore proposes a top-down approach that integrates relevant historical data and
more recent data from internal and external quality controls. Moreover, daily (or batch)
performance indicators such as the actual limits of quantification, matrix and procedural blank
effects, should be included in order to provide a realistic and current estimate of MU
associated with the results being reported (see chapter 6.5).
Basic principles are adopted from Nordtest’s Report TR 537 "Handbook for calculation of
measurement uncertainty in environmental laboratories" [Nordtest 2012, /3/]. Therein, a
procedure is suggested that uses routine quality control data acquired from RMs and/or
CRMs, results from interlaboratory and/or PT studies, and validation data for a realistic
estimate of MU. Nordtest’s keynote is to make use of results and data which are already
available, without adding to the laboratory’s workload. From these data, the contribution
affecting precision and the overall contribution to method and laboratory bias are determined.
This concept was more recently adopted by ISO 11352:2012-07, or DIN ISO 11352:2013-03,
“Water quality – Estimation of measurement uncertainty based on validation and quality
control data” [ISO 11352:2012-07, or DIN ISO 11352:2013-03, /4/].
According to Barwick and Ellison [Barwick, Ellison 2000, /9/], two sets of experiments can
be carried out, a precision study and a trueness study, which will provide the information
required to estimate the combined uncertainty of the method. They should be planned in a
way that as many sources of uncertainty as possible are covered.
Within the scope of this guidance document, the experimental design consists of a long-term
precision study for looking at intermediate precision by using RMs or CRMs as QC matrix
samples. These QC samples should be representative of the matrix and the levels of interest.
A trueness study, by means of relevant matrix CRMs, fortified RMs (blank or low
contaminated), interlaboratory studies or PTs, provides estimation of the uncertainty
component of the bias.
NOTE 1: Contributions of precision, and of a bias, respectively, to the combined standard
uncertainty from which the expanded uncertainty is calculated can be based on individual
congeners or expressed for the sum-TEQ parameter. For example, a comparison of MU

Guidance Document on Measurement Uncertainty
Working Group for Measurement Uncertainty in PCDD/F and PCB Analysis - 2017 19
values calculated for individual congeners following the Eurachem Guide
[EURACHEM/CITAC 2012, /12/] together with MUs estimated for total PCDD/F- and PCB-
WHO-TEQs has been published elsewhere [Fernandes et al. 2012, /13/].
NOTE 2: In some QC samples, not all of the congeners may have a value assigned to them,
e.g. due to very low concentrations. Assigned values missing for certain individual congeners
may then be supplemented by results from analysis of fortification experiments involving
fortified (blank matrix) samples.
Guidance Document on Measurement Uncertainty
Working Group for Measurement Uncertainty in PCDD/F and PCB Analysis - 2017 20
6.1 Precision Studies
The uncertainty component for random variations uRw should be estimated under conditions
that are also valid during routine analysis. Therefore, intermediate conditions (between
batches) should apply rather than repeatability or reproducibility conditions. The same
conditions apply for QC charts. Therefore, the guide proposes long-term precision studies to
evaluate this parameter under intermediate precision (RW) conditions.
Suitable control samples must be carefully selected. Ideally, they should be representative of
the samples being analysed, in terms of both the physical and chemical composition of the
matrix and the concentration of the analyte.
NOTE 1: It is acknowledged that the use of representative QC samples may not always be
possible. In practice, a laboratory may have only few suitable matrices available.
The QC sample (e.g. one per series of samples) should be treated in exactly the same way,
covering the whole analytical procedure. It can be a fortified matrix sample (with
undetectable or low levels of contamination) or an appropriate reference material, if available.
QC samples must be characterized and show sufficient homogeneity and long-term stability.
CRMs can also be used, but may prove quite expensive for this purpose, unless the
uncertainty contribution of the bias is estimated simultaneously from the same CRM.
The intermediate precision contribution to uncertainty uRw may be calculated as
𝑢𝑅𝑤 = 𝑠𝑅𝑤 Eq. 5
𝑢𝑅𝑤,𝑟𝑒𝑙 = 𝑠𝑅𝑤,𝑟𝑒𝑙 Eq. 6
sRw = intermediate precision standard deviation
sRw,rel = relative intermediate precision standard deviation
Examples for intermediate precision studies for PCDD/Fs and DL-PCBs in selected matrices
are given in Annex B.1.
NOTE 2: The intermediate precision standard deviation may also be calculated using data
from the results of duplicate analysis performed for similar sample types and using the same
method (e.g. 10 duplicate analyses under intermediate precision conditions of samples in the
range of the level of interest) [IUPAC 1997, /41/].
If the same method is used for various matrices defined within a matrix group (Annex A.1),
and it covers a suitable range of analyte concentrations, it may be possible to estimate a single
precision contribution value by using a pooled relative intermediate standard deviation
sRw,pool,rel of the included matrices. In this case, sRw,rel (equation 7) should be constant to the

Guidance Document on Measurement Uncertainty
Working Group for Measurement Uncertainty in PCDD/F and PCB Analysis - 2017 21
analyte level over the entire working range. An estimation of sRw,pool,rel, is obtained from
equation 8:
𝑠𝑅𝑤,𝑟𝑒𝑙 =√
∑ (𝑥𝑖−𝑥)̅̅ ̅2𝑖
𝑚−1
�̅� Eq. 7
𝑠𝑅𝑤,𝑝𝑜𝑜𝑙,𝑟𝑒𝑙 = √((𝑚1−1)∙𝑠𝑅𝑤,𝑟𝑒𝑙1
2 +(𝑚2−1)∙𝑠𝑅𝑤,𝑟𝑒𝑙22 +...
(𝑚1−1)+(𝑚2−1)+...) Eq. 8
mi = number of measurements of QC sample i
sRw,rel i = relative intermediate standard deviation, from m measurements of QC sample i
Examples for evaluation of the intermediate precision of PCDD/Fs and DL-PCBs in matrices
intended to be pooled are given in Annex B.2.
NOTE 3: sRw,pool,rel estimates which cover a wide range of matrices and levels may then lead
to an underestimation in the combined uncertainty for some matrices and to an overestimation
for others. Pooling the precision estimates, however, should not lead to a significant over or
underestimate of the combined uncertainty for a particular matrix [Barwick, Ellison 2000,
/9/].
NOTE 4: Deciding whether or not there is a “significant” difference between the standard
deviations obtained for each sample is ultimately up to the analyst. Statistical tests can be
used, but their relevance depends very much on the number of results available for each
sample. If 10 or more replicates have been made for each sample, the standard deviations can
be compared using F-tests assuming a Gaussian distribution of the data [Barwick, Ellison
2000, /9/].

Guidance Document on Measurement Uncertainty
Working Group for Measurement Uncertainty in PCDD/F and PCB Analysis - 2017 22
6.2 Trueness or Bias Studies
One of the most important steps in the validation of an analytical procedure is the assessment
of trueness and/or bias. Measurements are liable to two components of bias, referred to as
method and laboratory bias. The method bias arises from systematic errors inherent in the
method, whichever laboratory uses it. The method bias can generally only be assessed by
collaborative studies that give rise to an interlaboratory mean. The laboratory bias arises from
additional systematic errors associated with the laboratory and its interpretation or application
of the method. A single laboratory can only estimate the total bias.
Figure 3: Interpretation of the bias [EURACHEM 2014, /21/]. Laboratory and method biases
are shown here acting in the same direction. In reality, this is not always the case, and may
also vary for different congeners or homologue groups.
The isotope dilution technique is applied to quantify concentrations of target analytes. Losses
of these analytes during sample processing, and interferences during measurement should be
reflected in the stable isotope-labelled compound, thus compensating for the bias to a
considerable extent. If the remaining bias is outside the acceptable trueness range, according
to the relevant European legislation, sources should be identified and eliminated.
NOTE: In all equations given in this guidance document for calculation of the bias
contribution to measurement uncertainty, it is assumed that the bias is within the accepted
trueness range.
The uncertainty component of the bias ubias can be estimated from:
- Analyses of certified reference materials (CRMs)
- Results from participation in interlaboratory studies
Guidance Document on Measurement Uncertainty
Working Group for Measurement Uncertainty in PCDD/F and PCB Analysis - 2017 23
- Fortification experiments using fortified blank sample or samples with low levels of
contamination
and consists of several sub-components:
- the bias
- the uncertainty of the determination of the bias
- the uncertainty of the certified/assigned value or the fortifying concentration.
If CRMs are not available, participation in interlaboratory studies, e.g. proficiency tests (PTs)
is a good alternative. In cases where interlaboratory studies are not available for the required
matrix type and/or concentration range, fortification experiments can be carried out by
fortifying suitable blank samples, or samples with low levels of contamination, at the
respective levels of interest.
The estimate of the combined (relative) bias is for
- CRMs: the difference between laboratory’s results xi from analyses of n = 1, 2 …i
CRMs and the respective certified values xcert (divided by xcert),
- PT results: the difference of the laboratory’s results xi from analyses of n = 1, 2 …i PT
samples and their assigned values xa,i (divided by xa,i),
- fortified samples: the difference between the mean �̅�𝑖 from analyses of n = 1, 2 …i
fortified samples and the fortifying concentration xfort (divided by xfort).
𝑏𝑖𝑎𝑠𝐶𝑅𝑀 = (𝑥𝑖 − 𝑥𝑐𝑒𝑟𝑡) or 𝑏𝑖𝑎𝑠𝐶𝑅𝑀,𝑟𝑒𝑙 =(𝑥𝑖−𝑥𝑐𝑒𝑟𝑡)
𝑥𝑐𝑒𝑟𝑡 Eq. 9
𝑏𝑖𝑎𝑠𝑃𝑇 = (𝑥𝑖 − 𝑥𝑎,𝑖) or 𝑏𝑖𝑎𝑠𝑃𝑇,𝑟𝑒𝑙 =(𝑥𝑖−𝑥𝑎,𝑖)
𝑥𝑎,𝑖 Eq. 10
𝑏𝑖𝑎𝑠𝑓𝑜𝑟𝑡 = (�̅�𝑖 − 𝑥𝑓𝑜𝑟𝑡) or 𝑏𝑖𝑎𝑠𝑓𝑜𝑟𝑡,𝑟𝑒𝑙 =(�̅�𝑖−𝑥𝑓𝑜𝑟𝑡)
𝑥𝑓𝑜𝑟𝑡 Eq. 11
It should be noted that biasCRM and biasfort can be based on multiple analyses, while biasPT is
calculated individually for each PT sample (to be consecutively converted to an RMS value).
6.2.1 Estimating ubias using a Representative Matrix CRM
Regular analyses of CRM samples which are representative of the samples to be analysed as
regards matrix type, concentration and physico-chemical properties, can be used to estimate
the trueness.

Guidance Document on Measurement Uncertainty
Working Group for Measurement Uncertainty in PCDD/F and PCB Analysis - 2017 24
According to the Nordtest Report 537 [Nordtest 2012, /3/], adopted by DIN ISO 11352:2013-
03, or ISO 11352:2012-07 [ISO 11352:2012-07, or DIN ISO 11352:2013-03, /4/], the bias
contribution ubias to MU for a single CRM analysed m times may be calculated as:
𝑢𝑏𝑖𝑎𝑠,𝐶𝑅𝑀,𝑟𝑒𝑙 = √(𝑏𝑖𝑎𝑠𝐶𝑅𝑀,𝑟𝑒𝑙)2 + (𝑠𝑏𝑖𝑎𝑠,𝑟𝑒𝑙
√𝑚)
2
+ 𝑢𝐶𝑅𝑀,𝑟𝑒𝑙2 Eq. 12
A single CRM should be analysed at least six times (m ≥ 6). The mean value(s), �̅�𝑖 of these
analyses can be used for the estimation of ubias as shown in the example given in Annex C.1.1.
If several CRMs are used and analysed once, which may be preferable to cover a range of
concentrations and/or matrix properties, different values will be obtained for the bias and sbias
does not need to be included. ubias may then be estimated by
𝑢𝑏𝑖𝑎𝑠,𝐶𝑅𝑀,𝑟𝑒𝑙 = √𝑅𝑀𝑆𝑏𝑖𝑎𝑠,𝐶𝑅𝑀2 + 𝑢𝐶𝑅𝑀,𝑟𝑒𝑙
2
Eq. 13
𝑅𝑀𝑆𝑏𝑖𝑎𝑠,𝐶𝑅𝑀 = √∑(𝑏𝑖𝑎𝑠𝐶𝑅𝑀,𝑟𝑒𝑙,𝑖)2
𝑛 Eq. 14
𝑢𝐶𝑅𝑀,𝑟𝑒𝑙 = 𝑚𝑒𝑎𝑛(𝑢𝐶𝑅𝑀,𝑟𝑒𝑙,𝑖) Eq. 15
n = number of different CRMs analysed (n = 1, 2, … i)
An example is given in Annex C.1.2.
6.2.2 Estimating ubias using Results from Interlaboratory Studies
In principle, results from Interlaboratory Studies are used in the same way as results from
several certified reference materials, to estimate ubias. According to Nordtest [Nordtest 2012,
/3/], the uncertainty associated with the bias is calculated as:
𝑢𝑏𝑖𝑎𝑠,𝑃𝑇,𝑟𝑒𝑙 = √𝑅𝑀𝑆𝑏𝑖𝑎𝑠,𝑃𝑇2 + 𝑢𝐶𝑟𝑒𝑓,𝑟𝑒𝑙
2 Eq. 16
𝑅𝑀𝑆𝑏𝑖𝑎𝑠,𝑃𝑇 = √∑(𝑏𝑖𝑎𝑠𝑃𝑇,𝑟𝑒𝑙,𝑖)2
𝑛 Eq. 17
𝑢𝐶𝑟𝑒𝑓,𝑟𝑒𝑙 = 𝑚𝑒𝑎𝑛(𝑢𝐶𝑟𝑒𝑓,𝑟𝑒𝑙,𝑖) Eq. 18
n = number of samples (n = 1, 2, … i) from interlaboratory studies, or from PTs

Guidance Document on Measurement Uncertainty
Working Group for Measurement Uncertainty in PCDD/F and PCB Analysis - 2017 25
An example for the estimation of ubias using results of proficiency tests is given in Annex C.2.
If biasPT,i is calculated from results of interlaboratory studies or PTs, in which a variety of
analytical methods may have been applied by participants, the uncertainty uCref,i of the
assigned value xa,i could sometimes be relatively large. In these cases, the contribution of
biasPT,i should not be included in the estimation of ubias,PT.
As described in Annex C.4, it is reasonable that uCref,rel,i should not exceed 30% of biasPT,rel,i
for the interlaboratory study i:
|𝑢𝐶𝑟𝑒𝑓,𝑟𝑒𝑙,𝑖
𝑏𝑖𝑎𝑠𝑃𝑇,𝑟𝑒𝑙,𝑖| ≤ 0.3 Eq. 19
However, when a laboratory performs very well in a PT (i.e. reported value very close to
assigned value, and thus providing very small biasPT,rel,i), it might be possible that the criteria
in equation 19 cannot be met while uCref,rel,i is more than acceptable. In this case, the use of
σp,rel is recommended rather than biasPT,rel,i in equation 19 provided that uCref,rel,i ≤ 0.3σp,rel.
σp,rel: fitness-for-purpose-based “standard deviation for proficiency assessment” expressed as
relative standard deviation
6.2.3 Estimating ubias from fortification experiments
Fortification experiments are frequently performed during validation or verification of
analytical procedures. A pre-analysed sample with low or undetectable contamination levels
is fortified with the analytes of interest and measured before and after fortification. From the
difference of the results and the fortified amount the bias can be calculated. If the results are
not biased, the average bias should be around 0%.
The uncertainty ufort of the fortified amount of an analyte may be calculated from the
uncertainty of the concentration of the standard solution 𝑢𝑐𝑜𝑛𝑐 and from the uncertainty of the
added volume 𝑢𝑣𝑜𝑙:
𝑢𝑓𝑜𝑟𝑡 = √𝑢𝑐𝑜𝑛𝑐2 + 𝑢𝑣𝑜𝑙
2 Eq. 20
To calculate the uncertainty contribution of the bias ubias,fort the relative biases from the
fortification experiments have to be included.
𝑅𝑀𝑆𝑏𝑖𝑎𝑠,𝑓𝑜𝑟𝑡 = √∑(𝑏𝑖𝑎𝑠𝑓𝑜𝑟𝑡,𝑟𝑒𝑙,𝑖)2
𝑛 Eq. 21
𝑢𝑏𝑖𝑎𝑠,𝑓𝑜𝑟𝑡,𝑟𝑒𝑙 = √𝑅𝑀𝑆𝑏𝑖𝑎𝑠,𝑓𝑜𝑟𝑡2 + 𝑢𝑓𝑜𝑟𝑡
2 Eq. 22

Guidance Document on Measurement Uncertainty
Working Group for Measurement Uncertainty in PCDD/F and PCB Analysis - 2017 26
n = number of different fortified samples analysed (n = 1, 2, … i)
A full example on the derivation of the uncertainty components of the concentration and the
volume of a standard solution used for fortification of a sample, followed by calculation of the
bias contribution to MU, is given in Annex C.3.

Guidance Document on Measurement Uncertainty
Working Group for Measurement Uncertainty in PCDD/F and PCB Analysis - 2017 27
6.3 Combined and Expanded Uncertainties
The combined standard uncertainty uc is calculated from the combination of the uncertainty
component describing the random variations uRw with the uncertainty component describing
the method and laboratory bias ubias:
𝑢𝑐 = √𝑢𝑅𝑤2 + 𝑢𝑏𝑖𝑎𝑠
2 Eq. 23
uc describes the estimated uncertainty of the measurement result at a level of confidence of
the standard deviation (approx. 68 %). What is often required is a measure of uncertainty that
defines an interval about the measurement result within which the value of the measurand can
be confidently assumed to lie. The measure of uncertainty intended to meet this requirement
is termed expanded uncertainty U. To convert uc to a higher level of confidence it is
multiplied with a coverage factor k.
𝑈 = 𝑘 ∙ 𝑢𝑐 Eq. 24
The choice of k determines the level of confidence. Usually, a coverage factor k = 2 is used,
corresponding to a level of confidence of about 95%.

Guidance Document on Measurement Uncertainty
Working Group for Measurement Uncertainty in PCDD/F and PCB Analysis - 2017 28
6.4 Moving Time Window Scheme
If uRw is to be estimated from internal QC, representative RM, or from fortified samples, at
least 10 independent analyses of the sample (e.g. each in one series of samples) should have
been performed within an adequate time interval, before the values are used. Once
laboratories have collected for example, 20 results [IUPAC 1995, /35/], a moving time
window can be implemented as the computation period. With each new result, the oldest is
removed thus always keeping 20 values in the time window. The frequency of updating U and
the number of QC data included in the calculation are left to the responsibility of the analyst.
NOTE: The moving time window of 20 results is given as an indicative value and shall be
adapted according to the sample throughput of the laboratory.
If ubias is to be estimated from either relevant PTs, representative matrix CRM or from
fortified (low contaminated) samples, at least 6 independent samples (whatever their origin)
should have been analysed within an adequate time interval, before the values are used.
Especially for beginner laboratories, it may be helpful to use a mix of the before mentioned 3
types of samples to achieve the minimum required number of six samples. Once laboratories
have collected the required minimum of 6 results [ISO 11352:2012-07, or DIN ISO
11352:2013-03, /4/], it is proposed to implement a moving time window as computation
period (indicative value of up to 3 years). With each new result, the oldest is removed keeping
always six values within the time window as illustrated in figure 4:
Figure 4: Moving time window as computation period. With each new result, the oldest is
removed keeping always the required number of values within the time window.
For exclusion of potential outliers please refer to chapter 9.3.
time
Time Window
INOUT

Guidance Document on Measurement Uncertainty
Working Group for Measurement Uncertainty in PCDD/F and PCB Analysis - 2017 29
6.5 Contributions from Current Performance
Precision and bias studies provide a valid “snapshot” of current laboratory performance and
their contributions to MU. However, the uncertainty estimate might be even more realistic
and meaningful if contributions arising from daily performance (reflected by e.g. procedural
blanks, LOQs) are integrated into the calculation of the combined uncertainty, while using the
presented top-down approach. Unpredictable “special incidents” might occur in routine
analysis and should also be accounted for, such as: extraction issues, low recoveries,
insufficient clean-up, injections of “dirty” sample extracts, poor resolution during
chromatographic separation and GC-MS sensitivity problems.
6.5.1 Contributions to MU from LOQs and procedural blanks
Contributions of current performance to MU may be calculated by combining uRw and ubias
with the actual limit of quantification (LOQ) of the respective congener, determined using the
procedural blank of the relevant sample batch. The combined uncertainty uc,i(LOQ) of a
congener i is then calculated as:
𝑢𝑐,𝑖(𝐿𝑂𝑄) = √(𝑢𝑅𝑤,𝑖
2 +𝑢𝑏𝑖𝑎𝑠,𝑖2 )∙𝑥𝑖
2+𝐿𝑂𝑄𝑖2
𝑥𝑖 Eq. 25
uc,i(LOQ): Combined uncertainty including contributions of LOQ and procedural blank of
congener i, expressed in relative units or %
uRw,i and ubias,i : for congener i, both expressed here as %
xi: Concentration of congener i expressed in pg/g or ng/kg (or ng/g as appropriate)
LOQi: Limit of quantification (LOQ) of congener i expressed in pg/g or ng/kg (or ng/g as
appropriate)
The expanded uncertainty Ui(LOQ) is then calculated according to equation 24:
𝑈𝑖(𝐿𝑂𝑄) = 𝑘 ∙ 𝑢𝑐,𝑖(𝐿𝑂𝑄) Eq. 26
Ui(LOQ): Expanded uncertainty of a congener i including contributions of LOQ and procedural
blank
Congener-based LOQs are calculated according to the approaches described for PCDD/F and
PCB analysis using isotope dilution mass spectrometry in the “Guidance Document on the
Guidance Document on Measurement Uncertainty
Working Group for Measurement Uncertainty in PCDD/F and PCB Analysis - 2017 30
Estimation of LOD and LOQ for Measurements in the Field of Contaminants in Feed and
Food” (EURL Guidance Document 2016, /40/). One approach is based on the evaluation of
the signal-to-noise ratios measured using the ion chromatograms of the individual congeners
in a particular sample. The second approach is based on a calibration model proposed for low
levels of noise.
In addition, procedural blanks are analysed with every batch of test samples providing
information on method performance, such as effects/interferences from the test method. It is
recommended that procedural blanks are monitored in QC charts and checked for acceptance
of a batch of samples by comparing the measured blank with these charts. If acceptance
criteria are met, calculated LOQs are applied. In case these criteria are not met, the analyst
must check, if the batch of samples has to be repeated or re-analysed.
Alternatively, if calculated LOQs or measured analyte contents of procedural blanks are
higher than analyte contents in respective test samples of the same batch, the values
estimated/measured in the procedural blanks should be applied as LOQs for these test samples
(taking into account sample intake). If the estimated/measured values of procedural blanks are
lower than the values of test samples, the values of the test samples are used.
An example for the estimation contributions of LOQs and procedural blanks to MU is given
in Annex D.
Guidance Document on Measurement Uncertainty
Working Group for Measurement Uncertainty in PCDD/F and PCB Analysis - 2017 31
7. The Theoretical or Bottom-Up Approach
The theoretical or “bottom-up” approach presupposes a mathematical model of the
measurement process, estimating individual contributions of all relevant sources of
uncertainty and combining them.
When a “bottom-up approach” is used, the Guide to the Expression of Uncertainty in
Measurement (GUM) [GUM 2008, /1/] provides valuable insight for the laboratory. The main
principles of the GUM are that:
- uncertainty evaluation is comprehensive, accounting for all relevant sources of
measurement error,
- uncertainties arising from random and systematic effects are treated alike, i.e. are
expressed and combined as variances of associated probability distributions,
- statistical evaluation of measurements (Type A) and alternative techniques, based on
other data / information (Type B), are recognised and utilised as equally valid tools,
- uncertainties of final results are expressed as standard deviations (standard
uncertainty) or by multiples of standard deviations (expanded uncertainty) using a
specified numerical or coverage factor.
In PCDD/F and PCB analysis, additional requirements apply:
- in principle, the bottom-up approach applies to each PCDD/F and PCB congener,
individually, meaning that the combined uncertainty must be assessed for each
congener separately
- next, the combined uncertainty (in TEQ) is calculated from individual congener
uncertainties (see Annex E)
NOTE: However, when it comes to evaluating the uncertainty of the results in quantitative
analysis – especially in conjunction with isotope dilution based analyses – the GUM is often
criticised as being less than ideal. This may be due to the fact that the GUM approach
includes a tedious and error-prone series of calculations, while it almost exclusively presents a
single approach for uncertainty evaluation.
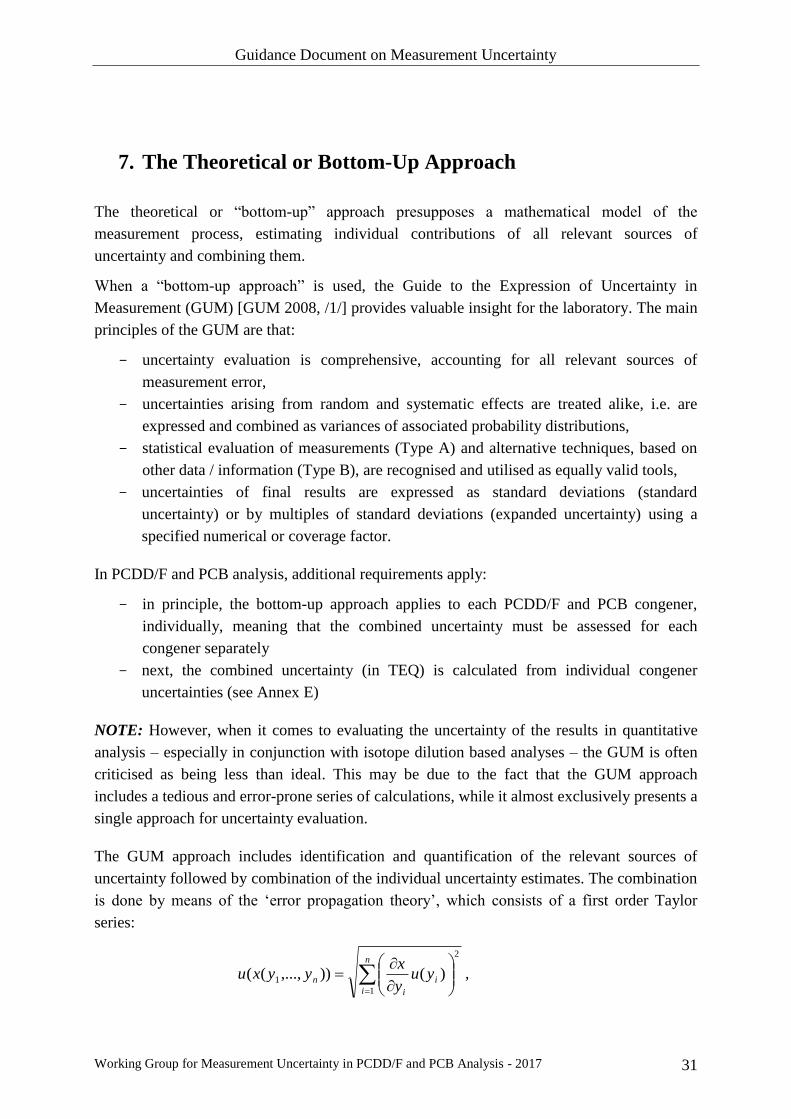
The GUM approach includes identification and quantification of the relevant sources of
uncertainty followed by combination of the individual uncertainty estimates. The combination
is done by means of the ‘error propagation theory’, which consists of a first order Taylor
series:
,
2
1
1 )()),...,((
n
i
i
i
n yuy
xyyxu

Guidance Document on Measurement Uncertainty
Working Group for Measurement Uncertainty in PCDD/F and PCB Analysis - 2017 32
where x is the measurement result which depends on parameters yi, each yi being a certain
uncertainty source; u(yi) is the standard uncertainty related to this uncertainty source and
x/yi the partial derivative of x with respect to yi. Note that this equation relates to
independent variables (covariance term omitted).
The GUM method was adapted for quantitative chemical measurement in the Eurachem
Guide [EURACHEM/CITAC 2012 /12/]. For the theoretical or bottom-up approach, the
Eurachem Guide suggests the identification and recording of a list of sources of uncertainty
relevant to the analytical method. It seems useful to structure this process, both to ensure
comprehensive coverage and to avoid over-counting. In practice, it might be helpful to
construct a cause and effect diagram (Ishikawa diagram). This is a tool that consists of a
hierarchical structure of causes which culminate in a single effect. The effect in the context of
measurement uncertainty is the result obtained.
In addition to the bottom-up approach, the Eurachem Guide describes also the possibility of
estimating measurement uncertainty based on method performance data, also in combination
with contributions of individual sources (see chapter 8).
Practical Recommendations
1. It goes without saying that calculations should be updated on a regular basis as individual
parameter values may change over time, or uncertainties may be refined with increasing
experience of the analyst. Changes to either parameters or uncertainties will then be
reflected both in the overall result, and in the combined standard uncertainty.
2. The mathematical model should be revised when the observed data demonstrate that the
model is incomplete.
Conclusions of the working group
A full bottom-up approach is not recommended for PCDD/Fs and PCBs mainly due to the
complexity of the whole analytical process and the difficulty in quantifying separately, all the
sources of uncertainties [Horwitz 2003, /37/].

Guidance Document on Measurement Uncertainty
Working Group for Measurement Uncertainty in PCDD/F and PCB Analysis - 2017 33
8. The Semi-empirical Approach
8.1 Introduction
The proposed methodology here is based on the approach taken in the ISO “Guide to the
Expression of Uncertainty in Measurement” applied to analytical chemistry by
EURACHEM/CITAC [GUM 2008, /1/; EURACHEM/CITAC 2012, /12/]).
The semi-empirical approach derives from a combination of the top-down and the bottom-up
procedures, providing an uncertainty estimation based on the results obtained from validation
studies, expressed in terms of precision and bias, and additional uncertainty sources not
covered by validation data, such as calibration factors and reference standards.
This model may seem quite laborious but provides a clear understanding of the analytical
steps which contribute significantly to the uncertainty budget and which therefore may be
identified as critical points to keep under control and thus reduce the measurement
uncertainty. In fact, the largest contributions to the combined uncertainty can be identified
during a preliminary study and a reliable estimate of uncertainty can be made by considering
only the main sources.
The uncertainty of measurement comprises, in general, many components. Some of these
components may be evaluated from the statistical distribution of the results of series of
measurements and can be characterized by experimental standard deviations (type A
evaluation). The other components, which also can be characterized by standard deviations,
are evaluated from assumed probability distributions based on experience or other
information (type B evaluation). It is important not to “double-count” uncertainty
components. If a component of uncertainty arising from a particular effect is obtained from a
type B evaluation, it should be included as an independent component of uncertainty in the
calculation of the combined standard uncertainty of the measurement result only to the extent
that the effect does not contribute to the observed variability of the observations. The first step
is to define the measurement procedure identifying each source of uncertainty.
The next stage of the process is the planning of experiments, which will provide the
information required to obtain an estimate of the combined uncertainty. In practice, method
validation studies produce data on overall performance and on individual factors which
influence the estimation of uncertainty associated with the results based on precision and
trueness data.
The starting point is the analysis of a series of observations obtained under within-laboratory
reproducibility conditions.
Among the potential sources of uncertainty, it should be decided if a given parameter is
sufficiently covered by a given set of data or planned experiments. The parameters which are
Guidance Document on Measurement Uncertainty
Working Group for Measurement Uncertainty in PCDD/F and PCB Analysis - 2017 34
not accounted for become the subject of further study, either through planned experiments or
by locating appropriate standing data, such as calibration certificates or manufacturing
specifications. The resulting contributions, obtained from a mixture of validation studies,
standing data and any additional studies on single effects can be then combined according to
ISO guidelines.
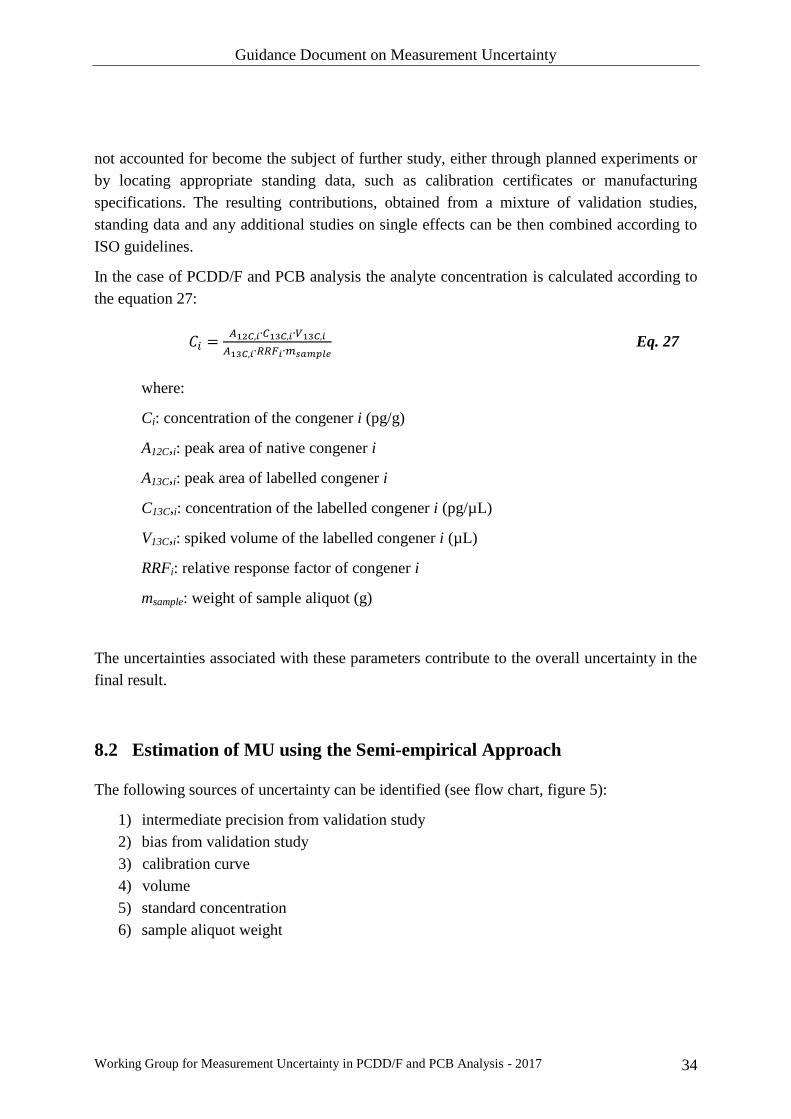
In the case of PCDD/F and PCB analysis the analyte concentration is calculated according to
the equation 27:
𝐶𝑖 =𝐴12𝐶,𝑖∙𝐶13𝐶,𝑖∙𝑉13𝐶,𝑖
𝐴13𝐶,𝑖∙𝑅𝑅𝐹𝑖∙𝑚𝑠𝑎𝑚𝑝𝑙𝑒 Eq. 27
where:
Ci: concentration of the congener i (pg/g)
A12C,i: peak area of native congener i
A13C,i: peak area of labelled congener i
C13C,i: concentration of the labelled congener i (pg/µL)
V13C,i: spiked volume of the labelled congener i (µL)
RRFi: relative response factor of congener i
msample: weight of sample aliquot (g)
The uncertainties associated with these parameters contribute to the overall uncertainty in the
final result.
8.2 Estimation of MU using the Semi-empirical Approach
The following sources of uncertainty can be identified (see flow chart, figure 5):
1) intermediate precision from validation study
2) bias from validation study
3) calibration curve
4) volume
5) standard concentration
6) sample aliquot weight

Guidance Document on Measurement Uncertainty
Working Group for Measurement Uncertainty in PCDD/F and PCB Analysis - 2017 35
Figure 5: Flow chart for estimation of measurement uncertainty using a semi-empirical
approach.
The different contributions to the combined uncertainty can be usefully represented by a
diagram showing the magnitude of single components. Only parameters with uncertainties
greater than one third of the magnitude of the largest contribution to the uncertainty budget
need to be considered as significant sources of uncertainty for the method. Indeed, the basic
principle of uncertainty propagation is underlining the influence of the quantities with the
highest values. Generally, type B parameters have a minor influence over the uncertainty
budget, and their relative contribution may be neglected if this condition is satisfied.
NOTE: Even though isotope dilution analysis should largely compensate for the bias, its
uncertainty component can be estimated from recovery experiments using fortified samples
with low or undetectable contamination levels, performed during validation of the analytical
procedure. In this way, the uncertainty associated with losses of analytes during the extraction
and clean-up steps are also considered.
8.3 Precision Contribution
8.3.1 Intermediate precision uncertainty
The precision study is a useful tool to estimate the random error. Because an estimate of
intermediate precision is available from the validation study for the procedure as a whole,
there is no need to consider all the precision contributions individually. They are therefore
grouped into one contribution.
Guidance Document on Measurement Uncertainty
Working Group for Measurement Uncertainty in PCDD/F and PCB Analysis - 2017 36
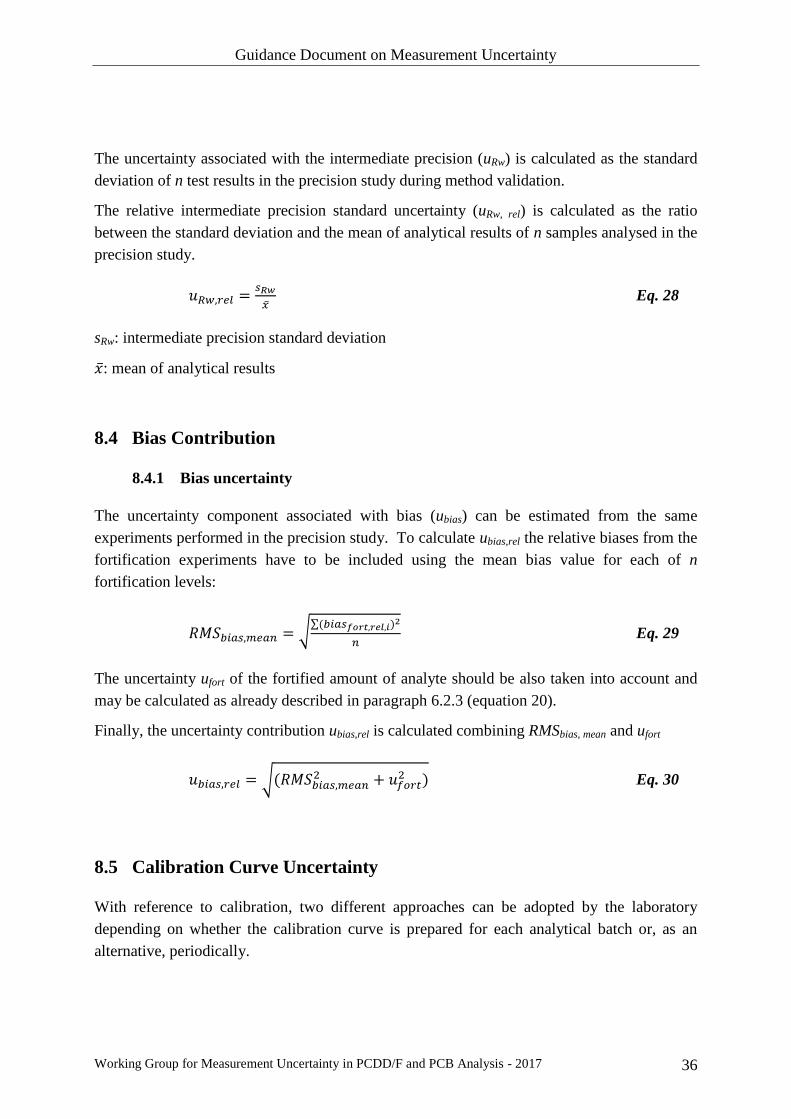
The uncertainty associated with the intermediate precision (uRw) is calculated as the standard
deviation of n test results in the precision study during method validation.
The relative intermediate precision standard uncertainty (uRw, rel) is calculated as the ratio
between the standard deviation and the mean of analytical results of n samples analysed in the
precision study.
𝑢𝑅𝑤,𝑟𝑒𝑙 =𝑠𝑅𝑤
�̅� Eq. 28
sRw: intermediate precision standard deviation
�̅�: mean of analytical results
8.4 Bias Contribution
8.4.1 Bias uncertainty
The uncertainty component associated with bias (ubias) can be estimated from the same
experiments performed in the precision study. To calculate ubias,rel the relative biases from the
fortification experiments have to be included using the mean bias value for each of n
fortification levels:
𝑅𝑀𝑆𝑏𝑖𝑎𝑠,𝑚𝑒𝑎𝑛 = √∑(𝑏𝑖𝑎𝑠𝑓𝑜𝑟𝑡,𝑟𝑒𝑙,𝑖)2
𝑛 Eq. 29
The uncertainty ufort of the fortified amount of analyte should be also taken into account and
may be calculated as already described in paragraph 6.2.3 (equation 20).
Finally, the uncertainty contribution ubias,rel is calculated combining RMSbias, mean and ufort
𝑢𝑏𝑖𝑎𝑠,𝑟𝑒𝑙 = √(𝑅𝑀𝑆𝑏𝑖𝑎𝑠,𝑚𝑒𝑎𝑛2 + 𝑢𝑓𝑜𝑟𝑡
2 ) Eq. 30
8.5 Calibration Curve Uncertainty
With reference to calibration, two different approaches can be adopted by the laboratory
depending on whether the calibration curve is prepared for each analytical batch or, as an
alternative, periodically.

Guidance Document on Measurement Uncertainty
Working Group for Measurement Uncertainty in PCDD/F and PCB Analysis - 2017 37
8.5.1 Full calibration (Option 1)
If a full calibration is performed for each analytical batch, the standard deviation of the mean
Relative Response Factor (RRF) of a congener represents the uncertainty contribution related
to calibration. The RRF value is usually calculated as the mean value obtained from the
analysis of appropriately prepared standard solutions that contain known amounts of the
analyte and the internal standard.
At least five calibration levels should be used to construct the average RRF model. If the
relative standard deviation (RSD) of variation in the factors is ≤ 20%, the linear model is
generally representative over the range of calibration standards [US EPA 2014, /25/].
The calibration curve linearity uncertainty component (ucal) relies on the variation of relative
response factors (RRFs) among the points of the calibration curve. This uncertainty
component is calculated as the standard deviation of RRFi divided by the square root of the
number (n) of calibration points.
𝑢𝑐𝑎𝑙,𝑟𝑒𝑙 =𝑠𝑅𝑅𝐹,𝑟𝑒𝑙
√𝑛 Eq.31
NOTE: A worst-case scenario is to consider the maximum acceptable variation of RRFi
established by reference methods (e.g. 20% coefficient of variation according to EN 16215
[EN 16215:2012-07, /39/] and US EPA Method 8000D [US EPA 2014, /25/]), thus
calculating the maximum permitted uncertainty associated with the calibration curve. In
practice, the actual RRF standard deviation reflects the daily or session-based performance
and, for this reason, its use is recommended.
8.5.2 Calibration point check (Option 2)
When the calibration curve is not carried out daily, a calibration verification procedure should
be adopted. This procedure represents an instrumental bias check using an independently
prepared reference solution. A term representing the uncertainty due to this drift also needs to
be included in the uncertainty budget. The calibration curve drift standard uncertainty (ud) can
be calculated using the actual value measured for each congener when the calibration
verification procedure is carried out [Barwick et al. 1999, /39/]. The maximum permitted
deviation is 20% [US EPA 2014, /25/]. In practice, 15% or lower should be achievable. If
there is no evidence of lower probability towards the extremes of the drift values range, this
can be treated as a rectangular distribution:
𝑢𝑑,𝑟𝑒𝑙 =𝑑𝑅𝑅𝐹,𝑟𝑒𝑙
√3 Eq. 32

Guidance Document on Measurement Uncertainty
Working Group for Measurement Uncertainty in PCDD/F and PCB Analysis - 2017 38
If the relative response factor differs by more than the acceptance limit from the mean relative
response factor at calibration, the calibration curve needs to be re-run.
The uncertainty component ud,rel is combined with the ucal,rel related to the mean RRF obtained
from the last full calibration (equation 31).
NOTE: Alternatively, the RRF value of the calibration point checks can be used for
calculations. In this case, the uncertainty contribution for this approach needs to be included.
8.6 Additional Contributions
8.6.1 Volume uncertainty
The volume uncertainty (uv) is related to the glassware (e.g. volumetric flasks, cylinders,
pipettes, syringes) and micropipettes used for the preparation and addition of standard
solutions.
The volume standard uncertainty could be taken from the calibration certificate of glassware,
syringes and micropipettes or considering a maximum deviation accepted by the laboratory
and assuming a rectangular distribution.
If limits of ± a are given without a confidence level and there is reason to expect that extreme
values are likely, it is normally appropriate to assume a rectangular distribution, with a
standard deviation of:
𝑢𝑣 =𝑎
√3 Eq. 33
The volume relative standard uncertainty (uv,rel) is obtained dividing uv by the volume amount.
Then all contributions are combined to give the standard uncertainty of the volume.
NOTE: In cases when extreme values are unlikely on the basis of prior laboratory experience,
it is appropriate to assume a triangular distribution, with a standard deviation of:
𝑢𝑣 =𝑎
√6 Eq. 34
Guidance Document on Measurement Uncertainty
Working Group for Measurement Uncertainty in PCDD/F and PCB Analysis - 2017 39
8.6.2 Standard solution concentration uncertainty
The standard solution concentration uncertainty (ust) is related to the concentration of the
labelled compound fortification (internal standard) mixture and the unlabelled calibration
standards.
The uncertainty of standard solution concentration can be obtained from the supplier.
Concentration relative standard uncertainty (ust,rel) could be taken from the supplier’s
certificate of analysis. If the uncertainty provided by the supplier is the expanded uncertainty
(calculated with a coverage factor) then the standard uncertainty is calculated dividing the
expanded uncertainty by the coverage factor.
NOTE: The uncertainty associated with the concentration of the labelled compounds does not
have to be taken into account if the same standard solution is used to fortify the samples and
to prepare the calibration standard solutions.
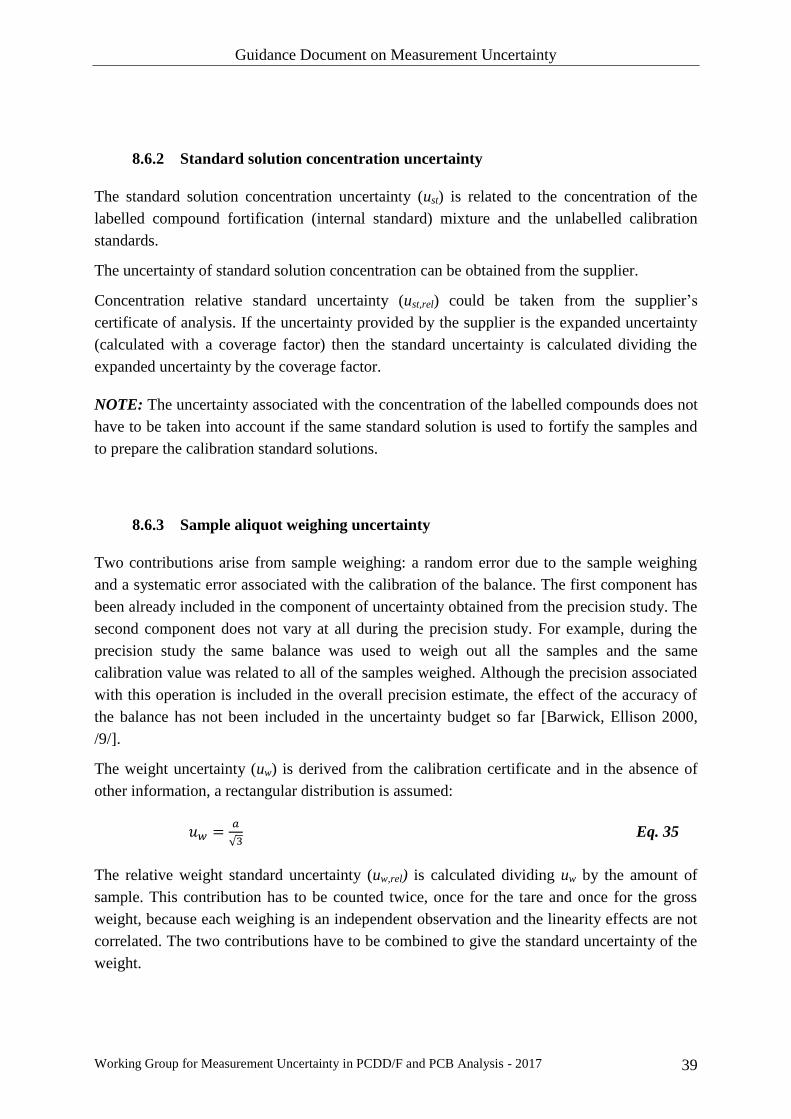
8.6.3 Sample aliquot weighing uncertainty
Two contributions arise from sample weighing: a random error due to the sample weighing
and a systematic error associated with the calibration of the balance. The first component has
been already included in the component of uncertainty obtained from the precision study. The
second component does not vary at all during the precision study. For example, during the
precision study the same balance was used to weigh out all the samples and the same
calibration value was related to all of the samples weighed. Although the precision associated
with this operation is included in the overall precision estimate, the effect of the accuracy of
the balance has not been included in the uncertainty budget so far [Barwick, Ellison 2000,
/9/].
The weight uncertainty (uw) is derived from the calibration certificate and in the absence of
other information, a rectangular distribution is assumed:
𝑢𝑤 =𝑎
√3 Eq. 35
The relative weight standard uncertainty (uw,rel) is calculated dividing uw by the amount of
sample. This contribution has to be counted twice, once for the tare and once for the gross
weight, because each weighing is an independent observation and the linearity effects are not
correlated. The two contributions have to be combined to give the standard uncertainty of the
weight.
Guidance Document on Measurement Uncertainty
Working Group for Measurement Uncertainty in PCDD/F and PCB Analysis - 2017 40
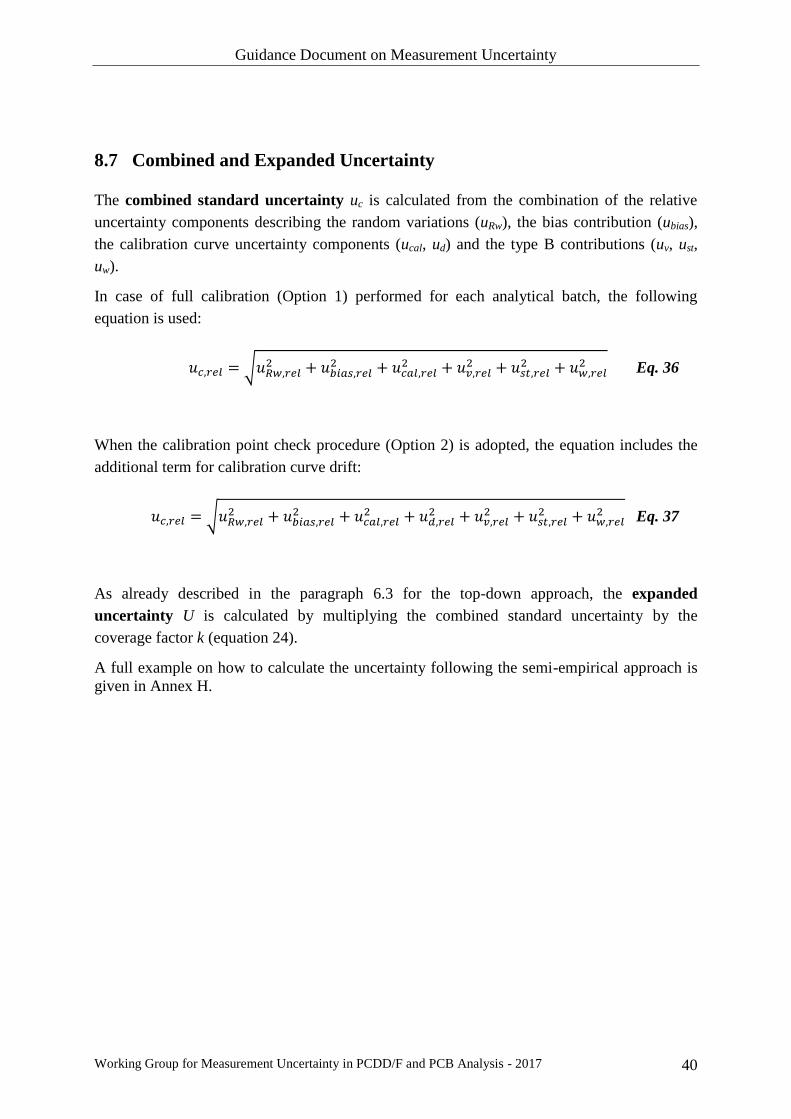
8.7 Combined and Expanded Uncertainty
The combined standard uncertainty uc is calculated from the combination of the relative
uncertainty components describing the random variations (uRw), the bias contribution (ubias),
the calibration curve uncertainty components (ucal, ud) and the type B contributions (uv, ust,
uw).
In case of full calibration (Option 1) performed for each analytical batch, the following
equation is used:
𝑢𝑐,𝑟𝑒𝑙 = √𝑢𝑅𝑤,𝑟𝑒𝑙2 + 𝑢𝑏𝑖𝑎𝑠,𝑟𝑒𝑙
2 + 𝑢𝑐𝑎𝑙,𝑟𝑒𝑙2 + 𝑢𝑣,𝑟𝑒𝑙
2 + 𝑢𝑠𝑡,𝑟𝑒𝑙2 + 𝑢𝑤,𝑟𝑒𝑙
2 Eq. 36
When the calibration point check procedure (Option 2) is adopted, the equation includes the
additional term for calibration curve drift:
𝑢𝑐,𝑟𝑒𝑙 = √𝑢𝑅𝑤,𝑟𝑒𝑙2 + 𝑢𝑏𝑖𝑎𝑠,𝑟𝑒𝑙
2 + 𝑢𝑐𝑎𝑙,𝑟𝑒𝑙2 + 𝑢𝑑,𝑟𝑒𝑙
2 + 𝑢𝑣,𝑟𝑒𝑙2 + 𝑢𝑠𝑡,𝑟𝑒𝑙
2 + 𝑢𝑤,𝑟𝑒𝑙2 Eq. 37
As already described in the paragraph 6.3 for the top-down approach, the expanded
uncertainty U is calculated by multiplying the combined standard uncertainty by the
coverage factor k (equation 24).
A full example on how to calculate the uncertainty following the semi-empirical approach is
given in Annex H.

Guidance Document on Measurement Uncertainty
Working Group for Measurement Uncertainty in PCDD/F and PCB Analysis - 2017 41
9. Practical Implementation
9.1 Combined Uncertainty in TEQ from Individual Congeners
In this section, a strategy is presented as to how a TEQ-based MU value can be derived and
propagated from individual congeners’ uncertainties.
A congener-based combined uncertainty uc is calculated as described in chapter 6.3. The
TEQ-based MU value calculated from individual congener uncertainties is dependent on the
congener level profile because the combined standard uncertainty associated with each
congener uc is dependent on the level of concentration in most cases (see precision studies in
annex B). When uc is calculated individually for each congener, different rules of propagation
can be applied to calculate the combined TEQ-based uc.
In annex F, four possible approaches are treated to compare the TEQ-based standard
uncertainty uc obtained directly from empirical TEQ-data collected within the EU-RL/NRL
network, and the TEQ-based standard uncertainty calculated from each congener uc, using
RSS, SUM, average and median approaches as propagation rules of uncertainty. None of the
approaches gave a perfect fit between empirical TEQ-based uc values and those recalculated
from the congener-based uc data. However, the RSS approach provided the best agreement of
empirical with calculated data and is therefore recommended by the authors.
The combined uncertainty (RSS approach) expressed in TEQ may be calculated as:
𝑢𝑐(𝑇𝐸𝑄 = 𝑇𝐸𝐹1 ∙ 𝑢𝑐1 + ⋯ + 𝑇𝐸𝐹29 ∙ 𝑢𝑐29) = √∑ (𝑇𝐸𝐹𝑖 ∙ 𝑢𝑐𝑖)229𝑖=1 Eq. 38
9.2 Laboratories new to Isotope Dilution Analysis
For laboratories new to the field and lacking historical QC data, preliminary MU values may
be estimated from precision and trueness data acquired during initial method validation. As a
start in routine analysis, the use of available relevant PT samples is recommended. If such
materials are not available, fortification studies should be performed until sufficient data have
been gathered.
For estimating the contribution of the precision to the measurement uncertainty,
representative quality control samples or test samples from proficiency tests can be analysed
under intermediate precision conditions (at least 10 complete analyses of a representative
sample in different batches reflecting routine conditions). Further evaluation of the precision
study is given in chapter 6.1.

Guidance Document on Measurement Uncertainty
Working Group for Measurement Uncertainty in PCDD/F and PCB Analysis - 2017 42
The bias contribution can be estimated by analysing representative certified reference
materials, reference materials, and test materials from relevant and valid PT studies or
fortified samples. Therefore at least 6 samples are analysed. The evaluation of the data is
performed according to chapter 6.2.
Another option is to use the semi-empirical approach as a starting point (see chapter 8). Once
sufficient data from quality control programmes has been acquired by the laboratory, then
measurement uncertainty according to the top-down approach can be calculated and compared
to the value obtained using the semi-empirical approach.
9.3 Exclusion of Data
Values which are substantially biased compared to other results should attract our attention.
They may be outliers and often are a product of systematic error in analysis. However, such
data can also describe some unusual but real events in the laboratory environment. Exclusion
of a potential outlier thus demands a very careful and reasoned approach. It is necessary to
decide, whether and which potential outlier will be removed from the data, since they could
highly bias the final results of MU evaluation.
9.4 Factors affecting a Timeline-based Evaluation of MU
Following the scheme proposed above, measurement uncertainty is updated on a regular
basis. Several factors in the time scale, however, might impact MU, to varying degrees. We
identify these factors as being of major and of minor influence.
Major factors
- Method changes (important modifications)
- Standard solutions (newly obtained, freshly prepared, or too long in use)
- New instruments obtained: from sector to sector instrument replacement to a lesser
extent, but changing from HRMS to MS/MS, or major repairs, might have a
significant impact
Minor factors
- New staff (i.e. performing the analysis for the first time, even if correctly trained)
- New kinds of matrices (e.g. feed or baby food)
- Recoveries of internal standards
- Linearity of the instrument, RRF values
- LOQs
- Other factors

Guidance Document on Measurement Uncertainty
Working Group for Measurement Uncertainty in PCDD/F and PCB Analysis - 2017 43
As an intrinsic part of an on-going statistical process, such factors should be identified, if
necessary. Their causes should carefully be evaluated, and affected results may eventually be
eliminated.
The described top-down approach based on ISO 11352:2012-07, or DIN ISO 11352:2013-03
[ISO 11352:2012-07, or DIN ISO 11352:2013-03, /4/], is used for estimating the
measurement uncertainty from a set of results of control samples gathered under “in-control”
conditions using a specific analytical method. The resulting estimated measurement
uncertainty can be applied to all results of samples analysed under the same intermediate
precision conditions, independent e.g. of sample matrix and staff, as long as a quality control
programme is successfully performed.
In practice, a re-evaluation of the estimation of the measurement uncertainty is necessary if
any part of the whole analytical procedure undergoes major changes (see major factors, as
above), or after a certain period of time (e.g. one year).
9.5 MU Estimation when ad hoc amendments to methods are used (for
Matrices not covered by the Matrix Groups)
Ad-hoc methods are methods established to carry out analysis of certain matrices within short
notice. Such methods are typically based on established methods within the laboratory, but
parts of the established method are modified substantially which do not generally justify or
allow, due to the limited time, full validation studies [EURACHEM/CITAC 2012, /12/]. This
refers to matrices requiring specific methods of analysis, which are analysed less frequently,
or even only very rarely, according to official control plans, or only in cases of emergency.
Since limited resources will be available to establish the relevant uncertainty contributions, it
is necessary to rely largely on the known performance of established methods or parts of
methods for uncertainty estimation.
As a minimum, it is essential that an indication of bias and precision be available for the ad-
hoc method. A minimum precision experiment consists of 6 full analyses of the sample in
question. The precision should be compared with that for the related methods; the standard
deviation for the ad-hoc method should be comparable.
The bias will ideally be measured against a CRM, but will in practice more commonly be
assessed from fortification experiments using the standard addition technique. As a minimum,
duplicate analysis of the sample in question, or the fortified sample is recommended. The bias
from resulting application of the ad-hoc method should be comparable to that observed from
related methods. Alternatively, the semi-empirical approach may also be used in this context.

Guidance Document on Measurement Uncertainty
Working Group for Measurement Uncertainty in PCDD/F and PCB Analysis - 2017 44
NOTE: If it can be shown, that the ad-hoc method meets all criteria established in respective
EU regulations, the target measurement uncertainty calculated according to chapter 4.3 may
be applied as the worst case scenario.
9.6 Rounding of Results and Significant Digits
Rounding refers to the replacement of the result by the nearest multiple of the rounding
interval. This procedure always implies an additional error, the rounding error (round-off
error) or rounding bias being the difference between the approximation of a number (by
rounding) and its exact value. Too few significant digits cause information to be lost and
unnecessarily increase the rounding error, while too many significant digits reflect an
accuracy that analytical methods may not be capable of providing. The relative error (%-
error) caused by rounding may be considerable, depending on the number of significant digits
the result is rounded to.
Rounding of analytical result, and of the measurement uncertainty, shall be done only after all
calculations have been completed. The numerical values of the result and its uncertainty
should then not be given with an excessive number of digits. According to the Eurachem
Guide [EURACHEM/CITAC 2012, /12/] it is seldom necessary to give more than two
significant digits for expanded uncertainty U or standard uncertainty u. The corresponding
results should then be rounded to be consistent with the uncertainty [EURACHEM/CITAC
2007, /26/].

Guidance Document on Measurement Uncertainty
Working Group for Measurement Uncertainty in PCDD/F and PCB Analysis - 2017 45
10. Inter-laboratory Studies
10.1 Information from PT Providers for participating Laboratories
In their reports to participating laboratories, PT providers are requested to include the
following data:
- the accreditation status of the provider with respect to performing PTs or inter-
laboratory studies, e.g. according to the requirements of ISO/IEC 17043 [ISO/IEC
17043:2010-02, /5/]
- the uncertainty of the assigned value, with level of confidence
- the PT target standard deviation values that were used for the evaluated parameters
It is strongly encouraged that providers of inter-laboratory studies and PTs assess the
uncertainties associated with the assigned values according to ISO 13528 [ISO 13528:2015-
08, /11/]. Results from these PTs used by laboratories for performance and MU assessment
may otherwise lead to inadequate interpretation and results.
Laboratories are additionally encouraged to participate in particular, in those inter-laboratory
schemes which are accredited according to EN ISO/IEC 17043 [ISO/IEC 17043:2010-02, /5/]
and which provide the above data.
10.2 Evaluation of Participant’s Performance and reported MU:
z - and zeta-Scores
How realistic is an uncertainty estimate? This question can be answered by examining the
results from PTs. Within PT schemes, participating laboratories’ performance is usually
assessed by conversion of participants’ results (xi) into z-scores, enabling the participant to
immediately appreciate their significance:
𝑧 =𝑥−𝑥𝑎
𝜎𝑝 Eq. 39
σp is the fitness-for-purpose-based “standard deviation for proficiency assessment”; the term
(x – xa) represents the individual laboratory’s error in measurement.
Most participants will operate with a biased mean, and with a run-to-run standard deviation
differing from σp. Laboratories performing in accordance with the PT scheme’s requirements
will usually receive z-scores in the range ± 2.
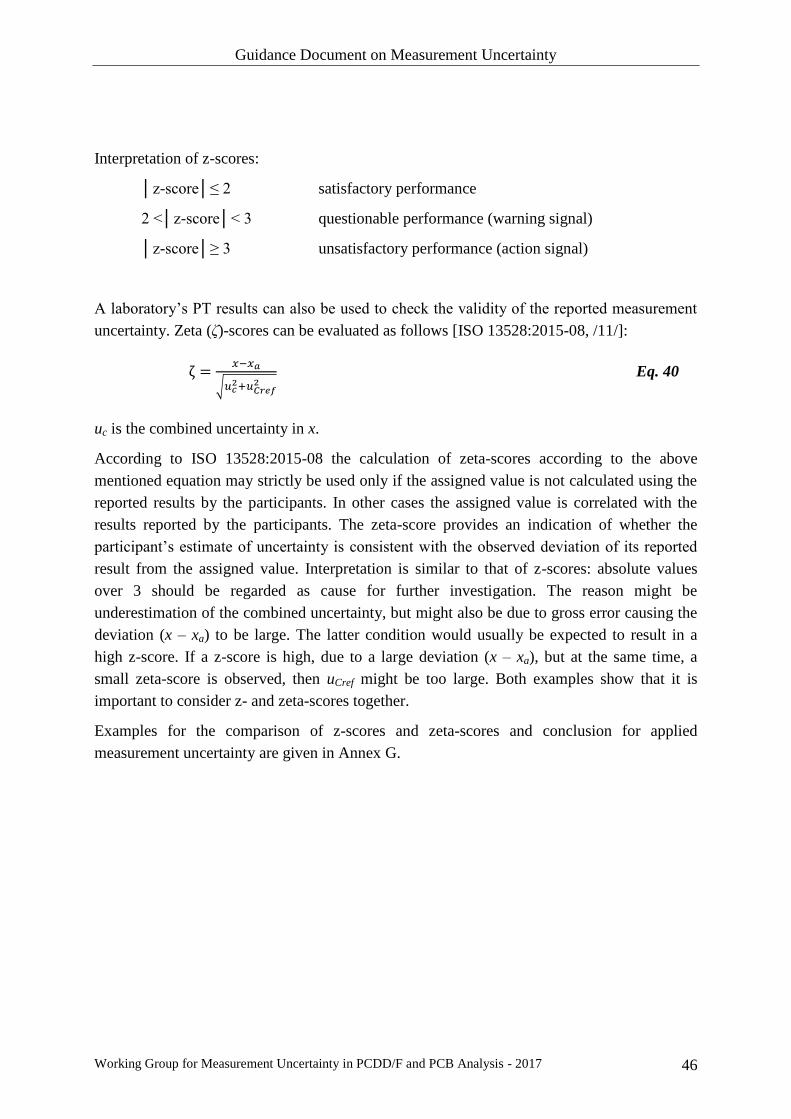
Guidance Document on Measurement Uncertainty
Working Group for Measurement Uncertainty in PCDD/F and PCB Analysis - 2017 46
Interpretation of z-scores:
│z-score│≤ 2 satisfactory performance
2 <│z-score│< 3 questionable performance (warning signal)
│z-score│≥ 3 unsatisfactory performance (action signal)
A laboratory’s PT results can also be used to check the validity of the reported measurement
uncertainty. Zeta (ζ)-scores can be evaluated as follows [ISO 13528:2015-08, /11/]:
ζ =𝑥−𝑥𝑎
√𝑢𝑐2+𝑢𝐶𝑟𝑒𝑓
2 Eq. 40
uc is the combined uncertainty in x.
According to ISO 13528:2015-08 the calculation of zeta-scores according to the above
mentioned equation may strictly be used only if the assigned value is not calculated using the
reported results by the participants. In other cases the assigned value is correlated with the
results reported by the participants. The zeta-score provides an indication of whether the
participant’s estimate of uncertainty is consistent with the observed deviation of its reported
result from the assigned value. Interpretation is similar to that of z-scores: absolute values
over 3 should be regarded as cause for further investigation. The reason might be
underestimation of the combined uncertainty, but might also be due to gross error causing the
deviation (x – xa) to be large. The latter condition would usually be expected to result in a
high z-score. If a z-score is high, due to a large deviation (x – xa), but at the same time, a
small zeta-score is observed, then uCref might be too large. Both examples show that it is
important to consider z- and zeta-scores together.
Examples for the comparison of z-scores and zeta-scores and conclusion for applied
measurement uncertainty are given in Annex G.

Guidance Document on Measurement Uncertainty
Working Group for Measurement Uncertainty in PCDD/F and PCB Analysis - 2017 47
11. Symbols, Terms and Definitions
Symbol,
Term Definition
a Semi-range of an interval ± a
Aliquot A known amount of a homogeneous material, assumed to be taken with
negligible sampling error.
[IUPAC 1997, /20/]
Assigned
value (xa)
An estimate of the value of the measurand that is used for the purpose of
calculating scores.
[IUPAC 2014, /15/]
Value attributed to a particular property of a proficiency test item.
[ISO/IEC 17043:2010-02, /5/; ISO 13528:2015-08, /11/]
NOTE: Within the scope of this document, an assigned value may also be an
estimate of the value of the measurand assigned to a well characterized QC
sample from the laboratory’s own analyses.
Bias The difference between the calculated mean of the measurement results and
an accepted reference value.
[ISO 5725-1:1993, /17/]
biasmax Maximum tolerable bias
biasrel Relative bias: The ratio of the absolute bias and the accepted reference value,
expressed e.g. as a percentage.
Blank value A reading or result originating from the matrix, reagents and any residual
bias in the measurement device or process, which contributes to the value
obtained for the quantity in the analytical procedure.
[IUPAC 1997, /20/]
Consensus
value
Value derived from a collection of results in an inter-laboratory comparison
[ISO 13528:2015-08, /11/]
(Quality)
Control
Material used for the purpose of internal quality control and subjected to the
same or part of the same procedures as that used for test materials

Guidance Document on Measurement Uncertainty
Working Group for Measurement Uncertainty in PCDD/F and PCB Analysis - 2017 48
Symbol,
Term Definition
material [IUPAC 1995, /35/]
CRM Certified Reference Material: Reference material characterized by a
metrologically valid procedure for one or more specified properties,
accompanied by a certificate that provides the value of the specified
property, its associated expanded uncertainty, and a statement of
metrological traceability.
[ISO Guide 30:2008, /6/; ISO Guide 35:2006 /7/; ISO 13528:2015-08, /11/]
dRRF,rel Relative deviation of relative response factor (RRF) of calibration check
from RRF value of applied calibration
Duplicate
analysis
Separate analysis of the analytes of interest using a second representative
aliquot of the same homogenized sample.
Inter-
laboratory
comparison
Organization, performance and evaluation of measurements or tests on the
same or similar items by two or more laboratories in accordance with
predetermined conditions.
[ISO/IEC 17043:2010-02, /5/; ISO 13528:2015-08, /11/]
Isotope
Dilution
A technique for mass spectrometric quantitation of an analyte of interest in
which a stable isotope-labelled compound is used as both a surrogate and an
internal standard for a non-labelled compound. The stable isotope-labelled
compound is added to the sample that then undergoes preparation and
analysis. Losses of the analyte during preparation and interferences during
analysis should be mirrored in the isotope-labelled compound, and thus
should not have an adverse effect on quantitation.
[EPA 2015, /22/]
A technique of mass spectrometry based analysis in which each analyte of
interest is quantified using a stable isotope-labelled internal (extraction)
standard. For the scope of this document – the analysis of polychlorinated
dioxins, furans and biphenyls – such standards should be fully carbon-13
labelled compounds.
In this context each standard should be the exact analogue of its
corresponding native analyte, i.e. having the same structure (isomer) and
differing only in the substitution of all native 12
C atoms with 13
C. E.g. the
target analyte 12
C12-2,3,7,8-TCDD would be quantified by reference to the
labelled standard 13
C12-2,3,7,8-TCDD. To minimise measurement
uncertainty, isotope dilution should be used for all analytes that contribute to
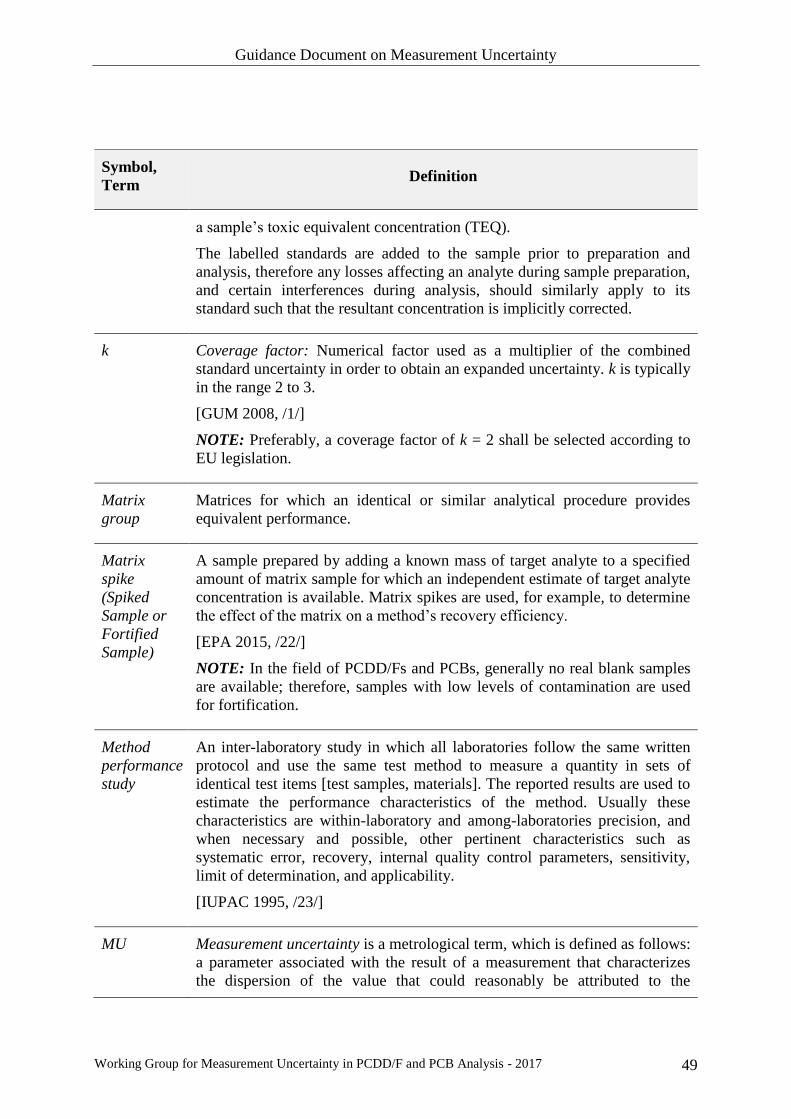
Guidance Document on Measurement Uncertainty
Working Group for Measurement Uncertainty in PCDD/F and PCB Analysis - 2017 49
Symbol,
Term Definition
a sample’s toxic equivalent concentration (TEQ).
The labelled standards are added to the sample prior to preparation and
analysis, therefore any losses affecting an analyte during sample preparation,
and certain interferences during analysis, should similarly apply to its
standard such that the resultant concentration is implicitly corrected.
k Coverage factor: Numerical factor used as a multiplier of the combined
standard uncertainty in order to obtain an expanded uncertainty. k is typically
in the range 2 to 3.
[GUM 2008, /1/]
NOTE: Preferably, a coverage factor of k = 2 shall be selected according to
EU legislation.
Matrix
group
Matrices for which an identical or similar analytical procedure provides
equivalent performance.
Matrix
spike
(Spiked
Sample or
Fortified
Sample)
A sample prepared by adding a known mass of target analyte to a specified
amount of matrix sample for which an independent estimate of target analyte
concentration is available. Matrix spikes are used, for example, to determine
the effect of the matrix on a method’s recovery efficiency.
[EPA 2015, /22/]
NOTE: In the field of PCDD/Fs and PCBs, generally no real blank samples
are available; therefore, samples with low levels of contamination are used
for fortification.
Method
performance
study
An inter-laboratory study in which all laboratories follow the same written
protocol and use the same test method to measure a quantity in sets of
identical test items [test samples, materials]. The reported results are used to
estimate the performance characteristics of the method. Usually these
characteristics are within-laboratory and among-laboratories precision, and
when necessary and possible, other pertinent characteristics such as
systematic error, recovery, internal quality control parameters, sensitivity,
limit of determination, and applicability.
[IUPAC 1995, /23/]
MU Measurement uncertainty is a metrological term, which is defined as follows:
a parameter associated with the result of a measurement that characterizes
the dispersion of the value that could reasonably be attributed to the
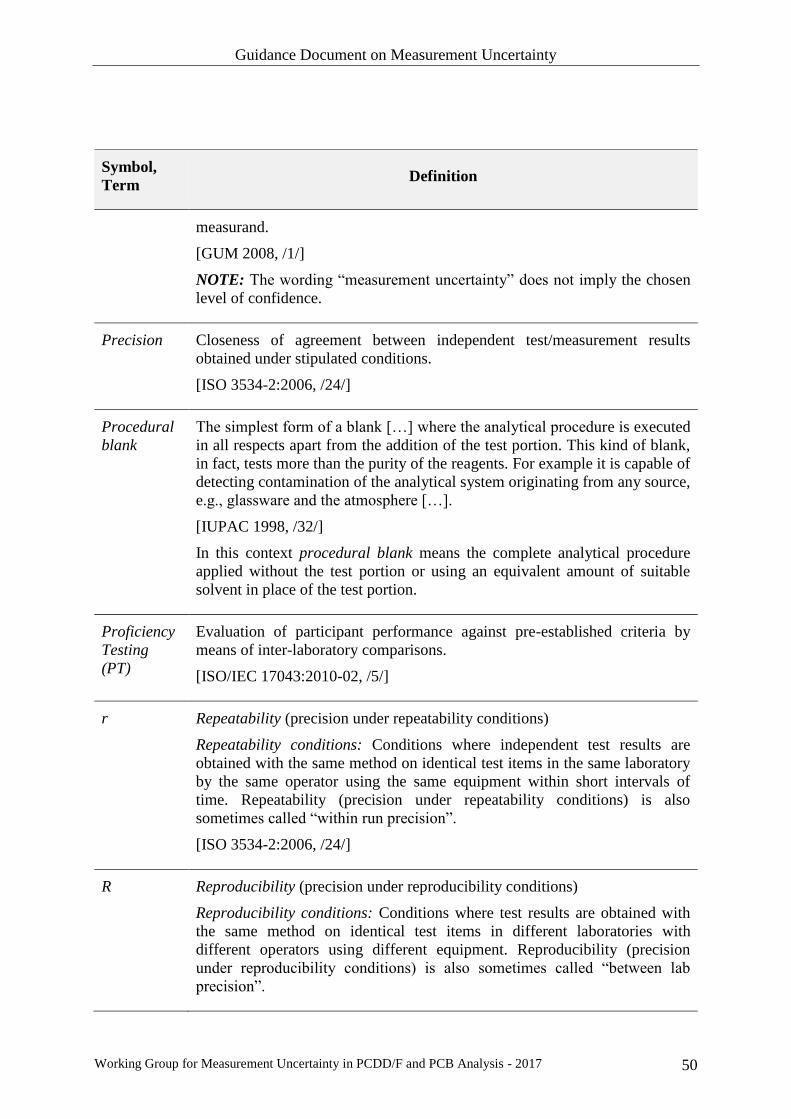
Guidance Document on Measurement Uncertainty
Working Group for Measurement Uncertainty in PCDD/F and PCB Analysis - 2017 50
Symbol,
Term Definition
measurand.
[GUM 2008, /1/]
NOTE: The wording “measurement uncertainty” does not imply the chosen
level of confidence.
Precision Closeness of agreement between independent test/measurement results
obtained under stipulated conditions.
[ISO 3534-2:2006, /24/]
Procedural
blank
The simplest form of a blank […] where the analytical procedure is executed
in all respects apart from the addition of the test portion. This kind of blank,
in fact, tests more than the purity of the reagents. For example it is capable of
detecting contamination of the analytical system originating from any source,
e.g., glassware and the atmosphere […].
[IUPAC 1998, /32/]
In this context procedural blank means the complete analytical procedure
applied without the test portion or using an equivalent amount of suitable
solvent in place of the test portion.
Proficiency
Testing
(PT)
Evaluation of participant performance against pre-established criteria by
means of inter-laboratory comparisons.
[ISO/IEC 17043:2010-02, /5/]
r Repeatability (precision under repeatability conditions)
Repeatability conditions: Conditions where independent test results are
obtained with the same method on identical test items in the same laboratory
by the same operator using the same equipment within short intervals of
time. Repeatability (precision under repeatability conditions) is also
sometimes called “within run precision”.
[ISO 3534-2:2006, /24/]
R Reproducibility (precision under reproducibility conditions)
Reproducibility conditions: Conditions where test results are obtained with
the same method on identical test items in different laboratories with
different operators using different equipment. Reproducibility (precision
under reproducibility conditions) is also sometimes called “between lab
precision”.

Guidance Document on Measurement Uncertainty
Working Group for Measurement Uncertainty in PCDD/F and PCB Analysis - 2017 51
Symbol,
Term Definition
[ISO 3534-2:2006, /24/]
R Recovery: Proportion of the amount of analyte, present in or added to the
analytical portion of the test material, which is extracted and presented for
measurement.
[IUPAC 1998, /32/]
�̅� Average recovery obtained from multiple analysis of a fortified sample using
the same method.
Reference
quantity
value
Quantity value used as a basis for comparison with values of quantities of the
same kind. … A reference quantity value with associated measurement
uncertainty is usually provided with reference to, e.g. a certified reference
material.
[ISO/IEC Guide 99-12:2007, /8/]
RM Reference Material: Material, sufficiently homogeneous and stable with
respect to one or more specified properties, which has been established to be
fit for its intended use in a measurement process.
[ISO Guide 30:2008, /6/; ISO Guide 35:2006 /7/; ISO 13528:2015-08, /11/]
NOTE: Within the scope of this document, a reference material may be a QC
sample sufficiently characterized using the laboratory’s own analyses.
RMS Square Root of Mean Squares
RMSbias Square Root of Mean Squares of individual bias contributions: √
∑(𝑏𝑖𝑎𝑠𝑖)2
𝑛
[[ISO 11352:2012-07, or DIN ISO 11352:2013-03, /4/]
RSS Root of Sum of Squares
Rw Intermediate Precision (precision under intermediate conditions, also
expressed as within-laboratory precision)
Intermediate precision conditions: Conditions where test results or
measurement results are obtained with the same method, on identical
test/measurement items in the same test or measurement facility, under some
different operating condition. There are four elements to the operating
Guidance Document on Measurement Uncertainty
Working Group for Measurement Uncertainty in PCDD/F and PCB Analysis - 2017 52
Symbol,
Term Definition
condition: time, calibration, operator and equipment.
[ISO 3534-2:2006, /24/]
s Sample standard deviation: An estimate of the population standard deviation
σ from a sample of n results
[EURACHEM/CITAC 2012, /12/]
sbias Standard deviation of the bias, expressed e.g. as a percentage
Sbias,rel Relative standard deviation of the bias, expressed e.g. as a percentage.
Fortified
QC sample
A sample matrix, free from the analytes of interest, fortified with verified
known amounts of analytes or a material containing known and verified
amounts of analytes from the same source as the calibration standards. It is
generally used to establish intra-laboratory or analyst specific precision and
bias or to assess the performance of all or a portion of the measurement
system.
based on [EPA 2015, /22/]
sr Repeatability standard deviation: Standard deviation of test results or
measurement results obtained under repeatability conditions.
[ISO 3534-2:2006, /24/]
sr is a measure of the repeatability r and can be estimated from simple
replication studies.
sR Reproducibility standard deviation: Standard deviation of test results or
measurement results obtained under reproducibility conditions.
[ISO 3534-2:2006, /24/]
sR is a measure of the reproducibility R and can be estimated from validation
studies with many participating laboratories or from proficiency testing data.
sr,rel Relative repeatability standard deviation, expressed e.g. as a percentage.
sR,rel Relative reproducibility standard deviation, expressed e.g. as a percentage.
srel Relative standard deviation: An estimate of the standard deviation of a
population from a (statistical) sample of n results divided by the mean of that

Guidance Document on Measurement Uncertainty
Working Group for Measurement Uncertainty in PCDD/F and PCB Analysis - 2017 53
Symbol,
Term Definition
sample. Often known as coefficient of variation (CV). Also frequently stated
as a percentage.
[EURACHEM/CITAC 2012, /12/]
sRRF,rel Relative standard deviation of relative response factors (RRF) of calibration
sRw Intermediate precision standard deviation: Standard deviation of test results
or measurement results obtained under intermediate precision conditions.
[ISO 3534-2:2006, /24/]
sRw is a measure of the intermediate precision Rw and can be estimated from
the standard deviation of a control sample over a certain period of time.
sRw,pool Pooled intermediate precision standard deviation: Standard deviation of test
results or measurement results obtained from various grouped sample
matrices under otherwise intermediate precision conditions.
sRw,pool is a measure of the intermediate precision in the special case of using
pooled matrices, and can be estimated from the standard deviation of various
grouped sample matrices over a certain period of time.
sRw,pool,rel Pooled relative intermediate precision standard deviation, expressed e.g. as
a percentage.
sRw,rel Relative intermediate precision standard deviation, expressed e.g. as a
percentage.
ssource Standard deviation associated with an uncertainty source
𝑠�̅� Standard deviation of the mean: The standard deviation of the mean �̅� of n
values taken from a population is given by
𝑠�̅� =𝑠
√𝑛
The terms "standard error" and "standard error of the mean" have also been
used to describe the same quantity.
[EURACHEM/CITAC 2012, /12/]
σ Population standard deviation
[EURACHEM/CITAC 2012, /12/]
Guidance Document on Measurement Uncertainty
Working Group for Measurement Uncertainty in PCDD/F and PCB Analysis - 2017 54
Symbol,
Term Definition
σp Fitness-for-purpose-based “standard deviation for proficiency assessment”.
[ISO 13528:2015-08, /11/]
σp,rel Fitness-for-purpose-based “standard deviation for proficiency assessment”,
expressed e.g. as a percentage.
[ISO 13528:2015-08, /11/]
Target
measure-
ment
uncertainty
Measurement uncertainty specified as an upper limit and decided on the
basis of the intended use of measurement results
[ISO/IEC Guide 99-12:2007, /8/]
True value Value which characterizes a quantity or quantitative characteristic perfectly
defined in the conditions which exist when that quantity or quantitative
characteristic is considered.
NOTE: The true value of a quantity or quantitative characteristic is a
theoretical concept and, in general, cannot be known exactly.
[ISO 3534-2:2006, /24/; EURACHEM/CITAC 2012, /12/]
Trueness Closeness of agreement between the average of an infinite number of
replicate measured quantity values and a reference quantity value.
[ISO/IEC Guide 99-12:2007, /8/]
NOTE: Trueness is generally expressed as the overall bias.
U Expanded [combined] uncertainty: Quantity defining an interval about the
result of a measurement that may be expected to encompass a large fraction
of the distribution of values that could reasonably be attributed to the
measurand.
NOTE 1: The fraction may be viewed as the coverage probability or level of
confidence of the interval.
[GUM 2008, /1/; EURACHEM 2012, /12/]
NOTE 2: The expanded uncertainty provides an interval within which the
value of the measurand is believed to lie with a higher level of confidence
EURACHEM/CITAC 2012, /12/]. Preferably, a level of confidence of the
interval of 95 % shall be chosen.
NOTE 3: In this document, for compliance assessment, U is expressed in
absolute units.
Guidance Document on Measurement Uncertainty
Working Group for Measurement Uncertainty in PCDD/F and PCB Analysis - 2017 55
Symbol,
Term Definition
u(xi) Individual standard uncertainty component: Uncertainty of the result x of a
measurement i expressed as a standard deviation.
[GUM 2008, /1/]
NOTE: For calculation of u according to the provisions given in this
document, individual contributory terms u(xi) are expressed in relative units,
to simplify the calculations and, on the practical level, facilitate e.g. the
accommodation of various concentrations.
ubias Uncertainty component for the bias.
[ISO 11352:2012-07, or DIN ISO 11352:2013-03, /4/]
ubias,max Uncertainty component corresponding to the maximum tolerable bias.
uc Combined standard uncertainty: Standard uncertainty of the result of a
measurement when that result is obtained from the values of a number of
other quantities, equal to the positive square root of a sum of terms, the terms
being the variances or co-variances of these other quantities weighted
according to how the measurement result varies with changes in these
quantities.
[GUM 2008, /1/]
uc,max Maximum tolerable combined standard uncertainty.
uconc Uncertainty component for the concentration.
uCref Uncertainty component of the assigned value of a RM, or in a PT.
[ISO 11352:2012-07, or DIN ISO 11352:2013-03, /4/]
NOTE: If the uncertainty of the assigned value is too large in comparison
with the standard deviation for proficiency assessment, there is a risk that
some laboratories will receive a questionable or unsatisfactory performance
(zeta-score) because of inaccuracy in the determination of the assigned
value, not due to any cause within those laboratories.
uCRM Uncertainty component of the certified value of a CRM.
[ISO 11352:2012-07, or DIN ISO 11352:2013-03, /4/]
Uncertainty of a Certified Value: An estimate attached to a certified value of
a quantity which characterizes the range of values within which the “true
Guidance Document on Measurement Uncertainty
Working Group for Measurement Uncertainty in PCDD/F and PCB Analysis - 2017 56
Symbol,
Term Definition
value” is asserted to lie with a stated level of confidence.
[ISO Guide 30:2008, /6/]
Umax Maximum tolerable expanded measurement uncertainty.
umean Standard uncertainty associated with the arithmetic mean calculated from
the results of 2 independent analyses.
Upper
bound
approach
‘Upper-bound’ means the concept which requires using the limit of
quantification for the contribution of each non-quantified congener.
[COM 2014, /27/; COM 2009, /28/]
ur Uncertainty component for the repeatability.
uRw Uncertainty component for within-laboratory reproducibility.
[ISO 11352:2012-07, or DIN ISO 11352:2013-03, /4/]
uRw,gr Uncertainty component for intermediate precision (within-laboratory
reproducibility) in the special case when matrices are grouped.
uRw,max Maximum tolerable intermediate precision expressed as sRw.
ufort Fortification procedure uncertainty. Uncertainty component of the amount
of analyte a blank or low contaminated sample is fortified with.
uvol Uncertainty component for the volume.
�̅� Mean value: Arithmetic mean value of a sample of n results.
[EURACHEM/CITAC 2012, /12/]
Note: Laboratory mean value means the arithmetic mean value of a sample
of n results analysed in an individual laboratory.
xcert Certified (property) value: The certified (property) value is attributed to a
quantity representing a property of the CRM.
[ISO Guide 35:2006, /7/]

Guidance Document on Measurement Uncertainty
Working Group for Measurement Uncertainty in PCDD/F and PCB Analysis - 2017 57
Symbol,
Term Definition
xfort Fortification concentration: Amount of analyte used for fortification of a
blank or low contaminated sample.
zeta-score ζ =𝑥−𝑥𝑎
√𝑢𝑐2+𝑢𝐶𝑟𝑒𝑓
2
Zeta-score: Standardized measure of performance, calculated using the
participant result, assigned value and the combined standard uncertainties for
the result and the assigned value.
[ISO 13528:2015-08, /11/]
z-score 𝑧 =𝑥−𝑥𝑎
𝜎𝑝
z-score: Standardized measure of performance, calculated using the
participant result, assigned value and the standard deviation for proficiency
assessment.
[ISO 13528:2015-08, /11/]

Guidance Document on Measurement Uncertainty
Working Group for Measurement Uncertainty in PCDD/F and PCB Analysis - 2017 58
12. References
1. BIPM, IEC, IFCC, ISO, IUPAC, IUPAP, OIML: Guide to the Expression of Uncertainty
in Measurement (GUM). International Organization for Standardization, Geneva. ISBN
92-67-10188-9, (1st ed. 1993), corrected and reprinted 1995. Reissued as ISO Guide 98-3
(2008). Available at http://www.bipm.org as JCGM 100:2008.
2. ISO 3534-1:2006, Statistics - vocabulary and symbols - Part 1: Probability and General
Statistical Terms, International Organization for Standardization, Geneva.
3. Magnusson B, Näykki T, Hovind H, Krysell M. Nordtest Technical Report 537:
Handbook for Calculation of Measurement Uncertainty in Environmental Laboratories.
(NT TR 537 - ed. 3.1, 2012)
4. DIN ISO 11352:2013-03, or ISO 11352:2012-07, Water quality – Estimation of
Measurement Uncertainty based on Validation and Quality Control Data. International
Organization for Standardization, Geneva.
5. ISO/IEC 17043:2010-02, Conformity assessment – General requirements for proficiency
testing. International Organization for Standardization, Geneva.
6. ISO Guide 30:2008, Terms and definitions used in connection with reference materials.
International Organization for Standardization, Geneva.
7. ISO Guide 35:2006, Reference materials – General guidance for the assignment of
property values. International Organization for Standardization, Geneva.
8. ISO/IEC Guide 99-12:2007, International Vocabulary of Metrology – Basic and General
Concepts and Associated Terms (VIM).
9. Barwick VJ and Ellison SLR. Uncertainty Principles, Part (d): Protocol for uncertainty
evaluation from validation data. January 2000. LGC/VAM/1998/088
10. Maroto A, Boqué R, Riu J and Rius FX. Should non-significant bias be included in the
uncertainty budget? Accred Qual Assur 7 (2002) 90–94
11. ISO 13528:2015-08, Statistical methods for use in proficiency testing by interlaboratory
comparisons. International Organization for Standardization, Geneva.
12. Ellison SLR and Williams A (eds). EURACHEM/CITAC guide: Quantifying Uncertainty
in Analytical Measurement, (3rd
ed. 2012). ISBN 978-0-948926-30-3. Available at
www.eurachem.org and at http://www.citac.cc.
13. Fernandes A, Rose M, Smith F and Holland J. 2012. Organic Environmental
Contaminants in the 2012 Total Diet Study samples. Food Standards Agency Report.
Available at http://www.food.gov.uk/sites/default/files/research-report-total-diet-
study.pdf
Guidance Document on Measurement Uncertainty
Working Group for Measurement Uncertainty in PCDD/F and PCB Analysis - 2017 59
14. ISO/IEC 17025:2005-08, General requirements for the competence of testing and
calibration laboratories. International Organization for Standardization, Geneva.
15. Thompson M, Ellison SLR and Wood R. The International Harmonised Protocol for the
proficiency testing of chemical analytical laboratories. IUPAC, Pure and Applied
Chemistry 78, 145–196 (2006). Last update: 2014-02-24; version: 2.3.3.
16. EURACHEM Guide – Selection, Use and Interpretation of Proficiency Testing (PT)
Schemes by Laboratories, (2nd
ed. 2011). Available at www.eurachem.org.
17. ISO 5725-1:1993, Accuracy (trueness and precision) of measurement methods and
results. Part 1: General principles and definitions. International Organization for
Standardization, Geneva.
18. Ramsey MH and Ellison SLR (eds.) EURACHEM/EUROLAB/CITAC/Nordtest/ AMC
Guide: Measurement uncertainty arising from sampling: A guide to methods and
approaches, (1st ed. 2007). ISBN 978-0-948926-26-6. Available at www.eurachem.org.
19. Van den Berg M et al., The 2005 World Health Organization Re-evaluation of Human
and Mammalian Toxic Equivalency Factors for Dioxins and Dioxin-like Compounds.
Toxicological Sciences 93 (2) (2006) 223–241
20. IUPAC. Compendium of Chemical Terminology, 2nd ed. (The "Gold Book"). Compiled
by A. D. McNaught and A. Wilkinson. Blackwell Scientific Publications, Oxford (1997).
XML on-line corrected version: http://goldbook.iupac.org (2006-) created by M. Nic, J.
Jirat, B. Kosata; updates compiled by A. Jenkins. ISBN 0-9678550-9-8.
doi:10.1351/goldbook
21. Magnusson B and Örnemark U (eds.) EURACHEM Guide: The Fitness for Purpose of
Analytical Methods – A Laboratory Guide to Method Validation and Related Topics, (2nd
ed. 2014). ISBN 978-91-87461-59-0. Available at www.eurachem.org.
22. United States Environmental Protection Agency (EPA). Vocabulary Catalog, Forum on
Environmental Measurements (FEM) Glossary (August 2015). Available at
http://www.epa.gov/fem/.
23. Horwitz W, Protocol for the design, conduct and interpretation of method performance
studies. Pure Appl. Chem. 67 (1995) 331-343. Available at www.iupac.org.
24. ISO 3534-2:2006, Statistics - vocabulary and symbols - Part 2: Applied statistics,
International Organization for Standardization, Geneva.
25. US EPA 2014, Method 8000D, Determinative Chromatographic Separation.
Revision 4
26. EURACHEM/CITAC Guide: Use of uncertainty information in compliance assessment,
(1st ed. 2007). Available at www.eurachem.org.
Guidance Document on Measurement Uncertainty
Working Group for Measurement Uncertainty in PCDD/F and PCB Analysis - 2017 60
27. COMMISSION REGULATION (EU) No 589/2014 of 2 June 2014 laying down methods
of sampling and analysis for the control of levels of dioxins, dioxin-like PCBs and non-
dioxin-like PCBs in certain foodstuffs and repealing Regulation (EU) No 252/2012 (OJ L
164, 03.06.2014, p. 18)
28. COMMISSION REGULATION (EC) No 152/2009 of 27 January 2009 laying down the
methods of sampling and analysis for the official control of feed (OJ L 54, 26.02.2009, p.
1)
29. COMMISSION REGULATION (EC) No 1881/2006 of 19 December 2006 setting
maximum levels for certain contaminants in foodstuffs (OJ L 364, 20.12.2006, p. 5)
30. COMMISSION RECOMMENDATION of 3 December 2013 on the reduction of the
presence of dioxins, furans and PCBs in feed and food (2013/711/EU) (OJ L 323,
04.12.2013, p. 37)
31. DIRECTIVE 2002/32/EC OF THE EUROPEAN PARLIAMENT AND OF THE
COUNCIL of 7 May 2002 on undesirable substances in animal feed (OJ L 140,
30.05.2002, p. 10)
32. IUPAC. Compendium of Analytical Nomenclature (definitive rules 1997) – The Orange
Book, 3rd Edition, Compiled by J. Inczedy, T. Lengyel, and A.M. Ure. Chapter 18.6.1
Terms concerned with internal quality control procedures. Blackwell Scientific
Publications, Oxford (1998).
33. IUPAC. Harmonised Guidelines for the use of Recovery Information in Analytical
Measurement (Technical Report). Pure Appl. Chem. 71 (2), 337-348 (1999)
34. EC Guidance document: Report on the relationship between analytical results,
measurement uncertainty, recovery factors and the provisions of EU Food and Feed
legislation (2004).
Available at http://ec.europa.eu/food/safety/docs/cs_contaminants_sampling_analysis-
report_2004_en.pdf
35. IUPAC. Harmonized guidelines for internal quality control in analytical chemistry
(Technical Report) Pure Appl. Chem. 67 (4), 649-666 (1995)
36. EURACHEM/CITAC Guide: Setting and Using Target Uncertainty in Chemical
Measurement. R. Bettencourt da Silva, A. Williams (Eds) (1st ed. 2015). Available at
www.eurachem.org
37. Horwitz W, The Certainty of Uncertainty. J AOAC Int. 86, 109-111 (2003).
38. EN 16215:2012-07, Animal feeding stuffs. Determination of dioxins and dioxin-like
PCBs by GC/HRMS and of indicator PCBs by GC/HRMS
Guidance Document on Measurement Uncertainty
Working Group for Measurement Uncertainty in PCDD/F and PCB Analysis - 2017 61
39. Barwick V.J., Ellison S.L.R, Fairman B. Estimation of uncertainties in ICP-MS analysis:
a practical methodology. Analytica Chimica Acta 394, 281-291 (1999)
40. EU Reference Laboratories Guidance Document: Guidance Document on the Estimation
of LOD and LOQ for Measurements in the Field of Contaminants in Feed and Food,
EURL for Polycyclic Aromatic Hydrocarbons, EURL for Dioxins and PCBs in Feed and
Food, EURL for Heavy Metals in Feed and Food and EURL for Mycotoxins (2016).
Available at: http://www.eurl-dioxin-freiburg.eu/doc/LOD_LOQ_guidance document
_food contaminants_2016.pdf
41. IUPAC. Compendium of Analytical Nomenclature (definitive rules 1997) – The Orange
Book, 3rd Edition, Compiled by J. Inczedy, T. Lengyel, and A.M. Ure. Chapter 2.3
Quantities related to replicate measurements. Blackwell Scientific Publications, Oxford
(1998).
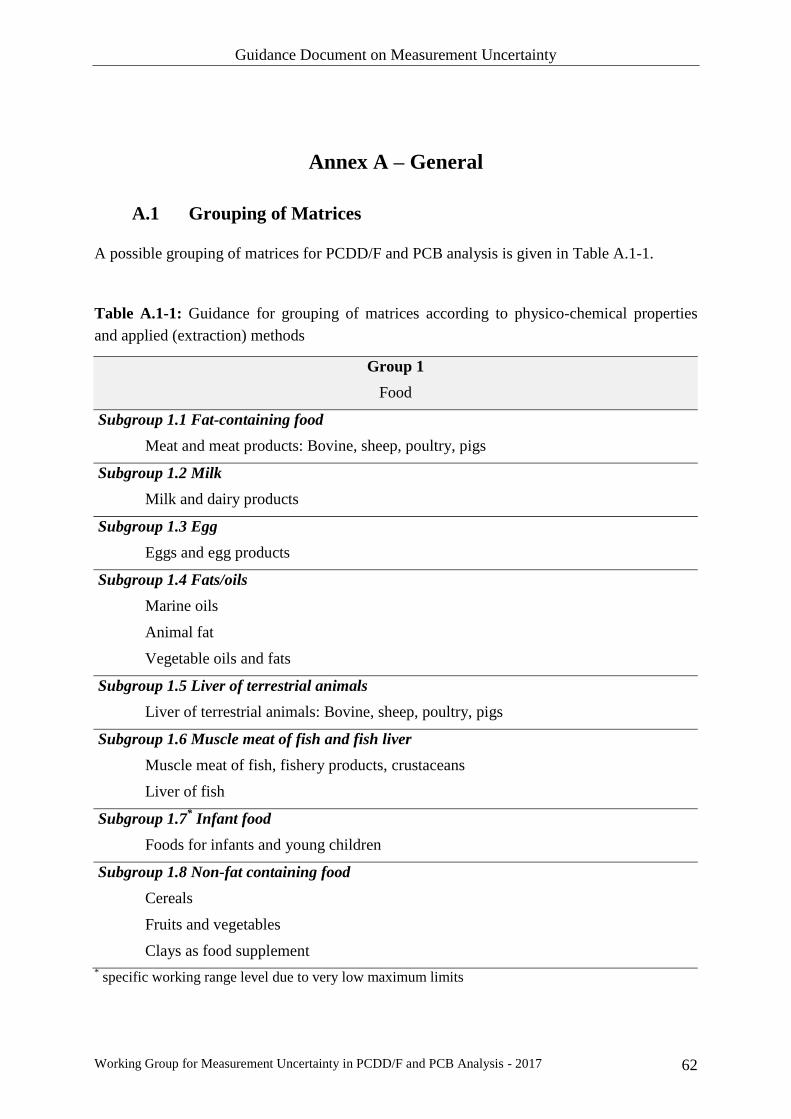
Guidance Document on Measurement Uncertainty
Working Group for Measurement Uncertainty in PCDD/F and PCB Analysis - 2017 62
Annex A – General
A.1 Grouping of Matrices
A possible grouping of matrices for PCDD/F and PCB analysis is given in Table A.1-1.
Table A.1-1: Guidance for grouping of matrices according to physico-chemical properties
and applied (extraction) methods
Group 1
Food
Subgroup 1.1 Fat-containing food
Meat and meat products: Bovine, sheep, poultry, pigs
Subgroup 1.2 Milk
Milk and dairy products
Subgroup 1.3 Egg
Eggs and egg products
Subgroup 1.4 Fats/oils
Marine oils
Animal fat
Vegetable oils and fats
Subgroup 1.5 Liver of terrestrial animals
Liver of terrestrial animals: Bovine, sheep, poultry, pigs
Subgroup 1.6 Muscle meat of fish and fish liver
Muscle meat of fish, fishery products, crustaceans
Liver of fish
Subgroup 1.7* Infant food
Foods for infants and young children
Subgroup 1.8 Non-fat containing food
Cereals
Fruits and vegetables
Clays as food supplement
* specific working range level due to very low maximum limits
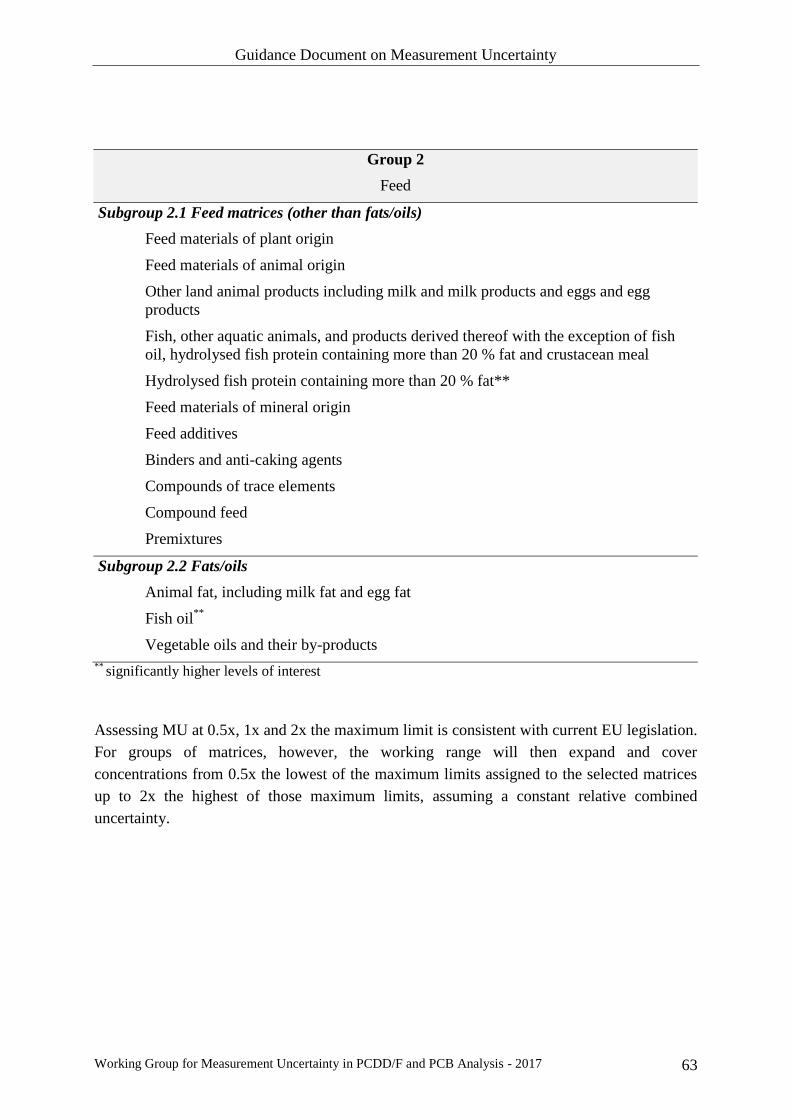
Guidance Document on Measurement Uncertainty
Working Group for Measurement Uncertainty in PCDD/F and PCB Analysis - 2017 63
Group 2
Feed
Subgroup 2.1 Feed matrices (other than fats/oils)
Feed materials of plant origin
Feed materials of animal origin
Other land animal products including milk and milk products and eggs and egg
products
Fish, other aquatic animals, and products derived thereof with the exception of fish
oil, hydrolysed fish protein containing more than 20 % fat and crustacean meal
Hydrolysed fish protein containing more than 20 % fat**
Feed materials of mineral origin
Feed additives
Binders and anti-caking agents
Compounds of trace elements
Compound feed
Premixtures
Subgroup 2.2 Fats/oils
Animal fat, including milk fat and egg fat
Fish oil**
Vegetable oils and their by-products
** significantly higher levels of interest
Assessing MU at 0.5x, 1x and 2x the maximum limit is consistent with current EU legislation.
For groups of matrices, however, the working range will then expand and cover
concentrations from 0.5x the lowest of the maximum limits assigned to the selected matrices
up to 2x the highest of those maximum limits, assuming a constant relative combined
uncertainty.
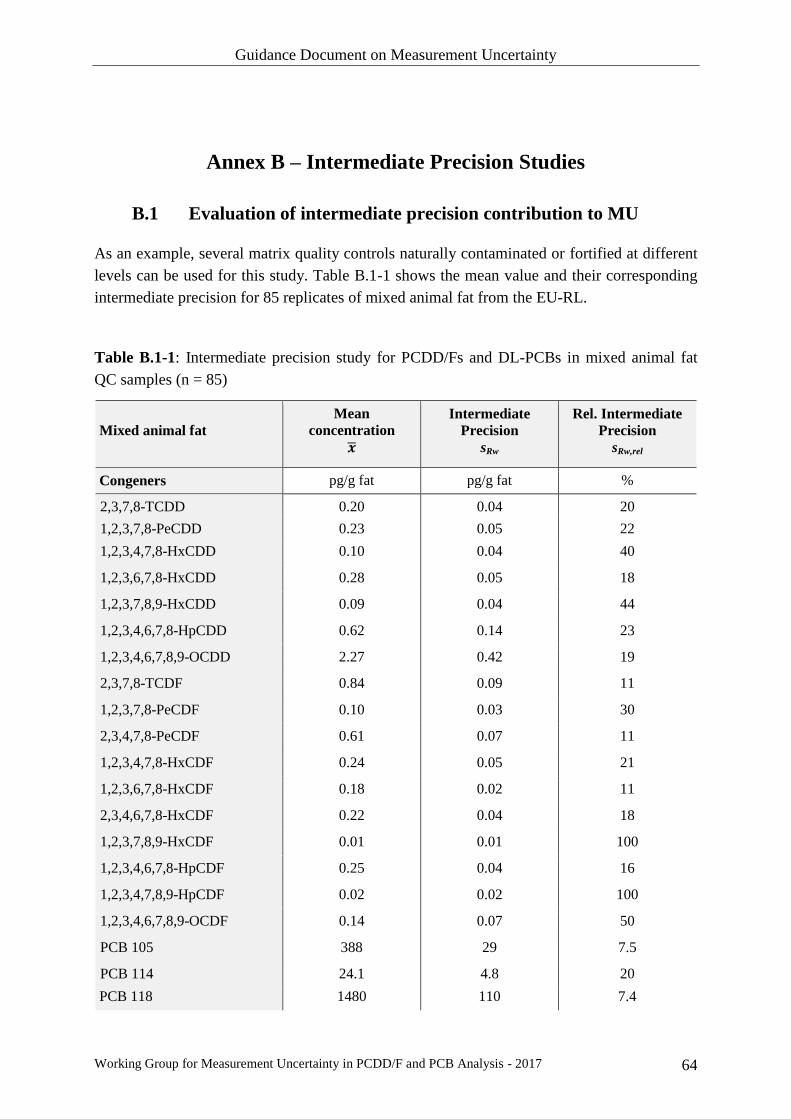
Guidance Document on Measurement Uncertainty
Working Group for Measurement Uncertainty in PCDD/F and PCB Analysis - 2017 64
Annex B – Intermediate Precision Studies
B.1 Evaluation of intermediate precision contribution to MU
As an example, several matrix quality controls naturally contaminated or fortified at different
levels can be used for this study. Table B.1-1 shows the mean value and their corresponding
intermediate precision for 85 replicates of mixed animal fat from the EU-RL.
Table B.1-1: Intermediate precision study for PCDD/Fs and DL-PCBs in mixed animal fat
QC samples (n = 85)
Mixed animal fat
Mean
concentration
�̅�
Intermediate
Precision
sRw
Rel. Intermediate
Precision
sRw,rel
Congeners pg/g fat pg/g fat %
2,3,7,8-TCDD 0.20 0.04 20
1,2,3,7,8-PeCDD 0.23 0.05 22
1,2,3,4,7,8-HxCDD 0.10 0.04 40
1,2,3,6,7,8-HxCDD 0.28 0.05 18
1,2,3,7,8,9-HxCDD 0.09 0.04 44
1,2,3,4,6,7,8-HpCDD 0.62 0.14 23
1,2,3,4,6,7,8,9-OCDD 2.27 0.42 19
2,3,7,8-TCDF 0.84 0.09 11
1,2,3,7,8-PeCDF 0.10 0.03 30
2,3,4,7,8-PeCDF 0.61 0.07 11
1,2,3,4,7,8-HxCDF 0.24 0.05 21
1,2,3,6,7,8-HxCDF 0.18 0.02 11
2,3,4,6,7,8-HxCDF 0.22 0.04 18
1,2,3,7,8,9-HxCDF 0.01 0.01 100
1,2,3,4,6,7,8-HpCDF 0.25 0.04 16
1,2,3,4,7,8,9-HpCDF 0.02 0.02 100
1,2,3,4,6,7,8,9-OCDF 0.14 0.07 50
PCB 105 388 29 7.5
PCB 114 24.1 4.8 20
PCB 118 1480 110 7.4
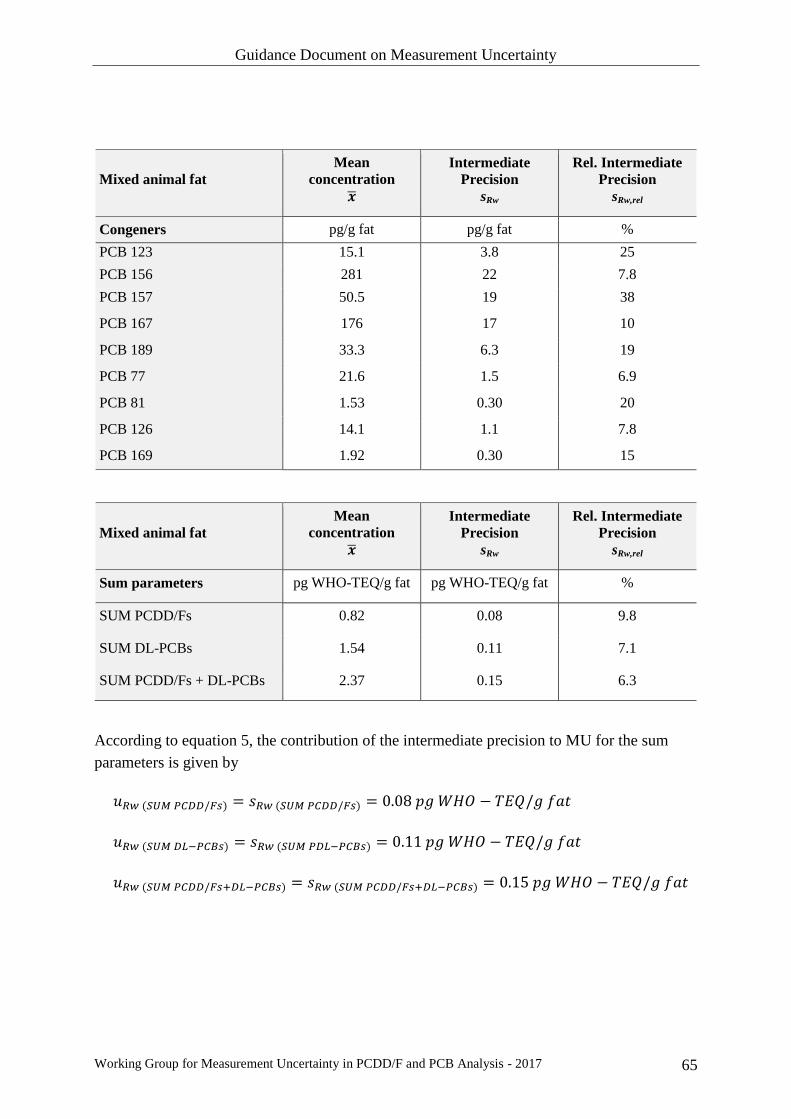
Guidance Document on Measurement Uncertainty
Working Group for Measurement Uncertainty in PCDD/F and PCB Analysis - 2017 65
Mixed animal fat
Mean
concentration
�̅�
Intermediate
Precision
sRw
Rel. Intermediate
Precision
sRw,rel
Congeners pg/g fat pg/g fat %
PCB 123 15.1 3.8 25
PCB 156 281 22 7.8
PCB 157 50.5 19 38
PCB 167 176 17 10
PCB 189 33.3 6.3 19
PCB 77 21.6 1.5 6.9
PCB 81 1.53 0.30 20
PCB 126 14.1 1.1 7.8
PCB 169 1.92 0.30 15
Mixed animal fat
Mean
concentration �̅�
Intermediate
Precision
sRw
Rel. Intermediate
Precision
sRw,rel
Sum parameters pg WHO-TEQ/g fat pg WHO-TEQ/g fat %
SUM PCDD/Fs 0.82 0.08 9.8
SUM DL-PCBs 1.54 0.11 7.1
SUM PCDD/Fs + DL-PCBs 2.37 0.15 6.3
According to equation 5, the contribution of the intermediate precision to MU for the sum
parameters is given by
𝑢𝑅𝑤 (𝑆𝑈𝑀 𝑃𝐶𝐷𝐷/𝐹𝑠) = 𝑠𝑅𝑤 (𝑆𝑈𝑀 𝑃𝐶𝐷𝐷/𝐹𝑠) = 0.08 𝑝𝑔 𝑊𝐻𝑂 − 𝑇𝐸𝑄/𝑔 𝑓𝑎𝑡
𝑢𝑅𝑤 (𝑆𝑈𝑀 𝐷𝐿−𝑃𝐶𝐵𝑠) = 𝑠𝑅𝑤 (𝑆𝑈𝑀 𝑃𝐷𝐿−𝑃𝐶𝐵𝑠) = 0.11 𝑝𝑔 𝑊𝐻𝑂 − 𝑇𝐸𝑄/𝑔 𝑓𝑎𝑡
𝑢𝑅𝑤 (𝑆𝑈𝑀 𝑃𝐶𝐷𝐷/𝐹𝑠+𝐷𝐿−𝑃𝐶𝐵𝑠) = 𝑠𝑅𝑤 (𝑆𝑈𝑀 𝑃𝐶𝐷𝐷/𝐹𝑠+𝐷𝐿−𝑃𝐶𝐵𝑠) = 0.15 𝑝𝑔 𝑊𝐻𝑂 − 𝑇𝐸𝑄/𝑔 𝑓𝑎𝑡

Guidance Document on Measurement Uncertainty
Working Group for Measurement Uncertainty in PCDD/F and PCB Analysis - 2017 66
Or according to equation 6, the contribution of the relative intermediate precision to MU for
the sum parameters is given by
𝑢𝑅𝑤,𝑟𝑒𝑙 (𝑆𝑈𝑀 𝑃𝐶𝐷𝐷/𝐹𝑠) = 𝑠𝑅𝑤,𝑟𝑒𝑙 (𝑆𝑈𝑀 𝑃𝐶𝐷𝐷/𝐹𝑠) = 9.8 %
𝑢𝑅𝑤,𝑟𝑒𝑙 (𝑆𝑈𝑀 𝐷𝐿−𝑃𝐶𝐵𝑠) = 𝑠𝑅𝑤,𝑟𝑒𝑙 (𝑆𝑈𝑀 𝑃𝐷𝐿−𝑃𝐶𝐵𝑠) = 7.1 %
𝑢𝑅𝑤,𝑟𝑒𝑙 (𝑆𝑈𝑀 𝑃𝐶𝐷𝐷/𝐹𝑠+𝐷𝐿−𝑃𝐶𝐵𝑠) = 𝑠𝑅𝑤,𝑟𝑒𝑙 (𝑆𝑈𝑀 𝑃𝐶𝐷𝐷/𝐹𝑠+𝐷𝐿−𝑃𝐶𝐵𝑠) = 6.3 %
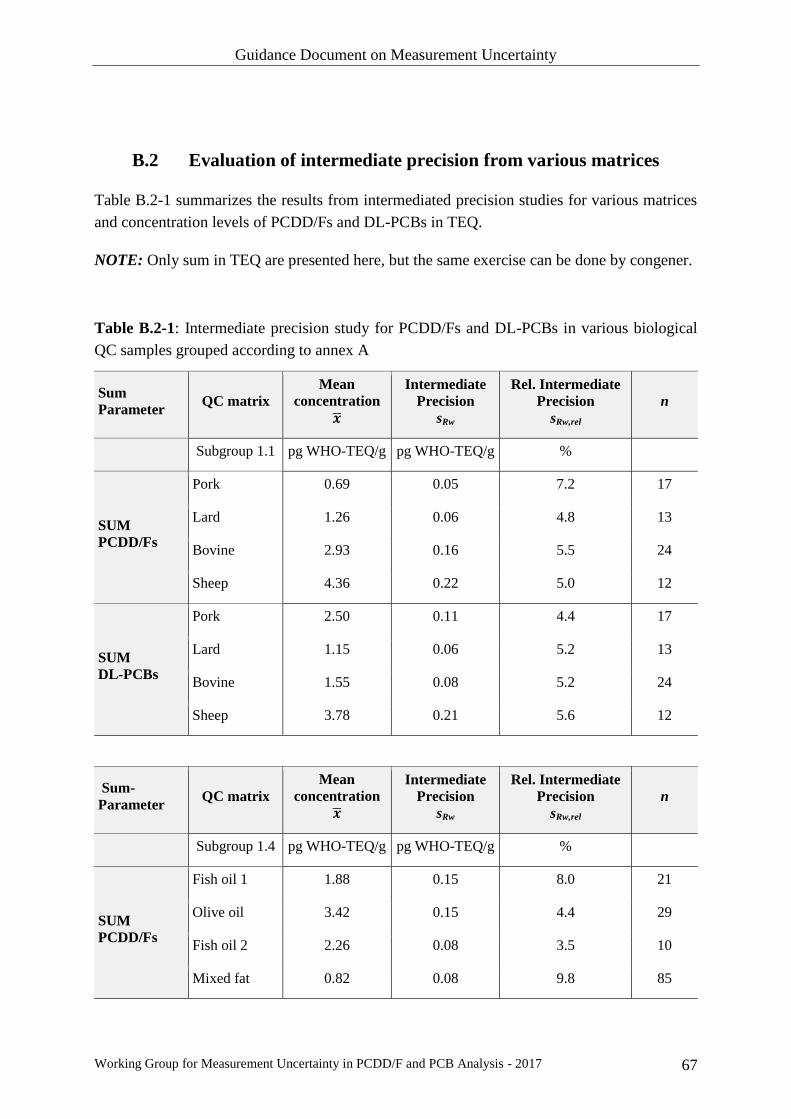
Guidance Document on Measurement Uncertainty
Working Group for Measurement Uncertainty in PCDD/F and PCB Analysis - 2017 67
B.2 Evaluation of intermediate precision from various matrices
Table B.2-1 summarizes the results from intermediated precision studies for various matrices
and concentration levels of PCDD/Fs and DL-PCBs in TEQ.
NOTE: Only sum in TEQ are presented here, but the same exercise can be done by congener.
Table B.2-1: Intermediate precision study for PCDD/Fs and DL-PCBs in various biological
QC samples grouped according to annex A
Sum
Parameter QC matrix
Mean
concentration
�̅�
Intermediate
Precision
sRw
Rel. Intermediate
Precision
sRw,rel
n
Subgroup 1.1 pg WHO-TEQ/g pg WHO-TEQ/g %
SUM
PCDD/Fs
Pork 0.69 0.05 7.2 17
Lard 1.26 0.06 4.8 13
Bovine 2.93 0.16 5.5 24
Sheep 4.36 0.22 5.0 12
SUM
DL-PCBs
Pork 2.50 0.11 4.4 17
Lard 1.15 0.06 5.2 13
Bovine 1.55 0.08 5.2 24
Sheep 3.78 0.21 5.6 12
Sum-
Parameter QC matrix
Mean
concentration
�̅�
Intermediate
Precision
sRw
Rel. Intermediate
Precision
sRw,rel
n
Subgroup 1.4 pg WHO-TEQ/g pg WHO-TEQ/g %
SUM
PCDD/Fs
Fish oil 1 1.88 0.15 8.0 21
Olive oil 3.42 0.15 4.4 29
Fish oil 2 2.26 0.08 3.5 10
Mixed fat 0.82 0.08 9.8 85

Guidance Document on Measurement Uncertainty
Working Group for Measurement Uncertainty in PCDD/F and PCB Analysis - 2017 68
Sum-
Parameter QC matrix
Mean
concentration
�̅�
Intermediate
Precision
sRw
Rel. Intermediate
Precision
sRw,rel
n
Subgroup 1.4 pg WHO-TEQ/g pg WHO-TEQ/g %
SUM
DL-PCBs
Fish oil 1 10.06 0.27 2.7 21
Olive oil 4.13 0.14 3.4 29
Fish oil 2 9.08 0.27 3.0 10
Mixed fat 1.54 0.11 7.1 85
When plotting the concentrations of PCDD/Fs, and of DL-PCBs, respectively, shown in Table
B.2-1 against their corresponding sRw values for subgroup 1.1 (see figures B.2-1 and B.2-2),
resulting regression lines exhibit slopes close to 0.049 (PCDD/Fs) and 0.056 (DL-PCBs). The
(absolute) intermediate precision is seen to be proportional to the analyte level across the
selected concentration range for subgroup 1.1.
Figure B.2-1: Intermediate precision for PCDD/Fs plotted vs. their corresponding
concentrations (in TEQ), for subgroup matrices 1.1.

Guidance Document on Measurement Uncertainty
Working Group for Measurement Uncertainty in PCDD/F and PCB Analysis - 2017 69
Figure B.2-2: Intermediate precision for DL-PCBs, plotted vs. their corresponding
concentrations (in TEQ), for subgroup matrices 1.1.
In such cases, the relative sRw,rel is rather constant through the concentration range for
subgroup 1.1 as shown in figures B.2-3 and B-2-4.

Guidance Document on Measurement Uncertainty
Working Group for Measurement Uncertainty in PCDD/F and PCB Analysis - 2017 70
Figure B.2-3: Relative intermediate precision (%) for PCDD/Fs plotted vs. their
corresponding concentrations (in TEQ), for subgroup matrices 1.1.
Figure B.2-4: Relative intermediate precision (%) for DL-PCBs, plotted vs. their
corresponding concentrations (in TEQ), for subgroup matrices 1.1.

Guidance Document on Measurement Uncertainty
Working Group for Measurement Uncertainty in PCDD/F and PCB Analysis - 2017 71
In such case, it may be possible to estimate a single precision contribution value by using a
pooled relative intermediate standard deviation sRw,pool,rel of the included matrices as given by
equation 8 for the sum of PCDD/Fs:
𝑠𝑅𝑤,𝑝𝑜𝑜𝑙,𝑟𝑒𝑙 = √(17−1)∙7.22+(13−1)∙4.82+(24−1)∙5.52+(12−1)∙5.02
(17−1)+(13−1)+(24−1)+(12−1)= 5.8 %
and for the sum of DL-PCBs:
𝑠𝑅𝑤,𝑝𝑜𝑜𝑙,𝑟𝑒𝑙 = √(17−1)∙4.42+(13−1)∙5.22+(24−1)∙5.22+(12−1)∙5.62
(17−1)+(13−1)+(24−1)+(12−1)= 5.1 %

Guidance Document on Measurement Uncertainty
Working Group for Measurement Uncertainty in PCDD/F and PCB Analysis - 2017 72
Annex C – Trueness (Bias) Studies
C.1 Evaluation of the bias contribution to MU from CRM
C.1.1 Bias contribution from single CRM
As an example, a well-characterized fish tissue CRM is used to assess the trueness (or bias)
contribution to MU in the analysis of PCDD/Fs and DL-PCBs by GC/HRMS using isotope
dilution. Six replicate analyses (i.e. 6 replicates) were performed. Table C.1.1-1 provides the
results obtained for the 29 individual congeners and for their sum–TEQ parameters as well.
In Table C.1.1-1, sbias,rel is calculated from the six replicates, biasCRM,rel is calculated from
Equation 9 and ubias,CRM,rel according to Equation 12
Table C.1.1-1: Trueness (bias) study for PCDD/Fs and DL-PCBs in a fish tissue CRM
Fish tissue �̅�
(m=6) sbias,rel
(m=6) Certified
value*
biasCRM,rel
uCRM
95% CI**
ubias,CRM,rel
Congeners pg/g pg/g pg/g
2,3,7,8-TCDD 0.097 0.069 0.102 -0.049 0.02 0.113
1,2,3,7,8-PeCDD 0.414 0.076 0.435 -0.048 0.05 0.081
1,2,3,4,7,8-HxCDD 0.118 0.066 0.136 -0.132 0.03 0.174
1,2,3,6,7,8-HxCDD 0.496 0.080 0.5 -0.008 0.05 0.060
1,2,3,7,8,9-HxCDD 0.225 0.086 0.255 -0.118 0.058 0.167
1,2,3,4,6,7,8-HpCDD 2.12 0.119 2.39 -0.112 0.82 0.210
OCDD 2.3 0.088 2.6 -0.115 0.91 0.213
2,3,7,8-TCDF 3.15 0.112 2.52 0.250 0.7 0.290
1,2,3,7,8-PeCDF 0.45 0.099 0.415 0.084 0.086 0.140
2,3,4,7,8-PeCDF 2.05 0.084 1.84 0.114 0.28 0.141
1,2,3,4,7,8-HxCDF 0.106 0.136 0.118 -0.102 0.026 0.160
1,2,3,6,7,8-HxCDF 0.126 0.102 0.118 0.068 0.022 0.123
1,2,3,7,8,9-HxCDF 0.022 0.180 (<0.05)
2,3,4,6,7,8-HxCDF 0.17 0.112 0.179 -0.050 0.026 0.099
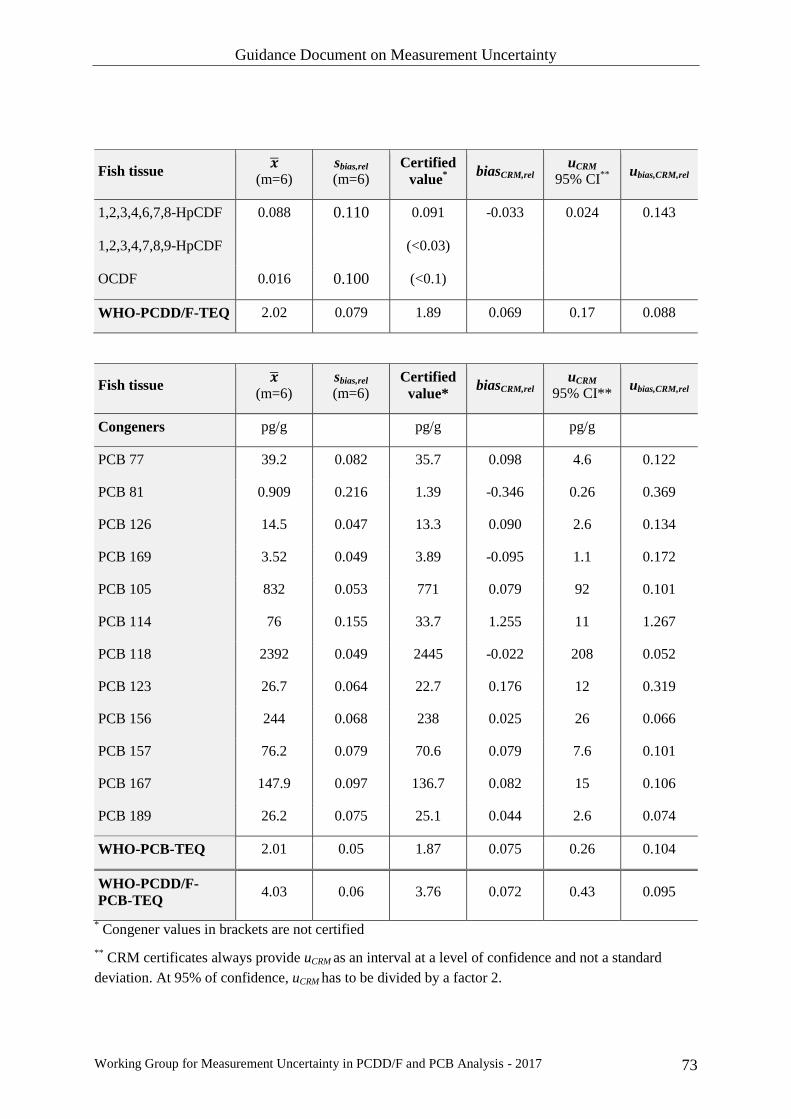
Guidance Document on Measurement Uncertainty
Working Group for Measurement Uncertainty in PCDD/F and PCB Analysis - 2017 73
Fish tissue �̅�
(m=6) sbias,rel
(m=6) Certified
value*
biasCRM,rel
uCRM
95% CI**
ubias,CRM,rel
1,2,3,4,6,7,8-HpCDF 0.088 0.110 0.091 -0.033 0.024 0.143
1,2,3,4,7,8,9-HpCDF (<0.03)
OCDF 0.016 0.100 (<0.1)
WHO-PCDD/F-TEQ 2.02 0.079 1.89 0.069 0.17 0.088
Fish tissue �̅�
(m=6) sbias,rel
(m=6) Certified
value* biasCRM,rel
uCRM
95% CI** ubias,CRM,rel
Congeners pg/g pg/g pg/g
PCB 77 39.2 0.082 35.7 0.098 4.6 0.122
PCB 81 0.909 0.216 1.39 -0.346 0.26 0.369
PCB 126 14.5 0.047 13.3 0.090 2.6 0.134
PCB 169 3.52 0.049 3.89 -0.095 1.1 0.172
PCB 105 832 0.053 771 0.079 92 0.101
PCB 114 76 0.155 33.7 1.255 11 1.267
PCB 118 2392 0.049 2445 -0.022 208 0.052
PCB 123 26.7 0.064 22.7 0.176 12 0.319
PCB 156 244 0.068 238 0.025 26 0.066
PCB 157 76.2 0.079 70.6 0.079 7.6 0.101
PCB 167 147.9 0.097 136.7 0.082 15 0.106
PCB 189 26.2 0.075 25.1 0.044 2.6 0.074
WHO-PCB-TEQ 2.01 0.05 1.87 0.075 0.26 0.104
WHO-PCDD/F-
PCB-TEQ 4.03 0.06 3.76 0.072 0.43 0.095
* Congener values in brackets are not certified
** CRM certificates always provide uCRM as an interval at a level of confidence and not a standard
deviation. At 95% of confidence, uCRM has to be divided by a factor 2.
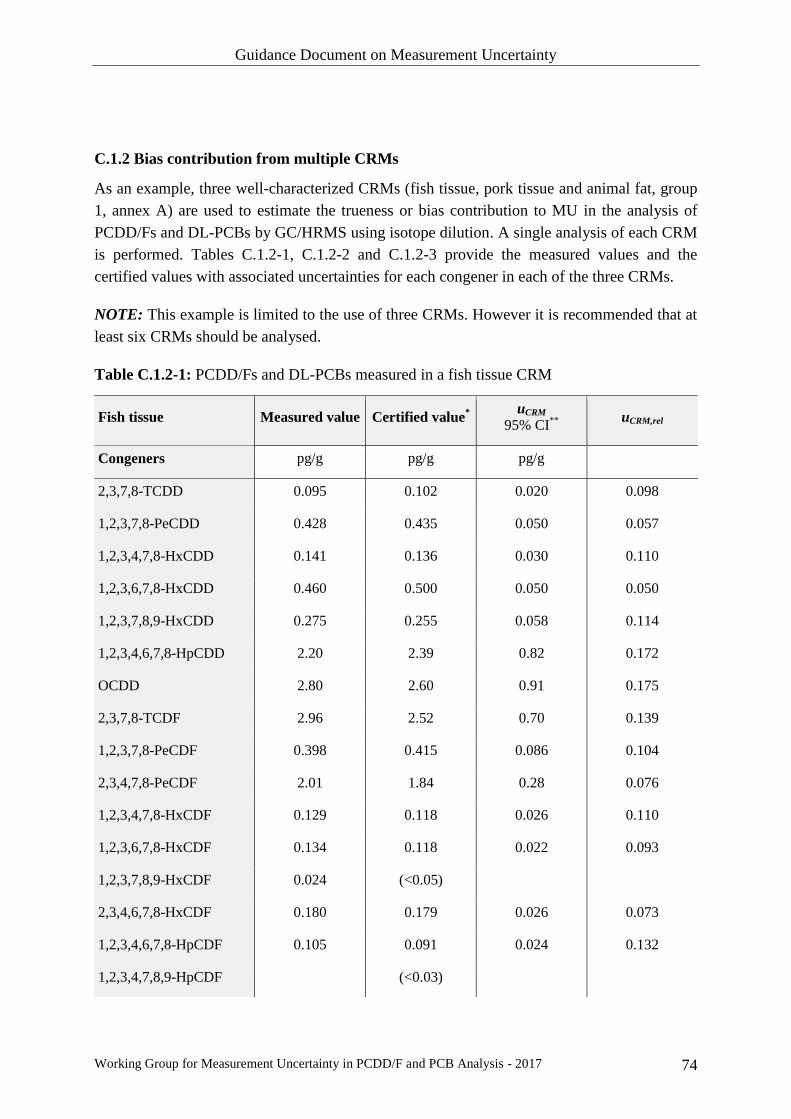
Guidance Document on Measurement Uncertainty
Working Group for Measurement Uncertainty in PCDD/F and PCB Analysis - 2017 74
C.1.2 Bias contribution from multiple CRMs
As an example, three well-characterized CRMs (fish tissue, pork tissue and animal fat, group
1, annex A) are used to estimate the trueness or bias contribution to MU in the analysis of
PCDD/Fs and DL-PCBs by GC/HRMS using isotope dilution. A single analysis of each CRM
is performed. Tables C.1.2-1, C.1.2-2 and C.1.2-3 provide the measured values and the
certified values with associated uncertainties for each congener in each of the three CRMs.
NOTE: This example is limited to the use of three CRMs. However it is recommended that at
least six CRMs should be analysed.
Table C.1.2-1: PCDD/Fs and DL-PCBs measured in a fish tissue CRM
Fish tissue Measured value Certified value*
uCRM
95% CI**
uCRM,rel
Congeners pg/g pg/g pg/g
2,3,7,8-TCDD 0.095 0.102 0.020 0.098
1,2,3,7,8-PeCDD 0.428 0.435 0.050 0.057
1,2,3,4,7,8-HxCDD 0.141 0.136 0.030 0.110
1,2,3,6,7,8-HxCDD 0.460 0.500 0.050 0.050
1,2,3,7,8,9-HxCDD 0.275 0.255 0.058 0.114
1,2,3,4,6,7,8-HpCDD 2.20 2.39 0.82 0.172
OCDD 2.80 2.60 0.91 0.175
2,3,7,8-TCDF 2.96 2.52 0.70 0.139
1,2,3,7,8-PeCDF 0.398 0.415 0.086 0.104
2,3,4,7,8-PeCDF 2.01 1.84 0.28 0.076
1,2,3,4,7,8-HxCDF 0.129 0.118 0.026 0.110
1,2,3,6,7,8-HxCDF 0.134 0.118 0.022 0.093
1,2,3,7,8,9-HxCDF 0.024 (<0.05)
2,3,4,6,7,8-HxCDF 0.180 0.179 0.026 0.073
1,2,3,4,6,7,8-HpCDF 0.105 0.091 0.024 0.132
1,2,3,4,7,8,9-HpCDF (<0.03)

Guidance Document on Measurement Uncertainty
Working Group for Measurement Uncertainty in PCDD/F and PCB Analysis - 2017 75
Fish tissue Measured value Certified value*
uCRM
95% CI**
uCRM,rel
OCDF 0.021 (<0.1)
WHO-PCDD/F-TEQ 2.00 1.89 0.17 0.045
Fish tissue Measured value Certified value*
uCRM
95% CI**
uCRM,rel
Congeners pg/g pg/g pg/g pg/g
PCB 77 33.7 35.7 4.6 0.064
PCB 81 1.25 1.39 0.26 0.094
PCB 126 14.1 13.3 2.6 0.098
PCB 169 3.75 3.89 1.1 0.141
PCB 105 884 771 92 0.060
PCB 114 58.0 33.7 11 0.163
PCB 118 2614 2445 208 0.043
PCB 123 24.5 22.7 12 0.264
PCB 156 239 238 26 0.055
PCB 157 69.5 70.6 7.6 0.054
PCB 167 154.7 136.7 15 0.055
PCB 189 25.8 25.1 2.6 0.052
WHO-PCB-TEQ 1.99 1.87 0.26 0.070
WHO-PCDD/F-
PCB-TEQ 3.99 3.76 0.43 0.057

Guidance Document on Measurement Uncertainty
Working Group for Measurement Uncertainty in PCDD/F and PCB Analysis - 2017 76
Table C.1.2-2: PCDD/Fs and DL-PCBs measured in a pork tissue CRM
Pork tissue Measured value Certified value*
uCRM
95% CI**
uCRM,rel
Congeners pg/g pg/g pg/g pg/g
2,3,7,8-TCDD 0.046 0.059 0.014 0.119
1,2,3,7,8-PeCDD 0.110 0.125 0.016 0.064
1,2,3,4,7,8-HxCDD 0.121 0.148 0.026 0.088
1,2,3,6,7,8-HxCDD 0.126 0.134 0.01 0.037
1,2,3,7,8,9-HxCDD 0.060 0.074 0.016 0.108
1,2,3,4,6,7,8-HpCDD 0.237 0.263 0.092 0.175
OCDD 0.498 0.51 0.099 0.097
2,3,7,8-TCDF 0.011 0.02 0.008 0.200
1,2,3,7,8-PeCDF 0.022 0.025 0.008 0.160
2,3,4,7,8-PeCDF 0.092 0.102 0.018 0.088
1,2,3,4,7,8-HxCDF 0.091 0.111 0.024 0.108
1,2,3,6,7,8-HxCDF 0.086 0.088 0.006 0.034
1,2,3,7,8,9-HxCDF 0.027 0.029 0.012 0.207
2,3,4,6,7,8-HxCDF 0.052 0.063 0.01 0.079
1,2,3,4,6,7,8-HpCDF 0.086 0.10 0.04 0.200
1,2,3,4,7,8,9-HpCDF 0.046 0.044 0.01 0.114
OCDF 0.045 (<0.1)
WHO-PCDD/F-TEQ 0.264 0.307 0.060 0.098
Pork tissue Measured value Certified value*
uCRM
95% CI**
uCRM,rel
Congeners pg/g pg/g pg/g pg/g
PCB 77 9.44 8.75 1.7 0.097

Guidance Document on Measurement Uncertainty
Working Group for Measurement Uncertainty in PCDD/F and PCB Analysis - 2017 77
Pork tissue Measured value Certified value*
uCRM
95% CI**
uCRM,rel
PCB 81 0.431 0.679 0.128 0.094
PCB 126 0.422 0.51 0.102 0.100
PCB 169 0.671 0.79 0.22 0.139
PCB 105 49.2 41.7 8.8 0.106
PCB 114 10.1 7.5 5.2 0.347
PCB 118 298 292 32 0.055
PCB 123 3.05 2.84 1.78 0.313
PCB 156 73.9 73.9 11 0.074
PCB 157 7.97 7.57 1.22 0.081
PCB 167 49.5 46.6 5.2 0.056
PCB 189 6.62 6.16 1.06 0.086
WHO-PCB-TEQ 0.132 0.139 0.023 0.083
WHO-PCDD/F-
PCB-TEQ 0.40 0.45 0.08 0.093

Guidance Document on Measurement Uncertainty
Working Group for Measurement Uncertainty in PCDD/F and PCB Analysis - 2017 78
Table C.1.2-3: PCDD/Fs and DL-PCBs measured in an animal fat CRM
Animal fat Measured value Certified value*
uCRM
95% CI**
uCRM,rel
Congeners pg/g pg/g pg/g pg/g
2,3,7,8-TCDD 0.085 0.103 0.016 0.078
1,2,3,7,8-PeCDD 0.107 0.125 0.022 0.088
1,2,3,4,7,8-HxCDD 0.076 0.089 0.016 0.090
1,2,3,6,7,8-HxCDD 0.102 0.1083 0.012 0.055
1,2,3,7,8,9-HxCDD 0.084 0.108 0.028 0.130
1,2,3,4,6,7,8-HpCDD 0.127 0.163 0.032 0.098
OCDD 1.6 2.0 2.1 0.525
2,3,7,8-TCDF 0.58 0.482 0.056 0.058
1,2,3,7,8-PeCDF 0.157 0.141 0.026 0.092
2,3,4,7,8-PeCDF 0.217 0.213 0.024 0.056
1,2,3,4,7,8-HxCDF 0.094 0.103 0.02 0.097
1,2,3,6,7,8-HxCDF 0.099 0.098 0.018 0.092
1,2,3,7,8,9-HxCDF 0.087 0.087 0.018 0.103
2,3,4,6,7,8-HxCDF 0.082 0.096 0.018 0.094
1,2,3,4,6,7,8-HpCDF 0.107 0.124 0.032 0.129
1,2,3,4,7,8,9-HpCDF 0.077 0.09 0.022 0.122
OCDF 0.125 0.166 0.042 0.127
WHO-PCDD/F-TEQ 0.43 0.46 0.07 0.076
Animal fat Measured value Certified value*
uCRM
95% CI**
uCRM,rel
Congeners pg/g pg/g pg/g pg/g
PCB 77 17.3 14.7 2.2 0.075

Guidance Document on Measurement Uncertainty
Working Group for Measurement Uncertainty in PCDD/F and PCB Analysis - 2017 79
Animal fat Measured value Certified value*
uCRM
95% CI**
uCRM,rel
PCB 81 1.67 1.66 0.2 0.060
PCB 126 4.9 5.04 0.6 0.060
PCB 169 1.42 1.59 0.18 0.057
PCB 105 311 302 30 0.050
PCB 114 21 21.8 2.6 0.060
PCB 118 1089 1077 150 0.070
PCB 123 32 19.6 8.6 0.219
PCB 156 164 164 16.2 0.049
PCB 157 24.6 24.8 5.2 0.105
PCB 167 255 132 18.2 0.069
PCB 189 14.5 15.4 2.8 0.091
WHO-PCB-TEQ 0.74 0.77 0.06 0.039
WHO-PCDD/F-
PCB-TEQ 1.18 1.23 0.13 0.053
* Congener values in brackets are not certified
** CRM certificates always provide uCRM as an interval at a level of confidence and not a standard
deviation. At 95% of confidence, uCRM has to be divided by a factor 2.
ubias,CRM,rel is then calculated according to equation 13 through the calculation of RMSbias,CRM
and uCRM,rel (equations 14 and 15). All values are summarized in Table C.1.2-4.

Guidance Document on Measurement Uncertainty
Working Group for Measurement Uncertainty in PCDD/F and PCB Analysis - 2017 80
Table C.1.2-4: Estimation of bias (ubias,CRM,rel) for individual PCDD/F and DL-PCB congeners
and TEQ parameters, using three CRMs - fish tissue, pork tissue and animal fat.
Ubias for several CRMs RMS2bias,CRM u
2CRM,rel ubias,CRM,rel
Congeners
2,3,7,8-TCDD 0.028 0.010 0.194
1,2,3,7,8-PeCDD 0.012 0.005 0.129
1,2,3,4,7,8-HxCDD 0.019 0.009 0.167
1,2,3,6,7,8-HxCDD 0.004 0.002 0.082
1,2,3,7,8,9-HxCDD 0.030 0.014 0.210
1,2,3,4,6,7,8-HpCDD 0.022 0.022 0.209
OCDD 0.015 0.071 0.293
2,3,7,8-TCDF 0.091 0.018 0.330
1,2,3,7,8-PeCDF 0.010 0.014 0.154
2,3,4,7,8-PeCDF 0.006 0.005 0.108
1,2,3,4,7,8-HxCDF 0.016 0.011 0.165
1,2,3,6,7,8-HxCDF 0.006 0.005 0.108
1,2,3,7,8,9-HxCDF 0.002 0.024 0.160
2,3,4,6,7,8-HxCDF 0.017 0.007 0.155
1,2,3,4,6,7,8-HpCDF 0.021 0.024 0.210
1,2,3,4,7,8,9-HpCDF 0.008 0.014 0.147
OCDF 0.020 0.016 0.191
WHO-PCDD/F-TEQ 0.009 0.005 0.120
Ubias for several CRMs RMS2bias,CRM u
2CRM,rel ubias,CRM,rel
Congeners

Guidance Document on Measurement Uncertainty
Working Group for Measurement Uncertainty in PCDD/F and PCB Analysis - 2017 81
Ubias for several CRMs RMS2bias,CRM u
2CRM,rel ubias,CRM,rel
PCB 77 0.014 0.006 0.141
PCB 81 0.048 0.007 0.234
PCB 126 0.011 0.007 0.137
PCB 169 0.012 0.013 0.156
PCB 105 0.018 0.005 0.153
PCB 114 0.214 0.036 0.500
PCB 118 0.002 0.003 0.070
PCB 123 0.137 0.071 0.456
PCB 156 0.000 0.004 0.060
PCB 157 0.001 0.006 0.086
PCB 167 0.296 0.004 0.548
PCB 189 0.003 0.006 0.095
WHO-PCB-TEQ 0.003 0.004 0.082
WHO-PCDD/F-
PCB-TEQ 0.006 0.005 0.102

Guidance Document on Measurement Uncertainty
Working Group for Measurement Uncertainty in PCDD/F and PCB Analysis - 2017 82
C.2 Evaluation of the bias contribution to MU from PT results
C.2.1 Sum parameters
As an example, results for the sum parameter WHO-PCDD/F-PCB-TEQ for six different PT
test samples are shown in table C.2.1-1. Due to the limited number of interlaboratory
comparisons for the analysis of PCDD/Fs and PCBs in different food samples, matrices of the
food subgroups 1.1, 1.2, 1.3 and 1.4 are combined in order to get the required number of six
PT results.
NOTE: The same procedure can be used for intermediate sum parameters like WHO-
PCDD/F-TEQ and WHO-PCB-TEQ. Similarly, the same reasoning could be applied to six
interlaboratory comparisons or PTs for feed samples (group 2, see Annex A).
Table C.2.1-1: Bias contribution of PT results (xa,i: assigned value, uCref,i: uncertainty of
assigned value, uCref,rel,i: rel. uncertainty of assigned value, xi: participant’s result)
PT
matrix
Para-
meter
Unit xa,i uCref,i uCref,rel,i xi biasPT,i biasPT,rel,i |uCref,rel,i /
biasPT,rel,i|
Fish oil WHO-
PCDD/F-
PCB-TEQ
pg/g
fat 9.76 0.14 0.014 10.8 1.04 0.11 0.13
Pork WHO-
PCDD/F-
PCB-TEQ
pg/g
fat 1.42 0.025 0.018 1.15 -0.27 -0.19 0.09
Whole
egg
WHO-
PCDD/F-
PCB-TEQ
pg/g
fat 7.21 0.15 0.021 7.53 0.32 0.04 0.53
Egg
yolk
powder
WHO-
PCDD/F-
PCB-TEQ
pg/g
fat 4.26 0.084 0.020 4.81 0.55 0.13 0.15
Milk
powder
WHO-
PCDD/F-
PCB-TEQ
pg/g
fat 3.93 0.089 0.023 3.70 -0.23 -0.06 0.38
Beef WHO-
PCDD/F-
PCB-TEQ
pg/g
fat 2.53 0.048 0.019 2.31 -0.22 -0.09 0.21
Comparison of uCref,rel,i with biasPT,rel,i for all PT samples:
For the PT matrices, fish oil, pork, egg yolk powder and beef the ratio
|uCref,rel,I / biasPT,rel,i| is below 0.3, for whole egg and milk powder it is above.
Comparison of uCref,rel,i with biasPT,rel,i for the PT samples whole egg and milk powder:

Guidance Document on Measurement Uncertainty
Working Group for Measurement Uncertainty in PCDD/F and PCB Analysis - 2017 83
The comparison with a given fitness-for-purpose-based “standard deviation for
proficiency assessment” σp,rel of 10 % shows that for both PT matrices uCref,rel,i ≤
0.3σp,rel. Therefore all PT results can be included in the evaluation.
Estimation of ubias,PT:
RMSbias,PT for the six PT matrices is calculated according to equation 17:
𝑅𝑀𝑆𝑏𝑖𝑎𝑠,𝑃𝑇 = √(0.11)2+(−0.19)2+(0.04)2+(0.13)2+(−0.06)2+(−0.09)2
6= 0.11 (= 11%)
The average uncertainty of the assigned value uCref is calculated according to equation
18:
𝑢𝐶𝑟𝑒𝑓 = 0.014+0.018+0.021+0.020+0.023+0.019
6= 0.019 (= 1.9 %)
The bias contribution ubias,PT of results from six proficiency test matrices is then given
by equation 16:
𝑢𝑏𝑖𝑎𝑠,𝑃𝑇 = √0.112 + 0.0192 = 0.11 (= 11%)
C.2.2 Individual congeners
The bias contribution to MU for individual congeners is calculated in the same way as for the
sum parameters (see C.2.1). As assigned values are not necessarily provided for all relevant
congeners in every PT test sample, results of more than six PT test samples may be necessary
to get the required number of six PT results for each congener.
Guidance Document on Measurement Uncertainty
Working Group for Measurement Uncertainty in PCDD/F and PCB Analysis - 2017 84
C.3 Evaluation of the bias contribution to MU from fortified
samples
When performing fortification experiments, e.g. within a bias study, the fortification
procedure is associated with an uncertainty ufort. Both the uncertainty of the concentration of
the fortification solution uconc and that of the volume uvol contribute to the uncertainty of the
fortification procedure ufort (equation 20):
𝑢𝑓𝑜𝑟𝑡 = √𝑢𝑐𝑜𝑛𝑐2 + 𝑢𝑣𝑜𝑙
2
The uncertainty of the concentration of the standard solution uconc is obtained directly from
the manufacturer's certificate. In this example, the latter states that the standard solution
contains 50.0 ng 2.3.7.8-TCDD/mL with an uncertainty of ± 0.6 ng/mL at a 95% confidence
level. From 0.6 ng/mL, corresponding to 1.2%, the standard uncertainty of the concentration
is calculated as:
𝑢𝑐𝑜𝑛𝑐 = ± (1.2
2) % = ±0.61%
The uncertainty of the dosed volume uvol is estimated based on the micropipette
manufacturer’s specifications: the maximum random error (repeatability) is sr = 0.5% and the
maximum systematic error (bias) is 1.0%:
𝑢𝑣𝑜𝑙 = √𝑢𝑟,𝑣𝑜𝑙2 + 𝑢𝑏𝑖𝑎𝑠,𝑣𝑜𝑙
2
While sr,vol = ur,vol = 0.5%, the maximum systematic error is converted to a standard deviation
sbias = ubias by assuming a rectangular distribution:
𝑢𝑏𝑖𝑎𝑠,𝑣𝑜𝑙 = ± (1.0
√3) % = ±0.58%
NOTE: For conversion of the bias contribution of the pipetted volume to uncertainty, a
rectangular distribution is assumed according to QUAM:2012.P1, Appendix E1 “Distribution
functions” [EURACHEM/CITAC 2012, /12/], and according to examples in the relevant
literature [Nordtest 2012, /3/; ISO 11352:2012-07 or DIN ISO 11352:2013-03, /4/;
EURACHEM/CITAC 2012, /12/]. However, a triangular distribution may also be assumed in
cases when justified from laboratory experience, e.g. when it is known that the distribution is
symmetrical and values close to the mean are more likely than near the bounds.
Finally, random and systematic errors are combined:
𝑢𝑣𝑜𝑙 = √0.5%2 + 0.58%2 = 0.77%
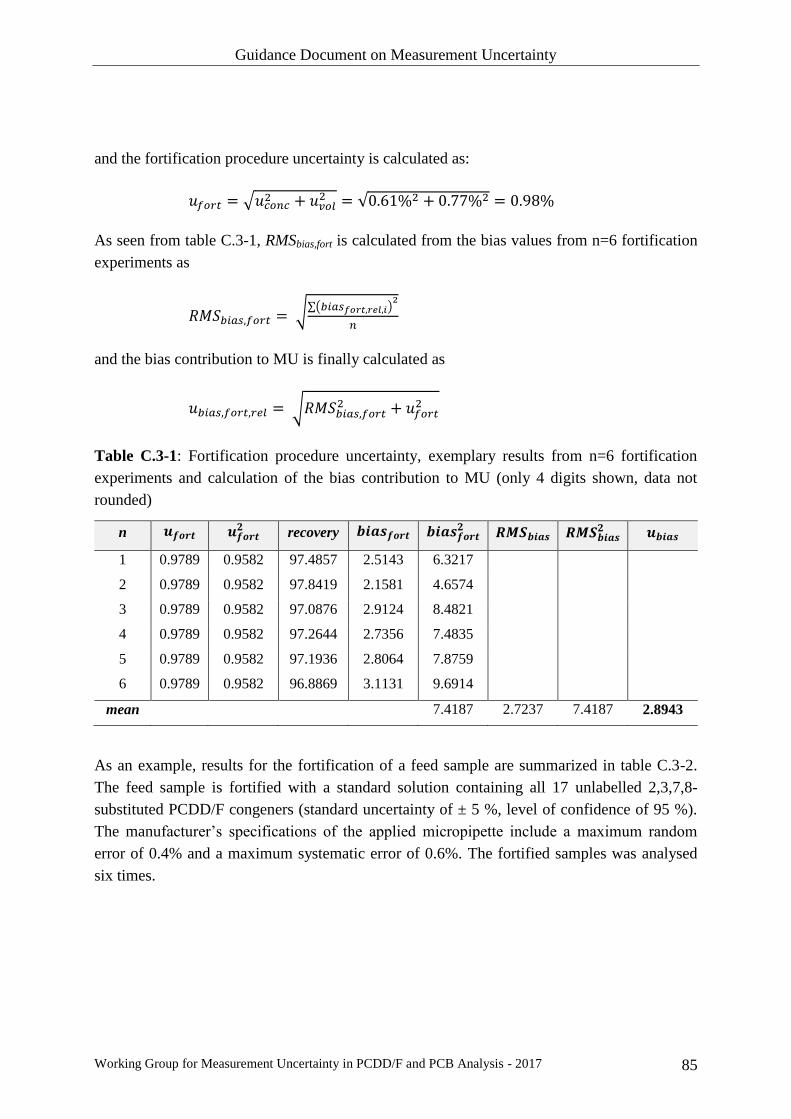
Guidance Document on Measurement Uncertainty
Working Group for Measurement Uncertainty in PCDD/F and PCB Analysis - 2017 85
and the fortification procedure uncertainty is calculated as:
𝑢𝑓𝑜𝑟𝑡 = √𝑢𝑐𝑜𝑛𝑐2 + 𝑢𝑣𝑜𝑙
2 = √0.61%2 + 0.77%2 = 0.98%
As seen from table C.3-1, RMSbias,fort is calculated from the bias values from n=6 fortification
experiments as
𝑅𝑀𝑆𝑏𝑖𝑎𝑠,𝑓𝑜𝑟𝑡 = √∑(𝑏𝑖𝑎𝑠𝑓𝑜𝑟𝑡,𝑟𝑒𝑙,𝑖)2
𝑛
and the bias contribution to MU is finally calculated as
𝑢𝑏𝑖𝑎𝑠,𝑓𝑜𝑟𝑡,𝑟𝑒𝑙 = √𝑅𝑀𝑆𝑏𝑖𝑎𝑠,𝑓𝑜𝑟𝑡2 + 𝑢𝑓𝑜𝑟𝑡
2
Table C.3-1: Fortification procedure uncertainty, exemplary results from n=6 fortification
experiments and calculation of the bias contribution to MU (only 4 digits shown, data not
rounded)
n 𝒖𝒇𝒐𝒓𝒕 𝒖𝒇𝒐𝒓𝒕𝟐 recovery 𝒃𝒊𝒂𝒔𝒇𝒐𝒓𝒕 𝒃𝒊𝒂𝒔𝒇𝒐𝒓𝒕
𝟐 𝑹𝑴𝑺𝒃𝒊𝒂𝒔 𝑹𝑴𝑺𝒃𝒊𝒂𝒔𝟐 𝒖𝒃𝒊𝒂𝒔
1 0.9789 0.9582 97.4857 2.5143 6.3217
2 0.9789 0.9582 97.8419 2.1581 4.6574
3 0.9789 0.9582 97.0876 2.9124 8.4821
4 0.9789 0.9582 97.2644 2.7356 7.4835
5 0.9789 0.9582 97.1936 2.8064 7.8759
6 0.9789 0.9582 96.8869 3.1131 9.6914
mean 7.4187 2.7237 7.4187 2.8943
As an example, results for the fortification of a feed sample are summarized in table C.3-2.
The feed sample is fortified with a standard solution containing all 17 unlabelled 2,3,7,8-
substituted PCDD/F congeners (standard uncertainty of ± 5 %, level of confidence of 95 %).
The manufacturer’s specifications of the applied micropipette include a maximum random
error of 0.4% and a maximum systematic error of 0.6%. The fortified samples was analysed
six times.

Guidance Document on Measurement Uncertainty
Working Group for Measurement Uncertainty in PCDD/F and PCB Analysis - 2017 86
Table C.3-2: Bias contribution for individual PCDD/F congeners of fortification of a feed
sample
Fortified sample Conc. in
sample uconc uvol ufort RMSbias,fort ubias,fort
Congeners
ng/kg
product (12 % moisture
content)
2,3,7,8-TCDD 0.10 2.5 % 0.72 % 2.6 % 5.7% 6.3%
1,2,3,7,8-PeCDD 0.50 2.5 % 0.72 % 2.6 % 2.9% 3.9%
1,2,3,4,7,8-HxCDD 0.50 2.5 % 0.72 % 2.6 % 15.2% 15.4%
1,2,3,6,7,8-HxCDD 0.50 2.5 % 0.72 % 2.6 % 13.8% 14.0%
1,2,3,7,8,9-HxCDD 0.50 2.5 % 0.72 % 2.6 % 5.2% 5.8%
1,2,3,4,6,7,8-HpCDD 0.50 2.5 % 0.72 % 2.6 % 6.6% 7.1%
OCDD 1.0 2.5 % 0.72 % 2.6 % 4.0% 4.8%
2,3,7,8-TCDF 0.10 2.5 % 0.72 % 2.6 % 9.4% 9.8%
1,2,3,7,8-PeCDF 0.50 2.5 % 0.72 % 2.6 % 5.0% 5.6%
2,3,4,7,8-PeCDF 0.50 2.5 % 0.72 % 2.6 % 8.1% 8.5%
1,2,3,4,7,8-HxCDF 0.50 2.5 % 0.72 % 2.6 % 6.1% 6.6%
1,2,3,6,7,8-HxCDF 0.50 2.5 % 0.72 % 2.6 % 4.9% 5.5%
1,2,3,7,8,9-HxCDF 0.50 2.5 % 0.72 % 2.6 % 4.9% 5.5%
2,3,4,6,7,8-HxCDF 0.50 2.5 % 0.72 % 2.6 % 15.8% 16.0%
1,2,3,4,6,7,8-HpCDF 0.50 2.5 % 0.72 % 2.6 % 5.5% 6.1%
1,2,3,4,7,8,9-HpCDF 0.50 2.5 % 0.72 % 2.6 % 9.0% 9.4%
OCDF 1.0 2.5 % 0.72 % 2.6 % 14.9% 15.1%
WHO-PCDD/F-TEQ 1.14

Guidance Document on Measurement Uncertainty
Working Group for Measurement Uncertainty in PCDD/F and PCB Analysis - 2017 87
C.4 Requirements for the uncertainty component of the assigned
value in PTs
If the assigned value from a PT exercise is calculated from the consensus mean of the
participants, its uncertainty is:
𝑢𝐶𝑟𝑒𝑓,𝑖 = 𝑠𝑅,𝑖
√𝑛𝑃,𝑖 Eq. C.1
uCref,i = uncertainty of the assigned value calculated for sample i
sR,i = reproducibility standard deviation among laboratories contributing to calculation of the
assigned value for sample i
nP,i = number of participating laboratories contributing to calculation of the assigned value for
sample i
If the median or a robust estimation method was used to calculate the mean, the uncertainty of
the assigned value is [ISO 13528:2015-08, /11/]:
𝑢𝐶𝑟𝑒𝑓,𝑖 = 1.25 ∙𝑠𝑅,𝑖
√𝑛𝑃,𝑖 Eq. C.2
If other methods were used to determine the assigned values, the PT provider has to be asked
for the respective uncertainty.
Estimating the assigned value as the consensus of participants’ results
The consensus value of the participant’s results is widely used for determination of the
assigned value. Results generated by the majority of participants are assumed to be unbiased
and their dispersion generally has an easily identifiable mode. To derive a most probable
value for the measurand (assigned value) the central tendency of the results, represented,
(outliers aside) e.g. by the mode, the median, or a robust mean is evaluated together with its
standard error being used as an estimate of its uncertainty. Consensus values are often very
close to reliable reference values provided by formulation (addition of a known amount of
analyte), expert laboratory consensus, and by reference values from CRMs or from reference
laboratories [IUPAC 2006, /15/].
Main disadvantages of participant consensus values are:
- they are dependent on the participants’ methods and results, and
- their uncertainty may be too large if the number of laboratories is small.
The lack of independence has two potential effects [IUPAC 2006, /15/]:

Guidance Document on Measurement Uncertainty
Working Group for Measurement Uncertainty in PCDD/F and PCB Analysis - 2017 88
- the bias for the population as a whole may not easily be detected, as the assigned value
will follow the population;
- if the majority of results are biased, participants whose results are unbiased may
unfairly receive extreme z-scores.
Criteria for uCref associated with the assigned value from PTs
Moreover, the assigned value may, in principle, be defined by the method used. During a PT,
a variety of analytical methods may be applied by the participants some of which produce
more or less biased results. This might lead to an undesirably wide overall distribution of the
results and thus a comparably large uncertainty uCref of the assigned value xa. uCref is therefore
compared with the PT-specific fitness-for-purpose-based “standard deviation for proficiency
assessment” σp. If uCref ≤ 0.3σp, then the standard uncertainty uCref of the assigned value is
negligible and does not need to be included in the interpretation of the results of the
proficiency test [EURACHEM 2011, /16/].
When used for MU assessment in participating laboratories, the assigned value together with
its uncertainty may lead to an unduly high contribution to MU, making it desirable to define a
maximum acceptable value for uCref.
If there is an uncertainty uCref in the assigned value xa to be used for uncertainty assessment,
the uncertainty component for the bias ubias is calculated as:
𝑢𝑏𝑖𝑎𝑠,𝑃𝑇,𝑟𝑒𝑙 = √𝑅𝑀𝑆𝑏𝑖𝑎𝑠,𝑃𝑇2 + 𝑢𝐶𝑟𝑒𝑓,𝑟𝑒𝑙
2 Eq. C.3
𝑅𝑀𝑆𝑏𝑖𝑎𝑠,𝑃𝑇 = √∑(𝑏𝑖𝑎𝑠𝑃𝑇,𝑟𝑒𝑙,𝑖)2
𝑛 Eq. C.4
𝑢𝐶𝑟𝑒𝑓,𝑟𝑒𝑙 = 𝑚𝑒𝑎𝑛(𝑢𝐶𝑟𝑒𝑓,𝑟𝑒𝑙,𝑖) Eq. C.5
n = number of samples (n = 1, 2, … i) from interlaboratory studies
If, for example, uCref does not exceed 0.3RMSbias, the maximum resulting dilation factor for
ubias would be as small as 1.04:
𝑢𝑏𝑖𝑎𝑠 = √(0.3 ∙ 𝑅𝑀𝑆𝑏𝑖𝑎𝑠)2 + 𝑅𝑀𝑆𝑏𝑖𝑎𝑠2 = √1.09 ∙ 𝑅𝑀𝑆𝑏𝑖𝑎𝑠
2 = 1.04 ∙ 𝑅𝑀𝑆𝑏𝑖𝑎𝑠 Eq. C.6
Therefore, if the assigned value and its uncertainty are used to assess MU of an individual
laboratory, it seems acceptable to require that uCref shall not exceed 30% of RMSbias,PT:
Guidance Document on Measurement Uncertainty
Working Group for Measurement Uncertainty in PCDD/F and PCB Analysis - 2017 89
𝑢𝐶𝑟𝑒𝑓
𝑅𝑀𝑆𝑏𝑖𝑎𝑠,𝑃𝑇≤ 0.3 Eq. C.7
For assessment of the results of a single sample i of an interlaboratory study equation C.7 is
adapted as:
|𝑢𝐶𝑟𝑒𝑓,𝑟𝑒𝑙,𝑖
𝑏𝑖𝑎𝑠𝑃𝑇,𝑟𝑒𝑙,𝑖| ≤ 0.3 Eq. C.8
uCref,rel,i: uncertainty of the assigned value calculated for sample i
biasPT,rel,i: relative basis calculated for sample i
For some analytes biasPT,rel,i may be smaller than σp,rel and therefore in the range of uCref,rel,i.
As a consequence the ratio of uCref,rel,i and biasPT,rel,i may be above 0.3.
In these cases a higher contribution of uCref,rel,i might also be acceptable provided that
uCref,rel,i ≤ 0.3σp,rel.
σp,rel: fitness-for-purpose-based “standard deviation for proficiency assessment” expressed as
relative standard deviation

Guidance Document on Measurement Uncertainty
Working Group for Measurement Uncertainty in PCDD/F and PCB Analysis - 2017 90
Annex D – Evaluation of contributions from current performance
D.1 Evaluation of contributions to MU from LOQs and procedural
blanks
Contributions from LOQs and procedural blanks to MU are calculated by combining the
combined standard uncertainty uc,i with the actual limit of quantification (LOQ) of the
respective congener in the sample or the procedural blank of the relevant sample batch
(equations 25 and 26).
Table D.1-1: Calculation of MU from the combined standard uncertainty uc,i and contributions
of LOQ and procedural blank
Beef sample uc,i Concentra
tion xi
LOQi from
sample
LOQi from
procedural
blank
uc,i(LOQ) Ui(LOQ)
Congener pg/g fat pg/g fat pg/g fat
2,3,7,8-TCDD 9% 0.11 0.04 0.06 55% 110%
1,2,3,7,8-PeCDD 8% 0.44 0.07 0.06 18% 36%
1,2,3,4,7,8-HxCDD 15% 0.53 0.01 0.03 16% 32%
1,2,3,6,7,8-HxCDD 7% 1.30 0.06 0.05 8% 16%
1,2,3,7,8,9-HxCDD 9% 0.29 0.03 0.04 16% 32%
1,2,3,4,6,7,8-HpCDD 19% 4.81 0.08 0.18 19% 38%
OCDD 19% 5.43 0.25 0.90 25% 50%
2,3,7,8-TCDF 5% 0.41 0.05 0.09 23% 46%
1,2,3,7,8-PeCDF 7% 0.28 0.06 0.04 23% 46%
2,3,4,7,8-PeCDF 8% 1.27 0.12 0.07 12% 24%
1,2,3,4,7,8-HxCDF 7% 0.43 0.06 0.03 16% 32%
1,2,3,6,7,8-HxCDF 6% 0.57 0.05 0.02 11% 22%
1,2,3,7,8,9-HxCDF 16% 0.42 0.02 0.03 18% 36%
2,3,4,6,7,8-HxCDF 5% < 0.02 0.02 0.03 150% 300%
1,2,3,4,6,7,8-HpCDF 10% 0.65 0.02 0.05 13% 26%

Guidance Document on Measurement Uncertainty
Working Group for Measurement Uncertainty in PCDD/F and PCB Analysis - 2017 91
Beef sample uc,i Concentra
tion xi
LOQi from
sample
LOQi from
procedural
blank
uc,i(LOQ) Ui(LOQ)
1,2,3,4,7,8,9-HpCDF 20% < 0.05 0.05 0.04 102% 204%
OCDF 23% 0.12 0.08 0.11 95% 190%
WHO-PCDD/F-TEQ 8 % 16 %
The concentrations of the individual congeners in the beef sample are compared with LOQs
individually calculated for this sample (based on signal-to-noise ratio or on calibration) and
the LOQs or levels expressed as LOQ from the associated procedural blanks. The respective
higher LOQs are used for calculation of the combined uncertainty uc,i(LOQ).
The combined uncertainty for the sum parameter WHO-PCDD/F-TEQ is calculated from the
combined uncertainties of the individual congeners according to equation 38.

Guidance Document on Measurement Uncertainty
Working Group for Measurement Uncertainty in PCDD/F and PCB Analysis - 2017 92
Annex E – Conversion of Specifications to Standard Uncertainties
E.1 Standard uncertainties from assumed distributions
Sources of uncertainty that influence the measurement process but cannot be assessed by
statistical evaluation require alternative strategies. So-called Type B estimates of uncertainty
[GUM 2008, /1/] are often based on information given in different forms, e.g. in the form of
limits or confidence intervals (Table E.1-1).
Table E.1-1: Calculation of a standard uncertainty from the parameters of the most important
distribution functions [EURACHEM/CITAC 2012, /12/].
Probability
distribution Form Use when: Uncertainty
Rectangular
distribution
- A certificate or specification gives
limits without specifying a level of
confidence (e.g. 25 mL ± 0.05 mL).
- An estimate is made in the form of a
maximum range (± a) with no know-
ledge of the shape of the distribution.
𝑢 =1
√3𝑎
Triangular
distribution
- Values close to x are more likely
than near the bounds.
- An estimate is made in the form of a
maximum range (±a) described by a
symmetric distribution.
𝑢 =1
√6𝑎
Normal
distribution
- An estimate is made from repeated
observations of a randomly varying
process.
- An uncertainty is given in the form
of a standard deviation s, a relative
standard deviation s/x , or a percen-
tage coefficient of variance % CV,
without specifying the distribution.
- An uncertainty is given in the form
of a 95.4 % (or 99.7%) confidence
interval x±a without specifying the
distribution.
𝑢 = 𝑠
𝑢 = 𝑠
𝑢 = 𝑥 ∙ 𝑠/�̅�
𝑢 =%𝐶𝑉
100∙ 𝑥
𝑢 =𝑎
2
for a at 95.4%
𝑢 =𝑎
3
for a at 99.7%

Guidance Document on Measurement Uncertainty
Working Group for Measurement Uncertainty in PCDD/F and PCB Analysis - 2017 93
E.2 Practical examples
Example 1: Standard uncertainty estimation from a calibration certificate
The calibration certificate for an instrument states the measurement uncertainty over its
range of calibration as ±0.1% at a 95% confidence level. The latter can be assumed to be
equivalent to the standard uncertainty u being expressed with a coverage factor of k 2:
𝑢 = ± (0.1
2) % = ±0.05 % of the reading.
Example 2: Standard uncertainty estimation from the certified value of a CRM
Uncertainties of CRMs are usually expressed as expanded uncertainties U. It is important to
know how U was calculated so that it can be converted back to a standard uncertainty u:
𝑢 = 𝑈
𝑘
Example 3: Standard uncertainty estimation from a manufacturer's specification
The manufacturing tolerance of a 25 mL Class A glass pipette is ±0.03 mL without indication
of the distribution or the level of confidence. We may assume that values could occur
anywhere within the tolerance range with equal probability (rectangular distribution):
𝑢 = ± (0.03
√3) 𝑚𝐿 = ±0.017 𝑚𝐿
If additional information is available leading us to the conclusion that values closer to the
centre are more likely than values at its extremes, a triangular distribution may be assumed:
𝑢 = ± (0.03
√6) 𝑚𝐿 = ±0.012 𝑚𝐿
Example 4: Standard uncertainty estimation from the purity of a compound
The purity of a compound is given by the supplier as 99.9% ±0.1%, without any indication of
the distribution or the level of confidence. We may assume that values could occur anywhere
within the tolerance range with equal probability, and thus a rectangular distribution:
𝑢 = ± (0.1
√3) % = ±0.06 %
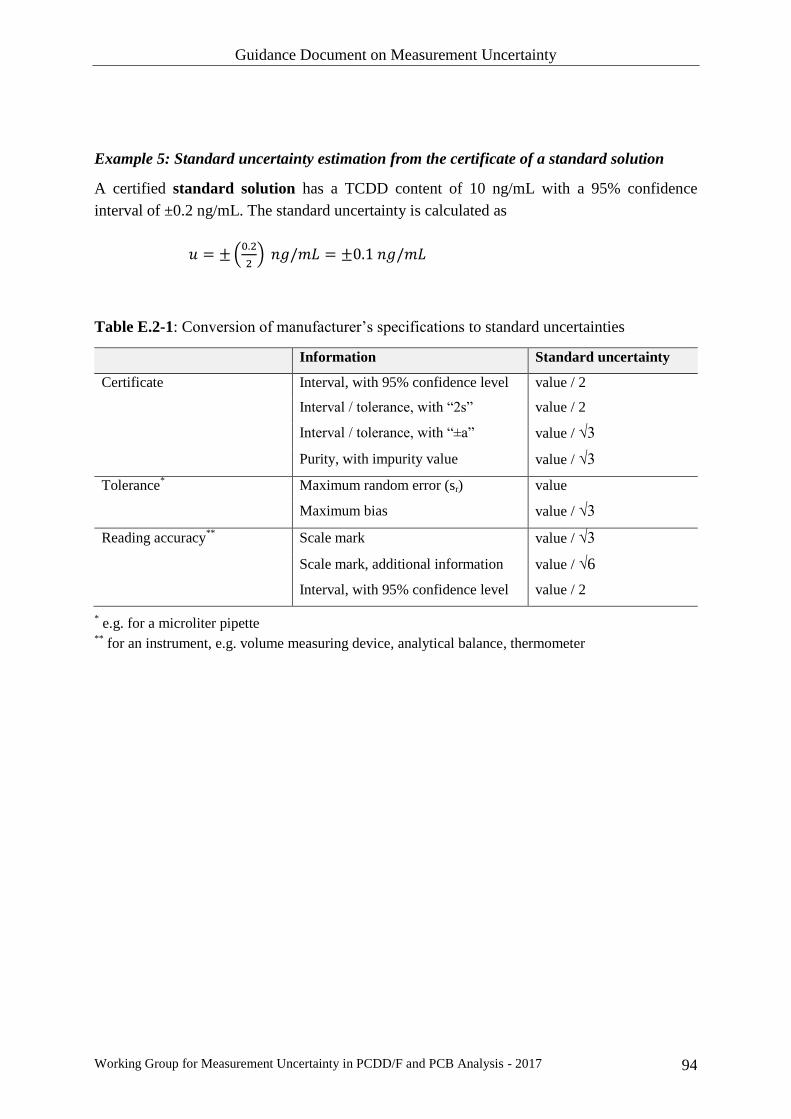
Guidance Document on Measurement Uncertainty
Working Group for Measurement Uncertainty in PCDD/F and PCB Analysis - 2017 94
Example 5: Standard uncertainty estimation from the certificate of a standard solution
A certified standard solution has a TCDD content of 10 ng/mL with a 95% confidence
interval of ±0.2 ng/mL. The standard uncertainty is calculated as
𝑢 = ± (0.2
2) 𝑛𝑔/𝑚𝐿 = ±0.1 𝑛𝑔/𝑚𝐿
Table E.2-1: Conversion of manufacturer’s specifications to standard uncertainties
Information Standard uncertainty
Certificate Interval, with 95% confidence level value / 2
Interval / tolerance, with “2s” value / 2
Interval / tolerance, with “±a” value / √3
Purity, with impurity value value / √3
Tolerance* Maximum random error (sr) value
Maximum bias value / √3
Reading accuracy**
Scale mark value / √3
Scale mark, additional information value / √6
Interval, with 95% confidence level value / 2
* e.g. for a microliter pipette
** for an instrument, e.g. volume measuring device, analytical balance, thermometer

Guidance Document on Measurement Uncertainty
Working Group for Measurement Uncertainty in PCDD/F and PCB Analysis - 2017 95
Annex F – Combined Uncertainty in TEQ
from Individual Congeners
Four different approaches were compared based on authentic quality control data obtained
from several of the author’s laboratories:
1. The square Root of the Sum of Squares (RSS)
𝑢𝑐(𝑇𝐸𝑄 = 𝑇𝐸𝐹1 ∙ 𝑢𝑐1 + ⋯ + 𝑇𝐸𝐹29 ∙ 𝑢𝑐29) = √∑ (𝑇𝐸𝐹𝑖 ∙ 𝑢𝑐𝑖)229𝑖=1 Eq. F.1
2. The SUM
𝑢𝑐(𝑇𝐸𝑄 = 𝑇𝐸𝐹1 ∙ 𝑢𝑐1+. . . +𝑇𝐸𝐹29 ∙ 𝑢𝑐29) = ∑ (𝑇𝐸𝐹𝑖 ∙ 𝑢𝑐𝑖)29𝑖=1 Eq. F.2
3. The MEAN of (𝑇𝐸𝐹𝑖 ∙ 𝑢𝑐𝑖)𝑖=𝑐𝑜𝑛𝑔𝑒𝑛𝑒𝑟
4. The MEDIAN of (𝑇𝐸𝐹𝑖 ∙ 𝑢𝑐𝑖)𝑖=𝑐𝑜𝑛𝑔𝑒𝑛𝑒𝑟
Evaluation of the formula for approaches 1 and 2 is given below:
A general equation for uncertainty propagation is given by equation F.3 where a covariance
term appears in the second term of the square root [GUM 2008, /1/] reflecting the degree of
dependence between the variables (i.e the congener concentration):
, Eq. F.3
with a correlation coefficient:
where -1≤ r(xi,xj) ≤ 1 Eq. F.4
From equation F.3, three cases may, in principle, be distinguished, in which r takes the values
0, +1, or -1.
If the variables are considered independent (r = 0) the combined uncertainty can be calculated
as the root of the sum of squares (RSS), applying the following rules:
Eq. F.5
Eq. F.6
N
i
N
i
N
ij
jijijiiic xxrxuxuccxucyu1
1
1 1
22 ),()()(2)()(
)()(
),(),(
ji
ji
jixuxu
xxuxxr
)()()( 2
2
1
2
21 xuxuxxuc
2
2
2
2
2
1
1
2
2121
)()()()(
x
xu
x
xuxxxxuc

Guidance Document on Measurement Uncertainty
Working Group for Measurement Uncertainty in PCDD/F and PCB Analysis - 2017 96
Eq. F.7
When the variables are assumed to be highly positively correlated (r = +1), equation F.3 may
again be simplified to yield a linear combination of uncertainties (SUM approach).
Eq. F.8
Thirteen different matrices corresponding to more than 16 000 individual congener-based
results were taken into account. The levels are within the working range including
concentrations below and above the maximum limits.
The TEQ-based standard uncertainties uc, given as empirical standard deviations (in TEQs),
are plotted against the TEQ-based standard uncertainties calculated from each congener
according to the four approaches mentioned above. The figures below show that in the
MEDIAN and MEAN approaches, calculated TEQ-values clearly underestimate the empirical
TEQ-values for PCDD/Fs (figure F-1), for DL-PCBs (figure F-2) and for the sum of
PCDD/Fs and DL-PCBs (figure F-3).
The SUM approach overestimates the empirical values for the three parameters, while the
RSS approach underestimates the experimental standard deviations only slightly for DL-PCBs
(figure F-2) and for the sum of PCDD/Fs and DL-PCBs (figure F-3), although it is more
pronounced for PCDD/Fs (figure F-1), as can be seen by comparing the different slopes of
regression lines.
In the RSS approach the calculated data fit best with empirical data.
2
2
2
2
2
1
1
2
1
2
2
1 )()(
x
xu
x
xu
x
x
x
xuc
N
i
iic xucyu1
)]([)(

Guidance Document on Measurement Uncertainty
Working Group for Measurement Uncertainty in PCDD/F and PCB Analysis - 2017 97
Figure F-1: Empirical SD in TEQ versus recalculated SD in TEQ by four different
approaches for PCDD/Fs
Figure F-2: Empirical SD in TEQ versus recalculated SD in TEQ by four different
approaches for DL-PCBs

Guidance Document on Measurement Uncertainty
Working Group for Measurement Uncertainty in PCDD/F and PCB Analysis - 2017 98
Figure F-3: Empirical SD in TEQ versus recalculated SD in TEQ by four different
approaches for the SUM of PCDD/Fs and DL-PCBs

Guidance Document on Measurement Uncertainty
Working Group for Measurement Uncertainty in PCDD/F and PCB Analysis - 2017 99
Annex G – Evaluation of Participant’s Performance:
z- and zeta-Scores
Participants’ z-scores and zeta-scores can serve as a tool to check laboratory performance in a
proficiency test and the validity of the reported measurement uncertainty. Z-scores and zeta-
scores are calculated according to Equation 39 and 40.
Table G-1 shows the assigned value for an analyte, the applied standard deviation for
proficiency assessment that is used for calculation of the z-scores and the relative and
absolute uncertainty of the assigned value. Table G-2 summarizes results of three participants
(A, B, C) for reported values, expanded uncertainty U, the relative and absolute standard
uncertainty u and calculated z-scores and zeta-scores.
For participant A, the z-score of -1.0 shows satisfactory performance, whereas the zeta-score
of -4.0 – reflecting a possible underestimation of the measurement uncertainty – should be
considered as an action signal indicating that further refinement of reported the measurement
uncertainty may be required. For participant B, z-scores and zeta-scores are within the
acceptable range indicating satisfactory performance and suitable measurement uncertainty
representing laboratory performance.
A higher measurement uncertainty as reported by participant C can result in acceptable zeta-
scores, but too high z-scores. In this case the high measurement uncertainty possibly reflects
the performance of the applied method, but the method does not meet the performance criteria
and therefore needs to be adjusted.
In case “action signals” or “warning signals” are obtained for z-scores and/or zeta-scores in
successive proficiency tests, further investigation is required.
Table G-1: Assigned value
Assigned value
xa
Standard deviation for proficiency
assessment σp
Uncertainty of assigned value uCref
pg/g % pg/g % pg/g
10 20 2.0 3.0 0.30

Guidance Document on Measurement Uncertainty
Working Group for Measurement Uncertainty in PCDD/F and PCB Analysis - 2017 100
Table G-2: Participants’ results
Participant A Participant B Participant C
Reported value x pg/g 8.0 12 16
Expanded uncertainty U
(coverage factor k = 2)
% 10 20 40
Standard uncertainty u % 5.0 10 20
Standard uncertainty u pg/g 0.40 1.2 3.2
Z-score -1.0 1.0 3.0
Zeta-score -4.0 1.6 1.9
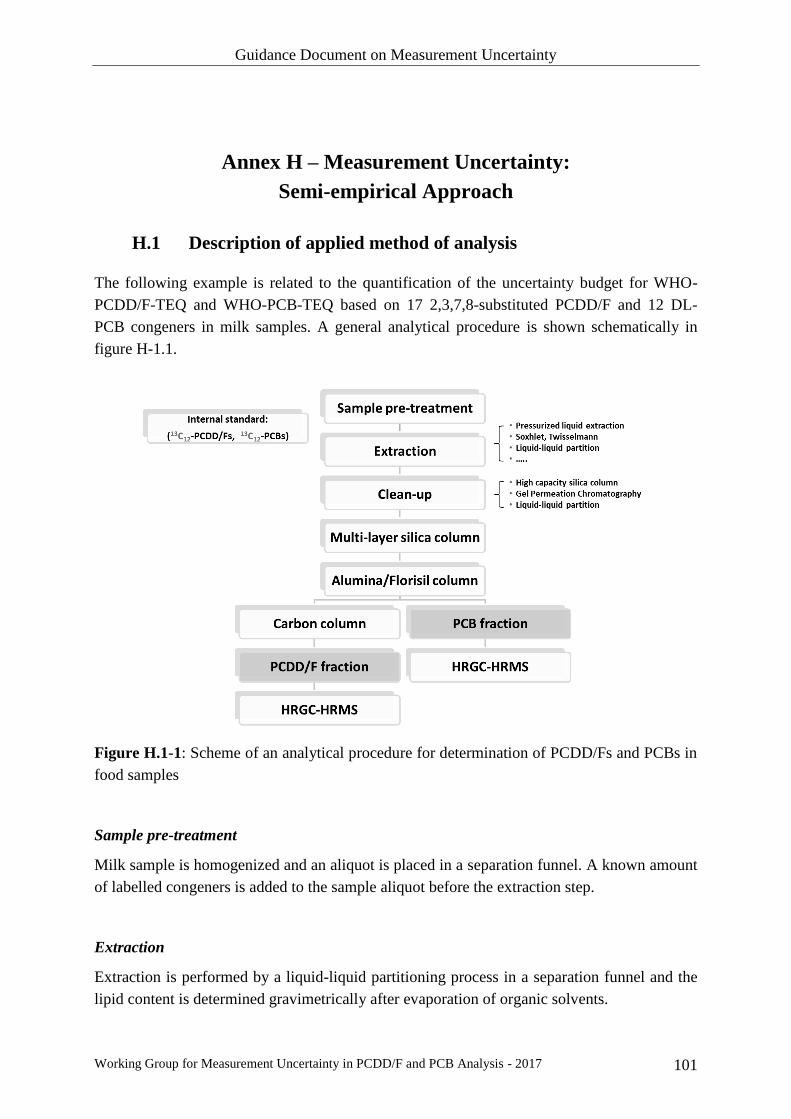
Guidance Document on Measurement Uncertainty
Working Group for Measurement Uncertainty in PCDD/F and PCB Analysis - 2017 101
Annex H – Measurement Uncertainty:
Semi-empirical Approach
H.1 Description of applied method of analysis
The following example is related to the quantification of the uncertainty budget for WHO-
PCDD/F-TEQ and WHO-PCB-TEQ based on 17 2,3,7,8-substituted PCDD/F and 12 DL-
PCB congeners in milk samples. A general analytical procedure is shown schematically in
figure H-1.1.
Figure H.1-1: Scheme of an analytical procedure for determination of PCDD/Fs and PCBs in
food samples
Sample pre-treatment
Milk sample is homogenized and an aliquot is placed in a separation funnel. A known amount
of labelled congeners is added to the sample aliquot before the extraction step.
Extraction
Extraction is performed by a liquid-liquid partitioning process in a separation funnel and the
lipid content is determined gravimetrically after evaporation of organic solvents.
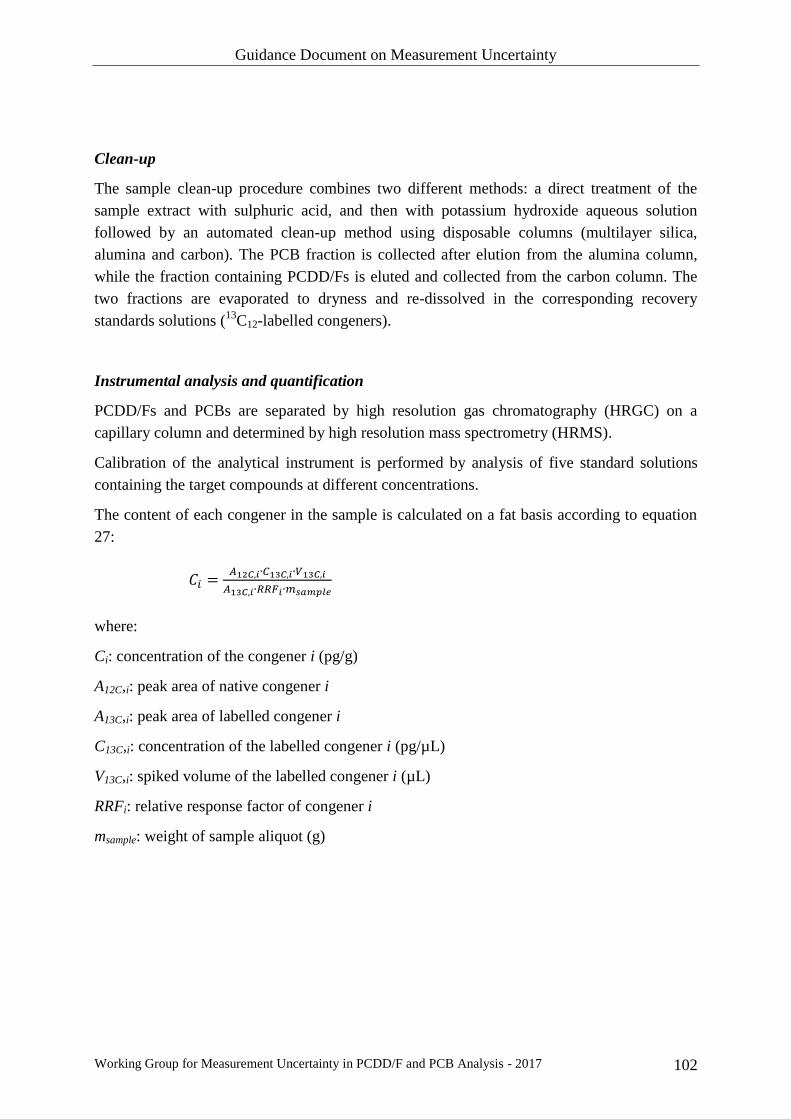
Guidance Document on Measurement Uncertainty
Working Group for Measurement Uncertainty in PCDD/F and PCB Analysis - 2017 102
Clean-up
The sample clean-up procedure combines two different methods: a direct treatment of the
sample extract with sulphuric acid, and then with potassium hydroxide aqueous solution
followed by an automated clean-up method using disposable columns (multilayer silica,
alumina and carbon). The PCB fraction is collected after elution from the alumina column,
while the fraction containing PCDD/Fs is eluted and collected from the carbon column. The
two fractions are evaporated to dryness and re-dissolved in the corresponding recovery
standards solutions (13
C12-labelled congeners).
Instrumental analysis and quantification
PCDD/Fs and PCBs are separated by high resolution gas chromatography (HRGC) on a
capillary column and determined by high resolution mass spectrometry (HRMS).
Calibration of the analytical instrument is performed by analysis of five standard solutions
containing the target compounds at different concentrations.
The content of each congener in the sample is calculated on a fat basis according to equation
27:
𝐶𝑖 =𝐴12𝐶,𝑖∙𝐶13𝐶,𝑖∙𝑉13𝐶,𝑖
𝐴13𝐶,𝑖∙𝑅𝑅𝐹𝑖∙𝑚𝑠𝑎𝑚𝑝𝑙𝑒
where:
Ci: concentration of the congener i (pg/g)
A12C,i: peak area of native congener i
A13C,i: peak area of labelled congener i
C13C,i: concentration of the labelled congener i (pg/µL)
V13C,i: spiked volume of the labelled congener i (µL)
RRFi: relative response factor of congener i
msample: weight of sample aliquot (g)
Guidance Document on Measurement Uncertainty
Working Group for Measurement Uncertainty in PCDD/F and PCB Analysis - 2017 103
H.2 Estimation of measurement uncertainty
The identification of all relevant uncertainty sources for such a complex analytical procedure
is done in accordance with chapter 8, considering precision data, recovery data and other
parameters not sufficiently covered by these two estimates.
In this example, all standards are purchased as certified solutions. The same calibration curve
is used throughout the intermediate precision study and, in addition, a calibration verification
procedure is performed for each analytical batch using an independent calibration verification
standard. Finally, commercial “ready to use” standard solutions are used to calculate the
Relative Response Factors (RRFs).
As an example, only the congener 1,2,3,7,8-PeCDD is described in detail, and the same
procedure is then applied to the rest of PCDD/F and DL-PCB congeners.
H.2.1 Intermediate precision uncertainty
The uncertainty associated with the intermediate precision (uRw) is calculated as the standard
deviation of n test results obtained from the precision study during method validation.
A milk sample with a low level of contamination is fortified with a mixture of PCDD/F
congeners at three different concentration levels (corresponding to 1.1 – 2.3 – 3.4 pg WHO-
TEQ/g fat). Six replicate samples are prepared at each level for a total of eighteen test
samples. These samples are analysed under intermediate precision conditions. Analytical
results are expressed as concentration and recovery percentage with respect to the fortified
amount of native congeners. The mean value and standard deviation for each level are then
calculated. Homoscedasticity (homogeneity of variances) is verified over the concentration
range of interest.
Therefore, all recovery results are pooled and a single relative standard deviation value is
calculated using a pooled relative intermediate standard deviation sRw,pool,rel according to
equations 7 and 8 reported in chapter 6.1.
The relative intermediate precision contribution to uncertainty uRw,rel may be calculated as
uRw,rel = sRw,pool,rel
If there is no evidence to indicate that the uncertainties at different levels are comparable, a
separate uncertainty estimates for each level would be required.
As an example, the results obtained for 1,2,3,7,8-PeCDD are summarized in Table H.2.1-1.
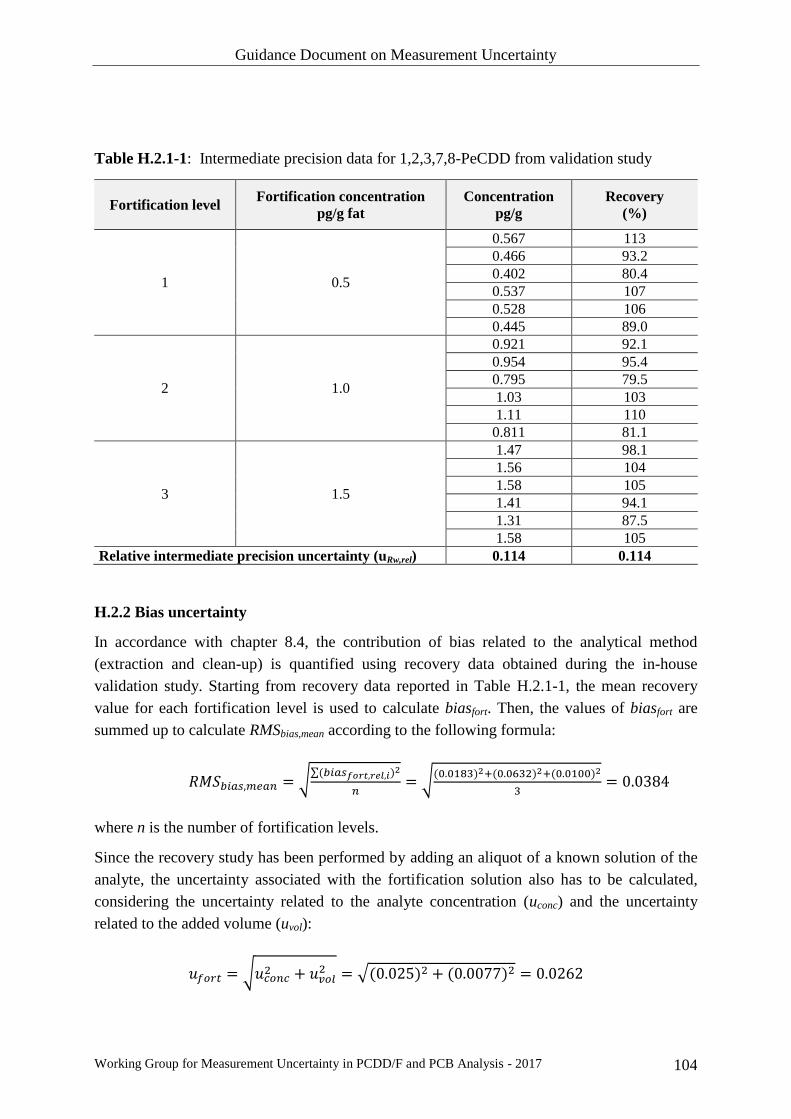
Guidance Document on Measurement Uncertainty
Working Group for Measurement Uncertainty in PCDD/F and PCB Analysis - 2017 104
Table H.2.1-1: Intermediate precision data for 1,2,3,7,8-PeCDD from validation study
Fortification level Fortification concentration
pg/g fat
Concentration
pg/g
Recovery
(%)
1 0.5
0.567 113
0.466 93.2
0.402 80.4
0.537 107
0.528 106
0.445 89.0
2 1.0
0.921 92.1
0.954 95.4
0.795 79.5
1.03 103
1.11 110
0.811 81.1
3 1.5
1.47 98.1
1.56 104
1.58 105
1.41 94.1
1.31 87.5
1.58 105
Relative intermediate precision uncertainty (uRw,rel) 0.114 0.114
H.2.2 Bias uncertainty
In accordance with chapter 8.4, the contribution of bias related to the analytical method
(extraction and clean-up) is quantified using recovery data obtained during the in-house
validation study. Starting from recovery data reported in Table H.2.1-1, the mean recovery
value for each fortification level is used to calculate biasfort. Then, the values of biasfort are
summed up to calculate RMSbias,mean according to the following formula:
𝑅𝑀𝑆𝑏𝑖𝑎𝑠,𝑚𝑒𝑎𝑛 = √∑(𝑏𝑖𝑎𝑠𝑓𝑜𝑟𝑡,𝑟𝑒𝑙,𝑖)2
𝑛= √
(0.0183)2+(0.0632)2+(0.0100)2
3= 0.0384
where n is the number of fortification levels.
Since the recovery study has been performed by adding an aliquot of a known solution of the
analyte, the uncertainty associated with the fortification solution also has to be calculated,
considering the uncertainty related to the analyte concentration (uconc) and the uncertainty
related to the added volume (uvol):
𝑢𝑓𝑜𝑟𝑡 = √𝑢𝑐𝑜𝑛𝑐2 + 𝑢𝑣𝑜𝑙
2 = √(0.025)2 + (0.0077)2 = 0.0262

Guidance Document on Measurement Uncertainty
Working Group for Measurement Uncertainty in PCDD/F and PCB Analysis - 2017 105
Calculations details are reported in points H.2.5 and H.2.6 of this annex.
The ubias,rel value is finally obtained:
𝑢𝑏𝑖𝑎𝑠,𝑟𝑒𝑙 = √𝑅𝑀𝑆𝑏𝑖𝑎𝑠,𝑚𝑒𝑎𝑛2 + 𝑢𝑓𝑜𝑟𝑡
2 = √(0.0384)2 + (0.0262)2 = 0.0465
H.2.3 Calibration curve uncertainty
Full calibration (Option 1)
If a full calibration is performed for each analytical batch, the standard deviation of the mean
RRF of a congener represents the uncertainty contribution related to calibration (see
paragraph 8.5.1).
The amount of 1,2,3,7,8-PeCDD is calculated using a ready to use multi-level calibration
curve. For this purpose, five calibration standards (0.1 – 0.5 – 2.0 – 10 - 50 ng/mL) are
injected and RRF values, average RRFs and relative standard deviations are calculated.
The calibration curve linearity uncertainty component (ucal) relies on the variation of RRFs
among the five points of the calibration curve. This uncertainty component is calculated as the
standard deviation of RRFs divided by the square root of the number of calibration points.
In this example, an experimental value of the standard deviation of RRF for 1,2,3,7,8-PeCDD
equal to 9.05 % is calculated, the corresponding uncertainty is:
𝑢𝑐𝑎𝑙,𝑟𝑒𝑙 =𝑠𝑅𝑅𝐹,𝑟𝑒𝑙
√𝑛=
0.0905
√5= 0.0405
Calibration point check (Option 2)
The calibration curve drift uncertainty component (ud) has to be taken into account only when
a calibration verification procedure is adopted by the laboratory (see paragraph 8.5.2).
For a batch of samples, a calibration standard is periodically analysed to ensure that the
instrument response does not drift significantly. According to the in-house method, if a drift
above 15% is observed, then a new complete calibration is necessary and the samples are re-
analysed. A term representing the uncertainty due to this maximum permitted drift also needs
to be included in the budget.
Since there is no evidence of lower probability towards the extremes of the acceptable values
range this can be treated as a rectangular distribution and divided by root square of 3 to obtain
the standard uncertainty associated with instrument drift.
Guidance Document on Measurement Uncertainty
Working Group for Measurement Uncertainty in PCDD/F and PCB Analysis - 2017 106
The example shows the calibration drift uncertainty calculated for 1,2,3,7,8 PeCDD using a
maximum acceptable value of 15% and considering a rectangular distribution:
𝑢𝑑,𝑟𝑒𝑙 =0.15
√3= 0.0866
H.2.4 Volume uncertainty
The volume uncertainty (uv) is related to the glassware (e.g. volumetric flasks, cylinders,
pipettes) and micropipettes used to prepare standard solutions and for internal standard
addition to the sample.
In the following example, a volume of 250 L of labelled compound solution is diluted to 10
mL to prepare an internal standard solution at a concentration of 5 ppb. A 10 mL volumetric
flask and a 250 L variable volume micropipette are used.
For the volumetric flask, the certificate of the manufacturer gives a tolerance of ± 0.04 mL.
The corresponding uncertainty is calculated assuming a rectangular distribution expecting that
all values in the range are equally likely:
𝑢𝑣1 =40
√3= 23.1
The relative standard uncertainty is: 𝑢𝑣1,𝑟𝑒𝑙 =23.1
10000= 0.00231
From the micropipette calibration certificate, a maximum value for systematic error of ± 2 L
is deduced. The corresponding uncertainty is calculated assuming a rectangular distribution:
𝑢𝑣2 =2
√3= 1.15
The relative standard uncertainty is:
𝑢𝑣2,𝑟𝑒𝑙 =1.15
250= 0.00460
Finally, a 10-100 L variable volume micropipette is used to add 40 L of internal standard
solution to the sample. From the micropipette calibration certificate, a maximum value for
systematic error of ± 0.8 L is deduced. The corresponding uncertainty is calculated assuming
a rectangular distribution:
𝑢𝑣3 =0.8
√3= 0.462
Guidance Document on Measurement Uncertainty
Working Group for Measurement Uncertainty in PCDD/F and PCB Analysis - 2017 107
The relative standard uncertainty is:
𝑢𝑣3,𝑟𝑒𝑙 =0.462
40= 0.0116
The three contributions are combined to give the standard uncertainty associated with the
volume of internal standard added to the sample:
𝑢𝑣,𝑟𝑒𝑙 = √(0.00231)2 + (0.00460)2 + (0.0116)2 = 0.0127
H.2.5 Standard solution concentration uncertainty
This contribution is associated with the labelled standard solution concentration used in the
analytical method.
From the analytical certificate of labelled compounds solution, a standard uncertainty equal to
± 5% (calculated with a coverage factor of 2 and a level of confidence of 95%) is deduced.
The standard uncertainty is calculated dividing the expanded uncertainty by the coverage
factor:
𝑢𝑠𝑡,𝑟𝑒𝑙 =0.050
2= 0.025
H.2.6 Sample weighing
The weighing uncertainty (uw) is calculated assuming a rectangular distribution for the
analytical balance. The calibration certificate of the balance quotes ± 0.30 mg for the linearity,
the relative uncertainty is obtained dividing uw by the sample weight (5 g):
𝑢𝑤1,𝑟𝑒𝑙 =
0.30
√3
5000= 0.0000346
This contribution has to be counted twice, once for the tare and once for the gross weight,
because each one is an independent observation and the linearity effects are not correlated.
The two contributions are combined to give the standard uncertainty of the weight:
𝑢𝑤,𝑟𝑒𝑙 = √(0.0000346)2 + (0.0000346)2 = 0.0000490

Guidance Document on Measurement Uncertainty
Working Group for Measurement Uncertainty in PCDD/F and PCB Analysis - 2017 108
H.3 Combined and expanded standard uncertainty
If the full calibration procedure is adopted (Option 1), the combined standard uncertainty is
calculated as follows:
𝑢𝑐,𝑟𝑒𝑙 = √𝑢𝑅𝑤,𝑟𝑒𝑙2 + 𝑢𝑏𝑖𝑎𝑠
2 + 𝑢𝑐𝑎𝑙,𝑟𝑒𝑙2 + 𝑢𝑣,𝑟𝑒𝑙
2 + 𝑢𝑠𝑡,𝑟𝑒𝑙2 + 𝑢𝑤,𝑟𝑒𝑙
2
The standard uncertainty of each component is expressed as relative standard uncertainty:
𝑢𝑐,𝑟𝑒𝑙 = √(0.114)2 + (0.0384)2 + (0.0405)2 + (0.0127)2 + (0.0250)2 + (0.0000490)2 = 0.130
The final stage is to multiply the combined standard uncertainty by a coverage factor k=2
(level of confidence 95%) to obtain an expanded uncertainty equal to:
𝑈𝑟𝑒𝑙 = 2 ∙ 0.130 = 0.260
If the calibration verification procedure is performed (Option 2), uc,rel is calculated as:
𝑢𝑐,𝑟𝑒𝑙 = √𝑢𝑅𝑤,𝑟𝑒𝑙2 + 𝑢𝑏𝑖𝑎𝑠
2 + 𝑢𝑐𝑎𝑙,𝑟𝑒𝑙2 + 𝑢𝑑,𝑟𝑒𝑙
2 + 𝑢𝑣,𝑟𝑒𝑙2 + 𝑢𝑠𝑡,𝑟𝑒𝑙
2 + 𝑢𝑤,𝑟𝑒𝑙2
The inclusion of the drift contribution increases the overall uncertainty:
𝑢𝑐,𝑟𝑒𝑙 = √(0.114)2 + (0.0384)2 + (0.0405)2 + (0.0866)2 + (0.0127)2 + (0.0250)2 + (0.0000490)2
= 0.156
The expanded uncertainty is given by:
𝑈𝑟𝑒𝑙 = 2 ∙ 0.156 = 0.312

Guidance Document on Measurement Uncertainty
Working Group for Measurement Uncertainty in PCDD/F and PCB Analysis - 2017 109
H.4 Expanded uncertainties for 17 PCDD/F and 12 DL-PCB
congeners
As described for 1,2,3,7,8-PeCDD, the expanded standard uncertainty can be calculated for
each of the other PCDD/F and DL-PCB congeners.
As an example, the values obtained when using the calibration verification procedure
(Option 2) are presented in Table H.4-1. Relative U values are then used to calculate the
expanded uncertainties associated with the analytical levels of PCDD/F and DL-PCB
congeners in a routine milk sample, as reported in table H.4-2.
Table H.4-1: Relative expanded uncertainty Urel (confidence level 95%) for 17 PCDD/F and
12 DL-PCB congeners in a milk sample.
Congener
Expanded
Uncertainty Urel
%
Congener
Expanded
Uncertainty Urel
%
2,3,7,8-TCDD 46.6 PCB 105 25.9
1,2,3,7,8-PeCDD 32.0 PCB 114 24.6
1,2,3,4,7,8-HxCDD 31.1 PCB 118 29.3
1,2,3,6,7,8-HxCDD 33.8 PCB 123 29.5
1,2,3,7,8,9-HxCDD 33.7 PCB 156 23.9
1,2,3,4,6,7,8-HpCDD 36.4 PCB 157 40.8
OCDD 38.4 PCB 167 30.5
2,3,7,8-TCDF 46.8 PCB 189 29.8
1,2,3,7,8-PeCDF 33.7 PCB 77 28.6
2,3,4,7,8-PeCDF 26.8 PCB 81 32.0
1,2,3,4,7,8-HxCDF 31.9 PCB 126 27.7
1,2,3,6,7,8-HxCDF 29.1 PCB 169 27.4
2,3,4,6,7,8-HxCDF 36.1
1,2,3,7,8,9-HxCDF 31.6
1,2,3,4,6,7,8-HpCDF 31.3
1,2,3,4,7,8,9-HpCDF 31.6
OCDF 36.4
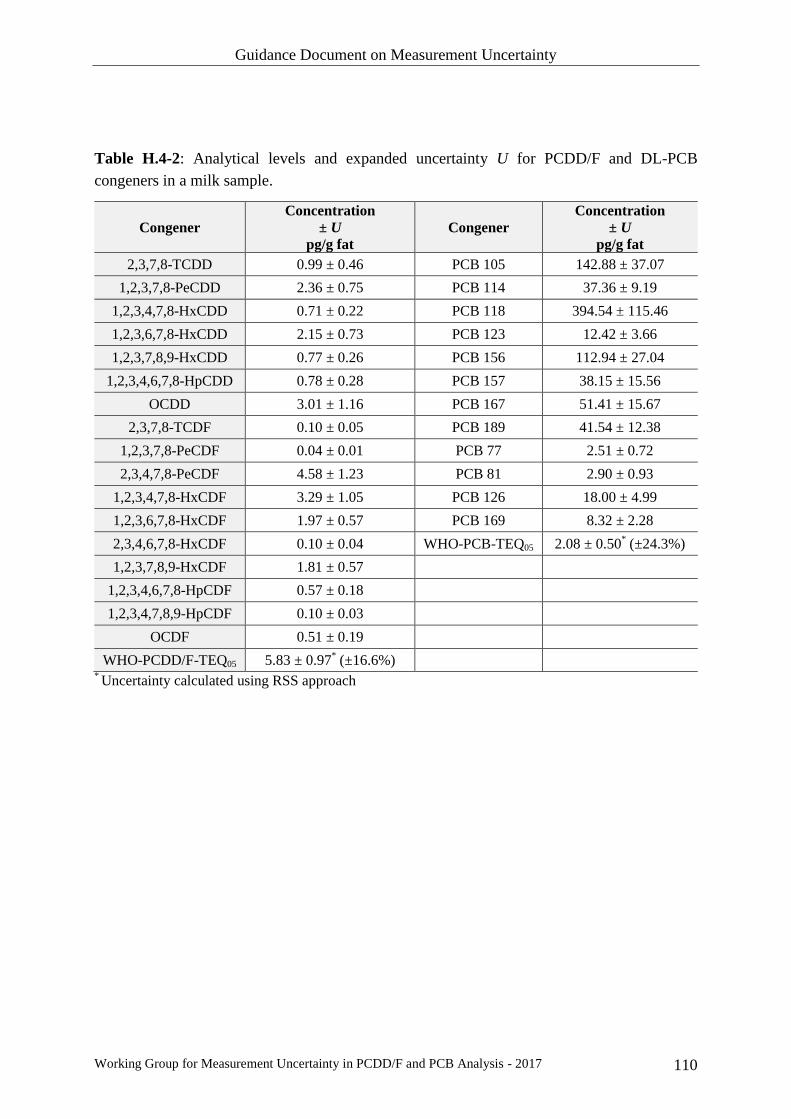
Guidance Document on Measurement Uncertainty
Working Group for Measurement Uncertainty in PCDD/F and PCB Analysis - 2017 110
Table H.4-2: Analytical levels and expanded uncertainty U for PCDD/F and DL-PCB
congeners in a milk sample.
Congener
Concentration
± U
pg/g fat
Congener
Concentration
± U
pg/g fat
2,3,7,8-TCDD 0.99 ± 0.46 PCB 105 142.88 ± 37.07
1,2,3,7,8-PeCDD 2.36 ± 0.75 PCB 114 37.36 ± 9.19
1,2,3,4,7,8-HxCDD 0.71 ± 0.22 PCB 118 394.54 ± 115.46
1,2,3,6,7,8-HxCDD 2.15 ± 0.73 PCB 123 12.42 ± 3.66
1,2,3,7,8,9-HxCDD 0.77 ± 0.26 PCB 156 112.94 ± 27.04
1,2,3,4,6,7,8-HpCDD 0.78 ± 0.28 PCB 157 38.15 ± 15.56
OCDD 3.01 ± 1.16 PCB 167 51.41 ± 15.67
2,3,7,8-TCDF 0.10 ± 0.05 PCB 189 41.54 ± 12.38
1,2,3,7,8-PeCDF 0.04 ± 0.01 PCB 77 2.51 ± 0.72
2,3,4,7,8-PeCDF 4.58 ± 1.23 PCB 81 2.90 ± 0.93
1,2,3,4,7,8-HxCDF 3.29 ± 1.05 PCB 126 18.00 ± 4.99
1,2,3,6,7,8-HxCDF 1.97 ± 0.57 PCB 169 8.32 ± 2.28
2,3,4,6,7,8-HxCDF 0.10 ± 0.04 WHO-PCB-TEQ05 2.08 ± 0.50* (±24.3%)
1,2,3,7,8,9-HxCDF 1.81 ± 0.57
1,2,3,4,6,7,8-HpCDF 0.57 ± 0.18
1,2,3,4,7,8,9-HpCDF 0.10 ± 0.03
OCDF 0.51 ± 0.19
WHO-PCDD/F-TEQ05 5.83 ± 0.97* (±16.6%)
* Uncertainty calculated using RSS approach


![Guidance document on Measurement Uncertainty for GMO … · 2020-06-10 · Measurement Uncertainty for GMO Testing Laboratories, EUR report EUR 22756 EN, ISBN: 978-92-79-05566-9 [2]](https://static.fdocuments.us/doc/165x107/5f38e53c55a895378e1db53a/guidance-document-on-measurement-uncertainty-for-gmo-2020-06-10-measurement-uncertainty.jpg)