Guidance Book 2017 - DURAG · Guidance Book 2017 on the European Directive ... Directive 2001/80/EC...
52
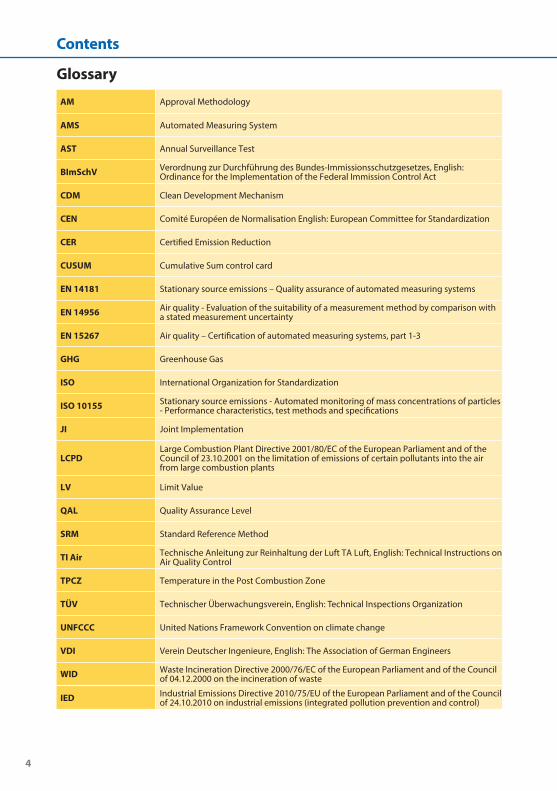
1 Guidance Book 2017 on the European Directive 2010/75/EU IED Industrial Emissions Directive under the influence of the new European standards Greenhouse Gas Trading ● ● Directive 2010/75/EU of 24 th November 2010 on industrial emissions (integrated pollution prevention and control) (IED) ● ● European Standard EN 14181 Stationary source emissions - Quality assurance of automated measuring systems ● ● European Standard EN 15267 Air quality – Certification of automated measuring systems ● ● GHG Emission Monitoring (European-, UNFCCC-Guidelines) (1)
Transcript of Guidance Book 2017 - DURAG · Guidance Book 2017 on the European Directive ... Directive 2001/80/EC...

1
Guidance Book 2017on the European Directive2010/75/EU IEDIndustrial Emissions Directiveunder the influence of the new European standards
Greenhouse Gas Trading
●● Directive 2010/75/EU of 24th November 2010 on industrial emissions (integrated pollution prevention and control) (IED)
●● European Standard EN 14181 Stationary source emissions - Quality assurance of automated measuring systems
●● European Standard EN 15267 Air quality – Certification of automated measuring systems
●● GHG Emission Monitoring (European-, UNFCCC-Guidelines)
(1)
2
The European Directives . . . . . . . . . . . . . . . . . . . . . . . . . . . . . . . . . . . . . . . . . . . . . . . . . . . . . . . . . . . . . . . . . . . . 6New European Directive 2010/75/EU on Industrial Emissions (IED) . . . . . . . . . . . . . . . . . . . . . . . . . . . . . . . . 6WID - Directive on the incineration of waste . . . . . . . . . . . . . . . . . . . . . . . . . . . . . . . . . . . . . . . . . . . . . . . . . . . . . . . 7
Waste Incineration Directive requirements . . . . . . . . . . . . . . . . . . . . . . . . . . . . . . . . . . . . . . . . . . . . . . . . . . . . 7Emission limit values for waste incineration plants (continuous measurements, standardised at 11 % O2, mineral waste oil at 3 % O2) . . . . . . . . . . . . . . . . . . . . . . . . . . . . . . . . . . . . . . . . . . . 8Emission limit values acc . to WID up to 40 % thermal co-incineration . . . . . . . . . . . . . . . . . . . . . . . . . . . 8CProc for combustion plants co-incinerating waste . . . . . . . . . . . . . . . . . . . . . . . . . . . . . . . . . . . . . . . . . . . . . 9Special Cement Plant Regulation . . . . . . . . . . . . . . . . . . . . . . . . . . . . . . . . . . . . . . . . . . . . . . . . . . . . . . . . . . . . .10
LCPD - Directive 2001/80/EC on the limitation of emissions of certain pollutants into the air from large combustion plants . . . . . . . . . . . . . . . . . . . . . . . . . . . . . . . . . . . . . . . . . . . . . . . . . . . . . . . . . . . . . . . . . . . . . . . . .11
LCPD 2001/80/EC Requirements . . . . . . . . . . . . . . . . . . . . . . . . . . . . . . . . . . . . . . . . . . . . . . . . . . . . . . . . . . . . .11Emission limit values (mg/Nm3) for combustion plants using solid fuels . . . . . . . . . . . . . . . . . . . . . .12Emission limit values (mg/Nm3) for combustion plants using liquid fuels . . . . . . . . . . . . . . . . . . . . .13Emission limit values (mg/Nm3) for combustion plants using gaseous fuels . . . . . . . . . . . . . . . . . . .14Emission limit values (mg/Nm3) for combustion plants of gas turbines and gas engines . . . . . . .15
EN 14181 . . . . . . . . . . . . . . . . . . . . . . . . . . . . . . . . . . . . . . . . . . . . . . . . . . . . . . . . . . . . . . . . . . . . . . . . . . . . . . . . . .16EN 14181 – Quality assurance for automatic measuring equipment . . . . . . . . . . . . . . . . . . . . . . . . . . . . . .17
QAL 1 – Testing the suitability of the equipment technology . . . . . . . . . . . . . . . . . . . . . . . . . . . . . . . . .17QAL 2 – Installation/calibration testing . . . . . . . . . . . . . . . . . . . . . . . . . . . . . . . . . . . . . . . . . . . . . . . . . . . . . . .18QAL 3 – Continuous monitoring . . . . . . . . . . . . . . . . . . . . . . . . . . . . . . . . . . . . . . . . . . . . . . . . . . . . . . . . . . . . . .18AST – Annual Surveillance Test . . . . . . . . . . . . . . . . . . . . . . . . . . . . . . . . . . . . . . . . . . . . . . . . . . . . . . . . . . . . . . .18
EN 15267 . . . . . . . . . . . . . . . . . . . . . . . . . . . . . . . . . . . . . . . . . . . . . . . . . . . . . . . . . . . . . . . . . . . . . . . . . . . . . . . . . .18Emission Data Evaluation and Assessment . . . . . . . . . . . . . . . . . . . . . . . . . . . . . . . . . . . . . . . . . . . . . . . . . .20
Validation . . . . . . . . . . . . . . . . . . . . . . . . . . . . . . . . . . . . . . . . . . . . . . . . . . . . . . . . . . . . . . . . . . . . . . . . . . . . . . . . . . . . . . . .20Validity of the calibration curve . . . . . . . . . . . . . . . . . . . . . . . . . . . . . . . . . . . . . . . . . . . . . . . . . . . . . . . . . . . . . . . . . .22Logging and documentation for verification . . . . . . . . . . . . . . . . . . . . . . . . . . . . . . . . . . . . . . . . . . . . . . . . . . . . .23
Classification (required by authority in Germany) . . . . . . . . . . . . . . . . . . . . . . . . . . . . . . . . . . . . . . . . . . . . .23Minimum requirements CEN TC264 WG9 WI264076 . . . . . . . . . . . . . . . . . . . . . . . . . . . . . . . . . . . . . . . . . . . . .23
Stationary source emissions – Quality assurance of AMS data . . . . . . . . . . . . . . . . . . . . . . . . . . . . . . . .23First Level Data (FLD) . . . . . . . . . . . . . . . . . . . . . . . . . . . . . . . . . . . . . . . . . . . . . . . . . . . . . . . . . . . . . . . . . . . . . . . . .24Standardised first level data (SFLD) . . . . . . . . . . . . . . . . . . . . . . . . . . . . . . . . . . . . . . . . . . . . . . . . . . . . . . . . . . .24Abveraged first level data (AFLD) . . . . . . . . . . . . . . . . . . . . . . . . . . . . . . . . . . . . . . . . . . . . . . . . . . . . . . . . . . . . .24Short-Term Average (STA) . . . . . . . . . . . . . . . . . . . . . . . . . . . . . . . . . . . . . . . . . . . . . . . . . . . . . . . . . . . . . . . . . . . .24Standardises short-term average (SSTA) . . . . . . . . . . . . . . . . . . . . . . . . . . . . . . . . . . . . . . . . . . . . . . . . . . . . . .25Validated short-term average (VSTA) . . . . . . . . . . . . . . . . . . . . . . . . . . . . . . . . . . . . . . . . . . . . . . . . . . . . . . . . .25Validated Long Term Averages (VLTA) . . . . . . . . . . . . . . . . . . . . . . . . . . . . . . . . . . . . . . . . . . . . . . . . . . . . . . . .25QAL3 procedure . . . . . . . . . . . . . . . . . . . . . . . . . . . . . . . . . . . . . . . . . . . . . . . . . . . . . . . . . . . . . . . . . . . . . . . . . . . . .25Calibration range check . . . . . . . . . . . . . . . . . . . . . . . . . . . . . . . . . . . . . . . . . . . . . . . . . . . . . . . . . . . . . . . . . . . . . .25Standardisation of concentrations and flue gas flow data . . . . . . . . . . . . . . . . . . . . . . . . . . . . . . . . . . . . .26Block averages . . . . . . . . . . . . . . . . . . . . . . . . . . . . . . . . . . . . . . . . . . . . . . . . . . . . . . . . . . . . . . . . . . . . . . . . . . . . . . .26Rolling averages . . . . . . . . . . . . . . . . . . . . . . . . . . . . . . . . . . . . . . . . . . . . . . . . . . . . . . . . . . . . . . . . . . . . . . . . . . . . . .26
Contents
3
System D-EMS 2000 and D-EMS 2000 CS . . . . . . . . . . . . . . . . . . . . . . . . . . . . . . . . . . . . . . . . . . . . . . . . . . . .27Basic system with the D-MS 500 KE communication unit . . . . . . . . . . . . . . . . . . . . . . . . . . . . . . . . . . . . . . . . .28Price effective compact system D-EMS 2000 CS for small and middle sized plants . . . . . . . . . . . . . . . .29System with the D-MS 500 FC DIN-rail . . . . . . . . . . . . . . . . . . . . . . . . . . . . . . . . . . . . . . . . . . . . . . . . . . . . . . . . . . .30System for direct bus connection . . . . . . . . . . . . . . . . . . . . . . . . . . . . . . . . . . . . . . . . . . . . . . . . . . . . . . . . . . . . . . . .31Overall system with all available software modules . . . . . . . . . . . . . . . . . . . . . . . . . . . . . . . . . . . . . . . . . . . . . .32
Applications . . . . . . . . . . . . . . . . . . . . . . . . . . . . . . . . . . . . . . . . . . . . . . . . . . . . . . . . . . . . . . . . . . . . . . . . . . . . . . .34Smaller-sized plants . . . . . . . . . . . . . . . . . . . . . . . . . . . . . . . . . . . . . . . . . . . . . . . . . . . . . . . . . . . . . . . . . . . . . . . . . . . . .34Medium-sized plants . . . . . . . . . . . . . . . . . . . . . . . . . . . . . . . . . . . . . . . . . . . . . . . . . . . . . . . . . . . . . . . . . . . . . . . . . . . .34Complex plants . . . . . . . . . . . . . . . . . . . . . . . . . . . . . . . . . . . . . . . . . . . . . . . . . . . . . . . . . . . . . . . . . . . . . . . . . . . . . . . . .35
Greenhouse Gas Trading . . . . . . . . . . . . . . . . . . . . . . . . . . . . . . . . . . . . . . . . . . . . . . . . . . . . . . . . . . . . . . . . . . .36The Clean Development Mechanism . . . . . . . . . . . . . . . . . . . . . . . . . . . . . . . . . . . . . . . . . . . . . . . . . . . . . . . . . . . . .37Monitoring requirements . . . . . . . . . . . . . . . . . . . . . . . . . . . . . . . . . . . . . . . . . . . . . . . . . . . . . . . . . . . . . . . . . . . . . . . .38Good monitoring practice and performance characteristics . . . . . . . . . . . . . . . . . . . . . . . . . . . . . . . . . . . . . .38Minimum requirements for electronic evaluation units . . . . . . . . . . . . . . . . . . . . . . . . . . . . . . . . . . . . . . . . . . .39
Example CDM project AM0028 . . . . . . . . . . . . . . . . . . . . . . . . . . . . . . . . . . . . . . . . . . . . . . . . . . . . . . . . . . . . . . .39DURAG GROUP Measuring Devices for Emissions . . . . . . . . . . . . . . . . . . . . . . . . . . . . . . . . . . . . . . . . . . . .40
D-R 290 – Dust concentration monitor . . . . . . . . . . . . . . . . . . . . . . . . . . . . . . . . . . . . . . . . . . . . . . . . . . . . . . . . . . .40D-R 320 – Measuring device for dust concentration . . . . . . . . . . . . . . . . . . . . . . . . . . . . . . . . . . . . . . . . . . . . . .41D-R 808 – Dust monitor . . . . . . . . . . . . . . . . . . . . . . . . . . . . . . . . . . . . . . . . . . . . . . . . . . . . . . . . . . . . . . . . . . . . . . . . . .42D-RX 250 – Combined probe sensor . . . . . . . . . . . . . . . . . . . . . . . . . . . . . . . . . . . . . . . . . . . . . . . . . . . . . . . . . . . . .43D-820 F – Dust concentration monitor for wet gases . . . . . . . . . . . . . . . . . . . . . . . . . . . . . . . . . . . . . . . . . . . . .44F-904-20 – Extractive Dust Concentration Monitor . . . . . . . . . . . . . . . . . . . . . . . . . . . . . . . . . . . . . . . . . . . . . . .45F-701-20 – Ambient Air Dust Concentration Monitor . . . . . . . . . . . . . . . . . . . . . . . . . . . . . . . . . . . . . . . . . . . .46HM-1400 TRX – Total Mercury Analyser . . . . . . . . . . . . . . . . . . . . . . . . . . . . . . . . . . . . . . . . . . . . . . . . . . . . . . . . . .47D-FL 100 – Volume Flow Measuring System . . . . . . . . . . . . . . . . . . . . . . . . . . . . . . . . . . . . . . . . . . . . . . . . . . . . . .48D-FL 220 – Volume Flow Measuring System . . . . . . . . . . . . . . . . . . . . . . . . . . . . . . . . . . . . . . . . . . . . . . . . . . . . . .49
4
Glossary
AM Approval Methodology
AMS Automated Measuring System
AST Annual Surveillance Test
BImSchV Verordnung zur Durchführung des Bundes-Immissionsschutzgesetzes, English: Ordinance for the Implementation of the Federal Immission Control Act
CDM Clean Development Mechanism
CEN Comité Européen de Normalisation English: European Committee for Standardization
CER Certified Emission Reduction
CUSUM Cumulative Sum control card
EN 14181 Stationary source emissions – Quality assurance of automated measuring systems
EN 14956 Air quality - Evaluation of the suitability of a measurement method by comparison with a stated measurement uncertainty
EN 15267 Air quality – Certification of automated measuring systems, part 1-3
GHG Greenhouse Gas
ISO International Organization for Standardization
ISO 10155 Stationary source emissions - Automated monitoring of mass concentrations of particles - Performance characteristics, test methods and specifications
JI Joint Implementation
LCPDLarge Combustion Plant Directive 2001/80/EC of the European Parliament and of the Council of 23 .10 .2001 on the limitation of emissions of certain pollutants into the air from large combustion plants
LV Limit Value
QAL Quality Assurance Level
SRM Standard Reference Method
TI Air Technische Anleitung zur Reinhaltung der Luft TA Luft, English: Technical Instructions on Air Quality Control
TPCZ Temperature in the Post Combustion Zone
TÜV Technischer Überwachungsverein, English: Technical Inspections Organization
UNFCCC United Nations Framework Convention on climate change
VDI Verein Deutscher Ingenieure, English: The Association of German Engineers
WID Waste Incineration Directive 2000/76/EC of the European Parliament and of the Council of 04 .12 .2000 on the incineration of waste
IED Industrial Emissions Directive 2010/75/EU of the European Parliament and of the Council of 24 .10 .2010 on industrial emissions (integrated pollution prevention and control)
Contents

5
Downloads
13 . BImSchV http://www .gesetze-im-internet .de/bimschv_13_2013/
17 . BImSchV http://www .gesetze-im-internet .de/bimschv_17_2013/
27 . BImSchV http://www .gesetze-im-internet .de/bimschv_27/
30 . BImSchV http://www .gesetze-im-internet .de/bimschv_30/
AM 00xx http://cdm .unfccc .int/methodologies/index .html
CDM projects http://cdm .unfccc .int/Projects/projsearch .html
EN 14181 http://webstore .ansi .org/RecordDetail .aspx?sku=DIN+EN+14181%3a2004
EN 14956 http://webstore .ansi .org/RecordDetail .aspx?sku=DIN+EN+14956%3a2006
EN 15267-1 http://webstore .ansi .org/RecordDetail .aspx?sku=DIN+EN+15267-1%3a2009
EN 15267-2 http://webstore .ansi .org/RecordDetail .aspx?sku=DIN+EN+15267-2%3a2009
EN 15267-3 http://webstore .ansi .org/RecordDetail .aspx?sku=DIN+EN+15267-3%3a2008
ISO 10155 http://webstore .ansi .org/RecordDetail .aspx?sku=ISO+10155%3a1995
Kyoto Protocol http://unfccc .int/kvoto-protocol/items/2830 .php
LCPD 2001/80/EC http://eur-lex .europa .eu/LexUriServ/LexUriServ .do?uri=OJ:L:2001:309:0001:0021:EN:PDF
Minimum Requirements
http://www .umweltbundesamt .de/sites/default/files/medien/pdfs/Uniform-Practice-Emission-Monitoring .pdf
TI Air http://www .bmu .de/files/pdfs/allgemein/application/pdf/taluft .pdf
VDI 2066 http://www .vdi .eu/engineering/vdi-standards/
VDI 3950 http://www .vdi .eu/engineering/vdi-standards/
WID 2000/76/EC http://eur-lex .europa .eu/LexUriServ/LexUriServ .do?uri=OJ:L:2000:332:0091:0111:EN:PDF
IED 2010/75/EU http://eur-lex .europa .eu/LexUriServ/LexUriServ .do?uri=OJ:L:2010:334:0017:0119:EN:PDF
6
European Directive 2010/75/EU on Industrial Emissions (IED)Directive 2010/75/EU of 24th November 2010 on the integrated pollution prevention and controlIntegrated approach to avoid or minimise polluting emissions in the atmosphere, water and soil, as well as waste from industrial and agricultural installations, with the aim of achieving a high level of environmental and health protection .The new, over 100 pages long IED recasts seven separate existing European Directives related to industrial emissions into a single Directive (including large combustion plants, incineration and co-incineration of waste, old IPPC Directive) . The IED came into force on 6 January 2011 and was required to be transposed into national law by 7th January 2013 . In Germany, the Ordinance on Large Combustions and Waste Incinerators was updated on 2nd May 2013 . The IED replaces the above Directives with effect from 7th January 2014 and the LCP with effect from 1st January 2016 .The emission limit values were significantly reduced in particular for large combustion plants to the part and are structured as follows:
●● Combustion plants using solid fuels (excluding gas turbines and gas engines)●● Combustion plants using liquid fuels (excluding gas turbines and gas engines)●● Combustion plants using gaseous fuels (excluding gas turbines and gas engines)●● Gas turbines and gas engines
Industrial installations must use the best available techniques to achieve the highest general level of protection of the environment as a whole, which are developed on a scale which allows implementa-tion in the relevant industrial sector, under economically and technically viable conditions . The Euro-pean Commission must adopt BAT conclusions containing the emission levels associated with the BAT . These conclusions shall serve as a reference for the drawing up of permit conditions .Please find in the subsequent tables the emission limit values according to the directives 2000/76/EC and 2001/80/EC as well as the 2010/70/EU IED, origin www .euro-analytics .de, without any liability .
The European Directives
7
WID - Directives on the incineration of wasteThe WID 2000/76/EC covered the incineration of hazardous and non-hazardous waste but excluded ex-emptions for vegetable waste, radioactive waste and animal carcasses . The Directive applies not only to facilities intended for waste incineration (“dedicated incineration plants“) but also to “co-incineration“ plants (facilities whose main purpose is to produce energy or material products and which use waste as a regular or additional fuel, this waste being thermally treated for the purpose of disposal) . The Direc-tive did not cover experimental plants for improving the incineration process and which treat less than 50 tons of waste per year .The Directive entered into force on 29th December 2000 . Transposition into national legislation was nec-essary by 28th December 2002 . From this date on new incinerators had to comply with the provisions of the Directive . The Directive 2000/76/EC was replaced by the new Directive on Industrial Emissions IED 2010/75/EU with effect from 4th January 2014 .
Waste Incineration Directive requirementsEmission standards shall be regarded as having been complied with, if within one calendar year
●● All daily averages do not exceed the daily emission limit values set out in the tables below●● Either all validated half-hourly averages do not exceed the half-hour limit values in column A●● Or 97 % of the validated half-hourly averages do not exceed the 97% limit values in column B●● For carbon monoxide (CO):
- 97 % of all daily averages of CO do not exceed 50 mg/Nm3 - Either 95 % of all CO 10-minutes values do not exceed 150 mg/Nm3 - Or all CO half-hourly averages do not exceed 100 mg/Nm3, taken in any 24-hour period
●● The 10-minute average value of the temperature in the post combustion zone has to be above 850 °C, or above 1100 °C if hazardous waste with a high halogen content is burnt
●● The half-hourly average values and the 10-minute averages shall be determined within the effective operating time (excluding the start-up and shut-off periods if no waste is being incinerated) from the measured values after having subtracted the value of the confidence interval . The daily average values shall be determined from those validated average values .
8
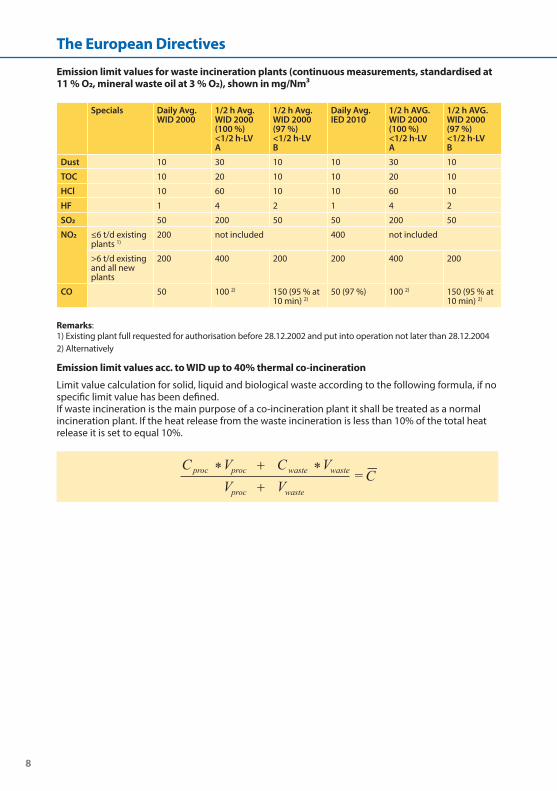
Emission limit values for waste incineration plants (continuous measurements, standardised at 11 % O2, mineral waste oil at 3 % O2), shown in mg/Nm3
Remarks: 1) Existing plant full requested for authorisation before 28 .12 .2002 and put into operation not later than 28 .12 .20042) Alternatively
Emission limit values acc . to WID up to 40% thermal co-incineration
Limit value calculation for solid, liquid and biological waste according to the following formula, if nospecific limit value has been defined .If waste incineration is the main purpose of a co-incineration plant it shall be treated as a normal incineration plant . If the heat release from the waste incineration is less than 10% of the total heat release it is set to equal 10% .
Specials Daily Avg. WID 2000
1/2 h Avg. WID 2000 (100 %) <1/2 h-LV A
1/2 h Avg. WID 2000 (97 %) <1/2 h-LV B
Daily Avg. IED 2010
1/2 h AVG. WID 2000 (100 %) <1/2 h-LV A
1/2 h AVG. WID 2000 (97 %) <1/2 h-LV B
Dust 10 30 10 10 30 10
TOC 10 20 10 10 20 10
HCl 10 60 10 10 60 10
HF 1 4 2 1 4 2
SO2 50 200 50 50 200 50
NO2 ≤6 t/d existing plants 1)
200 not included 400 not included
>6 t/d existing and all new plants
200 400 200 200 400 200
CO 50 100 2) 150 (95 % at 10 min) 2)
50 (97 %) 100 2) 150 (95 % at 10 min) 2)
The European Directives
9
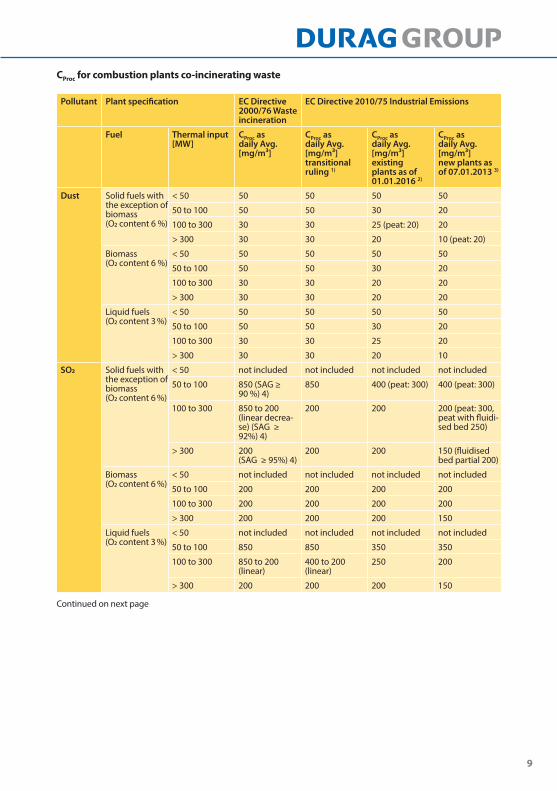
CProc for combustion plants co-incinerating waste
Continued on next page
Pollutant Plant specification EC Directive 2000/76 Waste incineration
EC Directive 2010/75 Industrial Emissions
Fuel Thermal input [MW]
CProc as daily Avg. [mg/m³]
CProc as daily Avg. [mg/m³] transitional ruling 1)
CProc as daily Avg. [mg/m³] existing plants as of 01.01.2016 2)
CProc as daily Avg. [mg/m³] new plants as of 07.01.2013 3)
Dust Solid fuels with the exception of biomass (O2 content 6 %)
< 50 50 50 50 50
50 to 100 50 50 30 20
100 to 300 30 30 25 (peat: 20) 20
> 300 30 30 20 10 (peat: 20)
Biomass (O2 content 6 %)
< 50 50 50 50 50
50 to 100 50 50 30 20
100 to 300 30 30 20 20
> 300 30 30 20 20
Liquid fuels (O2 content 3 %)
< 50 50 50 50 50
50 to 100 50 50 30 20
100 to 300 30 30 25 20
> 300 30 30 20 10
SO2 Solid fuels with the exception of biomass (O2 content 6 %)
< 50 not included not included not included not included
50 to 100 850 (SAG ≥ 90 %) 4)
850 400 (peat: 300) 400 (peat: 300)
100 to 300 850 to 200 (linear decrea-se) (SAG ≥ 92%) 4)
200 200 200 (peat: 300, peat with fluidi-sed bed 250)
> 300 200 (SAG ≥ 95%) 4)
200 200 150 (fluidised bed partial 200)
Biomass (O2 content 6 %)
< 50 not included not included not included not included
50 to 100 200 200 200 200
100 to 300 200 200 200 200
> 300 200 200 200 150
Liquid fuels (O2 content 3 %)
< 50 not included not included not included not included
50 to 100 850 850 350 350
100 to 300 850 to 200 (linear)
400 to 200 (linear)
250 200
> 300 200 200 200 150
10
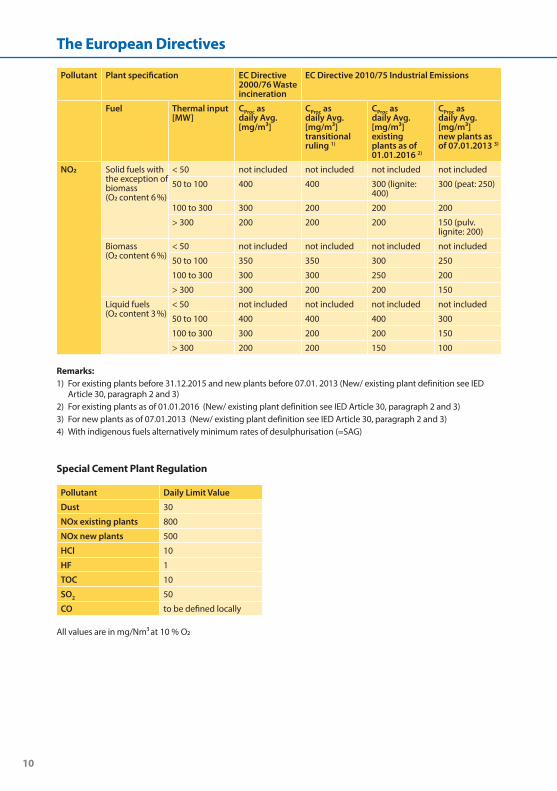
Remarks: 1) For existing plants before 31 .12 .2015 and new plants before 07 .01 . 2013 (New/ existing plant definition see IED Article 30, paragraph 2 and 3)2) For existing plants as of 01 .01 .2016 (New/ existing plant definition see IED Article 30, paragraph 2 and 3)3) For new plants as of 07 .01 .2013 (New/ existing plant definition see IED Article 30, paragraph 2 and 3)4) With indigenous fuels alternatively minimum rates of desulphurisation (=SAG)
Special Cement Plant Regulation
All values are in mg/Nm3 at 10 % O2
Pollutant Plant specification EC Directive 2000/76 Waste incineration
EC Directive 2010/75 Industrial Emissions
Fuel Thermal input [MW]
CProc as daily Avg. [mg/m³]
CProc as daily Avg. [mg/m³] transitional ruling 1)
CProc as daily Avg. [mg/m³] existing plants as of 01.01.2016 2)
CProc as daily Avg. [mg/m³] new plants as of 07.01.2013 3)
NO2 Solid fuels with the exception of biomass (O2 content 6 %)
< 50 not included not included not included not included
50 to 100 400 400 300 (lignite: 400)
300 (peat: 250)
100 to 300 300 200 200 200
> 300 200 200 200 150 (pulv . lignite: 200)
Biomass (O2 content 6 %)
< 50 not included not included not included not included
50 to 100 350 350 300 250
100 to 300 300 300 250 200
> 300 300 200 200 150
Liquid fuels (O2 content 3 %)
< 50 not included not included not included not included
50 to 100 400 400 400 300
100 to 300 300 200 200 150
> 300 200 200 150 100
Pollutant Daily Limit Value
Dust 30
NOx existing plants 800
NOx new plants 500
HCl 10
HF 1
TOC 10
SO2 50
CO to be defined locally
The European Directives
11
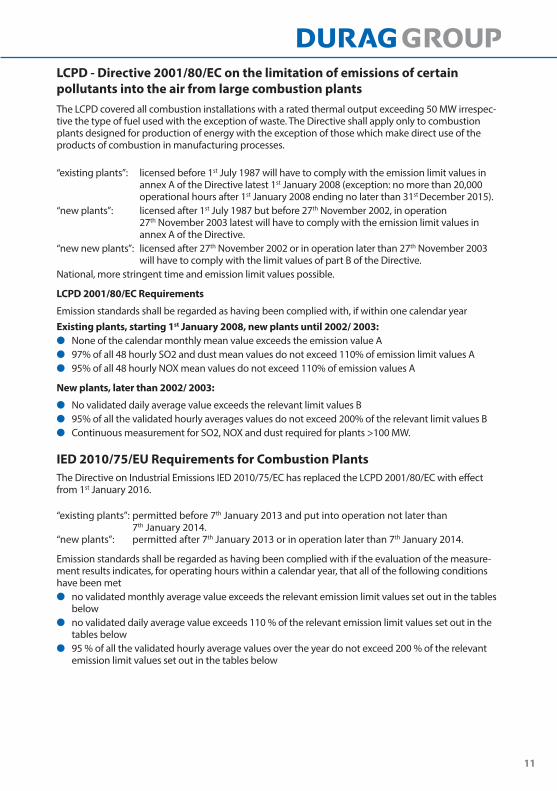
LCPD - Directive 2001/80/EC on the limitation of emissions of certain pollutants into the air from large combustion plantsThe LCPD covered all combustion installations with a rated thermal output exceeding 50 MW irrespec-tive the type of fuel used with the exception of waste . The Directive shall apply only to combustion plants designed for production of energy with the exception of those which make direct use of the products of combustion in manufacturing processes .
“existing plants”: licensed before 1st July 1987 will have to comply with the emission limit values in annex A of the Directive latest 1st January 2008 (exception: no more than 20,000 operational hours after 1st January 2008 ending no later than 31st December 2015) .
“new plants”: licensed after 1st July 1987 but before 27th November 2002, in operation 27th November 2003 latest will have to comply with the emission limit values in annex A of the Directive .
“new new plants”: licensed after 27th November 2002 or in operation later than 27th November 2003 will have to comply with the limit values of part B of the Directive .
National, more stringent time and emission limit values possible .
LCPD 2001/80/EC Requirements
Emission standards shall be regarded as having been complied with, if within one calendar yearExisting plants, starting 1st January 2008, new plants until 2002/ 2003:
●● None of the calendar monthly mean value exceeds the emission value A●● 97% of all 48 hourly SO2 and dust mean values do not exceed 110% of emission limit values A●● 95% of all 48 hourly NOX mean values do not exceed 110% of emission values A
New plants, later than 2002/ 2003:
●● No validated daily average value exceeds the relevant limit values B●● 95% of all the validated hourly averages values do not exceed 200% of the relevant limit values B●● Continuous measurement for SO2, NOX and dust required for plants >100 MW .
IED 2010/75/EU Requirements for Combustion PlantsThe Directive on Industrial Emissions IED 2010/75/EC has replaced the LCPD 2001/80/EC with effect from 1st January 2016 .
“existing plants”: permitted before 7th January 2013 and put into operation not later than 7th January 2014 . “new plants”: permitted after 7th January 2013 or in operation later than 7th January 2014 .
Emission standards shall be regarded as having been complied with if the evaluation of the measure-ment results indicates, for operating hours within a calendar year, that all of the following conditions have been met
●● no validated monthly average value exceeds the relevant emission limit values set out in the tables below
●● no validated daily average value exceeds 110 % of the relevant emission limit values set out in the tables below
●● 95 % of all the validated hourly average values over the year do not exceed 200 % of the relevant emission limit values set out in the tables below
12
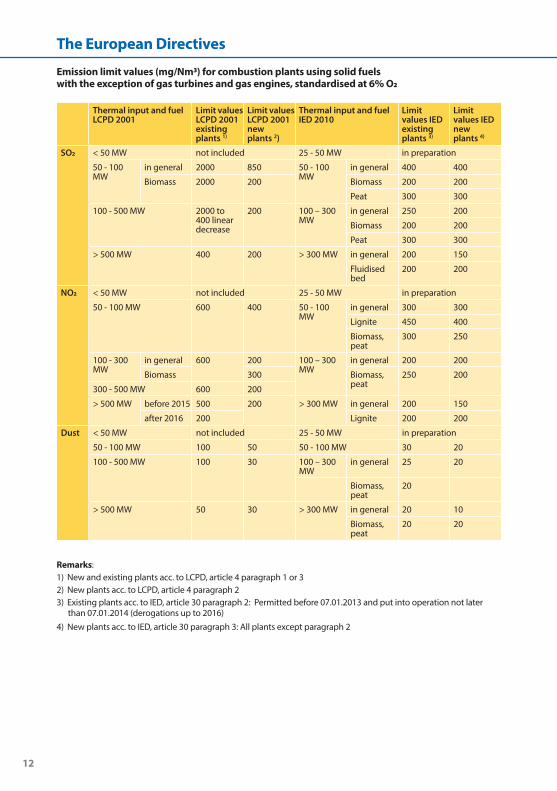
Emission limit values (mg/Nm3) for combustion plants using solid fuels with the exception of gas turbines and gas engines, standardised at 6% O2
Remarks: 1) New and existing plants acc . to LCPD, article 4 paragraph 1 or 32) New plants acc . to LCPD, article 4 paragraph 23) Existing plants acc . to IED, article 30 paragraph 2: Permitted before 07 .01 .2013 and put into operation not later
than 07 .01 .2014 (derogations up to 2016)4) New plants acc . to IED, article 30 paragraph 3: All plants except paragraph 2
Thermal input and fuel LCPD 2001
Limit values LCPD 2001 existing plants 1)
Limit values LCPD 2001 new plants 2)
Thermal input and fuel IED 2010
Limit values IED existing plants 3)
Limit values IED new plants 4)
SO2 < 50 MW not included 25 - 50 MW in preparation
50 - 100 MW
in general 2000 850 50 - 100 MW
in general 400 400
Biomass 2000 200 Biomass 200 200
Peat 300 300
100 - 500 MW 2000 to 400 linear decrease
200 100 – 300 MW
in general 250 200
Biomass 200 200
Peat 300 300
> 500 MW 400 200 > 300 MW in general 200 150
Fluidised bed
200 200
NO2 < 50 MW not included 25 - 50 MW in preparation
50 - 100 MW 600 400 50 - 100 MW
in general 300 300
Lignite 450 400
Biomass, peat
300 250
100 - 300 MW
in general 600 200 100 – 300 MW
in general 200 200
Biomass 300 Biomass, peat
250 200
300 - 500 MW 600 200
> 500 MW before 2015 500 200 > 300 MW in general 200 150
after 2016 200 Lignite 200 200
Dust < 50 MW not included 25 - 50 MW in preparation
50 - 100 MW 100 50 50 - 100 MW 30 20
100 - 500 MW 100 30 100 – 300 MW
in general 25 20
Biomass, peat
20
> 500 MW 50 30 > 300 MW in general 20 10
Biomass, peat
20 20
The European Directives
13
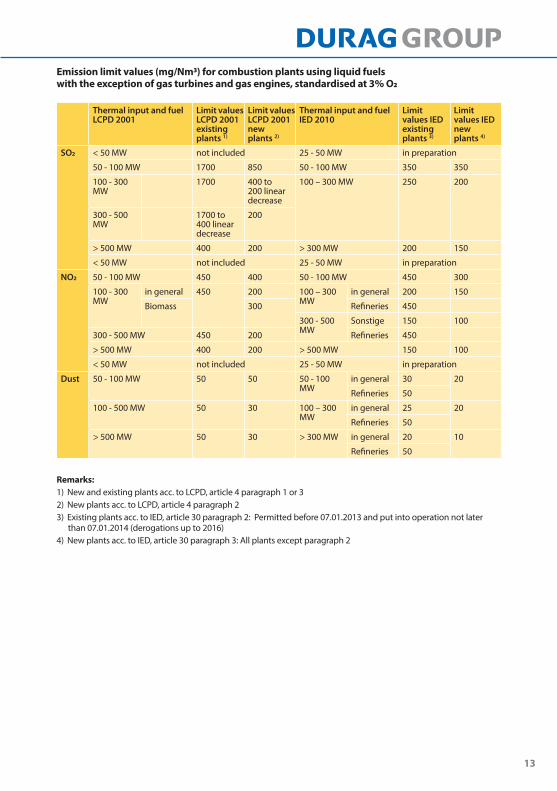
Emission limit values (mg/Nm3) for combustion plants using liquid fuels with the exception of gas turbines and gas engines, standardised at 3% O2
Remarks: 1) New and existing plants acc . to LCPD, article 4 paragraph 1 or 32) New plants acc . to LCPD, article 4 paragraph 23) Existing plants acc . to IED, article 30 paragraph 2: Permitted before 07 .01 .2013 and put into operation not later
than 07 .01 .2014 (derogations up to 2016)4) New plants acc . to IED, article 30 paragraph 3: All plants except paragraph 2
Thermal input and fuel LCPD 2001
Limit values LCPD 2001 existing plants 1)
Limit values LCPD 2001 new plants 2)
Thermal input and fuel IED 2010
Limit values IED existing plants 3)
Limit values IED new plants 4)
SO2 < 50 MW not included 25 - 50 MW in preparation
50 - 100 MW 1700 850 50 - 100 MW 350 350
100 - 300 MW
1700 400 to 200 linear decrease
100 – 300 MW 250 200
300 - 500 MW
1700 to 400 linear decrease
200
> 500 MW 400 200 > 300 MW 200 150
< 50 MW not included 25 - 50 MW in preparation
NO2 50 - 100 MW 450 400 50 - 100 MW 450 300
100 - 300 MW
in general 450 200 100 – 300 MW
in general 200 150
Biomass 300 Refineries 450
300 - 500 MW
Sonstige 150 100
300 - 500 MW 450 200 Refineries 450
> 500 MW 400 200 > 500 MW 150 100
< 50 MW not included 25 - 50 MW in preparation
Dust 50 - 100 MW 50 50 50 - 100 MW
in general 30 20
Refineries 50
100 - 500 MW 50 30 100 – 300 MW
in general 25 20
Refineries 50
> 500 MW 50 30 > 300 MW in general 20 10
Refineries 50
14
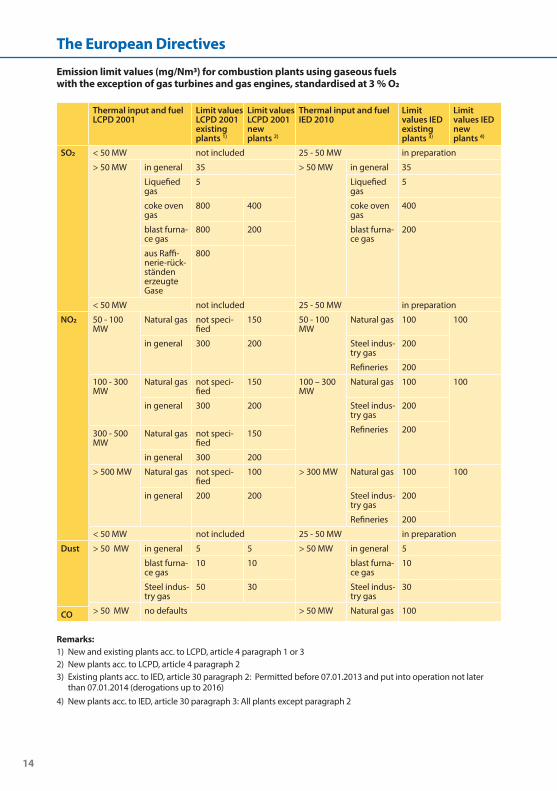
Emission limit values (mg/Nm3) for combustion plants using gaseous fuels with the exception of gas turbines and gas engines, standardised at 3 % O2
Remarks: 1) New and existing plants acc . to LCPD, article 4 paragraph 1 or 32) New plants acc . to LCPD, article 4 paragraph 23) Existing plants acc . to IED, article 30 paragraph 2: Permitted before 07 .01 .2013 and put into operation not later
than 07 .01 .2014 (derogations up to 2016)4) New plants acc . to IED, article 30 paragraph 3: All plants except paragraph 2
Thermal input and fuel LCPD 2001
Limit values LCPD 2001 existing plants 1)
Limit values LCPD 2001 new plants 2)
Thermal input and fuel IED 2010
Limit values IED existing plants 3)
Limit values IED new plants 4)
SO2 < 50 MW not included 25 - 50 MW in preparation
> 50 MW in general 35 > 50 MW in general 35
Liquefied gas
5 Liquefied gas
5
coke oven gas
800 400 coke oven gas
400
blast furna-ce gas
800 200 blast furna-ce gas
200
aus Raffi-nerie-rück-ständen erzeugte Gase
800
< 50 MW not included 25 - 50 MW in preparation
NO2 50 - 100 MW
Natural gas not speci-fied
150 50 - 100 MW
Natural gas 100 100
in general 300 200 Steel indus-try gas
200
Refineries 200
100 - 300 MW
Natural gas not speci-fied
150 100 – 300 MW
Natural gas 100 100
in general 300 200 Steel indus-try gas
200
Refineries 200300 - 500 MW
Natural gas not speci-fied
150
in general 300 200
> 500 MW Natural gas not speci-fied
100 > 300 MW Natural gas 100 100
in general 200 200 Steel indus-try gas
200
Refineries 200
< 50 MW not included 25 - 50 MW in preparation
Dust > 50 MW in general 5 5 > 50 MW in general 5
blast furna-ce gas
10 10 blast furna-ce gas
10
Steel indus-try gas
50 30 Steel indus-try gas
30
> 50 MW no defaults > 50 MW Natural gas 100CO
The European Directives
15
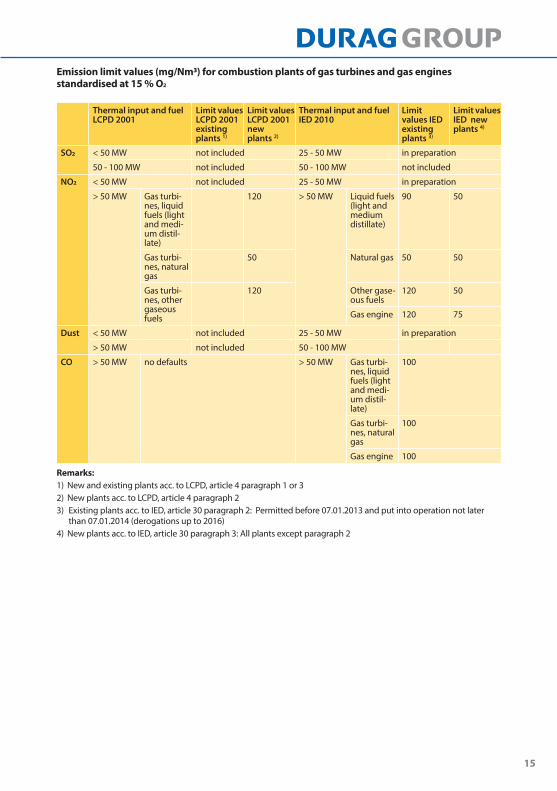
Emission limit values (mg/Nm3) for combustion plants of gas turbines and gas enginesstandardised at 15 % O2
Remarks: 1) New and existing plants acc . to LCPD, article 4 paragraph 1 or 32) New plants acc . to LCPD, article 4 paragraph 23) Existing plants acc . to IED, article 30 paragraph 2: Permitted before 07 .01 .2013 and put into operation not later
than 07 .01 .2014 (derogations up to 2016)4) New plants acc . to IED, article 30 paragraph 3: All plants except paragraph 2
Thermal input and fuel LCPD 2001
Limit values LCPD 2001 existing plants 1)
Limit values LCPD 2001 new plants 2)
Thermal input and fuel IED 2010
Limit values IED existing plants 3)
Limit values IED new plants 4)
SO2 < 50 MW not included 25 - 50 MW in preparation
50 - 100 MW not included 50 - 100 MW not included
NO2 < 50 MW not included 25 - 50 MW in preparation
> 50 MW Gas turbi-nes, liquid fuels (light and medi-um distil-late)
120 > 50 MW Liquid fuels (light and medium distillate)
90 50
Gas turbi-nes, natural gas
50 Natural gas 50 50
Gas turbi-nes, other gaseous fuels
120 Other gase-ous fuels
120 50
Gas engine 120 75
Dust < 50 MW not included 25 - 50 MW in preparation
> 50 MW not included 50 - 100 MW
CO > 50 MW no defaults > 50 MW Gas turbi-nes, liquid fuels (light and medi-um distil-late)
100
Gas turbi-nes, natural gas
100
Gas engine 100
16
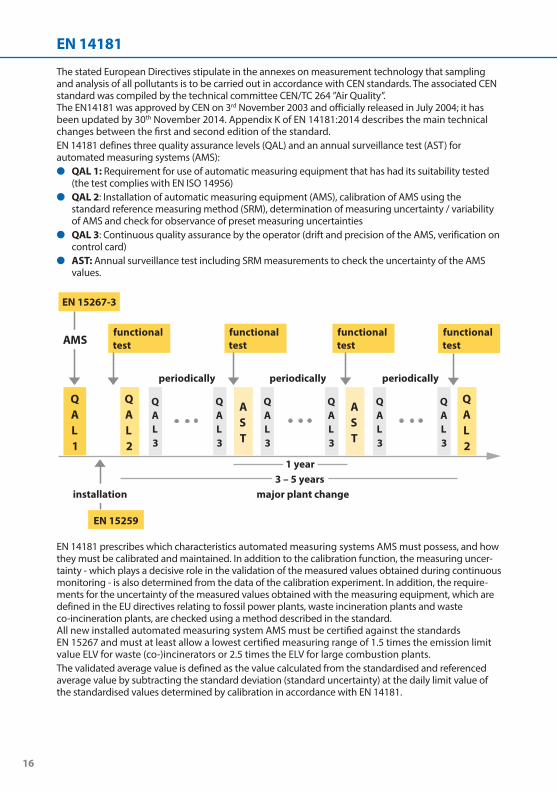
QAL2
QAL2
QAL1
AST
QAL3
major plant change
EN 15267-3
AMS
periodically periodically periodically
functionaltest
EN 15259
installation
QAL3
QAL3
QAL3
AST
QAL3
QAL3
functionaltest
functionaltest
functionaltest
3 – 5 years1 year
The stated European Directives stipulate in the annexes on measurement technology that sampling and analysis of all pollutants is to be carried out in accordance with CEN standards . The associated CEN standard was compiled by the technical committee CEN/TC 264 ”Air Quality” . The EN14181 was approved by CEN on 3rd November 2003 and officially released in July 2004; it has been updated by 30th November 2014 . Appendix K of EN 14181:2014 describes the main technical changes between the first and second edition of the standard .EN 14181 defines three quality assurance levels (QAL) and an annual surveillance test (AST) for automated measuring systems (AMS):
●● QAL 1: Requirement for use of automatic measuring equipment that has had its suitability tested (the test complies with EN ISO 14956)
●● QAL 2: Installation of automatic measuring equipment (AMS), calibration of AMS using the standard reference measuring method (SRM), determination of measuring uncertainty / variability of AMS and check for observance of preset measuring uncertainties
●● QAL 3: Continuous quality assurance by the operator (drift and precision of the AMS, verification on control card)
●● AST: Annual surveillance test including SRM measurements to check the uncertainty of the AMS values .
EN 14181 prescribes which characteristics automated measuring systems AMS must possess, and how they must be calibrated and maintained . In addition to the calibration function, the measuring uncer-tainty - which plays a decisive role in the validation of the measured values obtained during continuous monitoring - is also determined from the data of the calibration experiment . In addition, the require-ments for the uncertainty of the measured values obtained with the measuring equipment, which are defined in the EU directives relating to fossil power plants, waste incineration plants and waste co-incineration plants, are checked using a method described in the standard .All new installed automated measuring system AMS must be certified against the standards EN 15267 and must at least allow a lowest certified measuring range of 1 .5 times the emission limit value ELV for waste (co-)incinerators or 2 .5 times the ELV for large combustion plants .The validated average value is defined as the value calculated from the standardised and referenced average value by subtracting the standard deviation (standard uncertainty) at the daily limit value of the standardised values determined by calibration in accordance with EN 14181 .
EN 14181
17
EN 14181 – Quality assurance for automatic measuring equipment
●● Influenced by: - VDI 2066/3950 - ISO 10155 - North American (RATA) requirements
●● Prerequisites: - Suitable measuring instruments - Comparable measuring instruments - Error-free installation - Permanent quality assurance during plant operation .
QAL 1 – Testing the suitability of the equipment technology
●● QAL 1 specifies the suitability of a measuring instrument by calculating the total measuring uncertainty in accordance with EN ISO 14956 prior to installation - Standard deviation - Linearity deviation - Reproducibility - Drift - Temperature dependence - Operating voltage effects
●● TÜV suitability test - Cross sensitivities - Response behaviour - Response times - Measuring instrument type
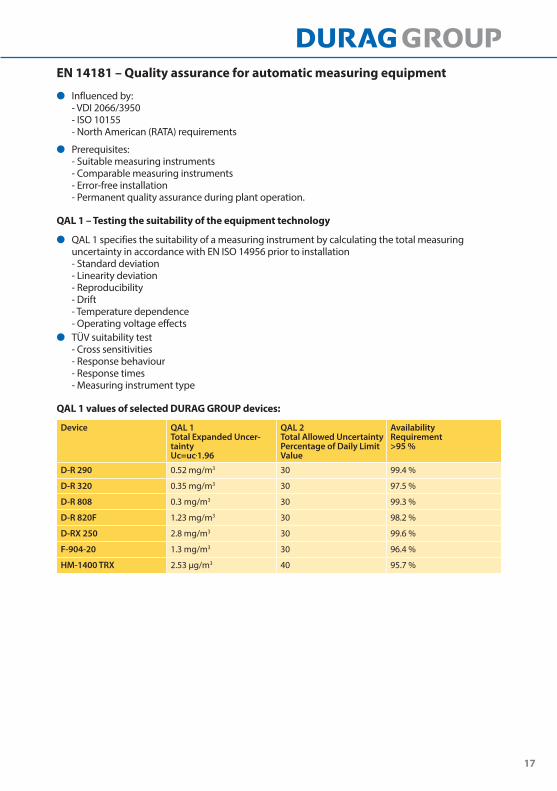
QAL 1 values of selected DURAG GROUP devices:
Device QAL 1 Total Expanded Uncer-tainty Uc=uc.1.96
QAL 2 Total Allowed Uncertainty Percentage of Daily Limit Value
Availability Requirement >95 %
D-R 290 0 .52 mg/m3 30 99 .4 %
D-R 320 0 .35 mg/m3 30 97 .5 %
D-R 808 0 .3 mg/m3 30 99 .3 %
D-R 820F 1 .23 mg/m3 30 98 .2 %
D-RX 250 2 .8 mg/m3 30 99 .6 %
F-904-20 1 .3 mg/m3 30 96 .4 %
HM-1400 TRX 2 .53 µg/m3 40 95 .7 %
18
QAL 2 – Installation/calibration testing
●● Selection of the measuring location (measuring site report)●● Correct installation of the measuring instrument●● Correct selection of the measuring range●● Calibration of the device using a standard reference method, min .15 measuring points distributed
over 8-10 hours on 3 days●● Determination of the calibration curve or curves under different operating conditions (fuels, load,
etc .) without manipulation of the furnace or filter systems (adjusting the burner, slitting the filter hoses or reducing the capacity of the electrostatic precipitator)
●● Calibration curve either as linear regression or straight line from the zero point to the centre of a point cluster
●● Calculation of the fluctuation range as s at the 95% confidence interval●● Test repeated at least every 5 years and more frequently if so required by legislation or authority
(e .g . 3 years for the WID) .
QAL 3 – Continuous monitoring
●● Permanent quality assurance during plant operation through the operating personnel●● Assurance of reliable and correct operation of the measuring instrument (maintenance records)●● Regular checks, at least once per maintenance interval
- Zero point, measuring range, drift - Determination of drift and accuracy using CUSUM cards or with an Excel chart - Identification / definition of when manufacturer’s maintenance is necessary for the measuring
instrument .
AST – Annual Surveillance Test
●● Annual confirmation of the QAL 2 calibration curve●● Verification of the validity of the calibration curve
- Function test - Small calibration using 5 parallel measurements - QAL 2 is to be repeated if AST fails
●● Resetting of the exceedance counter for the invalid calibration range .
EN 15267An automated measuring system AMS to be used at installations shall have been proven suitable for its measuring task in accordance with EN 15267 . Using this standard, it shall be proven that the total uncertainty of the results obtained from the AMS meet the specification for uncertainty stated in the applicable regulations . The standard EN 15267 is divided into
●● Part 1: General principles●● Part 2: Initial and yearly repeated assessment of the manufacturer’s quality system for design and
manufacturing●● Part 3: Performance criteria and test procedures
The standard defines a modified implementation of the approval test, such as contacting the test in-stitute, clarification of the range of applications and the announcement of the test at the LAI (German federal immission protection working party) .After successfully carrying out an extensive laboratory and a three months field test, the test report will be evaluated in the context of a technical examination moderated by the German EPA . With positive assessment, the certificate is issued by the German EPA for a period of five years and published in addi-tion to the Federal Gazette on the website www .qal1 .de as suitable instrument .The quality management system and the production of the manufacturer have to undergo an initial and yearly repeated audit in addition to the standard EN ISO 9001 audit .
EN 15267
19
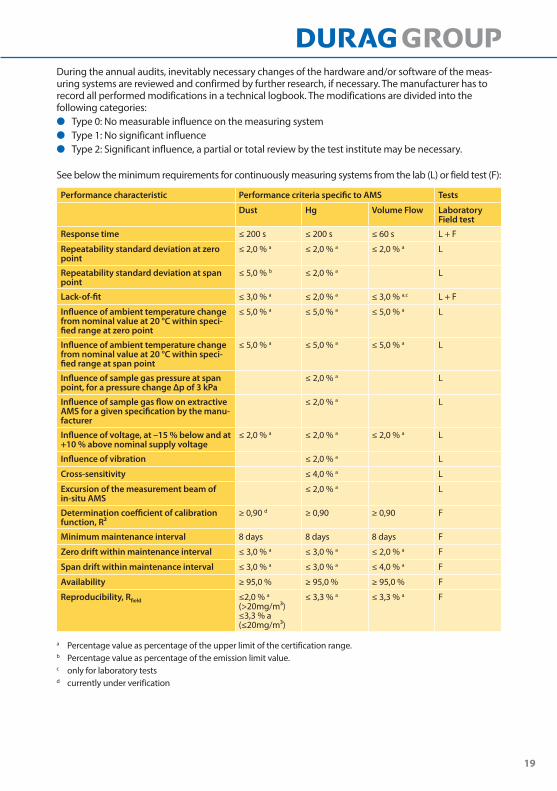
During the annual audits, inevitably necessary changes of the hardware and/or software of the meas-uring systems are reviewed and confirmed by further research, if necessary . The manufacturer has to record all performed modifications in a technical logbook . The modifications are divided into the following categories:
●● Type 0: No measurable influence on the measuring system ●● Type 1: No significant influence ●● Type 2: Significant influence, a partial or total review by the test institute may be necessary .
See below the minimum requirements for continuously measuring systems from the lab (L) or field test (F):
a Percentage value as percentage of the upper limit of the certification range .b Percentage value as percentage of the emission limit value .c only for laboratory testsd currently under verification
Performance characteristic Performance criteria specific to AMS Tests
Dust Hg Volume Flow Laboratory Field test
Response time ≤ 200 s ≤ 200 s ≤ 60 s L + F
Repeatability standard deviation at zero point
≤ 2,0 % a ≤ 2,0 % a ≤ 2,0 % a L
Repeatability standard deviation at span point
≤ 5,0 % b ≤ 2,0 % a L
Lack-of-fit ≤ 3,0 % a ≤ 2,0 % a ≤ 3,0 % a,c L + F
Influence of ambient temperature change from nominal value at 20 °C within speci-fied range at zero point
≤ 5,0 % a ≤ 5,0 % a ≤ 5,0 % a L
Influence of ambient temperature change from nominal value at 20 °C within speci-fied range at span point
≤ 5,0 % a ≤ 5,0 % a ≤ 5,0 % a L
Influence of sample gas pressure at span point, for a pressure change Δp of 3 kPa
≤ 2,0 % a L
Influence of sample gas flow on extractive AMS for a given specification by the manu-facturer
≤ 2,0 % a L
Influence of voltage, at –15 % below and at +10 % above nominal supply voltage
≤ 2,0 % a ≤ 2,0 % a ≤ 2,0 % a L
Influence of vibration ≤ 2,0 % a L
Cross-sensitivity ≤ 4,0 % a L
Excursion of the measurement beam of in-situ AMS
≤ 2,0 % a L
Determination coefficient of calibration function, R²
≥ 0,90 d ≥ 0,90 ≥ 0,90 F
Minimum maintenance interval 8 days 8 days 8 days F
Zero drift within maintenance interval ≤ 3,0 % a ≤ 3,0 % a ≤ 2,0 % a F
Span drift within maintenance interval ≤ 3,0 % a ≤ 3,0 % a ≤ 4,0 % a F
Availability ≥ 95,0 % ≥ 95,0 % ≥ 95,0 % F
Reproducibility, Rfield ≤2,0 % a (>20mg/m³) ≤3,3 % a (≤20mg/m³)
≤ 3,3 % a ≤ 3,3 % a F
20
The evaluation of the continuously acquired emission values must comply with the relevant legal requirements, fulfil the requirements of the competent authority and provide the operator with the possibility of having the historical, current and predicted emission values for reporting, conducting evaluations and controlling the operational process of the plant .Essential evaluation criteria include:
●● Continuous acquisition of the parameters and reference values to be measured●● Generation of standardised, oxygen referenced integral values (10 min, 30 min, 60 min)●● Validation of the integral values (absolute, percentage)●● Generation of daily average values (48 h average values, monthly average values) from the
validated integral values●● Monitoring of the equipment failure (maintenance/fault) and logging in the daily and annual
statistics●● Monitoring of the valid calibration ranges and evaluation/logging in accordance with EN 14181●● Monitoring of drift and precision of the continuously operating analysers (control charts) in
accordance with EN 14181 .
ValidationThe (half-) hourly average value is validated at the end of the integration interval from the integral values of the raw measurement data by subtracting the measurement uncertainty as a constant value, derived from the calibration (at 95% confidence interval) after the appropriate standardisation (tem-perature, pressure) and oxygen reference value calculation, from the measurement value . Negatively validated average values will be set to zero .The daily average values are formed as the arithmetic mean of the validated (half-) hourly average values .
Emission Data Evaluation and Assessment

21
As requirements, LCPD 2001/80/EU, Annex VIII-A6 and WID 2000/76/EU, Annex III, stipulate maximum values of measurement uncertainty for continuous measuring equipment and the validation of the measurement results . Until now, confidence and tolerance ranges of at least 5 or 10 % were defined for measurement uncertainty . These confidence and tolerance ranges are now inapplicable .The validated (half-) hourly and daily average values are determined on the basis of measured (half-) hourly average values after subtraction of the confidence interval determined by calibration (measure-ment uncertainty/ variability) .The value of the 95 % confidence interval for an individual measurement result must not exceed the following percentages of this emission limit stipulated for the daily average value:
carbon monoxide 10 % total organic carbon 30 %
sulphur dioxide 20 % mercury 40 %
nitrogenoxide 20 % hydrogen chloride 40 %
total dust 30 % hydrogen fluoride 40 %
n
1valK
n1
437 K
5 Vol-%
10 mg/m3
18 mg/Nm3
Validation
K= 10 21-O2R 43721-5 273
100,000 m3/h
16.2 mg/Nm3
M = 100,000 x 106 x 18
-10%
24:00
Half Hourly Averages
Reference Values
NH3
HCL
NOx
SO2
CO
TOC
DUST
O2
H2O
Flow
Limit: 20 60 400 200 100 20 30 -- -- --
Time mg/Nm3 mg/Nm3 mg/Nm3 mg/Nm3 mg/Nm3 mg/Nm3 mg/Nm3 Vol% % Nm3/h
00:30
0.3
0.5
44.8
2.8
0.0
0.8
0.4
9.8
7.6
27184
01:00
0.3
0.4
48.4
2.6
0.0
0.8
0.4
9.7
7.5
30724
01:30
0.3
0.5
49.2
2.5
0.0
0.8
0.4
9.8
7.6
27493
02:00
0.3
0.5
49.0
2.7
0.0
0.7
0.4
9.8
7.6
28300
02:30
0.3
0.5
43.9
2.7
0.0
0.7
0.4
9.5
7.8
27594
03:00
0.3
0.6
40.2
3.0
0.0
0.7
1.5
9.8
7.8
28550
03:30
0.3
0.5
39.6
3.0
0.0
0.8
0.4
9.8
7.6
31073
04:00
0.4
0.4
37.8
2.9
0.0
0.8
0.7
9.6
7.6
26735
04:30
0.3
0.5
38.2
2.7
0.0
0.8
0.7
9.6
7.5
28777
05:00
0.3
0.5
40.3
2.6
0.0
0.7
0.7
9.8
7.6
29949
05:30
0.3
0.4
37.8
1.9
0.0
0.8
0.8
9.4
7.8
30279
06:00
0.3
0.5
36.2
1.8
0.0
0.7
2.2
9.8
7.8
28668
06:30
0.3
0.5
40.8
1.9
0.0
0.8
0.4
9.8
7.6
30700
18 kg/hO2R= 3 vol%
Protocols
-Concentration:. Minute Values. Integral Values (e.g. 60’). 24-h Average Value. 48-h Average Value. Weekly Average Values. Monthly Average Values. Yearly Average Values
-Mass flow (Totals/ Averages):. Minute Values. Integral Values (e.g. 60’). 24-h Value. 48-h Value. Weekly Values. Monthly Values. Yearly Values
-Statistic:. Limit Values
(Percentile). Time of Operation. Time out of Operation. System Availability
(Analysers,Evaluation System)
Dust
O2
Tempera-ture
Flow
The integral values will be validated by subtraction of theconfidence interval at 95%. The daily averages will be calculatedfrom the validated integral values.
Integration 60 min
Integration 60 min
Integration 60 min
Integration 60 min
22
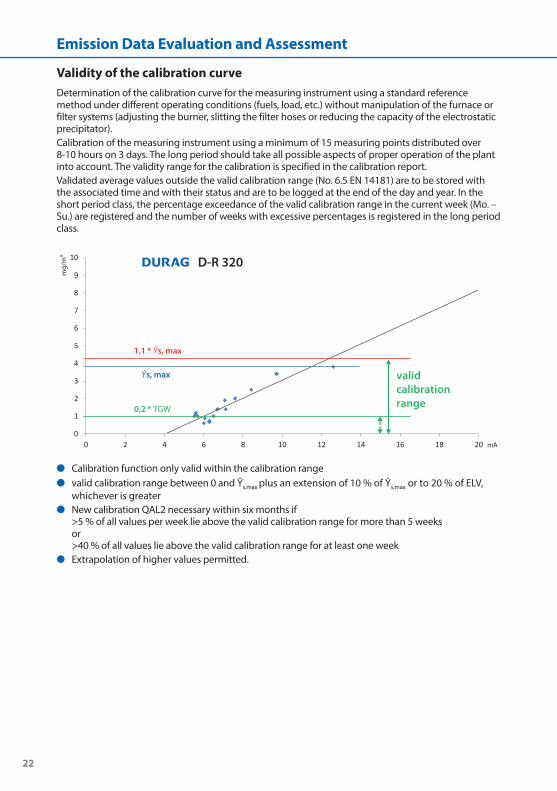
Validity of the calibration curveDetermination of the calibration curve for the measuring instrument using a standard reference method under different operating conditions (fuels, load, etc .) without manipulation of the furnace or filter systems (adjusting the burner, slitting the filter hoses or reducing the capacity of the electrostatic precipitator) .Calibration of the measuring instrument using a minimum of 15 measuring points distributed over 8-10 hours on 3 days . The long period should take all possible aspects of proper operation of the plant into account . The validity range for the calibration is specified in the calibration report .Validated average values outside the valid calibration range (No . 6 .5 EN 14181) are to be stored with the associated time and with their status and are to be logged at the end of the day and year . In the short period class, the percentage exceedance of the valid calibration range in the current week (Mo . – Su .) are registered and the number of weeks with excessive percentages is registered in the long period class .
●● Calibration function only valid within the calibration range●● valid calibration range between 0 and Ŷs,max plus an extension of 10 % of Ŷs,max or to 20 % of ELV,
whichever is greater●● New calibration QAL2 necessary within six months if
>5 % of all values per week lie above the valid calibration range for more than 5 weeks or >40 % of all values lie above the valid calibration range for at least one week
●● Extrapolation of higher values permitted .
0
1
2
3
4
5
6
7
8
9
10
0 2 4 6 8 10 12 14 16 18 20
validcalibrationrange
mg/m3
mA
Ŷs, max
1,1 * Ŷs, max
0,2 * TGW
Emission Data Evaluation and Assessment
23
Logging and documentation for verification●● Daily reports with all integral values incl . status information●● Monthly reports with all daily average values (48 h average values) incl . status information .●● Annual reports with all monthly average values incl . status information●● Statistics reports with information on limit value exceedances, availability of the AMS, failure of
waste gas cleaning equipment and the emitted emission quantity●● Documentation of failure of AMS for the operator’s information●● CUSUM, Shewhart or EMWA card to verify drift and precision of the AMS at the zero point and refer-
ence point ●● Complete documentation of the AMS by the operator in accordance with Point 9 Annex C of
EN 14181 Correct and legally conformant evaluation/ reporting of continuous measurement and calculation data is no longer possible manually . Modern computer-based evaluation systems are indispensable for ful-filling the specific requirements . These systems are pre-programmed according to the plant type; they acquire, calculate and report all emission-relevant data according to the legal requirements as well as the specifications of the local authorities .A special form of evaluation is prescribed in Germany and can also be activated to expand the EU standard evaluation .
Classification (required by authority in Germany)
Although all integral values are stored along with the plant and channel status, the principle of classi-fication is still maintained . Classification documents the class frequency distribution for the whole year on a single page in a clearly identifiable way . Limit value exceedances with reference to pollutants are identifiable at a glance . Classification must be referenced to a time starting at 00:00 . As an alternative to issuing classification tables, the integral values determined can also be issued as daily, monthly and annual tables .The daily average values are to be determined for the interval from 00:00 to 24:00 if there are at least 12 valid half-hourly average values are available .Every day is declared invalid, in which more than 5 half-hourly average values (WID) or 3 hourly average values (LCPD) are unavailable due to faults or maintenance of the continuous measurement system . If more than 10 days a year are declared invalid for such reasons, the competent authority must oblige the operator to introduce suitable measures to improve the reliability of the continuous monitoring system .
Minimum requirements CEN TC264 WG9 WI264076Stationary source emissions – Quality assurance of AMS data
Draft of March 2014:European Minimum Requirements for Data Acquisition and Handling Systems (DAHS)This European Standard specifies requirements for the handling of data produced by an AMS . The main items covered by the standard are given by, but not limited to raw data acquisition, raw data validation, data correction, data averaging, data security, data alarms, data archiving, data display, data access, program validation, data reporting and program integrity .It specifies the minimum requirements for the handling of AMS data, supporting the requirements of EN 14181 and legislation e .g . EU Directives such as IED . The standard does not preclude the use of ad-ditional features and functions provided the minimum requirements of this standard are met and that these features do not adversely affect data quality, clarity or access .The scope of this standard begins at the final data output terminals of the AMS and covers the entire process leading to and including the presentation of data to the competent authority .Raw data received in analogue format (4 – 20 mA) or as digital communication (e .g . Modbus, Profibus, OPC) from any AMS or PEMS output shall be continuously sampled at a rate fast enough to ensure no loss in information .
24
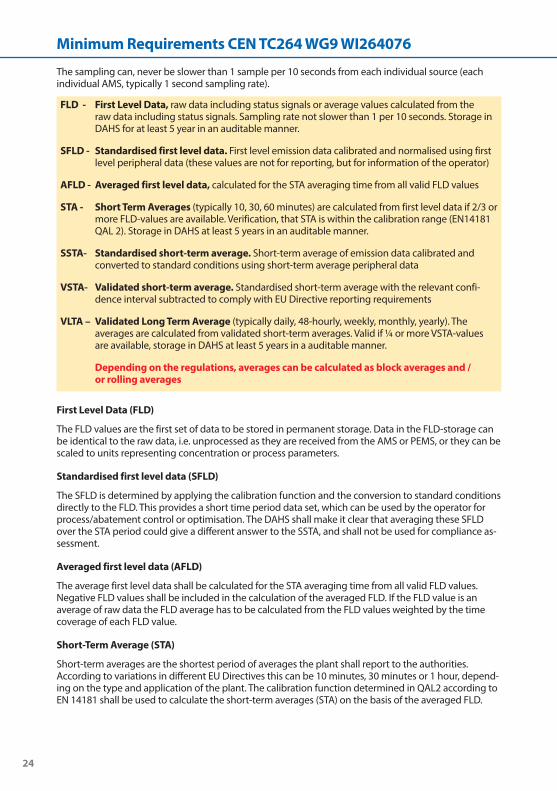
The sampling can, never be slower than 1 sample per 10 seconds from each individual source (each individual AMS, typically 1 second sampling rate) .
First Level Data (FLD)
The FLD values are the first set of data to be stored in permanent storage . Data in the FLD-storage can be identical to the raw data, i .e . unprocessed as they are received from the AMS or PEMS, or they can be scaled to units representing concentration or process parameters .
Standardised first level data (SFLD)
The SFLD is determined by applying the calibration function and the conversion to standard conditions directly to the FLD . This provides a short time period data set, which can be used by the operator for process/abatement control or optimisation . The DAHS shall make it clear that averaging these SFLD over the STA period could give a different answer to the SSTA, and shall not be used for compliance as-sessment .
Averaged first level data (AFLD)
The average first level data shall be calculated for the STA averaging time from all valid FLD values . Negative FLD values shall be included in the calculation of the averaged FLD . If the FLD value is an average of raw data the FLD average has to be calculated from the FLD values weighted by the time coverage of each FLD value .
Short-Term Average (STA)
Short-term averages are the shortest period of averages the plant shall report to the authorities . According to variations in different EU Directives this can be 10 minutes, 30 minutes or 1 hour, depend-ing on the type and application of the plant . The calibration function determined in QAL2 according to EN 14181 shall be used to calculate the short-term averages (STA) on the basis of the averaged FLD .
FLD - First Level Data, raw data including status signals or average values calculated from the raw data including status signals . Sampling rate not slower than 1 per 10 seconds . Storage in DAHS for at least 5 year in an auditable manner .
SFLD - Standardised first level data . First level emission data calibrated and normalised using first level peripheral data (these values are not for reporting, but for information of the operator)
AFLD - Averaged first level data, calculated for the STA averaging time from all valid FLD values
STA - Short Term Averages (typically 10, 30, 60 minutes) are calculated from first level data if 2/3 or more FLD-values are available . Verification, that STA is within the calibration range (EN14181 QAL 2) . Storage in DAHS at least 5 years in an auditable manner .
SSTA- Standardised short-term average . Short-term average of emission data calibrated and converted to standard conditions using short-term average peripheral data
VSTA- Validated short-term average . Standardised short-term average with the relevant confi-dence interval subtracted to comply with EU Directive reporting requirements
VLTA – Validated Long Term Average (typically daily, 48-hourly, weekly, monthly, yearly) . The averages are calculated from validated short-term averages . Valid if ¼ or more VSTA-values are available, storage in DAHS at least 5 years in a auditable manner .
Depending on the regulations, averages can be calculated as block averages and / or rolling averages
Minimum Requirements CEN TC264 WG9 WI264076
25
The STA shall be evaluated if valid FLD is available for at least two-thirds of the STA averaging time . The DAHS shall automatically log and report monthly the amount of time where exceedance of the meas-urement range has taken place, and the total time where data has been capped may not exceed 2 % of the total operation time in each individual calendar month .
Standardises short term averages (SSTA)
The SSTA is calculated by normalising the STA emission values with STA peripheral values, such like oxygen, temperature, pressure and moisture .
Validated short-term average (VSTA)
The validated STA (VSTA) shall be calculated by subtracting the uncertainty from the standardised STA in accordance with the procedure laid down in the national legislation .
NOTE: The EU Directives prescribe that, before reporting the concentration of any pollutant to the authorities, the measurement uncertainties in the form of 95 % confidence intervals shall be subtracted from the measurement value, for compliance reporting only . Different countries have different inter-pretation of this, and consequently different procedures of doing it . The method of subtracting and the value of the uncertainty shall be stated in the report and stored in the event log .
Validated Long Term Averages (VLTA)
Long-term averages are any longer periods of averages the plant shall report to the authorities . According to variations in different EU Directives the averaging period can be 1 day, 1 week, 1 month, 1 quarter or 1 year, depending on the type and application of the plant .The long-term average is calculated as the arithmetic mean of sufficient numbers of validated short-term averages (VSTA), to make up the period of the long-term average . If the plant operator shall report according to legal local time (LLT), the daily average shall be calculated as follows: for the day switching from LST to DST, where one hour is lost, the daily average shall be calculated from the STA values within the 23 h time period; for the day switching from DST to LST, where one hour is gained (duplicated), the daily average shall be calculated from the STA values within the 25 h time period .
QAL3 procedure
The QAL3 procedure should be performed in the DAHS, the necessary input data (measurement at zero and span point) shall either be automatically or manually entered into the DAHS . The DAHS reporting shall include all data related to the entire QAL3 process .
Calibration range check
Verification that the STA-measurement is within the calibration range as specified during the last valid QAL2 according to EN14181 .
26
Standardisation of concentrations and flue gas flow data
Measured concentrations shall be standardised only as SSTA-values (typically 10, 30, 60 minutes) since SSTA values are the only values validated by a calibration according to QAL2 procedure from EN14181 . Standardisation can include:
●● Correction to reference oxygen levels●● Correction for temperature●● Correction for pressure●● Correction for water vapour
The SSTA-value of the pollutant mass flow shall be calculated from SSTA-values of the concentration and the flue gas flow at same conditions . The annual emission is calculated by summation of the SSTA-values of the pollutant mass flow .Flue gas flows are for instance used for the calculation of the pollutant mass flow for reporting to the authority or calculation of the emission limit value in cases that two or more combustion plants are connected to one stack .
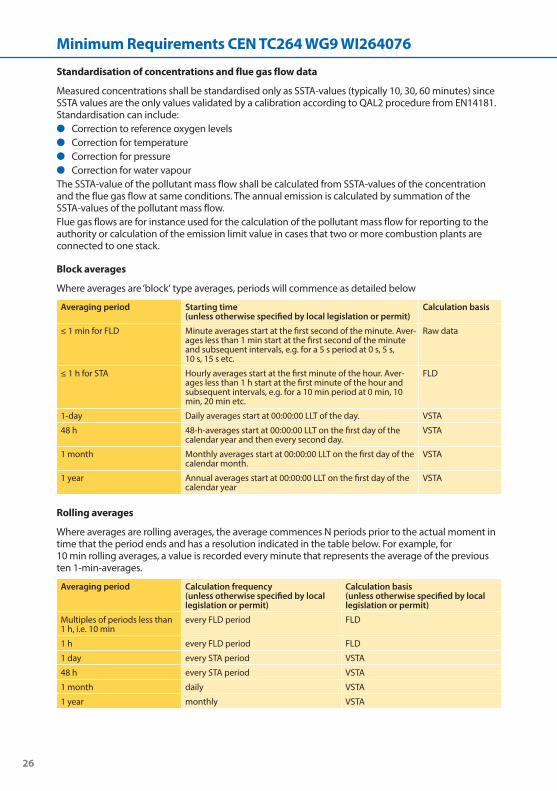
Block averages
Where averages are ‘block‘ type averages, periods will commence as detailed below
Averaging period Starting time (unless otherwise specified by local legislation or permit)
Calculation basis
≤ 1 min for FLD Minute averages start at the first second of the minute . Aver-ages less than 1 min start at the first second of the minute and subsequent intervals, e .g . for a 5 s period at 0 s, 5 s, 10 s, 15 s etc .
Raw data
≤ 1 h for STA Hourly averages start at the first minute of the hour . Aver-ages less than 1 h start at the first minute of the hour and subsequent intervals, e .g . for a 10 min period at 0 min, 10 min, 20 min etc .
FLD
1-day Daily averages start at 00:00:00 LLT of the day . VSTA
48 h 48-h-averages start at 00:00:00 LLT on the first day of the calendar year and then every second day .
VSTA
1 month Monthly averages start at 00:00:00 LLT on the first day of the calendar month .
VSTA
1 year Annual averages start at 00:00:00 LLT on the first day of the calendar year
VSTA
Rolling averages
Where averages are rolling averages, the average commences N periods prior to the actual moment in time that the period ends and has a resolution indicated in the table below . For example, for 10 min rolling averages, a value is recorded every minute that represents the average of the previous ten 1-min-averages .
Averaging period Calculation frequency (unless otherwise specified by local legislation or permit)
Calculation basis (unless otherwise specified by local legislation or permit)
Multiples of periods less than 1 h, i .e . 10 min
every FLD period FLD
1 h every FLD period FLD
1 day every STA period VSTA
48 h every STA period VSTA
1 month daily VSTA
1 year monthly VSTA
Minimum Requirements CEN TC264 WG9 WI264076
27
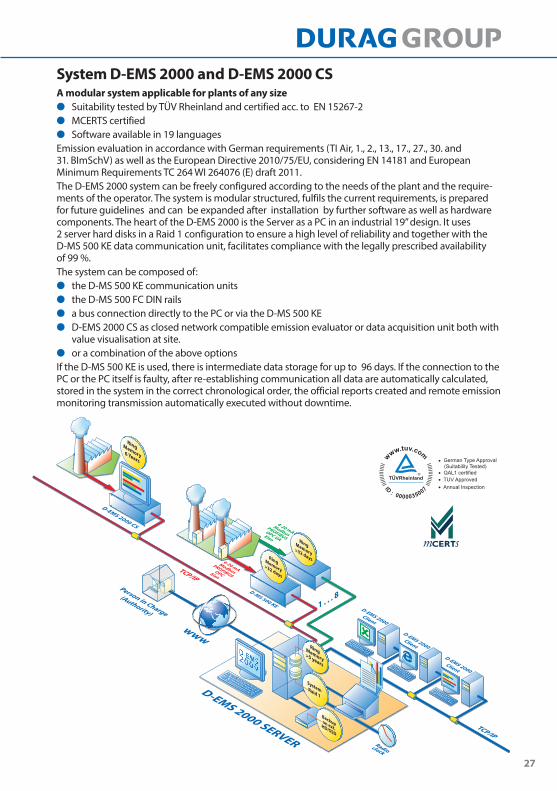
System D-EMS 2000 and D-EMS 2000 CSA modular system applicable for plants of any size
●● Suitability tested by TÜV Rheinland and certified acc . to EN 15267-2 ●● MCERTS certified●● Software available in 19 languages
Emission evaluation in accordance with German requirements (TI Air, 1 ., 2 ., 13 ., 17 ., 27 ., 30 . and 31 . BImSchV) as well as the European Directive 2010/75/EU, considering EN 14181 and European Minimum Requirements TC 264 WI 264076 (E) draft 2011 .The D-EMS 2000 system can be freely configured according to the needs of the plant and the require-ments of the operator . The system is modular structured, fulfils the current requirements, is prepared for future guidelines and can be expanded after installation by further software as well as hardware components . The heart of the D-EMS 2000 is the Server as a PC in an industrial 19” design . It uses 2 server hard disks in a Raid 1 configuration to ensure a high level of reliability and together with the D-MS 500 KE data communication unit, facilitates compliance with the legally prescribed availability of 99 % .The system can be composed of:
●● the D-MS 500 KE communication units●● the D-MS 500 FC DIN rails●● a bus connection directly to the PC or via the D-MS 500 KE●● D-EMS 2000 CS as closed network compatible emission evaluator or data acquisition unit both with
value visualisation at site .●● or a combination of the above options
If the D-MS 500 KE is used, there is intermediate data storage for up to 96 days . If the connection to the PC or the PC itself is faulty, after re-establishing communication all data are automatically calculated, stored in the system in the correct chronological order, the official reports created and remote emission monitoring transmission automatically executed without downtime .
www
D-EMS 2000 CS 4-20 mAModbus
PROFIBUS OPC UAElan
4-20 mAModbus
PROFIBUS OPCElan
TCP/IP
D-MS 500 KE
TCP/IP
D-EMS 2000Client
D-EMS 2000Client
D-EMS 2000Client
1 . . . 8
Memory>32 days
Ring
Backupon ext.HD/SSD
RingMemory>5 years
SystemRaid 1
Person in Charge
(Authority)
Memory>32 days
Ring
Radioclock
D-EMS 2000 SERVER
Ring6 Years
Memory
28
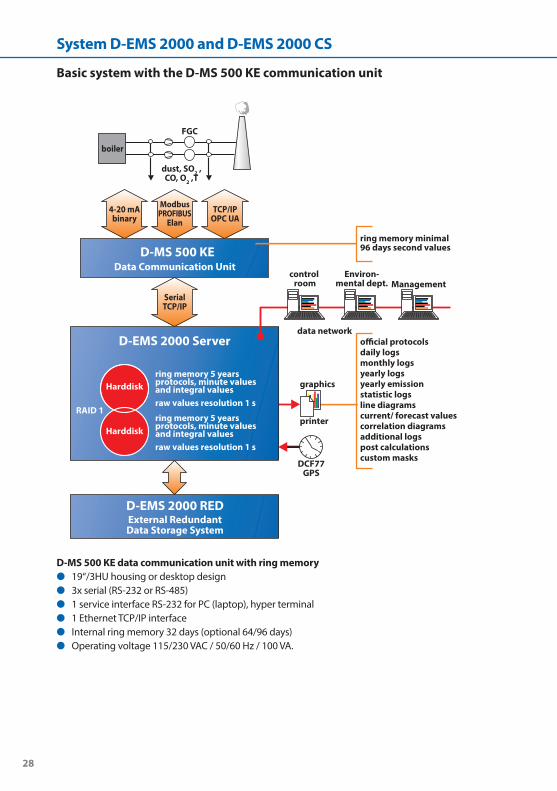
Basic system with the D-MS 500 KE communication unit
D-MS 500 KE data communication unit with ring memory●● 19“/3HU housing or desktop design●● 3x serial (RS-232 or RS-485)●● 1 service interface RS-232 for PC (laptop), hyper terminal●● 1 Ethernet TCP/IP interface●● Internal ring memory 32 days (optional 64/96 days)●● Operating voltage 115/230 VAC / 50/60 Hz / 100 VA .
DCF77GPS
data networko�cial protocolsdaily logsmonthly logsyearly logsyearly emissionstatistic logsline diagramscurrent/ forecast valuescorrelation diagramsadditional logspost calculationscustom masks
printer
graphics
External RedundantData Storage System
D-EMS 2000 RED
D-EMS 2000 Server
ring memory 5 yearsprotocols, minute valuesand integral valuesraw values resolution 1 s
ring memory 5 yearsprotocols, minute valuesand integral valuesraw values resolution 1 s
ring memory minimal96 days second values
Data Communication Unitcontrol
roomEnviron-
mental dept. ManagementSerialTCP/IP
boiler
dust, SO2 ,CO, O2 ,T
FGC
4-20 mAbinary
ModbusPROFIBUS
ElanTCP/IP
OPC UA
D-MS 500 KE
Harddisk
Harddisk
RAID 1
System D-EMS 2000 and D-EMS 2000 CS
29
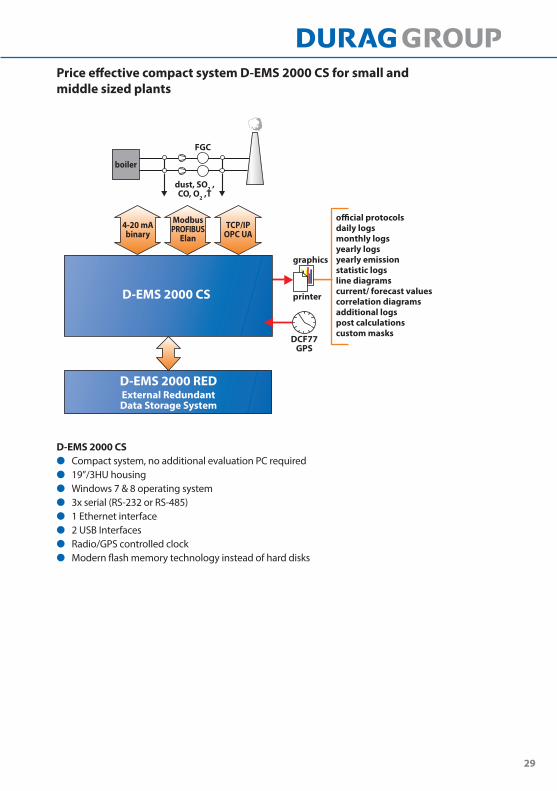
Price effective compact system D-EMS 2000 CS for small and middle sized plants
D-EMS 2000 CS●● Compact system, no additional evaluation PC required●● 19”/3HU housing●● Windows 7 & 8 operating system●● 3x serial (RS-232 or RS-485)●● 1 Ethernet interface●● 2 USB Interfaces●● Radio/GPS controlled clock●● Modern flash memory technology instead of hard disks
D-EMS 2000 CS
D-EMS 2000 RED
DCF77GPS
o�cial protocolsdaily logsmonthly logsyearly logsyearly emissionstatistic logsline diagramscurrent/ forecast valuescorrelation diagramsadditional logspost calculationscustom masks
printer
graphics
External RedundantData Storage System
boiler
dust, SO2 ,CO, O2 ,T
FGC
4-20 mAbinary
ModbusPROFIBUS
ElanTCP/IP
OPC UA
30
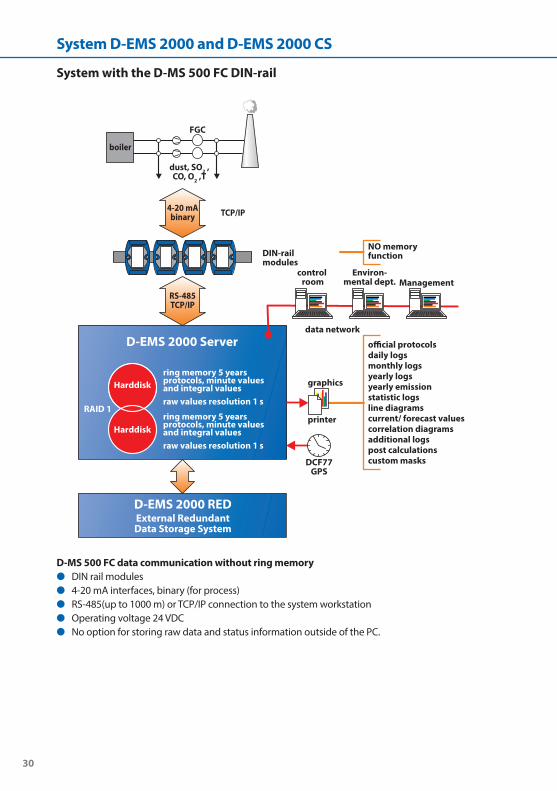
System with the D-MS 500 FC DIN-rail
D-MS 500 FC data communication without ring memory●● DIN rail modules●● 4-20 mA interfaces, binary (for process)●● RS-485(up to 1000 m) or TCP/IP connection to the system workstation●● Operating voltage 24 VDC●● No option for storing raw data and status information outside of the PC .
D-EMS 2000 RED
D-EMS 2000 Server
RAID 1
DCF77GPS
o�cial protocolsdaily logsmonthly logsyearly logsyearly emissionstatistic logsline diagramscurrent/ forecast valuescorrelation diagramsadditional logspost calculationscustom masks
Harddiskring memory 5 yearsprotocols, minute valuesand integral values
printer
graphics
External RedundantData Storage System
raw values resolution 1 s
ring memory 5 yearsprotocols, minute valuesand integral valuesraw values resolution 1 s
data network
NO memoryfunction
control room
Environ-mental dept. Management
boiler
dust, SO2 ,CO, O2 ,T
FGC
4-20 mAbinary TCP/IP
DIN-railmodules
Harddisk
RS-485TCP/IP
System D-EMS 2000 and D-EMS 2000 CS
31
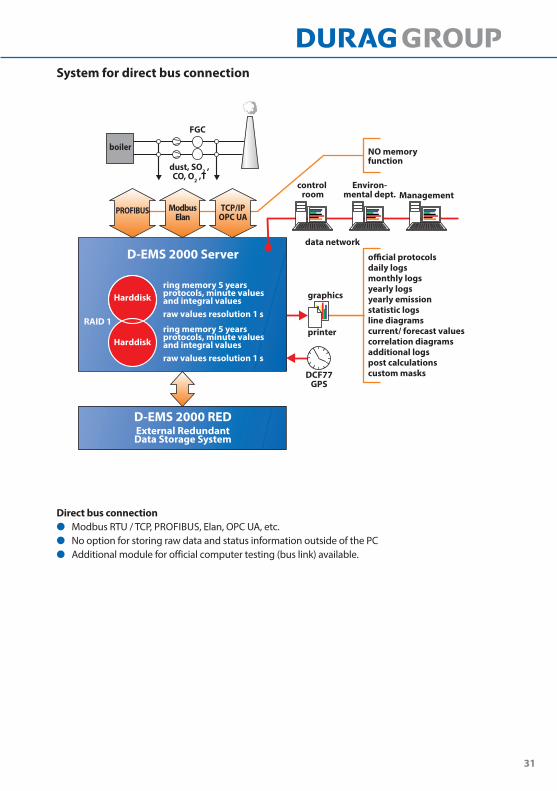
System for direct bus connection
Direct bus connection●● Modbus RTU / TCP, PROFIBUS, Elan, OPC UA, etc .●● No option for storing raw data and status information outside of the PC●● Additional module for official computer testing (bus link) available .
D-EMS 2000 Server
D-EMS 2000 RED
DCF77GPS
o�cial protocolsdaily logsmonthly logsyearly logsyearly emissionstatistic logsline diagramscurrent/ forecast valuescorrelation diagramsadditional logspost calculationscustom masks
printer
graphicsHarddisk
Harddisk
ring memory 5 yearsprotocols, minute valuesand integral values
External RedundantData Storage System
raw values resolution 1 s
ring memory 5 yearsprotocols, minute valuesand integral valuesraw values resolution 1 s
RAID 1
data network
NO memoryfunction
control room
Environ-mental dept. Management
boiler
dust, SO2 ,CO, O2 ,T
FGC
ModbusElan
PROFIBUS TCP/IPOPC UA
32
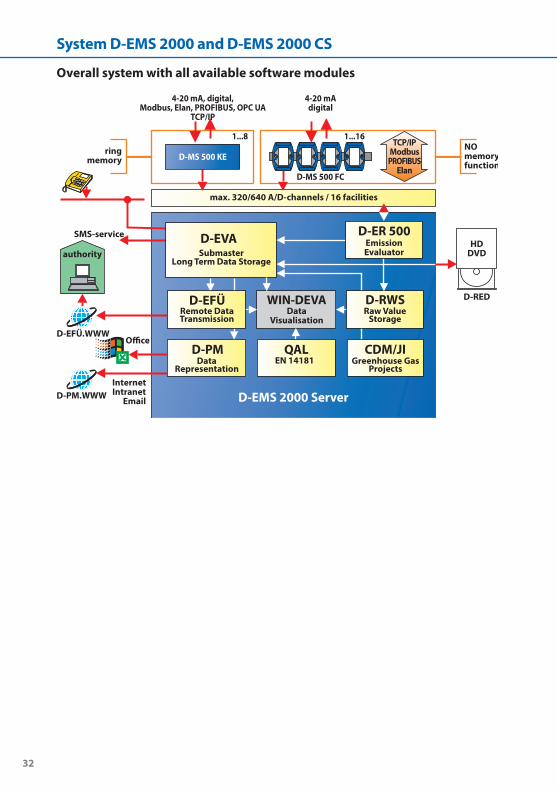
Overall system with all available software modules
D-EMS 2000 Server
D-RED
InternetIntranet
O�ce
HDDVD
D-EVASubmaster
Long Term Data Storage
D-PMData
Representation
D-ER 500EmissionEvaluator
CDM/JIGreenhouse Gas
ProjectsEN 14181
WIN-DEVAData
Visualisation
D-EFÜRemote DataTransmission
D-RWSRaw Value
Storage
QAL
authority
SMS-service
max. 320/640 A/D-channels / 16 facilities
D-MS 500 FC
NOmemoryfunction
4-20 mAdigital
TCP/IPModbus
PROFIBUSElan
D-MS 500 KE
4-20 mA, digital,Modbus, Elan, PROFIBUS, OPC UA
TCP/IP
1...161...8
ringmemory
D-EFÜ.WWW
D-PM.WWW
System D-EMS 2000 and D-EMS 2000 CS
33
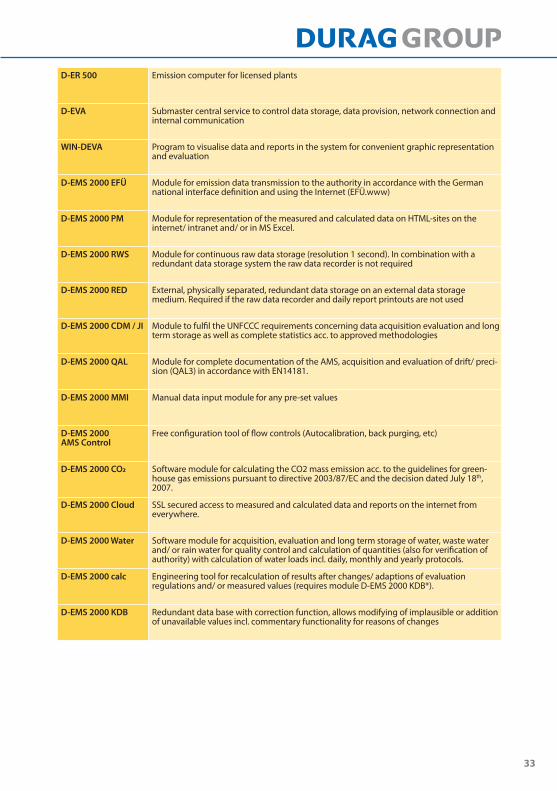
D-ER 500 Emission computer for licensed plants
D-EVA Submaster central service to control data storage, data provision, network connection and internal communication
WIN-DEVA Program to visualise data and reports in the system for convenient graphic representation and evaluation
D-EMS 2000 EFÜ Module for emission data transmission to the authority in accordance with the German national interface definition and using the Internet (EFÜ .www)
D-EMS 2000 PM Module for representation of the measured and calculated data on HTML-sites on the internet/ intranet and/ or in MS Excel .
D-EMS 2000 RWS Module for continuous raw data storage (resolution 1 second) . In combination with a redundant data storage system the raw data recorder is not required
D-EMS 2000 RED External, physically separated, redundant data storage on an external data storage medium . Required if the raw data recorder and daily report printouts are not used
D-EMS 2000 CDM / JI Module to fulfil the UNFCCC requirements concerning data acquisition evaluation and long term storage as well as complete statistics acc . to approved methodologies
D-EMS 2000 QAL Module for complete documentation of the AMS, acquisition and evaluation of drift/ preci-sion (QAL3) in accordance with EN14181 .
D-EMS 2000 MMI Manual data input module for any pre-set values
D-EMS 2000 AMS Control
Free configuration tool of flow controls (Autocalibration, back purging, etc)
D-EMS 2000 CO2 Software module for calculating the CO2 mass emission acc . to the guidelines for green-house gas emissions pursuant to directive 2003/87/EC and the decision dated July 18th, 2007 .
D-EMS 2000 Cloud SSL secured access to measured and calculated data and reports on the internet from everywhere .
D-EMS 2000 Water Software module for acquisition, evaluation and long term storage of water, waste water and/ or rain water for quality control and calculation of quantities (also for verification of authority) with calculation of water loads incl . daily, monthly and yearly protocols .
D-EMS 2000 calc Engineering tool for recalculation of results after changes/ adaptions of evaluation regulations and/ or measured values (requires module D-EMS 2000 KDB*) .
D-EMS 2000 KDB Redundant data base with correction function, allows modifying of implausible or addition of unavailable values incl . commentary functionality for reasons of changes

34
ApplicationsThe modular construction of the D-EMS 2000 system allows both very small and very large plants to be designed in accordance with the requirements with very little effort . Even requirements encompassing different locations (company group structure) may be optimally satisfied .
Smaller-sized plants
Medium-sized plants
Convenient and cost-effective modern emission data acquisition and evaluation system for medium- sized and large plants such as:
●● Heating stations●● Combined heat and power stations●● Power stations●● Biomass plants●● Refinery plants●● Cement plants .
1...8
D-EMS 2000
AnalyzersDCS
Modbus, PROFIBUS,Elan, TCP/IP,
OPC UA
4-20 mAbinary
4-20 mAbinary
Modbus, PROFIBUS,Elan, TCP/IP,
OPC UA
TCP/IP or RS-485
D-MS 500 KE
4-20 mAbinary
Modbus, PROFIBUS,Elan, TCP/IP,
OPC UA
D-EMS 2000 CSD-MS 500 FC
1...16
D-EMS 2000
D-MS 500 FC
AnalyzersDCS
Modbus, PROFIBUS,Elan, TCP/IP, OPC UA
4-20 mAbinary
Modbus, PROFIBUS,Elan, TCP/IP, OPC UA
4-20 mAbinary
D-EMS 2000 CS
Convenient and cost-effective modern emission data acquisition and evaluation system for small plants such as:
●● Heating plants●● Combustion plants●● Small power stations●● Biomass plants
Applications
35
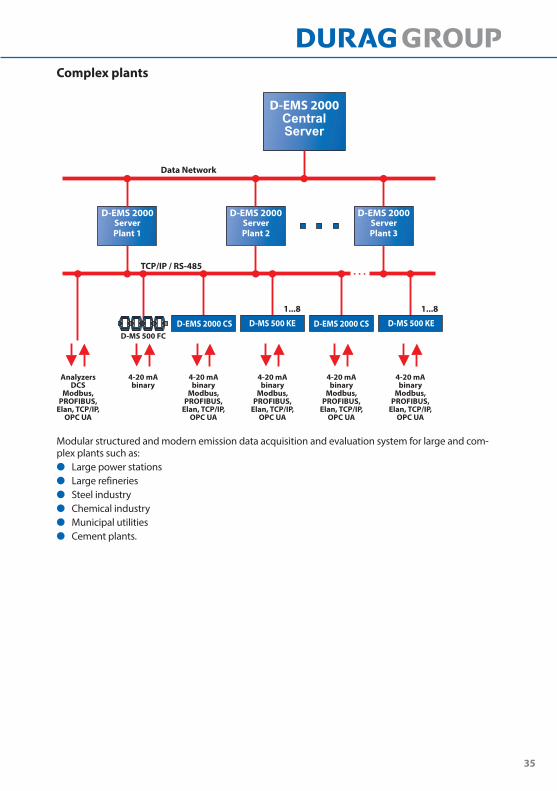
Complex plants
Modular structured and modern emission data acquisition and evaluation system for large and com-plex plants such as:
●● Large power stations●● Large refineries●● Steel industry●● Chemical industry●● Municipal utilities●● Cement plants .
TCP/IP / RS-485
AnalyzersDCS
Modbus,PROFIBUS,
Elan, TCP/IP,OPC UA
D-MS 500 FC
1...8 1...8
4-20 mAbinary
4-20 mAbinary
Modbus,PROFIBUS,
Elan, TCP/IP,OPC UA
4-20 mAbinary
Modbus,PROFIBUS,
Elan, TCP/IP,OPC UA
4-20 mAbinary
Modbus,PROFIBUS,
Elan, TCP/IP,OPC UA
4-20 mAbinary
Modbus,PROFIBUS,
Elan, TCP/IP,OPC UA
ServerPlant 1
D-EMS 2000 D-EMS 2000 D-EMS 2000
Data Network
ServerPlant 2
ServerPlant 3
D-MS 500 KED-MS 500 KE D-EMS 2000 CSD-EMS 2000 CS
D-EMS 2000
36
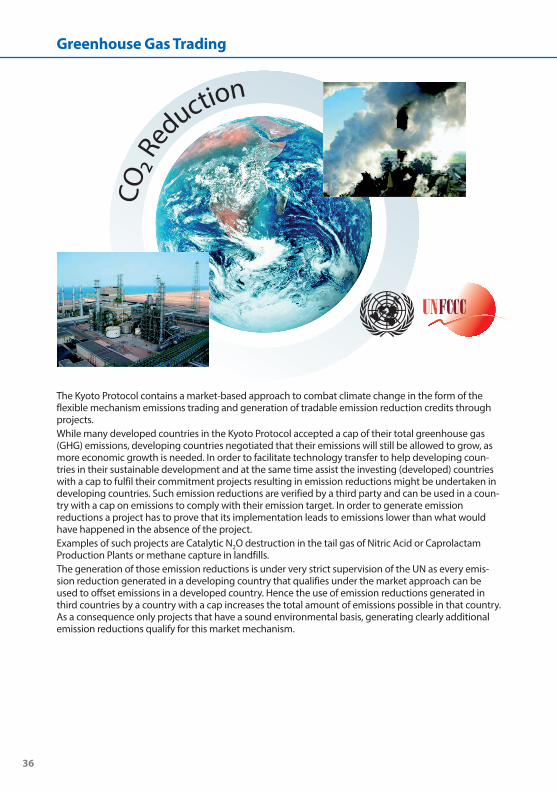
The Kyoto Protocol
CO2 R
eduction
contains a market-based approach to combat climate change in the form of the flexible mechanism emissions trading and generation of tradable emission reduction credits through projects .While many developed countries in the Kyoto Protocol accepted a cap of their total greenhouse gas (GHG) emissions, developing countries negotiated that their emissions will still be allowed to grow, as more economic growth is needed . In order to facilitate technology transfer to help developing coun-tries in their sustainable development and at the same time assist the investing (developed) countries with a cap to fulfil their commitment projects resulting in emission reductions might be undertaken in developing countries . Such emission reductions are verified by a third party and can be used in a coun-try with a cap on emissions to comply with their emission target . In order to generate emission reductions a project has to prove that its implementation leads to emissions lower than what would have happened in the absence of the project . Examples of such projects are Catalytic N2O destruction in the tail gas of Nitric Acid or Caprolactam Production Plants or methane capture in landfills . The generation of those emission reductions is under very strict supervision of the UN as every emis-sion reduction generated in a developing country that qualifies under the market approach can be used to offset emissions in a developed country . Hence the use of emission reductions generated in third countries by a country with a cap increases the total amount of emissions possible in that country . As a consequence only projects that have a sound environmental basis, generating clearly additional emission reductions qualify for this market mechanism .
Greenhouse Gas Trading
37
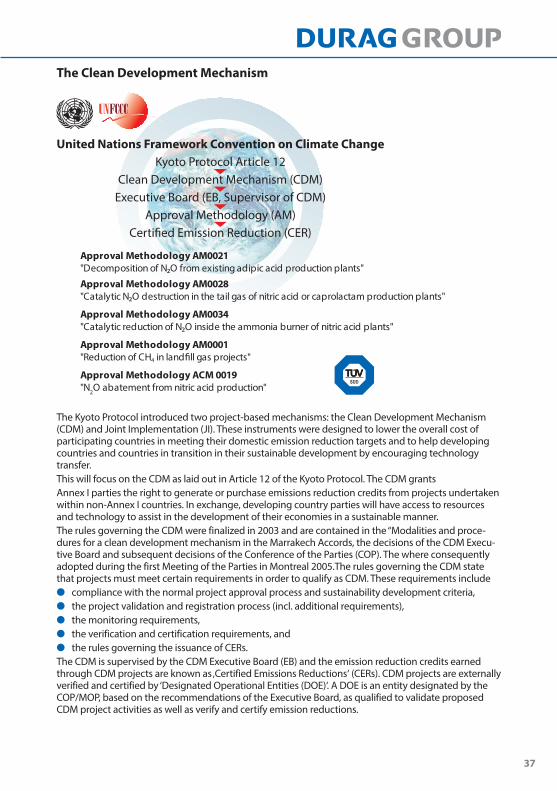
The Clean Development Mechanism
The Kyoto Protocol introduced two project-based mechanisms: the Clean Development Mechanism (CDM) and Joint Implementation (JI) . These instruments were designed to lower the overall cost of participating countries in meeting their domestic emission reduction targets and to help developing countries and countries in transition in their sustainable development by encouraging technology transfer .This will focus on the CDM as laid out in Article 12 of the Kyoto Protocol . The CDM grantsAnnex I parties the right to generate or purchase emissions reduction credits from projects undertaken within non-Annex I countries . In exchange, developing country parties will have access to resources and technology to assist in the development of their economies in a sustainable manner .The rules governing the CDM were finalized in 2003 and are contained in the “Modalities and proce-dures for a clean development mechanism in the Marrakech Accords, the decisions of the CDM Execu-tive Board and subsequent decisions of the Conference of the Parties (COP) . The where consequently adopted during the first Meeting of the Parties in Montreal 2005 .The rules governing the CDM state that projects must meet certain requirements in order to qualify as CDM . These requirements include
●● compliance with the normal project approval process and sustainability development criteria,●● the project validation and registration process (incl . additional requirements),●● the monitoring requirements,●● the verification and certification requirements, and●● the rules governing the issuance of CERs .
The CDM is supervised by the CDM Executive Board (EB) and the emission reduction credits earned through CDM projects are known as ‚Certified Emissions Reductions‘ (CERs) . CDM projects are externally verified and certified by ‘Designated Operational Entities (DOE)‘ . A DOE is an entity designated by the COP/MOP, based on the recommendations of the Executive Board, as qualified to validate proposed CDM project activities as well as verify and certify emission reductions .
United Nations Framework Convention on Climate ChangeKyoto Protocol Article 12
Clean Development Mechanism (CDM)Executive Board (EB, Supervisor of CDM)
Approval Methodology (AM)Certi�ed Emission Reduction (CER)
Approval Methodology AM0021"Decomposition of N2O from existing adipic acid production plants"
Approval Methodology AM0028"Catalytic N2O destruction in the tail gas of nitric acid or caprolactam production plants"
Approval Methodology AM0034"Catalytic reduction of N2O inside the ammonia burner of nitric acid plants"
Approval Methodology AM0001"Reduction of CH4 in land�ll gas projects"
Approval Methodology ACM 0019"N2O abatement from nitric acid production"
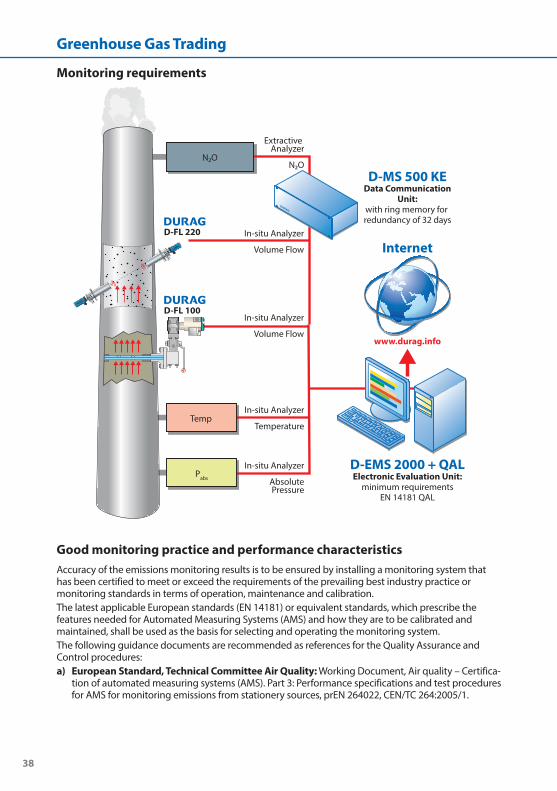
38
Monitoring requirements
Good monitoring practice and performance characteristicsAccuracy of the emissions monitoring results is to be ensured by installing a monitoring system that has been certified to meet or exceed the requirements of the prevailing best industry practice or monitoring standards in terms of operation, maintenance and calibration . The latest applicable European standards (EN 14181) or equivalent standards, which prescribe the features needed for Automated Measuring Systems (AMS) and how they are to be calibrated and maintained, shall be used as the basis for selecting and operating the monitoring system .The following guidance documents are recommended as references for the Quality Assurance and Control procedures:a) European Standard, Technical Committee Air Quality: Working Document, Air quality – Certifica-
tion of automated measuring systems (AMS) . Part 3: Performance specifications and test procedures for AMS for monitoring emissions from stationery sources, prEN 264022, CEN/TC 264:2005/1 .
N2O
Pabs
Temp
Extractive Analyzer
N2O
In-situ Analyzer
Volume Flow
In-situ Analyzer
Temperature
In-situ Analyzer
AbsolutePressure
In-situ Analyzer
Volume Flow
D-FL 220
D-FL 100
D-EMS 2000 + QALElectronic Evaluation Unit:
minimum requirementsEN 14181 QAL
D-MS 500 KEData Communication
Unit:with ring memory for redundancy of 32 days
Internet
www.durag.info
Greenhouse Gas Trading
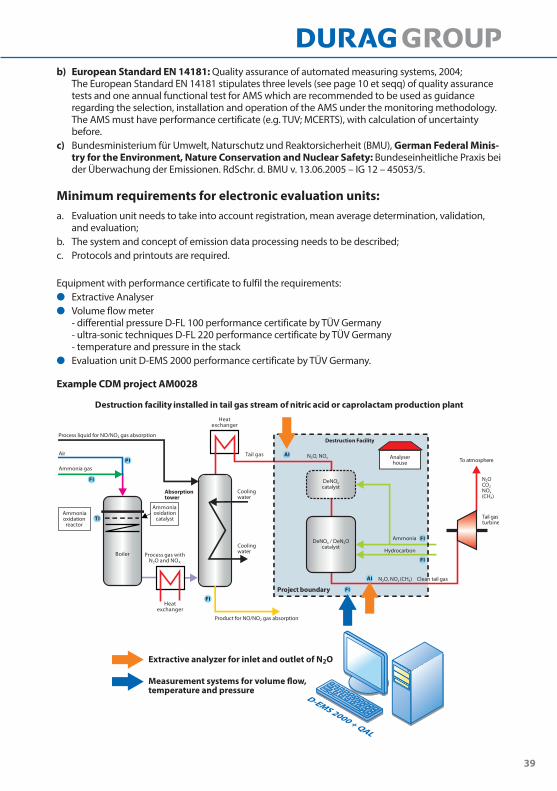
39
b) European Standard EN 14181: Quality assurance of automated measuring systems, 2004; The European Standard EN 14181 stipulates three levels (see page 10 et seqq) of quality assurance tests and one annual functional test for AMS which are recommended to be used as guidance regarding the selection, installation and operation of the AMS under the monitoring methodology . The AMS must have performance certificate (e .g . TUV; MCERTS), with calculation of uncertainty before .
c) Bundesministerium für Umwelt, Naturschutz und Reaktorsicherheit (BMU), German Federal Minis-try for the Environment, Nature Conservation and Nuclear Safety: Bundeseinheitliche Praxis bei der Überwachung der Emissionen . RdSchr . d . BMU v . 13 .06 .2005 – IG 12 – 45053/5 .
Minimum requirements for electronic evaluation units:a . Evaluation unit needs to take into account registration, mean average determination, validation, and evaluation; b . The system and concept of emission data processing needs to be described;c . Protocols and printouts are required .
Equipment with performance certificate to fulfil the requirements:●● Extractive Analyser ●● Volume flow meter
- differential pressure D-FL 100 performance certificate by TÜV Germany - ultra-sonic techniques D-FL 220 performance certificate by TÜV Germany - temperature and pressure in the stack
●● Evaluation unit D-EMS 2000 performance certificate by TÜV Germany .
Example CDM project AM0028
Analyserhouse
Absorptiontower
Process gas with N O and NO2 X
DeNO / DeN Ocatalyst
x 2
Tail gasturbine
To atmosphere
Destruction Facility
Hydrocarbon
Destruction facility installed in tail gas stream of nitric acid or caprolactam production plant
Tail gas
Process liquid for NO/NO gas absorption2
Coolingwater
Ammoniaoxidation
reactor
Ammoniaoxidationcatalyst
Air
Ammonia gas
Project boundary
PI
FI
TI
FI
AI
FI
FI
AI
FI
Boiler
Heatexchanger
Ammonia
Product for NO/NO gas absorption2
Coolingwater
DeNOcatalyst
x
N O, NO2 x
N O, NO (CH ) 2 x 4 Clean tail gas
N OCONO(CH )
2
2
x
4
Extractive analyzer for inlet and outlet of N O2
Measurement systems for volume �ow, temperature and pressure
Heatexchanger
D-EMS 2000 + QAL
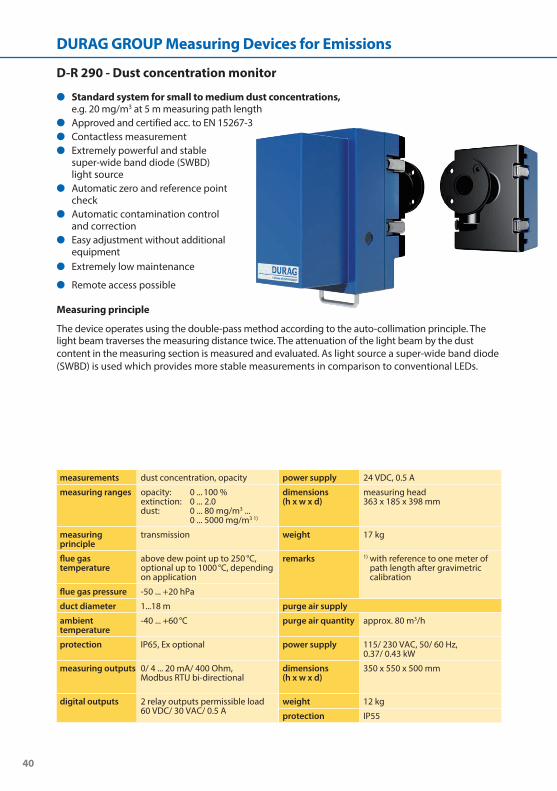
40
D-R 290 - Dust concentration monitor
●● Standard system for small to medium dust concentrations, e .g . 20 mg/m3 at 5 m measuring path length
●● Approved and certified acc . to EN 15267-3●● Contactless measurement●● Extremely powerful and stable
super-wide band diode (SWBD) light source
●● Automatic zero and reference point check
●● Automatic contamination control and correction
●● Easy adjustment without additional equipment
●● Extremely low maintenance
●● Remote access possible
Measuring principle
The device operates using the double-pass method according to the auto-collimation prin ciple . The light beam traverses the measuring distance twice . The attenuation of the light beam by the dust content in the measuring section is measured and evaluated . As light source a super-wide band diode (SWBD) is used which provides more stable measurements in comparison to conventional LEDs .
DURAG GROUP Measuring Devices for Emissions
measurements dust concentration, opacity power supply 24 VDC, 0 .5 A
measuring ranges opacity: 0 . . . 100 % extinction: 0 . . . 2 .0 dust: 0 . . . 80 mg/m3 . . . 0 . . . 5000 mg/m3 1)
dimensions (h x w x d)
measuring head 363 x 185 x 398 mm
measuring principle
transmission weight 17 kg
flue gas temperature
above dew point up to 250 °C, optional up to 1000 °C, depending on application
remarks 1) with reference to one meter of path length after gravimetric calibration
flue gas pressure -50 . . . +20 hPa
duct diameter 1 . . .18 m purge air supply
ambient temperature
-40 . . . +60 °C purge air quantity approx . 80 m3/h
protection IP65, Ex optional power supply 115/ 230 VAC, 50/ 60 Hz, 0 .37/ 0 .43 kW
measuring outputs 0/ 4 . . . 20 mA/ 400 Ohm,Modbus RTU bi-directional
dimensions (h x w x d)
350 x 550 x 500 mm
digital outputs 2 relay outputs permissible load60 VDC/ 30 VAC/ 0 .5 A
weight 12 kg
protection IP55
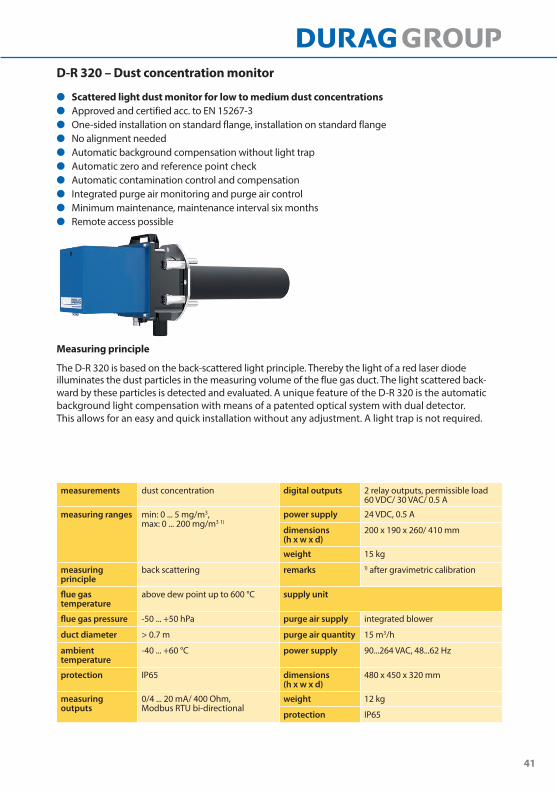
41
D-R 320 – Dust concentration monitor
●● Scattered light dust monitor for low to medium dust concentrations●● Approved and certified acc . to EN 15267-3●● One-sided installation on standard flange, installation on standard flange●● No alignment needed●● Automatic background compensation without light trap●● Automatic zero and reference point check●● Automatic contamination control and compensation●● Integrated purge air monitoring and purge air control ●● Minimum maintenance, maintenance interval six months●● Remote access possible
Measuring principle
The D-R 320 is based on the back-scattered light principle . Thereby the light of a red laser diode illuminates the dust particles in the measuring volume of the flue gas duct . The light scattered back-ward by these particles is detected and evaluated . A unique feature of the D-R 320 is the automatic background light compensation with means of a patented optical system with dual detector . This allows for an easy and quick installation without any adjustment . A light trap is not required .
measurements dust concentration digital outputs 2 relay outputs, permissible load60 VDC/ 30 VAC/ 0 .5 A
power supply 24 VDC, 0 .5 Ameasuring ranges min: 0 . . . 5 mg/m3,max: 0 . . . 200 mg/m3 1)
dimensions (h x w x d)
200 x 190 x 260/ 410 mm
weight 15 kg
measuring principle
back scattering remarks 1) after gravimetric calibration
flue gas temperature
above dew point up to 600 °C supply unit
flue gas pressure -50 . . . +50 hPa purge air supply integrated blower
duct diameter > 0 .7 m purge air quantity 15 m3/h
ambienttemperature
-40 . . . +60 °C power supply 90 . . .264 VAC, 48 . . .62 Hz
protection IP65 dimensions (h x w x d)
480 x 450 x 320 mm
measuring outputs
0/4 . . . 20 mA/ 400 Ohm,Modbus RTU bi-directional
weight 12 kg
protection IP65
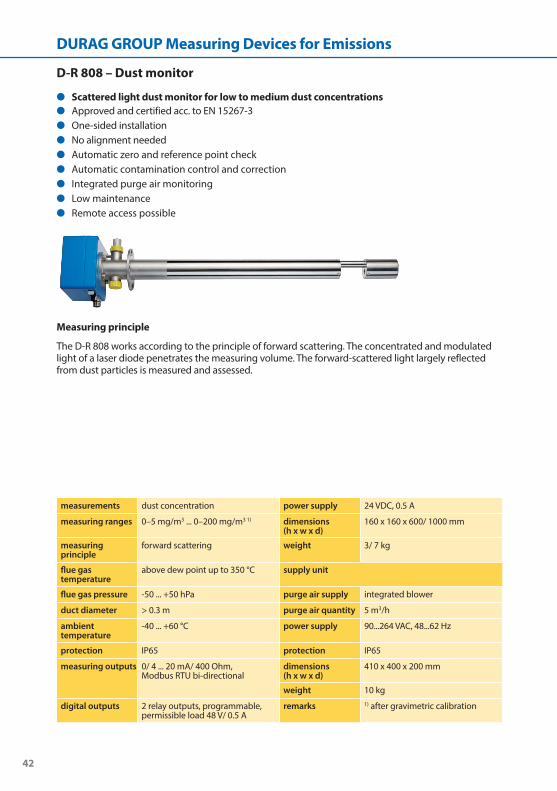
42
D-R 808 – Dust monitor
●● Scattered light dust monitor for low to medium dust concentrations●● Approved and certified acc . to EN 15267-3 ●● One-sided installation●● No alignment needed●● Automatic zero and reference point check●● Automatic contamination control and correction●● Integrated purge air monitoring●● Low maintenance●● Remote access possible
Measuring principle
The D-R 808 works according to the principle of forward scattering . The concentrated and modulated light of a laser diode penetrates the measuring volume . The forward-scattered light largely reflected from dust particles is measured and assessed .
measurements dust concentration power supply 24 VDC, 0 .5 A
measuring ranges 0–5 mg/m3 . . . 0–200 mg/m3 1) dimensions (h x w x d)
160 x 160 x 600/ 1000 mm
measuring principle
forward scattering weight 3/ 7 kg
flue gas temperature
above dew point up to 350 °C supply unit
flue gas pressure -50 . . . +50 hPa purge air supply integrated blower
duct diameter > 0 .3 m purge air quantity 5 m3/h
ambient temperature
-40 . . . +60 °C power supply 90 . . .264 VAC, 48 . . .62 Hz
protection IP65 protection IP65
measuring outputs 0/ 4 . . . 20 mA/ 400 Ohm,Modbus RTU bi-directional
dimensions (h x w x d)
410 x 400 x 200 mm
weight 10 kg
digital outputs 2 relay outputs, programmable, permissible load 48 V/ 0 .5 A
remarks 1) after gravimetric calibration
DURAG GROUP Measuring Devices for Emissions
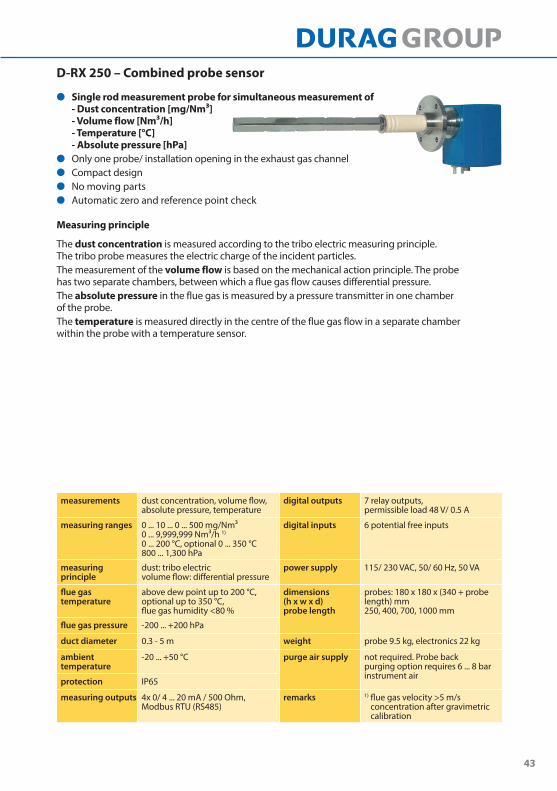
43
D-RX 250 – Combined probe sensor
●● Single rod measurement probe for simultaneous measurement of - Dust concentration [mg/Nm³] - Volume flow [Nm³/h] - Temperature [°C] - Absolute pressure [hPa]
●● Only one probe/ installation opening in the exhaust gas channel ●● Compact design ●● No moving parts●● Automatic zero and reference point check
Measuring principle
The dust concentration is measured according to the tribo electric measuring principle . The tribo probe measures the electric charge of the incident particles . The measurement of the volume flow is based on the mechanical action principle . The probe has two separate chambers, between which a flue gas flow causes differential pressure . The absolute pressure in the flue gas is measured by a pressure transmitter in one chamber of the probe . The temperature is measured directly in the centre of the flue gas flow in a separate chamber within the probe with a temperature sensor .
measurements dust concentration, volume flow, absolute pressure, temperature
digital outputs 7 relay outputs, permissible load 48 V/ 0 .5 A
measuring ranges 0 . . . 10 . . . 0 . . . 500 mg/Nm³0 . . . 9,999,999 Nm³/h 1)
0 . . . 200 °C, optional 0 . . . 350 °C800 . . . 1,300 hPa
digital inputs 6 potential free inputs
measuring principle
dust: tribo electric volume flow: differential pressure
power supply 115/ 230 VAC, 50/ 60 Hz, 50 VA
flue gas temperature
above dew point up to 200 °C, optional up to 350 °C, flue gas humidity <80 %
dimensions (h x w x d) probe length
probes: 180 x 180 x (340 + probe length) mm 250, 400, 700, 1000 mm
flue gas pressure -200 . . . +200 hPa
duct diameter 0 .3 - 5 m weight probe 9 .5 kg, electronics 22 kg
ambient temperature
-20 . . . +50 °C purge air supply not required . Probe back purging option requires 6 . . . 8 bar instrument air
protection IP65
measuring outputs 4x 0/ 4 . . . 20 mA / 500 Ohm, Modbus RTU (RS485)
remarks 1) flue gas velocity >5 m/s concentration after gravimetric calibration
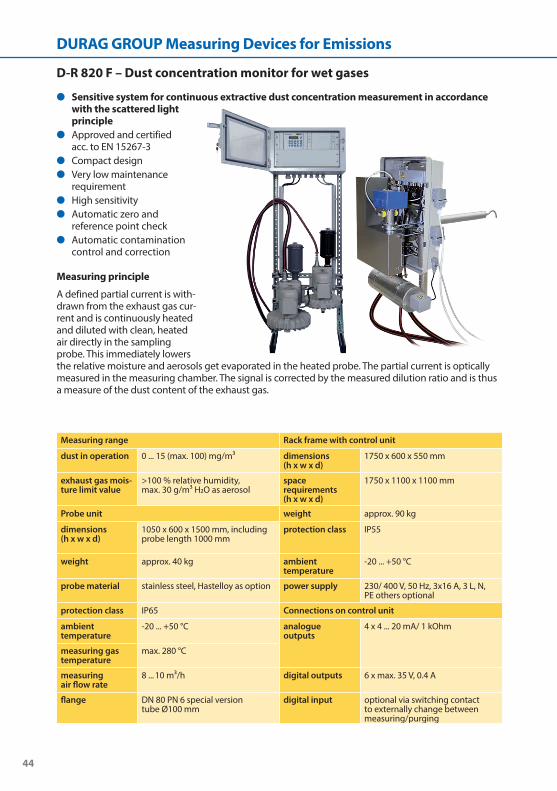
44
D-R 820 F – Dust concentration monitor for wet gases
●● Sensitive system for continuous extractive dust concentration measurement in accordance with the scattered light principle
●● Approved and certified acc . to EN 15267-3
●● Compact design●● Very low maintenance
requirement●● High sensitivity●● Automatic zero and
reference point check●● Automatic contamination
control and correction
Measuring principle
A defined partial current is with-drawn from the exhaust gas cur-rent and is continuously heated and diluted with clean, heated air directly in the sampling probe . This immediately lowers the relative moisture and aerosols get evaporated in the heated probe . The partial current is optically measured in the measuring chamber . The signal is corrected by the measured dilution ratio and is thus a measure of the dust content of the exhaust gas .
Measuring range Rack frame with control unit
dust in operation 0 . . . 15 (max . 100) mg/m³ dimensions (h x w x d)
1750 x 600 x 550 mm
exhaust gas mois-ture limit value
>100 % relative humidity, max . 30 g/m3 H2O as aerosol
space requirements(h x w x d)
1750 x 1100 x 1100 mm
Probe unit weight approx . 90 kg
dimensions (h x w x d)
1050 x 600 x 1500 mm, including probe length 1000 mm
protection class IP55
weight approx . 40 kg ambient temperature
-20 . . . +50 °C
probe material stainless steel, Hastelloy as option power supply 230/ 400 V, 50 Hz, 3x16 A, 3 L, N, PE others optional
protection class IP65 Connections on control unit
ambient temperature
-20 . . . +50 °C analogue outputs
4 x 4 . . . 20 mA/ 1 kOhm
measuring gas temperature
max . 280 °C
measuring air flow rate
8 . . . 10 m³/h digital outputs 6 x max . 35 V, 0 .4 A
flange DN 80 PN 6 special version tube Ø100 mm
digital input optional via switching contact to external ly change between measuring/purging
DURAG GROUP Measuring Devices for Emissions
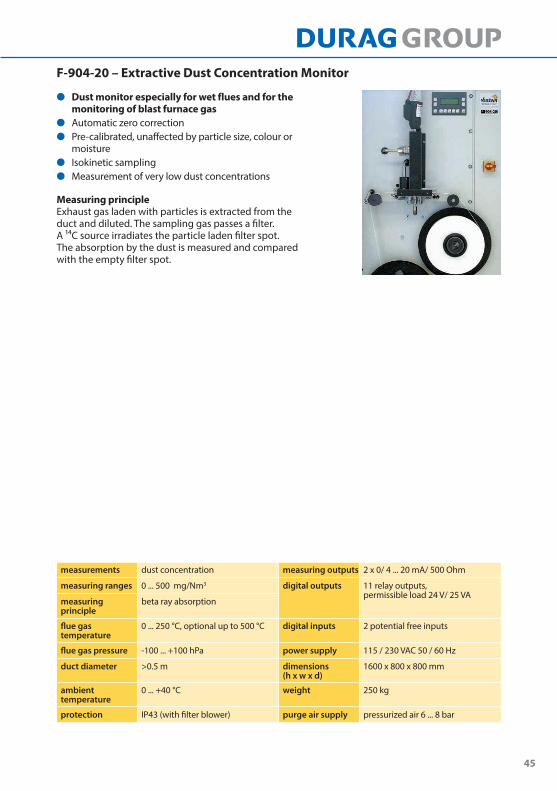
45
D-R 820 F – Dust concentration monitor for wet gases
●● Sensitive system for continuous extractive dust concentration measurement in accordance with the scattered light principle
●● Approved and certified acc . to EN 15267-3
●● Compact design●● Very low maintenance
requirement●● High sensitivity●● Automatic zero and
reference point check●● Automatic contamination
control and correction
Measuring principle
A defined partial current is with-drawn from the exhaust gas cur-rent and is continuously heated and diluted with clean, heated air directly in the sampling probe . This immediately lowers the relative moisture and aerosols get evaporated in the heated probe . The partial current is optically measured in the measuring chamber . The signal is corrected by the measured dilution ratio and is thus a measure of the dust content of the exhaust gas .
Measuring range Rack frame with control unit
dust in operation 0 . . . 15 (max . 100) mg/m³ dimensions (h x w x d)
1750 x 600 x 550 mm
exhaust gas mois-ture limit value
>100 % relative humidity, max . 30 g/m3 H2O as aerosol
space requirements(h x w x d)
1750 x 1100 x 1100 mm
Probe unit weight approx . 90 kg
dimensions (h x w x d)
1050 x 600 x 1500 mm, including probe length 1000 mm
protection class IP55
weight approx . 40 kg ambient temperature
-20 . . . +50 °C
probe material stainless steel, Hastelloy as option power supply 230/ 400 V, 50 Hz, 3x16 A, 3 L, N, PE others optional
protection class IP65 Connections on control unit
ambient temperature
-20 . . . +50 °C analogue outputs
4 x 4 . . . 20 mA/ 1 kOhm
measuring gas temperature
max . 280 °C
measuring air flow rate
8 . . . 10 m³/h digital outputs 6 x max . 35 V, 0 .4 A
flange DN 80 PN 6 special version tube Ø100 mm
digital input optional via switching contact to external ly change between measuring/purging
F-904-20 – Extractive Dust Concentration Monitor
●● Dust monitor especially for wet flues and for the monitoring of blast furnace gas
●● Automatic zero correction ●● Pre-calibrated, unaffected by particle size, colour or
moisture ●● Isokinetic sampling●● Measurement of very low dust concentrations
Measuring principleExhaust gas laden with particles is extracted from the duct and diluted . The sampling gas passes a filter . A 1⁴C source irradiates the particle laden filter spot . The absorption by the dust is measured and compared with the empty filter spot .
measurements dust concentration measuring outputs 2 x 0/ 4 . . . 20 mA/ 500 Ohm
measuring ranges 0 . . . 500 mg/Nm3 digital outputs 11 relay outputs, permissible load 24 V/ 25 VA
measuring principle
beta ray absorption
flue gas temperature
0 . . . 250 °C, optional up to 500 °C digital inputs 2 potential free inputs
flue gas pressure -100 . . . +100 hPa power supply 115 / 230 VAC 50 / 60 Hz
duct diameter >0 .5 m dimensions (h x w x d)
1600 x 800 x 800 mm
ambient temperature
0 . . . +40 °C weight 250 kg
protection IP43 (with filter blower) purge air supply pressurized air 6 . . . 8 bar
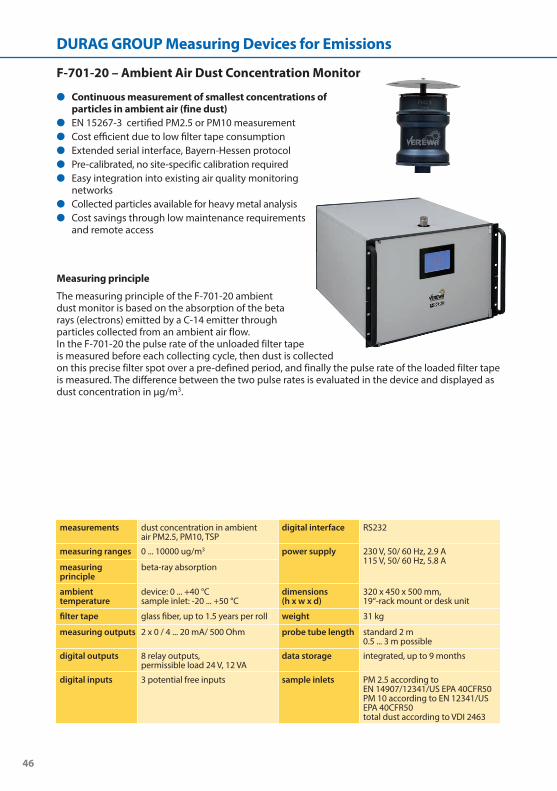
46
F-701-20 – Ambient Air Dust Concentration Monitor
●● Continuous measurement of smallest concentrations of particles in ambient air (fine dust)
●● EN 15267-3 certified PM2 .5 or PM10 measurement●● Cost efficient due to low filter tape consumption●● Extended serial interface, Bayern-Hessen protocol●● Pre-calibrated, no site-specific calibration required●● Easy integration into existing air quality monitoring
networks●● Collected particles available for heavy metal analysis●● Cost savings through low maintenance requirements
and remote access
Measuring principle
The measuring principle of the F-701-20 ambient dust monitor is based on the absorption of the beta rays (electrons) emitted by a C-14 emitter through particles collected from an ambient air flow . In the F-701-20 the pulse rate of the unloaded filter tape is measured before each collecting cycle, then dust is collected on this precise filter spot over a pre-defined period, and finally the pulse rate of the loaded filter tape is measured . The difference between the two pulse rates is evaluated in the device and displayed as dust concentration in µg/m3 .
measurements dust concentration in ambient air PM2 .5, PM10, TSP
digital interface RS232
measuring ranges 0 . . . 10000 ug/m3 power supply 230 V, 50/ 60 Hz, 2 .9 A 115 V, 50/ 60 Hz, 5 .8 A
measuring principle
beta-ray absorption
ambient temperature
device: 0 . . . +40 °Csample inlet: -20 . . . +50 °C
dimensions (h x w x d)
320 x 450 x 500 mm, 19“-rack mount or desk unit
filter tape glass fiber, up to 1 .5 years per roll weight 31 kg
measuring outputs 2 x 0 / 4 . . . 20 mA/ 500 Ohm probe tube length standard 2 m 0 .5 . . . 3 m possible
digital outputs 8 relay outputs, permissible load 24 V, 12 VA
data storage integrated, up to 9 months
digital inputs 3 potential free inputs sample inlets PM 2 .5 according to EN 14907/12341/US EPA 40CFR50PM 10 according to EN 12341/US EPA 40CFR50 total dust according to VDI 2463
DURAG GROUP Measuring Devices for Emissions
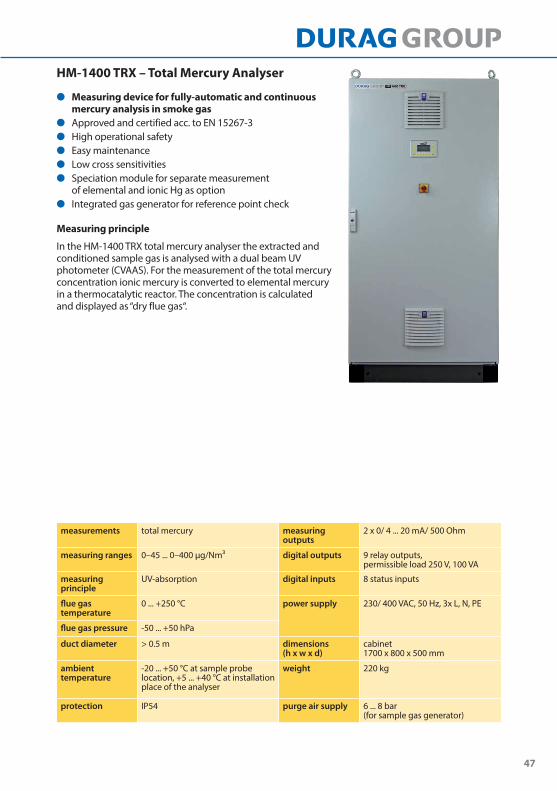
47
HM-1400 TRX – Total Mercury Analyser
●● Measuring device for fully-automatic and continuous mercury analysis in smoke gas
●● Approved and certified acc . to EN 15267-3●● High operational safety ●● Easy maintenance ●● Low cross sensitivities ●● Speciation module for separate measurement
of elemental and ionic Hg as option●● Integrated gas generator for reference point check
Measuring principle
In the HM-1400 TRX total mercury analyser the extracted and conditioned sample gas is analysed with a dual beam UV photometer (CVAAS) . For the measurement of the total mercury concentration ionic mercury is converted to elemental mercury in a thermocatalytic reactor . The concentration is calculated and displayed as “dry flue gas“ .
measurements total mercury measuring outputs
2 x 0/ 4 . . . 20 mA/ 500 Ohm
measuring ranges 0–45 . . . 0–400 µg/Nm³ digital outputs 9 relay outputs, permissible load 250 V, 100 VA
measuring principle
UV-absorption digital inputs 8 status inputs
flue gas temperature
0 . . . +250 °C power supply 230/ 400 VAC, 50 Hz, 3x L, N, PE
flue gas pressure -50 . . . +50 hPa
duct diameter > 0 .5 m dimensions (h x w x d)
cabinet 1700 x 800 x 500 mm
ambient temperature
-20 . . . +50 °C at sample probe location, +5 . . . +40 °C at installation place of the analyser
weight 220 kg
purge air supply 6 . . . 8 bar (for sample gas generator)
protection IP54

48
D-FL 100 – Volume Flow Measuring System
●● Measuring system to measure flow rate in dry emissions with a probe using the differential pressure principle
●● Reliable measurement of the gas velocity even at high temperatures ●● Calculation of volume flow at standard conditions ●● Automatic probe back purging option ●● Versions with or without counter-suport and for point measurement●● Maintenance interval 6 months
Measuring principle
The D-FL 100 measuring system operates according to the differential pressure principle . The probe has two separate chambers, between which the flow builds up a differential pressure . The evaluation unit determines the gas velocity and the volume flow (standard conditions or norm conditions) from the differential pressure, taking into account gas temperature and gas pressure .
measurements flue gas velocity, volume flow digital outputs 2 relay outputs, permissible load 48 V/ 0 .5 A
measuring ranges 0–3,000,000 m3/h / 2 . . . 50 m/s measuring outputs
0/ 4 . . . 20 mA/ 500 OhmModbus RTU, RS485
measuring principle
differential pressure
flue gas temperature
above dew point, -20 . . . +450 °C, optional up to +850 °C
power supply sensor power supply 24 VDC ±10 %, 0 .5 A, 90 . . . 264 VAC, 48 . . . 62 Hz (option)
flue gas pressure -200 . . . +200 hPa
duct diameter 0 .4 . . . 8 m dimensions (h x w x d)
probe: 380 x 160 x (300 + probe length) mm
ambient temperature
-20 . . . +50 °C weight 32 kg + 6 .8 kg/m probe length
protection IP65, Ex optional purge air supply not required . Probe back purging option requires 6 . . . 8 bar instrument air
DURAG GROUP Measuring Devices for Emissions
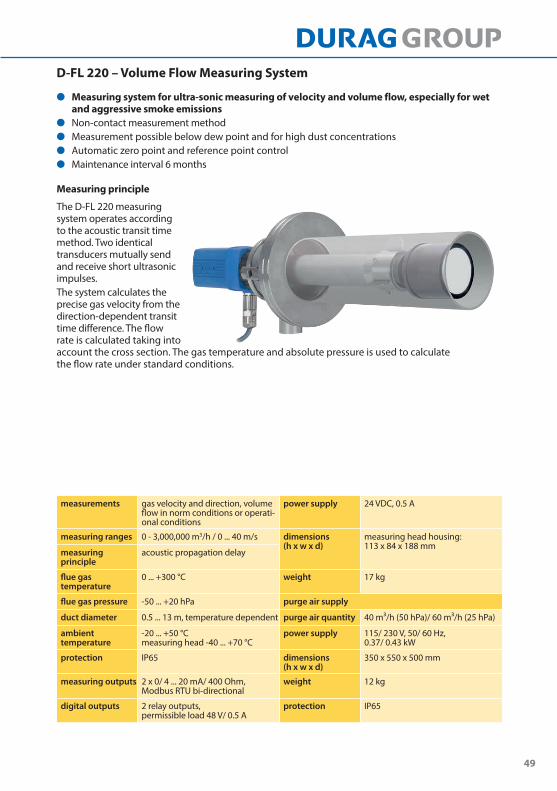
49
D-FL 220 – Volume Flow Measuring System
●● Measuring system for ultra-sonic measuring of velocity and volume flow, especially for wet and aggressive smoke emissions
●● Non-contact measurement method●● Measurement possible below dew point and for high dust concentrations●● Automatic zero point and reference point control●● Maintenance interval 6 months
Measuring principle
The D-FL 220 measuring system operates according to the acoustic transit time method . Two identical transducers mutually send and receive short ultrasonic impulses . The system calculates the precise gas velocity from the direction-dependent transit time difference . The flow rate is calculated taking into account the cross section . The gas temperature and absolute pressure is used to calculate the flow rate under standard conditions .
measurements gas velocity and direction, volume flow in norm conditions or operati-onal conditions
power supply 24 VDC, 0 .5 A
measuring ranges 0 - 3,000,000 m3/h / 0 . . . 40 m/s dimensions (h x w x d)
measuring head housing: 113 x 84 x 188 mm
measuring principle
acoustic propagation delay
flue gas temperature
0 . . . +300 °C weight 17 kg
flue gas pressure -50 . . . +20 hPa purge air supply
duct diameter 0 .5 . . . 13 m, temperature dependent purge air quantity 40 m3/h (50 hPa)/ 60 m3/h (25 hPa)
ambient temperature
-20 . . . +50 °C measuring head -40 . . . +70 °C
power supply 115/ 230 V, 50/ 60 Hz, 0 .37/ 0 .43 kW
protection IP65 dimensions (h x w x d)
350 x 550 x 500 mm
measuring outputs 2 x 0/ 4 . . . 20 mA/ 400 Ohm, Modbus RTU bi-directional
weight 12 kg
digital outputs 2 relay outputs, permissible load 48 V/ 0 .5 A
protection IP65

50
www.durag.com
Branch offices Sales and Service
DURAG Sales + Service GmbH & Co . KG Kollaustraße 10522453 Hamburg, Germany Tel . +49 40 55 42 18-0Fax +49 40 58 41 54info@durag .de
DURAG Branch East Halsbrücker Straße 34 09599 Freiberg, Germany Tel . +49 3731 30 04-0 Fax +49 3731 30 04-22 durag-ost@durag .de
DURAG Branch North Kollaustraße 105 22453 Hamburg, Germany Tel . +49 40 55 42 18-0 Fax +49 40 58 41 54 durag-nord@durag .de
DURAG Branch South Weidenweg 16 73087 Bad Boll, Germany Tel . +49 7164 912 25-0 Fax +49 7164 912 25-50 durag-sued@durag .de
DURAG Branch West An der Pönt 53a 40885 Ratingen, Germany Tel . +49 2102 74 00-0 Fax +49 2102 74 00 28 durag-west@durag .de
DURAG BrazilDURAG Siena do Brasil LtdaRua Vinte e Dois de Agosto, 66 Diadema - SP 09941-530 Brazil Tel . +55 11 4071-5050 r .28 Fax +55 11 4077-1718 info@duragsiena .com .br
DURAG France S . a . r . l . 147 avenue Paul Doumer92500 Rueil Malmaison, France Tel . +33 1 41 29 04 60 Fax +33 1 41 29 04 68 info@durag-france .fr
DURAG Inc . 1355 Mendota Heights Road Suite 200 Mendota Heights MN 55120, USA Tel . +1 651 451-1710 Fax +1 651 457-7684Toll Fee: 800 811 98 52 durag@durag .com
DURAG Inc . (Houston Branch)440 Cobia DriveSuite 1104 (building #11)Katy, TX 77494Tel . +1 832 437 3173Fax +1 832 437 8272 Toll Fee: 800 811 98 52 durag@durag .com
DURAG India Instrumentation Private Limited #27/30, 2nd Main Road Industrial Town, Rajajinagar Bengaluru 560 044, India Tel . +91 80 2314 5626, 2301 1700 Fax +91 80 2314 5627 info@duragindia .com
DURAG Instrumentation (Shanghai) Co ., Ltd . Room 706, Dibao Plaza, No . 3998 Hongxin Rd ., Minhang District Shanghai, 201103 PR China Tel . +86 21 60732979-200 Fax +86 21 60732980-205info@durag-cn .com
DURAG Italia S . r . l . Via Carlo Panseri, 118 CIM uffici, P . secondo 28100 Novara, Italy Tel . +39 0321 679569 Fax +39 0321 474165 info@durag .it
DURAG Japan Office c/o TMS Planning Inc . 291-2 Umena, Mishima-shi Shizuoka-ken 411-0816 Japan Tel . +81 55 977 3994 Fax +81 55 977 3994 info@durag .jp
DURAG Korea Office RM #1131, Manhattan Building, 36-2, Yeouido-Dong, Yeongdeungpo-Gu, Seoul, Korea Tel . +82 2 761 8970 Fax +82 2 761 8971 info@durag-group .co .kr
DURAG Middle East (Branch) Dubai Airport Free Zone5 West Wing, Office 124Dubai, UAEP .O . Box 371555Tel . +971 4260251 0dme@durag .de
DURAG RUSS OOOAndropova avenue 18/6 Office 5-09 115432 Moscow, RussiaTel . +7 499 4180090 Fax +7 499 4180091 info@durag-group .ru
DURAG UK GmbHBretby Business Park, Ashby RoadBurton-on-Trent, Staffordshire DE15 0YZ, Great Britain Tel . +44 1283 553 481 Fax +44 1283 553 482 durag .uk@durag .de
51
www.durag.com
© D
URA
G G
ROU
P 08
/201
7 · S
ubje
ct to
cha
nge
with
out n
otic
e
DURAG process & systems technology – A brand of DURAG GmbHKollaustraße 105 22453 Hamburg, Germany Tel . +49 40 55 42 18-0Fax +49 40 58 41 54info@durag-process .de
DURAG GmbH Kollaustraße 105 22453 Hamburg, Germany Tel . +49 40 55 42 18-0Fax +49 40 58 41 54info@durag .de
VEREWA – A brand of DURAG GmbHKollaustraße 105 22453 Hamburg, Germany Tel . +49 40 55 42 18-0Fax +49 40 58 41 54verewa@durag .de
DURAG data systems GmbH Kollaustraße 105 22453 Hamburg, Germany Tel . +49 40 55 42 18-3000 Fax +49 40 55 42 18-3099 info@durag-data .com
UTAS – DR . LASINGERA brand of DURAG data systems GmbHBranch Office AustriaLastenstraße 36, City Tower 2 4020 Linz, Austria Tel . +43 732 60 99 60-0 Fax +43 732 60 99 60-4 office@utas .at
DURAG Siena do Brasil Ltda Rua Vinte e Dois de Agosto, 66 Diadema - SP 09941-530 Brazil Tel . +55 11 4071-5050 r .28 Fax +55 11 4077-1718 info@duragsiena .com .br
Hegwein GmbH Am Boschwerk 7 70469 Stuttgart, Germany Tel . +49 711 135 788-0 Fax +49 711 135 788-5 info@hegwein .de
SMITSVONK Holland B .V . P .O . Box 180, 2700 AD Zoetermeer Goudstraat 6, 2718 RC Zoetermeer Netherlands Tel . +31 79 361 35 33 Fax +31 79 361 13 78 sales@smitsvonk .nl
GRIMM Aerosol Technik GmbH & Co . KG Dorfstraße 9 83404 Ainring, GermanyTel . +49 8654 578-0Fax +49 8654 578-35 info@grimm-aerosol .com
52
© D
URA
G G
ROU
P 08
/201
7 · S
ubje
ct to
cha
nge
with
out n
otic
e
Guidance Book 2017
(1)