Guidance and Counseling Standard Program Evaluation · Guidance and Counseling Standard Program...
39
Guidance and Counseling Standard Program Evaluation Program Evaluation Question(s) Is guidance an integral part of the instructional program based on (a) student needs and (b) staff encouragement of student planning for future classes and post-secondary options including but not limited to the development and revision of 4-year plans for each student? I. Program/Service Information Name of Program or Services: Guidance and Counseling Personnel Responsible for Evaluation (list): Don Hosutt, Administrator of Student Services for Technical Education, Debbie Scanlon, Principal, Southview School Date of Evaluation (Year/Duration): Fall 2006 Goal/Objective of Program/Services: Provision of career, educational, and personal guidance to SSD students. Brief description of relationship between program goals, CSIP and MSIP Standards: Program goals are related to CSIP and MSIP standards. Information gathered helps the district meet Comprehensive Guidance guidelines and meet vocational and transitional needs of students. (CSIP Goal I, Objective 2, Strategy 5; and MSIP Standard 6.9) Demographic Description of Program: Location(s) All Special School District schools Number of staff 6 Grade level Counselors at the Technical High Schools 2 College and Career Counselors (placement) 2 Counselors for Special Education Schools 1-2 Social Workers per Special Education School and Courts Programs 1 Transition Facilitator shared by the 3 secondary-level Special Education Schools
Transcript of Guidance and Counseling Standard Program Evaluation · Guidance and Counseling Standard Program...

Guidance and Counseling Standard Program Evaluation
Program Evaluation Question(s) Is guidance an integral part of the instructional program based on (a) student needs and (b) staff encouragement of student planning for future classes and post-secondary options including but not limited to the development and revision of 4-year plans for each student? I. Program/Service Information
Name of Program or Services: Guidance and Counseling
Personnel Responsible for Evaluation (list): Don Hosutt, Administrator of Student Services for Technical Education, Debbie Scanlon, Principal, Southview School Date of Evaluation (Year/Duration): Fall 2006 Goal/Objective of Program/Services: Provision of career, educational, and personal guidance to SSD students. Brief description of relationship between program goals, CSIP and MSIP Standards:
Program goals are related to CSIP and MSIP standards. Information gathered helps the district meet Comprehensive Guidance guidelines and meet vocational and transitional needs of students. (CSIP Goal I, Objective 2, Strategy 5; and MSIP Standard 6.9)
Demographic Description of Program:
Location(s) All Special School District schools
Number of staff 6 Grade level Counselors at the Technical High Schools 2 College and Career Counselors (placement) 2 Counselors for Special Education Schools 1-2 Social Workers per Special Education School and Courts Programs 1 Transition Facilitator shared by the 3 secondary-level Special Education Schools
Guidance and Counseling Standard Program Evaluation
Participants Administrator/Supervisor of Guidance Counselors for Special Education Buildings, Representative SSD Social Workers, Technical School Guidance Advisory Committee (See attachment T-5). Questions developed from most recent Student Needs Surveys for all schools and High Schools That Work Surveys and the Technical High Schools. Student Needs surveys include responses from students, parents, and staff while High Schools That Work Surveys include responses from students and staff. Length of program/service Ongoing.
II. Description of Stakeholders Engagement in Program Evaluation (check stakeholders utilized) Listed individuals participating on one or more contributing committees.
Don Hosutt – Administrator for Student Services,Technical Education Debbie Scanlon – Principal, Southview School – Special Education Guidance Supervisor Lynnette Adams – Counselor, Special Education Buildings Marsha Stephens – Counselor, Special Education Buildings Sara Schmitt – Social Worker, Southview Linda Cantrell – Transition Facilitator Anne Blind – Teacher, Southview Debbie Younce – Lead Counselor, South Tech Jeff Chandler – Lead Counselor, North Tech Jama Kupferer – Language Arts Instructor, South Tech Karista Kohler – Science Instructor, North Tech Tech Guidance Advisory Committee (attachment T-5)
III. Evaluation Criteria for Programs/Services Offered Staff perception
Assessment statistics Student attitude and interest survey Perception data (parents and students) Identified need areas
Guidance and Counseling Standard Program Evaluation
IV. Data Collection Methodology and Documents Special Education Schools:
Staff/administrator surveys: Missouri Comprehensive Guidance Survey 2005-06 School Year Parent/guardian survey: Missouri Comprehensive Guidance Survey 2005-06 Student survey: Missouri Comprehensive Guidance Survey 2005-06,
6-month, 3-year, and 5-year Follow-up Study of Graduates Documents: MSIP and Comprehensive Guidance Standards
Technical Education Schools: Staff/administrator surveys: Missouri Comprehensive Guidance Student Needs Survey 2004-05 School Year, High Schools That Work Survey 2004 & 2006,
Counselor Time and Task Analysis, 2004-05 School Year
Parent/Guardian Surveys: Missouri Comprehensive Guidance Student Needs Survey 2004-05 School Year Student Surveys: Missouri Comprehensive Guidance Student Needs Survey 2004-2005 School Year
High Schools That Work Survey 2004 & 2006, Placement 6-month Follow-up, 5-year Follow-up
Documents: MSIP and Comprehensive Guidance Standards
V. Results
• The Missouri Comprehensive Guidance model identifies the four program components of a guidance program in school as the following: 1) Guidance Curriculum, 2) Individual Planning, 3) Responsive Services, and 4) System Support.
Guidance and Counseling Standard Program Evaluation
• The Special Education Schools of Neuwoehner, Ackerman,
Northview, Litzinger, Southview and the Bridges program; are covered by two counselors who teach the Missouri Comprehensive Guidance Curriculum to all students. Currently the Court Programs do not receive instruction utilizing the above curriculum. In the 2002-03 school year, a second counselor was added to the staff for Special Ed schools and a supervisor assigned to Special Ed guidance. The first Comprehensive Guidance Student Needs Survey was administered in 02-03 and then again in 05-06. Individual Planning in these buildings is done as part of each student’s IEP by the case manager with input from a transition facilitator and others as needed. Responsive Service is covered similarly in each of these schools by the Social Workers with additional input from the staff in the form of a care team meeting. Counselors, individual student’s Case Managers, Transition Facilitators, and Social Workers contribute to System Support in the Special Education schools. System Support includes the following components: parent involvement, committee participation, professional development and community involvement. As of December 2006, the Special Education schools serve an enrollment of 883 students and with the Courts Programs and Career Training, the number increases to 1156 students. The desirable MSIP standard of counselors serving the Special School’s enrollment, based on the individual enrollments would be 2.6 counselors and with the additional programs 1.2 additional counselors are recommended. It is important to note that this standard also considers guidance staff taking full responsibility for all four Comprehensive Guidance Program Components. The recommended time full time counselors should spend on Guidance Curriculum ranges from 15-45% at different grade levels. Our two counselors, exclusively assigned to the instruction of the Guidance Curriculum, fill this need at the Desirable Standard level (see attachment S-3).
• The Technical High Schools cover guidance areas as a more
traditional comprehensive high school with four counselors per building and additional assistance in Responsive Services coming from social workers (see attachment T-4 p.2)
A. Strengths and Concerns of program/service based on MSIP
standards and/or statistical comparisons. 1. Program Strengths (MSIP standards met or exceeded) Toward the question on guidance meeting student needs as an integral part of the instructional program based on documents, data totals and comparisons from instruments listed in section IV on page 3:

Guidance and Counseling Standard Program Evaluation
Special Ed • The Student Needs Survey administered to students, staff, and parents
in 2005-06 in the Special Education schools identified specific needs particularly in the area of transition that include decision making skills, knowledge of self and others, future planning, and self advocacy. (see attachment S-2).
• Students are being instructed in the guidance areas listed above as well as job training to prepare for adult living. Employment for our students include placement at a sheltered workshop as well as supported employment when appropriate. (see attachment S-1).
Tech Ed • Reports from the College and Career Counselors at each of the Tech
Schools from the 6-month follow-up survey done each year indicate an average of 89.6% placement of the 2662 surveyed completers of technical programs for the last 4 years. An average of 55.8% were placed in either employment, continuing education, or military billets (job or assignment) related to their vocational program (see attachment T-1, p. 1). A 5-year follow-up of the graduating class of 2000 from North and South Tech produced only 24 responses with 57 surveys returned as undeliverable from 293 total graduates. On a positive note, 87.5% (21 of 24) were employed, 58.3% (14 of 24) were employed related to their tech program, and 16.7% (4 of 24) were enrolled in and unrelated post-secondary program. No responders were unemployed and none were currently in tech program related post-secondary programs. Obviously, several were both employed and receiving some post-secondary education or training (T-1, p.2)
• The SSD Board Approved Tech Guidance Curriculum addresses the student needs identified most recently conducted Student Needs Survey (2004-05, see attachment T-2, pp. 1-6).
• The High Schools That Work survey results of 2004 and 2006 indicate that students reporting having never talked to a counselor about a Four-year Plan dropped from 16% to 6% at North Tech and from 20% to 16% at South Tech (T-3, pp. 1-3).
• Time and task analysis indicate that service provided compared with the state recommendations for guidance are met. Enrollment ratios and percentage of time spend on types of service enrollment is well over the state recommendation for guidance at North and South Tech (T-4, pp.1-2).
Toward the question of staff encouragement of students to plan for future classes and post-secondary options based on documents, data totals, comparisons listed in section IV on page 3:
Guidance and Counseling Standard Program Evaluation
Special Ed
• All students age 16 and over participate in the Futures Plan program under the supervision of two Transition Facilitators with participation of teachers and case managers that includes educational, career, and life planning as an ongoing process through time of exit with diploma. Beginning at the 8th grade level, all students have a 4-year plan designed to prepare the student for adult life.
• Guidance counselors administer interest inventories to begin identifying areas of employment that a student may enjoy and experience success.
Tech Ed • High Schools That Work (HSTW) surveys from 2006 indicate that at
least 94% of students at North Tech and 84% at South Tech report that they have spoken with a counselor about courses and sequence, and Four-year Plans (see attachment T-3, p. 1; summary of HSTW survey questions for North and South Tech).
• 82% of students reporting having reviewed sequence of courses 1 or more times per semester at North Tech (T-3, p. 1).
• North Tech students report increasing encouragement to take challenging math, science, and English courses. South Tech students report increasing encouragement to take challenging math and science classes, while 0ver 80% surveyed teachers at both schools report encouraging students to take math as a senior even though two units of math is the school and state requirement (attachment T-3, pp. 1-2).
2. Program Concerns
Toward the question on guidance meeting student needs as an integral part of the instructional program based on documents, data totals and comparisons and listed in section IV on page 3:
Special Ed • Utilization of the results from Comprehensive Guidance Student Needs
Survey of 05-06, guides the curriculum taught by each of the two counselors for the Special Ed schools, one assigned to Bridges, Ackermann, Litzsinger, Northview and the other assigned to Southview, Neuwoehner and Litszinger. The desired result is across the board identification of need areas and implementing more intensive instruction of the guidance curriculum to meet these needs. The second Student Needs Survey was completed during the 2005-06 school year. Results were reviewed and analyzed with curriculum developed to address identified needs. Due to the number of students that the 2 guidance counselors must teach at the Special School

Guidance and Counseling Standard Program Evaluation
buildings, instruction in the guidance curriculum has not been given to the following SSD buildings: Career Training, JDC, Lakeside, or Project Learn.
• An advisory Committee for Special Ed school guidance must be formed that includes parents.
• Unable to locate students so return rate for 5-year follow up studies are low—63 total graduates, 35% (n=22).
Tech Ed (attachments T-2 and T-3)
• The 2004-2005 Student Needs Survey composite from both North and South Tech indicate that making decisions about college and planning and developing careers are the top two priorities for Tech students and their parents. In the results form the High Schools That Work Survey done the spring of 2006, 98% of students at North Tech and 61% at South Tech indicate talking with a counselor about education and career. That number increased at North Tech but decreased at South Tech over the last two years, indicating a need for adjustments in career guidance at South Tech (see attachment T-3, p.2).
• Agreement at North Tech, either strongly or somewhat, that they were comfortable about transition from high school to either a career or further education; rose from 74% to 78% between 2004 and 2006 according to the HSTW surveys administered. At South Tech on this same question, those at least somewhat comfortable about the upcoming transition rose from 58% to 65% (T-3, p. 3).
• Student Needs Surveys show different perceptions of need at the two high schools. At North Tech, ‘making decisions about college’ and ‘planning and developing careers’ rank 1st and 2nd separated significantly from each other and other choices down the list. At South Tech ‘planning and developing careers’, ‘finding jobs’, and ‘making decisions about college’ ranked 1 through 3, were fairly close in rank, and significantly separated from other choices (See attachment T-2, top of p. 1 for scoring and explanation; p. 3 and 5 for statistical comparison).
• On the High Schools That Work survey (attachment T-3, p. 1) in the category of who helped most with their Four-year plan, 22% at South Tech report ‘no one’, 20% report ‘never’ reviewing sequence of courses with anyone.
• The number of return on the 5-year Follow-up Survey is disappointingly low.

Guidance and Counseling Standard Program Evaluation
Special and Tech Ed • Data obtained from SSD and Missouri Comprehensive Guidance
Student Needs Surveys should carefully be reviewed along with any other pertinent data to analyze coverage and effectiveness of guidance curriculum instruction in special education buildings.
Toward the question on staff encouragement of student planning for future classes and post-secondary options based on documents, data totals and comparisons listed in section IV on page 3:
Special Ed • Students in the 9-12 grade range indicated lack of knowledge in the
areas of finding jobs, consumer skills, planning for careers, preparing for jobs, and preparing for life after graduation at a range of 32 to 42% on the 2005-2006 Student Needs Survey (attachment S-2).
Tech Ed • Students reporting having never talked to a counselor about a Four-
year Plan dropped from 16% to 4% at North Tech and from 20% to 16% at South Tech. However, in the category of who helped most with their Four-year plan, 22% at South Tech report ‘no one’, 20% report ‘never’ reviewing sequence of courses with anyone (attachment T-2)
• The percentage of students who report never or seldom receiving encouragement from counselors to take challenging math and science decreased at both schools and the percentage never or seldom encouraged to take challenging English decreased at North Tech. (attachment T-2).
• Students reporting having never talked to a counselor about a Four-year Plan dropped from 16% to 4% at North Tech and from 20% to 16% at South Tech. However, in the category of who helped most with their Four-year plan, 22% at South Tech report ‘no one’, 20% report ‘never’ reviewing sequence of courses with anyone (also reported in program strengths).
• Only 50% of students at South Tech report reviewing course sequence at least 1 time per year (T-3, p. 1).

Guidance and Counseling Standard Program Evaluation
3. Recommendations regarding program/service
Special and Tech Ed • Continue to monitor, review and revise program through
Comprehensive Guidance Student Need and SSD surveys, paying particular attention to concerns mentioned in this document.
• Insure that all students in all buildings and programs develop Four-year Plans for secondary academic and career planning and that placement assistance is provided for transition through use of HSTW surveys and Time and Task analysis at the Tech Schools and Student Needs Surveys at all SSD buildings, again starting with concerns mentioned in this document.
Special Ed • The Special Education building staffs support parents in their efforts to
locate and provide information in the areas of work, life skills, and living arrangements for the student’s adult life.
• Transition Committee investigating the ability to attain information from parent/student to update current employment/living status through DVR, PLB, and/or Regional Center for up to 5-years after graduation .
Tech Ed • The High Schools That Work committee model for counselors to
facilitate faculty advisors to help students seems to work well with educational planning at North Tech but has been less successful at South, where another model is being developed. All students at both schools do, in fact, review their 4-year or Educational Career Plan even if only with their counselor.
• The Missouri Comprehensive Guidance Program includes recommendations for incorporating Grade Level Expectations into the guidance curriculum at each school. During the 2006-07 school year, the South Tech guidance staff will review, rewrite, or develop a new lesson or activity to be included in Technical Education Guidance Curriculum that places additional emphasis on application of the Educational Career Plan (4-year plan) for each student.
____________________________________Date:_________ Signature of Administrator Responsible for Chairing Evaluation

Guidance and Counseling Standard Program Evaluation
Special Ed School Documents
S-1 through S-3
Guidance and Counseling Standard Program Evaluation
FOLLOW-UP OF GRADUATES/SURVEY OF EMPLOYERS
SPECIAL EDUCATION SCHOOLS AND CAREER TRAINING PROGRAM
MARCH, 2006
PURPOSE OF THE STUDY
The district conducts follow-up studies of graduates and surveys employers for two reasons: First, standard 8.1.2 of the Missouri School Improvement Program (MSIP) requires school districts to conduct thorough follow-up studies of its graduates and surveys of employers and colleges. The purpose of these activities is to determine how well the district has prepared students for work or post-secondary education. The second reason is to obtain information about the long-term performance of our graduates so that we can make adjustments in our instructional programs and better prepare our students for life after school. In simple terms, the study asks two questions. The first is “What are our graduates doing?”. The second question is “How well is the district preparing them to do it?”. The first question was answered through a follow-up of graduates. The answer to the second came from a survey of employers. METHODOLOGY
The district obtained information to complete the follow-up study and employer survey through the following means:
Follow-up of graduates
1. Transition Facilitators tried to contact members of the classes of 2000, 2003, and 2005 from the secondary Special Education Schools (Neuwoehner, Northview, Southview). Facilitators attempted three phone contacts on varying days and times.
2. If Facilitators were unable to contact the graduate, they sent a survey to the graduate’s last known address or residential facility.
3. Facilitators discussed post-school outcome status with the graduates’ teachers when enrolled in SSD.
4. Teachers in the Career Training Program contacted graduates, family members, or teachers of students who had graduated from that program. Due to historically low response to mailings, teachers relied on repeated phone calls to obtain information.
S-1, p. 1

Guidance and Counseling Standard Program Evaluation
FINDINGS Graduates of Special Education Schools It should be noted that district staff collect post-graduation data for students graduating from each school, and report it to in that manner to school staff. However, in reporting information describing the post-graduation activity and outcomes of our students in public, maintaining confidentiality is crucial. The relatively small number of graduates from each school in each “cell” (that is, “Male”, “Female”, each ethnic group, or each follow-up category) puts the confidentiality of each student at risk. Therefore, this report provides only data for the entire group of graduates. Class of 2000 The class of 2000 consisted of 63 students graduating from Neuwoehner, Northview, and Southview Schools. Of those students, 54% were male and 46% female. White students made of 67% of the graduates, Black students made up 30%, and 3% were of another ethnic group. The status of graduates is shown below. _____________________________________________________________
Class of 2000
Five Year Follow-Up Status Percentage Male Female Total Black White Other Total Of Total Employed 7 6 13 1 11 1 13 20.6 Percent 53.8 46.2 100.0 7.7 84.6 7.7 100.0 Day Program 10 10 20 3 16 1 20 31.7 Percent 50.0 50.0 100.0 15.0 80.0 5.0 100.0 Unemployed/No Program 4 3 7 4 3 0 7 11.1 Percent 57.1 42.9 100.0 57.1 42.9 0.0 100.0 Unable to Locate 12 10 22 11 11 0 22 34.9 Percent 54.5 45.5 100.0 50.0 50.0 0.0 100.0 Deceased 1 0 1 1 0 0 1 1.6 Percent 100.0 0.0 100.0 100.0 0.0 0.0 100.0 Total 34 29 63 20 41 2 63 100.0 Total Percent 54.0 46.0 100.0 31.7 65.1 3.2 100.0
The number of students who are deceased or with whom staff were unable to
make contact affects the above distribution. The table below shows the status of students about whom the district was able to obtain information. These data indicate that of students about whom the district was able to obtain information, nearly 83% are employed or in a day program.
S-1, p. 2

Guidance and Counseling Standard Program Evaluation
Class of 2000 Status of Students Contacted
Male Female Black White Other Total PercentageEmployed 7 6 1 11 1 13 32.5 Day Program 10 10 3 16 1 20 50.0 Unemployed/No Program 4 3 4 3 0 7 17.5 Total 21 19 8 30 2 40 100.0 Percent 52.5 47.5 20.0 75.0 5.0 100.0
________________________________________________________________
In an attempt to identify trends in post-graduation activity, this study compared
year-to-year activities of students in the class of 2000. The table on the next page shows those data in detail. It is noteworthy that over five years, the percentage of students employed dropped substantially, while the percentage in various day programs remained about the same.
S-1, p. 3
Guidance and Counseling Standard Program Evaluation
Class of 2000 Year-To-Year Post-Graduate Status
2000 2000 2001 2001 2003 2003 2005 2005 Status Number Percent Number Percent Number Percent Number Percent Employed/Sheltered Workshop 11 17.5 7 11.1 5 7.9 6 9.5 Employed/Supported Employment 23 36.5 15 23.8 9 14.3 6 9.5 Employed/Competitive Employment 3 4.8 0 0.0 0 0.0 1 1.6 Total Employed 37 58.7 22 34.9 14 22.2 13 20.6 Day Program/Volunteer Activity 2 3.2 2 3.2 2 3.2 2 3.2 Day Program/Other 16 25.4 20 31.7 21 33.3 18 28.6 Total Day Program 18 28.6 22 34.9 23 36.5 20 31.7 Unemployed/No Program 7 11.1 15 23.8 10 15.9 6 9.5 Unemployed/Home by Choice 0 0.0 0 0.0 0 0.0 1 1.6 Total Unemployed 7 11.1 15 23.9 10 15.9 7 11.2 Unable to Locate 1 1.6 4 6.3 16 25.4 22 34.9 Deceased 0 0.0 0 0.0 0 0.0 1 1.6 Category Total 63 100.0 63 100.0 63 100.0 63 100.0
S-1, p. 4

Guidance and Counseling Standard Program Evaluation
Class of 2003
The class of 2003 consisted of 63 students from Neuwoehner, Northview, and Southview Schools. The follow-up data for those students follow.
________________________________________________________________
Class of 2003
Two Year Follow-Up Status
Percentage Male Female Total Black White Other Total of Total Employed 13 3 16 6 10 0 16 25.4 Percent 81.3 18.8 100.0 37.5 62.5 0.0 100.0 Day Program 7 5 12 4 7 1 12 19.0 Percent 58.3 41.7 100.0 33.3 58.3 8.3 100.0 Unemployed/No Program 12 1 13 8 5 0 13 20.6 Percent 92.3 7.7 100.0 61.5 38.5 0.0 100.0 Unable to Locate 17 3 20 8 12 0 20 31.7 Percent 85.0 15.0 100.0 40.0 60.0 0.0 100.0 Deceased 1 1 2 0 2 0 2 3.2 Percent 50.0 50.0 100.0 0.0 100.0 0.0 100.0 Total 100.0 Total Percent 79.4 20.6 100.0 41.3 57.1 1.6 100.0
________________________________________________________________ The above data show that of the total number of graduates, approximately 44 percent are employed or in a day program and about one-fifth are unemployed or in no program. As with the class of 2005, however, these data are substantially affected by the number of students not located. The table on the next page shows outcome data for students from whom staff obtained information. This table shows that of students in that group, about 68% were employed or in a day program.
S-1, p. 5

Guidance and Counseling Standard Program Evaluation
Class of 2003 Status of Students Contacted
Male Female Black White Other Total PercentageEmployed 13 3 6 10 0 16 39.0 Day Program 7 5 4 7 1 12 29.3 Unemployed/No Program 12 1 8 5 0 13 31.7 Total 32 9 18 22 1 41 100.0 Percent 78.0 22.0 43.9 53.7 2.4 100.0
________________________________________________________________
In an attempt to identify trends in post-graduation activity, this study compared year-to-
year activities of students in the class of 2003. The table on the next page shows those data in detail.
________________________________________________________________
Class of 2003 Year-To-Year Post-Graduate Status
Anticipated
2003 2004 2004 2005 2005 Status Number Percent Number Percent Number Percent
Employed/Sheltered Workshop 6 9.4 12 18.8 9 14.3Employed/Supported Employment 27 42.2 8 12.5 4 6.3Employed/Competitive Employment 3 4.7 1 1.6 3 4.8Total Employed 36 56.3 21 32.8 16 25.4Day Program/Volunteer Activity 0 0.0 2 3.1 11 17.5Day Program/Other 17 26.6 11 17.2 1 1.6Total Day Program 17 26.6 13 20.3 12 19.0Unemployed/No Program 10 15.6 19 29.7 12 19.0Unemployed/Home by Choice 1 1.6 3 4.7 1 1.6Total Unemployed 11 17.2 22 34.4 13 20.6Unable to Locate 0 0.0 8 12.5 20 31.7Deceased 0 0.0 0 0.0 2 3.2Category Total 64 100.0 64 100.0 63 100NOTE: One student received a diploma from home school and was not counted in SSD follow-up.
S-1, p. 6

Guidance and Counseling Standard Program Evaluation
As with the Class of 2000, these data show that over time the percentage of employed students decreased. However, unlike the Class of 2000, the percentage in day programs also decreased. Class of 2005
The final group reported is students graduating in 2005 from Northview, Neuwoehner, and Southview Schools. District staff collected data in December 2005, six months post-graduation. The table below shows that about 46 percent of graduates are employed or in a day program, while about 36 percent are unemployed. Staff were unable to reach almost nineteen percent of the graduates.
________________________________________________________________
Class of 2005
Six-Month Follow-Up Status ________________________________________________________________
Percentage Male Female Total Black White Other Total of Total
Employed 6 8 14 5 8 1 14 20.0 Percent 42.9 57.1 100.0 35.7 57.1 7.1 100.0 Day Program 9 9 18 10 8 0 18 25.7 Percent 50.0 50.0 100.0 55.6 44.4 0.0 100.0 Unemployed/No Program 16 9 25 10 15 0 25 35.7 Percent 64.0 36.0 100.0 40.0 60.0 0.0 100.0 Unable to Locate 7 6 13 9 4 0 13 18.6 Percent 53.8 46.2 100.0 69.2 30.8 0.0 100.0 Deceased 0 0 0 0 0 0 0 0.0 Percent 0 0 0 0 0 0 0 Total 38 32 70 34 35 1 70 100.0 Percent 54.3 45.7 100.0 48.6 50.0 1.4 100.0
________________________________________________________________
The table on the next page shows the distribution of graduates in those about whom staff
could obtain no information are omitted from the group. Those data indicate that of this group, about 56% are employed or in a day program.
S-1, p. 7

Guidance and Counseling Standard Program Evaluation
Class of 2005 Status of Students Contacted
Male Female Black White Other Total PercentageEmployed 6 8 5 8 1 14 24.6 Day Program 9 9 10 8 0 18 31.6 Unemployed/No Program 16 9 10 15 0 25 43.9 Total 31 26 25 31 1 57 100.0 Percent 54.4 45.6 43.9 54.4 1.8 100.0
________________________________________________________________ Discussion
A review of the above follow-up data gives rise to the following important points:
1. For all classes, the high percentage of students not located, ranging from over 18% for the class of 2005 to over one-third for the class of 2000, has a substantial impact on the ability to draw clear conclusions. Simply said, the district doesn’t know what these students are currently doing.
2. The percentage of students employed decreases over time. For the class of 2000, this percentage decreased over five years from almost 59% to about 20%. For the class of 2003, the percentage decreased over two years from about 56% to about 21%. For the class of 2000, this decrease took place in all types of employment (sheltered workshop, supported employment, and competitive employment). For the class of 2003, the percentage of students in sheltered workshop and supported employment decreased by almost half (from 18.8% to 9.5% and from 12.5% to 6.3%, respectively) between one year and two years after graduation, while the percentage of students in competitive employment increased.
3. Over five years, the percentage of students in day programs stayed about the same while the percentage of unemployed students increased in the short-term but returned to its initial level long-term. Over two years for the class of 2003, the percentage of students in day programs dropped while the percentage unemployed grew.
4. Six months after graduation, almost half of graduates were employed or in a day program. However, over one-third were unemployed.
5. A review of post-graduation status by gender and ethnic groups shows that for members of the Class of 2000, the percentages of males and females in each
S-1, p. 8

Guidance and Counseling Standard Program Evaluation
category are consistent with their overall representation in the group. However, the percentage of Black students employed or in day programs is less than the overall percentage of Black students and the percentage unemployed or not located is more than the total percentage. The opposite is the case for White students. For the class of 2003, the percentage of Male and Female students employed is similar to their membership in the entire group. However, the percentage of Males in a day program is less than their overall percentage while the percentage unemployed or not located is greater than their overall representation. The percentage of Females in a day program is greater than their overall percentage of the total group but the opposite is the case for Females who are unemployed or not located. The percentages of Black students and White students employed or not located are about the same as their overall percentage of group membership. The percentage of White students in a day program is about the same as their overall representation, while this is not the case for any unemployed students or Black students in a day program.
Career Training Graduates Teachers collected follow-up data for graduates in 2000, 2003, and 2005, that is, five years, two years, and six months post-graduation. The following table summarizes data describing those groups of graduates and their post-graduation status.
___________________________________________
Career Training Program Graduates Group Descriptions and Post-Graduation Status
Year of Graduation 2000 2003 2005 Number of Students 98 92 73 Percent Contacted 37 68 92 Gender Percent Male 59 56 59 Percent Female 41 44 41 Ethnic Group Percent Black 47 64 48 Percent White 52 36 51 Percent Other 1 0 1 Percent Enrolled in Non-College 0 2 0 Percent in Military 0 0 0 Percent Employed 27 42 51 Percent Unemployed 7 22 37 Percent with Status Unknown 66 33 12
_____________________________________________ S-1, p. 9

Guidance and Counseling Standard Program Evaluation
SPRING 2006 GUIDANCE DEPARTMENT NEEDS ASSESSMENT
RESULTS GRADES K-3 STUDENT SURVEY
1) 4. I can identify different ways of settling conflicts. (Understanding and accepting myself)
2) 16. I look at the person who is speaking to me. (Improving study and basic learning skills)
3) 18. I know how to ask appropriate questions in class. (Improving study and basic learning skills)
4) 40. I know how to say “NO” to people who try to get me to use alcohol and other drugs.
(Knowing how alcohol and other drugs affect my friends and me)
GRADES K-3 STAFF SURVEY
1) Understanding and getting along with others 2) Understanding and accepting myself 3) Making decisions
GRADES K-3 PARENT SURVEY
1. Improving study and basic learning skills 2. Making decisions 3. Understanding and getting along with others
S-2, p. 1

Guidance and Counseling Standard Program Evaluation
SPRING 2006 GUIDANCE DEPARTMENT NEEDS ASSESSMENT
RESULTS GRADES 4-6 STUDENT SURVEY
1) 8. I know how to handle teasing from other students if I am interested in activities usually chosen by the other sex.
(Understanding how being male or female relates to school and work)
2) 20. I know an adult to get help from if I or a friend has a problem with alcohol and drugs.
(Knowing how alcohol and other drugs affect my friends and me)
3) 24. I know some things that cause problems in families, such as death, divorce, unemployment
(Learning about family responsibilities) GRADES 4-6 STAFF SURVEY
1. Understanding and getting along with others 2. Understanding and accepting self 3. Making decisions
GRADES 4-6 PARENT SURVEY
1. Understanding and getting along with others 2. Exploring and planning for careers 3. Understanding and accepting self 4. Improving study and learning skills
S-2, p. 2

Guidance and Counseling Standard Program Evaluation
SPRING 2006 GUIDANCE DEPARTMENT NEEDS ASSESSMENT
RESULTS GRADES 6-9 STUDENT SURVEY
1) 27. I attend and participate in my IEP meetings. (Planning for school and beyond)
2) 4. I can handle teasing and disapproval for wanting a job that is usually held by people of the opposite sex.
(Understanding how being male or female relates to classes and jobs)
3) 30. I can complete a sample job application. (Preparation for finding jobs)
GRADES 6-9 STAFF SURVEY
1. Understanding and getting along with others 2. Making decisions 3. Learning how to use leisure time
GRADES 6-9 PARENT SURVEY
1. Making decisions 2. Understanding and accepting self 3. Understanding and getting along with others
S-2, p. 3
Guidance and Counseling Standard Program Evaluation
SPRING 2006 GUIDANCE DEPARTMENT NEEDS ASSESSMENT
RESULTS GRADES 9-12 STUDENT SURVEY
1) 48. I understand credit purchases and installment buying. (Learning about consumer skills)
2) 32. I know which individuals or agencies helped graduates get into college, find a job, or obtain other training beyond high school.
(Learning from friends and others who have graduated) 3) 39. I can develop a resume (personal information for employers).
(Preparation for finding jobs) GRADES 9-12 STAFF SURVEY
1. Preparing for life after graduation 2. Understanding and accepting self 3. Preparing for finding jobs
GRADES 9-12 PARENT SURVEY
1. Preparing for life after graduation 2. Improving basic study skills and learning skills 3. Understanding and accepting self
S-2, p. 4

Guidance and Counseling Standard Program Evaluation
Missouri Comprehensive Guidance Recommended Time Distribution
State Suggested Percentages
15% - 25 % Guidance Curriculum 25% - 35% Individual Planning 25% - 35% Responsive Services 15% - 20% System Support 0% Non-Guidance
MSIP Standards for Counseling Staff
Full time enrollment for the 2006-07 school year in the Special Education school buildings is 883.
S-3

Guidance and Counseling Standard Program Evaluation
Tech School
T-1 through T-5
Documents

Guidance and Counseling Standard Program Evaluation
Placement Results 2002 - 2005
North Technical High School
YEAR
CONCENTRATOR/
GRADUATES
ER
NA
SU
MR
MNR
TOT
P
TOTP
%
ENR
CER
CENR
NP
2005 438 61 4 4 193 74 60 3 1 1 1 374 85 % 14% 10% 44% 17% 14% 1% 0% 0% 0% 85%
2004 370 49 37 164 73 35 3 0 8 1 332 90% 13% 10% 44% 20% 9% 1% 0% 2% 0% 90%
2003 307 74 19 139 53 10 3 6 2 1 288 94% 24% 6% 45% 17% 3% 1% 2% 1% 0% 94%
2002 252 52 20 115 33 28 0 0 4 0 224 89% 21% 8% 46% 13% 11% 0% 0% 2% 0% 89%
So Tec al H Scho
YEAR
CONCENTRATOR/ GRADUATES
ER
A
SU
MR
MNR
TOTP
TOTP%
uth hnic igh ol
ENR
CER
CENR
NP N
2005 359 57 51 83 116 23 13 9 1 6 314 87 % 16% 14% 23% 32% 6% 4% 3% 0% 2% 87%
2004 367 67 77 84 98 20 9 4 1 7 334 91% 18% 21% 23% 27% 5% 2% 1% 0% 2% 91%
2003 296 59 42 97 66 10 3 6 7 6 277 94% 20% 15% 33% 22% 3% 1% 2% 2% 2% 94%
2002 273 71 65 62 39 19 4 8 3 2 242 89% 26% 24% 23% 14% 7% 1% 3% 1% 1% 89%
CONCENT OR/GRADRAT UATE ent led i cat p m ns f 2.0
f credit in voca onal program a u om h
elated
ead, etc.) rmation)
P
T-1, p. 1
– Studates fr
enrol high sc
n a voool.
ional rogra , ear a minimum o units oE
ti nd gradR Employment Related
ENR Employment Not Related CER Continuing Education Related CENR Continuing Education Not RNP Not Placed NA Not Available (Jail, pregnant, dSU Status Unknown (Unable to obtain infoMR Military Related MNR Military Not Related TOT Total Placed (Actively doing something) TOTP% Percent Placed

Guidance and Counseling Standard Program Evaluation
Class of 2000 5-Year Graduate Follow-up Results
• Survey e Class of 2000.
s d
Highest level of education comp
on
Current employment and/or educational status
ool program m
ch program o program
T-1, p. 2
s were sent to all North and South Tech graduates in th
• North Tech graduates in 2000 numbered 132 with 32 surveys returned as undeliverable and 7.0% of the delivered surveys returned. South Tech graduatenumbered 161 with 25 returned as undeliverable and 12.5% of the deliveresurveys returned.
Statistical Results
leted.
• 62.5% High School Graduate • 8.3% Post-Secondary Certificati• 25.0% Associates Degree • 0% Bachelors Degree • 4.2% Masters Degree
• 58.2% Employed, related to Tech High Sch• 29.2% Employed, not related to Tech progra• 0% Enrolled in post-secondary education related to Te
t related t• 16.6% Enrolled in post-secondary education no• 0% Unemployed, seeking employment • 0% Unemployed, not seeking employment
Guidance and Counseling Standard Program Evaluation
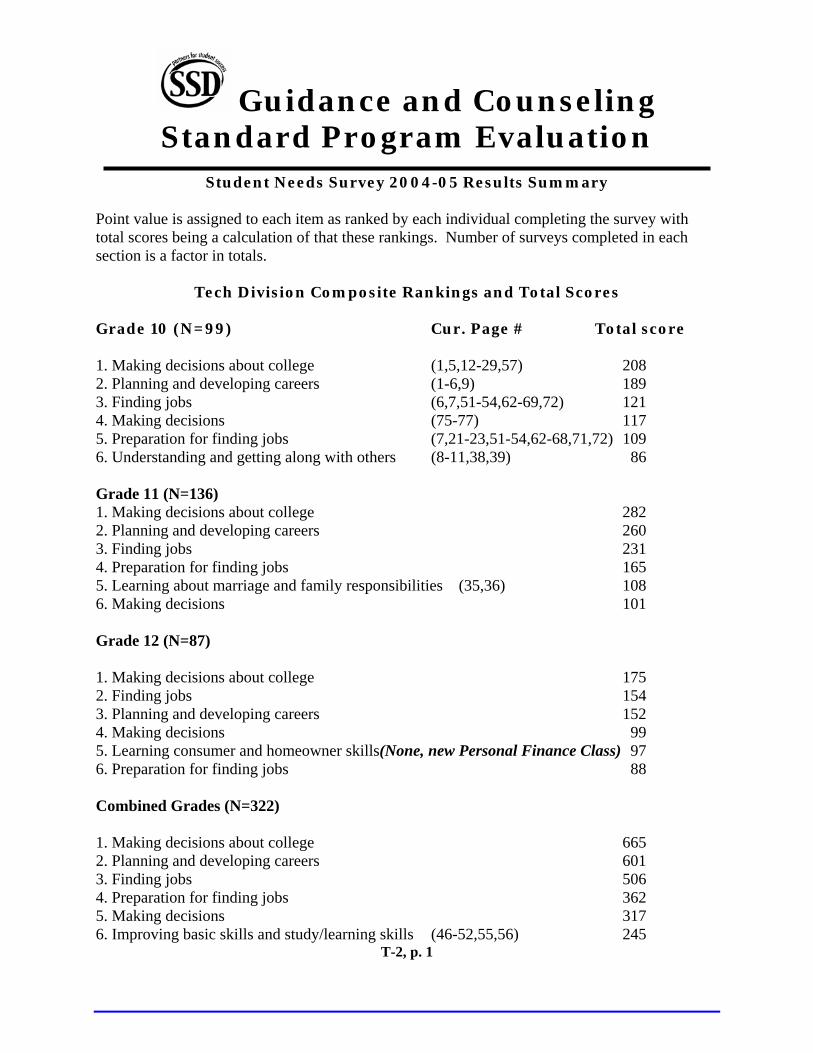
Student Needs Survey 2004-05 Results Summary Point value is assigned to each item as ranked by each individual completing the survey with total scores being ted in each ection is a factor in totals.
rade 10 (N=99) Cur. Page # Total score . Making decisions about college (1,5,12-29,57) 208
ing careers . Finding jobs (6,7,51-54,62-69,72) 121
. Planning and developing careers 260
. Making decisions about college 175 154
. Planning and developing careers 152
. Making decisions about college 665 reers 601
. Finding jobs 506
a calculation of that these rankings. Number of surveys comples
Tech Division Composite Rankings and Total Scores G
12. Planning and develop (1-6,9) 189 34. Making decisions (75-77) 117 5. Preparation for finding jobs (7,21-23,51-54,62-68,71,72) 109 6. Understanding and getting along with others (8-11,38,39) 86 Grade 11 (N=136) 1. Making decisions about college 282 23. Finding jobs 231 4. Preparation for finding jobs 165 5. Learning about marriage and family responsibilities (35,36) 108 6. Making decisions 101 Grade 12 (N=87) 12. Finding jobs 34. Making decisions 99 5. Learning consumer and homeowner skills(None, new Personal Finance Class) 97 6. Preparation for finding jobs 88 Combined Grades (N=322) 12. Planning and developing ca34. Preparation for finding jobs 362 5. Making decisions 317 6. Improving basic skills and study/learning skills (46-52,55,56) 245
T-2, p. 1

Guidance and Counseling Standard Program Evaluation
Parents (N=167) Total score
. Planning and developing careers 337
. Making decisions about college 249
. Improving basic skills including study/learning skills 417 g and getting along with others 282
. Making decisions 245
. Improving basic skills and study/learning skills 762 529
. Understanding and accepting self 444 -11,3 ,39)
that need. Items with no parenthetic notations have been previously
T-2, p. 2
12. Improving basic skills and study/learning skills 302 34. Understanding and accepting self (27-31) 233 5. Preparation for finding jobs 184 6. Finding jobs (54-62) 162 Staff (N=131) 12. Understandin34. Understanding and accepting self 195 5. Planning and developing careers 190 6. Vocational selection and training 126 Combined Adults (N=307 including 9 not identified as Staff or Parent) 12. Planning and developing careers 34. Understanding and getting along with others (8 8 436 5. Making decisions 417 6. Preparation for finding jobs 313 Page numbers in parentheses indicate the page number of the task in the Guidance Curriculum for Technical Education that addresses listed.

Guidance and Counseling Standard Program Evaluation
North Tech Rankings and Total Scores
rade 10 (N=80) Total score . Making decisions about college 186
elo ing careers . Making decisions 93
. Making decisions about college 139 eloping careers 104
76
. Making decisions about college 45 er nd homeowner skills 5
. Finding jobs 34
ills
. Making decisions about college 370 reers 280
. Finding jobs 196
G
12. Planning and dev p 145 34. Finding jobs 86 5. Preparation for finding jobs 75 6. Understanding and getting along with others 70 Grade 11 (N=63) 12. Planning and dev3. Finding jobs 4. Preparation for finding jobs 55 5. Improving basic skills and study/learning skills 46 6. Learning about marriage and family responsibilities 41 Grade 12 (N=29) 12. Learning consum a 334. Planning and developing careers 31 5. Improving basic skills and study/learning sk 25 6t.Understanding and accepting self 18 6t.Preparation for finding jobs 18 Combined Grades (N=172) 12. Planning and developing ca34. Preparation for finding jobs 148 5. Improving basic skills and study/learning skills 135 6. Making decisions 126
T-2, p. 3

Guidance and Counseling Standard Program Evaluation
Parents (N=95) Total score
asic skills and study/learning skills 200 ing and getting along with others 167
tudy/learning skills 380 self 271
T-2, p. 4
1. Improving basic skills and study/learning skills 180
. Planning and developing careers 165 23. Making decisions about college 147 4. Understanding and accepting self 123 5. Knowing how drugs and alcohol affect me and my friends 107 6. Finding jobs 100 Staff (N=73) 1. Improving b
. Understand23. Understanding and accepting self 148 4. Making decisions 140 5. Planning and developing careers 90 6. Vocational selection and training 60 Combined Adults (M=168) 1. Improving basic skills and s
. Understanding and accepting 23. Understanding and getting along with others 257 4. Planning and developing careers 255 5. Making decisions 212 6. Making decisions about college 167

Guidance and Counseling Standard Program Evaluation
South Tech Rankings and Total Scores
Grade 10 (N=19) Total score
. Finding jobs 35
eloping careers 156 . Finding jobs 155
rade 12 (N=58)
s about college 130 . Planning and developing careers 121
reers 321 . Finding jobs 310
T-2, p-5
1. Planning and developing careers 44 23. Preparation for finding jobs 34 4. Understanding and accepting self 25 5. Making decisions 24 6. Understanding and getting along with others 16 Grade 11 (N=73) 1. Planning and dev23. Making decisions about college 143 4. Preparation for finding jobs 110 5. Making decisions 83 6. Learning about marriage and family responsibilities 67 G 1. Making decision23. Finding jobs 120 4. Making decisions 84 5. Preparation for finding jobs 70 6. Learning consumer and household skills 62 Combined Grades (N=150) 1. Planning and developing ca23. Making decisions about college 295 4. Preparation for finding jobs 214 5. Making decisions 191 6. Learning consumer and homeowner skills 128

Guidance and Counseling Standard Program Evaluation
Parents (N=72)
eveloping careers 172 . Improving basic skills and study/learning skills 122
asic skills and study/learning skills 217 . Understanding and getting along with others 115
382 . Planning and developing careers 274
T-2, p. 6
1. Planning and d23. Preparation for finding jobs 117 4. Understanding and accepting self 110 5. Making decisions about college 102 6. Making decisions 81 Staff (N=58) 1. Improving b23. Making decisions 105 4. Planning and developing careers 100 5. Vocational selection and training 66 6. Preparation for finding jobs 59 Combined Adults (N=139 including 9 not identified as Staff or Parent) 1. Improving basic skills including study/learning skills 23. Making decisions 205 4. Preparation for finding jobs 190 5. Understanding and getting along with others 179 6. Understanding and accepting self 175

Guidance and Counseling Standard Program Evaluation
Tech South Tech
tudent Su vey Results
North
S r 2006 n=57 2004 n 4=5 2006 n=54 2004 n 59=Who helpe most with 4 year plan?
9% 20% 20%
alked abo r plan with counselor
ever 6% 7% 16% 20%15% 28% 20%
ar 1 1
.
alked abo with teachers ever 11% 22% 17%
31% 14% 24%ar
. 1
requency her-student conference to plan high o ram of study ever 31% 22% 41%
26% 8%ar
1.
eviewed urses w/teacher and counselor
ever 4% 2% 20% 20%15% 24% 29% 19%
ar 1 1
.
as enco selors or teachers to take challenging math
11% 28% 30% 36%17% 22% 25%
es
d Counselor 57% 38% 12% 25% Teacher 11% Parents 26% 31% 41% 27% Friends 4% 4% 4% 10% No one 4% 16% 22% 17% T ut 4 yea N 1 or 2 times 15% 1 per ye 1% 3% 24% 14% 1 per sem. 31% 26% 20% 31% Several/sem 37% 39% 12% 15% T ut 4 year plan N 24% 1 or 2 times 20% 1 per ye 13% 9% 24% 22% 1 per sem. 26% 37% 24% 22% Several/sem 19% 1% 16% 15% F of parent-teac scho l prog N 39% 1 or 2 times 22% 20% 1 per ye 26% 20% 30% 15% 1 per sem. 11% 15% 12% 4% Several/sem 9% 7% 10% 22% R sequence of co N 1 or 2 times 1 per ye 9% 7% 22% 14% 1 per sem. 37% 30% 16% 14% Several/sem 26% 26% 12% 32% W uraged by coun Never Seldom 13% Sometim 28% 35% 36% 20% Often 44% 24% 12% 19%

Guidance and Counseling Standard Program Evaluation
Student Survey Results 2006 n=57 2004 n=54 2006 n=54 2004 n=59 Was encouraged by counselors or teachers to take
19% 39% 30% 44%
26% 24% 14%es
North T South
as enco aged by counselors or teachers to take challenging English
19% 26% 31% 7% 11% 22% 7%
es
eacher o r talked with me about education or career after high school
98% 87% 61% 5% 2% 39% 5%
atisfactio elp at school selecting cour s
ot at all 2% 4% 15% 2%57% 61% 60% 1%4 3
eceived tion and counseling about continuing education
78% 62% 3% 22% 38% 7%
he follow ed during high school:
challenging science Never Seldom 26% Sometim 22% 20% 30% 29% Often 33% 15% 16% 14% ech Tech W ur Never 2 Seldom 22% 1 Sometim 26% 30% 33% 31% Often 44% 22% 14% 25% T r Counselo Yes 7 No 13% 2 S n w/h se N 2 Somewhat 4 Very 2% 3% 25% 37% R informa Yes 71% 5 No 29% 4 T ing happen spoke w/ meone in a career I aspire to
70% 65% 68% 3% 30% 32% 7%
spoke w/ ge rep about going to college
es 92% 62% 9%8% 13% 38% 1%
spoke w/ business about working there
es 54% 52% 9%46% 46% 48% 1%
I so Yes 6 No 35% 3 I colle Y 87% 5 No 4 I local Y 54% 4 No 5

Guidance and Counseling Standard Program Evaluation
Parents and I met at school about plans after high school
52% 41% 7%50% 48% 59% 3%
arents an ere assisted at school about c e applica
65% 63% 62% 6%35% 38% 4%
North T South T
tudent Su vey Results
Yes 50% 4 No 5 P d I w olleg tion Yes 5 No 37% 4 ech ech S r 2006 n=57 2004 n 4=5 2006 n=54 2004 n 59=School cou ses prepared me for career or further
9% 15% 12% 0%
ewhat Disagree 13% 22% 2%4
T ch h ech
eacher Survey Results
r education Strongly Disagree 1 Som 11% 3 Somewhat Agree 0% 50% 45% 36% Strongly Agree 38% 24% 20% 22% North e Sout T T 2006 n=69 2006 n=47To what ex nt are teachers involved in guiding and
74% 5%s/students in
at
east 0%
o what ex ts make transition from high school to further learning
5% 9%
8 8
ry staff on 2%
iors
te supporting students Part of guidance/advisory 5 Assist parent high school plan and beyond 53% 52% Meet and advise core group least once per year 72% 56% Inform parents on post high school readiness at l once a year 57% 6 Work with parents on achievement gap once a year 61% 57% T tent are teachers helping studen Believe 81% of seniors are highly competent in technical area Encourage students to take math as a senior 6% 3% Annually meet with employers and post seconda expectations 64% 8 Encourage students to take science as sen 77% 74%

Guidance and Counseling Standard Program Evaluation
2004-05 School Year Time and Task Analysis for Guidance
his data combines the total hours reported in each semester on the time and task analysis rriving at a percentage breakdown for the 2004-2005 school year.
Departments at the Technical High Schools
Ta North Tech South Tech
Hours Percent Hours Percent 78.5 9%
divid l Plan lane ices
Curriculum 69.75 7% Curriculum In ua ning 334.00 36% Individual P ning 329.75 38% Responsive S rv 241.75 26% Responsive Services 202.5 23% System Support 175.25 19% System Support 84.25 10% Non-Guidance 116.25 12% Non-Guidance 178.5 20% totals 932.00 100% 873.5 100%
T-4, p. 1

Guidance and Counseling Standard Program Evaluation
Missouri Comprehensive Guidance
15% - 25 % Guidance Cu5% - 35% Individual Planning
MSIP Standards for Counseling Staff
ull time enrollment for the 2006-07 school year is 503 at North Tech and 206 at South
Tech. Total enrollment is 1173 at North and 935 at South. Referring again to Page 4 of the
T-4, p. 2
Recommended Time Distribution
State Suggested Percentages
rriculum 225% - 35% Responsive Services 15% - 20% System Support 0% Non-Guidance
F
Standard Program Eval form, the Desirable Standard is met even with some administrative and supervision duties assigned to counselors falling into the Non-Guidance Activity area.

Guidance and Counseling Standard Program Evaluation
Particpating members of Tech uidance Advisory Committee
r. Russ Andrews, Counselor-South Tech High School r. Larry Baine, College and Career Counselor-North Tech High School
dent
munity College alth Services Student
on
School
duate chool
h School Services Student
t
ool rmation Services Student
l
dent ounty
T-5
School G
MMMs. Elizabeth Bagi, Parent of South Tech Auto Tech StuMr. Keith Bagi, South Tech Auto Tech Student Ms. Patty Barnes, Assessment Director-Florissant Valley ComMr. Ferdinand Bautista, Parent of North Tech HeMs. Michelle Bautista, North Tech Health Services Student Mr. Jeff Chandler, Lead Counselor-North Tech High School Ms. Tiffany Dunlap, North Tech Graduate-Sunnen CorporatiMr. Phil Elliott, Counselor-South Tech High School Mr. Jim Evans, College and Career Counselor-South Tech High Mr. Marshall Foss, Counselor-Oakville High School Ms. Killian Hanks, North Tech Computer Information Systems 2006 GraMr. Al Haushalter, Counselor-University City High SMr. Mike Hawley, Admissions-Rankin Tech Mr. Don Hosutt, Administrator-Technical Education Dr. Jim Jaimeson, Tech Ed and Lindbergh HigMr. Dwight Jones, North Tech Computer InformationMs. Kathy Jones, Parent of South Tech Lab Tech StudenMr. Lamont Jones, South Tech Lab Tech Student Ms. Sandy Kearney, Counselor-Eureka High School Ms. Kathleen Mead, Counselor-Ritenour High SchMs. Sharon Piel, Parent of North Tech Computer InfoMr. John Riethmeier, Counselor-Lindbergh High SchooMs. Leigh Roberts, Assessment Coordinator-South Tech High School Ms. Carol Robinson, Counselor-North Tech High School Ms. Kristen Scott, North Tech Early Childhood Student Mr. Brian Scott, Parent of North Tech Early Childhood StuMs. Sally Taylor, Personnel-Friendship Village of West CMs. Joanna VanDer Tuin, Counselor-Mehlville High School Ms. Debbie Younce, Lead Counselor-South Tech Ms. Mary White-North Tech Counselor