1 Automation Adoption and Adaptation in the Air Traffic Control, URET Case Study Tatjana Bolic.

URET Analysis Report HAIL Report :2005-2442-01 San Jose State University
Adaptation and adoption of technologies: Examination of the User Request Evaluation Tool (URET)
Kevin Corker, Martin Howard, Martijn Mooij, San Jose Sate University
San Jose, California [email protected]
November 1, 2005
Prepared for
FAA ATO-Ops Planning Systems Engineering

URET Analysis Report HAIL Report :2005-2442-01 San Jose State University
Adaptation and adoption of technologies: Examination of
the User Request Evaluation Tool (URET) 1 Kevin Corker, Martin Howard2, Martijn Mooij3,
San Jose Sate University San Jose, California
November 1, 2005
Executive Summary ........................................................................................................................ 3 1 Introduction............................................................................................................................. 3
1.1 Decision and Decision Support:...................................................................................... 4 1.2 Systems Analyses: Methodology.................................................................................... 6
2 User-Request Evaluation Tool (URET).................................................................................. 6 2.1 URET: Designed Purpose: Systems Design Interviews: ............................................... 7
2.1.1 Analysis Method ..................................................................................................... 7 2.1.2 Results..................................................................................................................... 7
2.2 URET: Operational Error................................................................................................ 8 2.2.1 Method: Operational Error Analyses:..................................................................... 9
2.3 URET Analysis: Sources of Error................................................................................. 11 2.3.1 Visual Search Error............................................................................................... 12
2.4 URET Interface Analyses ............................................................................................. 13 2.4.1 Conclusions of Current Use:................................................................................. 14 2.4.2 Implications for Future Use and Development:.................................................... 15
2.5 Suggested Approach ..................................................................................................... 15 2.6 URET: Field Observations............................................................................................ 16
2.6.1 Use of URET Alerting Functions ......................................................................... 16 2.6.2 Use of URET Route Evaluation Functions........................................................... 17 2.6.3 Use of URET route development and Host entry functions ................................. 17 2.6.4 Use of Aircraft Flight List (ACL) sorting functions............................................. 18 2.6.5 Use of URET in controller coordination functions............................................... 18 2.6.6 Other URET use observations .............................................................................. 19 2.6.7 URET Training ..................................................................................................... 19
3 Conclusions........................................................................................................................... 19 4 References............................................................................................................................. 20
1 The work reported here was supported by the Federal Aviation Administration, ATO- Ops Planning Systems Engineering, NAS Service Engineering and its technical management was undertaken by Steve Bradford, Diana Liang and Richard Jehlen. The authors very gratefully acknowledge their direction and support. We are also extremely grateful to the managers and controllers in the facilities we visited and observed for their time and insight into the process of modernization of the NAS. These professionals are the key to success in the ongoing development of air transportation service in this country. 2 Martin Howard is presently a Usability Architect with Cross Consulting, Stockholm. Sweden. 3 Martijn Mooij is currently at the Key Centre, University of Queensland, Brisbane, Australia.

URET Analysis Report HAIL Report :2005-2442-01 San Jose State University
Executive Summary The evolution of the National Airspace leading to the Next Generation Air Transportation System (NGATS) depends on a coordinated design development and deployment strategy for information distribution and performance aiding systems. The purpose is to move the process of Air Traffic Management from control of individual aircraft defined in terms of navigation aids based in a static position-standard to a concern for air traffic flow defined in terms of four-dimensional trajectories through an information rich and flexible airspace that adapts to accommodate user preference, reducing weather restrictions, and increasing the adaptive use of the airspace assets (both human and infrastructural). In order to assure the success of this adaptation, concern for the impact of enhanced technologies on human, team, and organizations must be designed into the process for technology insertion and procedural change. This report defines a systematic human-system development, deployment and assessment process to guide future NGATS operational evolution. We report on analyses and assessment of two decisions aiding systems. These were initiated through the FAA modernization process developed under the Free Flight Phase 1 program. The report examines the design strategies in the development of the User Request Evaluation System (URET). Based on the design statements an analysis of functional implementation of URET was conducted through analysis of operational errors attributed to the initial introduction of the URET system and through field-observation in four Air Route Traffic Control Centers (ARTCCs). The use of URET was observed. Strategies for its current application and controller assessment of its utility are provided. Conclusions are drawn with respect to the use of URET as a Flight Progress Strip (FPS) replacement; with respect to its use as a trajectory planning and evaluation tool (which is not currently a significant part of its operational use); and its impact on the organization structures in the facilities in which it is being used. Throughout this analysis, we developed and applied a methodology that was guided by an approach to human/system design and analysis that is called Cognitive System Engineering (CSE). Cognitive Systems Engineering (CSE) in which human and machine both constitute entities with cognitive capabilities. Such systems are denoted Joint Cognitive Systems (JCS). The point of departure for CSE is that it is meaningful to consider JCSs as a single unit of analysis (Hollnagel & Woods, 1983). In other words, it is the system as a whole that is considered capable of cognitive work such as setting goals, assessing the state of the world, affecting change, modifying goals, managing feedback, and exerting control. CSE is also concerned with overall system qualities, such as robustness to perturbations, its ability to deal with novel and unique circumstances, the dynamics of the system as a whole, the distribution of work across agents within the system, and the communication between those agents.
1 Introduction The international aviation community is advocating goals for the first quarter of the new millennium that compel a radical revamping of the practice of aircraft and air traffic management. The visions assert new modes of operation and technological requirements. Essentially without exception, these technologies fundamentally change the process of the work

URET Analysis Report HAIL Report :2005-2442-01 San Jose State University
of air traffic and air space management. The “advancements” include a redistribution of information and control among the humans and the automation systems in airspace operations that alters decision modes, execution modes and optimization processes among all participants in the aerospace transportation process. We feel that the changes in the work of air transportation operations require an approach to analyses of their impact that focuses concern on the changes in the cognitive processes that support the work in context.
1.1 Decision and Decision Support: Earlier work (Sarter and Woods, 1995) recognized the impact of active automation on the flight deck. Advancement in air traffic control automation is bringing the same message to technological development and design for air traffic management (Bresolle, et al., 2000). Billings (1996) and Wickens et al. (1998) point out the dangers in tightly coupling automation and human systems in air-ground integration without consideration of the many issues of stability, information currency and control in multi-agent management. There are two characteristics of the operational concepts of modern air traffic control that are pivotal to the successful integration of advanced tools into the system. First, is the role of human and automation assumed, explicitly or implicitly, by the system design. The human operators of the airspace system retain responsibility for its safe and efficient operation, and the attendant liability if either safety is violated or efficiency is lost. In order to perform effectively in such a complex dynamic system, the human operators of that system have been recognized to require some assistance. There has been an almost universal assumption by designers that decision support is provided in all cases in which it is assumed that either by the pace, scale or the complexity of operations the human cannot make “optimal, accurate or timely responses”. As it was expressed a recent international symposium on aviation (USA/Europe ATM Symposium, 2005), “when there is a difference between available and achieved performance, then automation and decision support tools are brought to bear.” These gaps between optimal and actual are expressed with respect to:
• Safety: The difference between no accident/incidents in system and the loss of life, property and operating margin that is observed
• Efficiency: The gap between demand at a time and capacity at that time to accommodate all users
• Adaptability: The tension between prediction and flexible response at every level of operation from flight deck response to airspace configuration.
• Schedule: The mismatch between what the advertised operations and the actual operation provide in route and time of service
• Reliability: The difference between just-in-time maintenance and system degraded operation
• Cost: The shrinking margin between revenue and costs in passenger-seat miles.
In all cases in which there is a perceived gap, decision support and automation of various configurations are deployed. There is a universal assessment that “decisions” need to be aided. However, there is a much less clear consensus about what constitutes a decision and who has the responsibility for that decisions “making”. As noted, there is reluctance, in this provision of public service, to remove the human practitioner from final responsibility for performance.

URET Analysis Report HAIL Report :2005-2442-01 San Jose State University
There is, therefore, an assumption that some human practitioner (at some level in the action cycle) will identify failure (i.e. determine that the parameters of operation have been exceeded), and correct, or adjust the decision aiding system under anomalous operations. The second fundamental is the dynamical characteristic of the system’s response. The evolution of National Airspace System (NAS) management is toward optimization of local and global operations to secure sufficient capacity and efficiency to meet projected demands in the next 20 years. A paradigm of distributed control and responsibility for flight operations is being explored in relation to shared separation authority, shared flight path determination, collaborative decision making and decision support tools in establishing schedules and cooperative management of various disturbances (weather, traffic restrictions, etc.). In support of these changes, technologies are being developed to relax system constraints and more tightly integrate flight deck and ground-based operation. These impact human/system performances in two fundamental ways. First, the decision-making process becomes distributed. This distributed decision process differs from current operations in the number of participants, in the timing of their communication, in their situational awareness, and in the span of their authority which has direct impact on crew and team resource management processes. Second, the dynamic concept of operations provides a new coordination challenges for the human operators of that system. In current operations, the roles of the constituents in airspace operations are relatively fixed. However, implementation of technologies to share information and authority in ATM, relax that stability. The human operators (pilots, air traffic controllers, and airline operations personnel) must monitor and predict any change in the distribution of authority or control that might result as a function of the airspace configuration, aircraft state or equipage, and other operational constraints. The operators are making decisions and sharing information not only about the management of the airspace, but also about the operating state of that airspace, and about the operating behaviors of the automation that is in place to aid them. In so doing, they are moving from direct participatory to supervisory roles and from supervisory roles to automated system monitoring and control by exception effectors. The human operators are supported in these roles by automation and are, by design, being given information that is intended as advisory or contributory to “situation awareness”. In these situations the human-system monitoring of response to an air traffic command may need to consider the information state of the participants in the system, the behavior of the automation that is aiding those participants, the current seat of authority in implementing the control command, and the discretionary behaviors permitted in the current system operating conditions. Finally, the notion of anomaly in these interdependent systems is complex. What is an anomaly in a system of distributed discretion, where pilot action (though perhaps different from a controller’s intention or preference) is allowed under relaxed self-separation operations? How is anomaly identified in a system where layers of automated information system provide (to all participants) levels of alert and warning for potential future anomalies or conflicts that are subject to change through any of several agents’ action? These are arenas where little is known about cognitive bottlenecks, human-system interaction, and system dynamics and stability. These are nevertheless the operating modes of the future air traffic system. We take as a starting

URET Analysis Report HAIL Report :2005-2442-01 San Jose State University
point, the analysis of two systems that are the first stages of a system-wide evolution in NAS management.
1.2 Systems Analyses: Methodology This report provides a review of the use of a system recently deployed into the national airspace. The User Request Evaluation Tool (URET) is focused on en route operations as a tool to offset controller workload in en route operations and providing mid term (12-16 minute) conflict detection and evaluation for route requests to enhance the safety of operations. This document presents a generalized framework for the study and design of a class of computerized or automated systems known as decision support systems. These systems possess a high degree of autonomy, but are not fully independent, from either human intervention or other systems. Systems with these characteristics common in industrial settings, healthcare, power production, and business, but have more recently, with the advent of affordable, high-speed networks, become more interconnected than previously. They have an important characteristic in common: both humans and computers form an essential part of the system as a whole. They are therefore referred to as joint cognitive systems (JCS) (Hollnagel & Woods, 1983). In this view, we take an approach that assigns the human and the system status as joint elements of an intentional process. Appendix 1 provides a review of the process of cognitive systems engineering describing this perspective. There are two characteristics that make such systems difficult to study and design: their joint-cognitive nature and their interconnectedness. By definition these joint systems set goals and typically rely on input from other (joint cognitive) systems and providing, in turn, output for other (joint cognitive) systems. More often than not, the interconnectedness lies not just in simple data exchange, but in coordination with other systems at a functional level. Based in this methodology, our report will follow a common structure in the analyses of URET. We first attempt to identify the goals that the systems designers’ intended to serve by the developed tool. We examine the context of operation for that tool and the organizational impact of its introduction. We examine by archival and observational analyses the actual use of the system in detail. We finally suggest process improvement functions to enable either improved current or future integration of tools into the evolving NAS.
2 User-Request Evaluation Tool (URET) The User-Request Evaluation Tool has been designed to support the “data-controller” functions in the en route and transitional airspaces in the NAS. Developed by the Mitre/CASSD organization, in its initial deployment (termed URET/Core Capability Limited deployment), it was introduced in to two ARTCCs (Memphis and Indianapolis Centers). The FAA Free Flight Phase One Office and the Civil Aero Medical Institute (Post & Knorr, 2003) have evaluated its impact on NAS operations. The tool is sited to have reduced unwanted distance in sector and provided support to allow controllers to successfully accept user requests for flight path amendments. In so doing URET has improved service in the NAS and reduced operational costs.

URET Analysis Report HAIL Report :2005-2442-01 San Jose State University
2.1 URET: Designed Purpose: Systems Design Interviews:
As an initial effort to understand the intended impact of URET on ATC performance, an interview technique was under taken. The interviews were conducted during two periods between February 24th and March 11th 2004 at the FAA technical facility in New Jersey and at the FAA HQ in Washington, DC. The interviews varied considerably in length (from 22 minutes to 77 minutes, with median and average both just over 30 minutes), depending upon the respondents and their experience relative to the focus of the study. The interviews were recorded using a digital voice recorder, and later transcribed. The transcripts were made anonymous and respondents identified by the markers 'R1' through 'R21'. The full transcription of the interviews is provided as Appendix 2 of this report.
2.1.1 Analysis Method The analysis method employed is known variously as analytical ethnography (Andersson, 1994) or foundational analysis (Nyce & Löwgren, 1995). This seeks to avoid taking category labels at face value, but rather to analytically determine what lies behind the labels. In doing so, it has the potential to uncover complexities that are otherwise hidden. The full report of this designer analysis is provided in Appendix 2.
2.1.2 Results Analysis of the interviews reveal a complex set of issues that governed (and continue to govern) the design and development of en route ATC systems. This is particularly true of URET, which initially formed part of the Free Flight program, selected for fast-track deployment. There are two conclusions drawn from these interviews. First, the method of development, training and implementation of URET is viewed as a technical problem. The focus was largely on how to build the system, not on what system to build. The issue of whether strategic planning forms part of ATC work or, if it constitutes a new function, how it integrates with and affects existing work appears to have been largely a non-issue beyond the definition of procedures for operating the interface. This is carried through during the URET training that we observed, which focused solely on how to manipulate the tool and leaves the issue of its integration into existing working practices unanswered. It is reflected in the testing procedures which almost exclusively focus on constructional quality: software metrics such as robustness, correctness to specification, and technical integration with existing systems. It is further reflected in how those potentially most concerned with 'usefulness' of the technology, the air traffic controllers, have negotiated into place mechanisms to defer the assessment of 'usefulness' until the tools have been fully operationally deployed and to mitigate any adverse side effects those tools may introduce. This resulted several memoranda of understanding that were developed between the controllers collective bargaining unit (NATCA—National Association of Air Traffic Controller) and the FAA in the introduction of URET. Both limited immunity with respect to operational error and financial incentives for the timely integration of URET were put in place. These safeguards and incentives had an impact in the early evaluation of URET’s success as will be described below in analyses of operational error. Second, the development of the functional features of URET was an evolving process with respect to its intended impact on the controller’s roles. Two things that stand out: (a) the transition of intended use from “automation with minimal human intervention”, to an interactive

URET Analysis Report HAIL Report :2005-2442-01 San Jose State University
decision support tool for the data controller; (b) the initial abandonment and subsequent (partial) reintroduction of electronic flight progress strips (FPS). In both cases, ATC feedback after interacting with system concepts provided significant changes (e.g., the reintroduction of automated conflict detection, electronic FPSs). Experience from this study shows that there is a tremendous amount of skill and competence with regard to how to build very complex systems within the FAA. There are well documented, rigorous, and detailed techniques and suites of tools to support the processes of how to build these complex systems. What this study suggests, and what the experience of URET/CCLD in training and use suggests, is that there is also a need for well documented, rigorous, and detailed techniques for determining what to build. Such techniques and methods need to go beyond 'common sense' approaches to determining what constitutes a useful system, by making explicit the expertise of practitioners.
2.2 URET: Operational Error
As a technology or decision support system is introduced into the current work practice, there are often “transition” issues associated with its integration into, and affect on, the other procedures and tasks that make up the behavioral repertoire. This impact is, of course, the focus of the cognitive systems analysis. Our initial analysis of the URET system’s impact on operational error was motivated by assertion that “error rate” (defined in terms of “operational errors”4) was increasing in the facilities in which URET was initially deployed.5 It is worth noting, from an organizational perspective, that the attribution of possible increase in operational errors as a result of URET/CCLD deployment was fueled, in part, by both the limited immunity and incentive process that was mutually agreed to by NATCA and the FAA. Our original analyses, then, were focused on determining if, given the data available, there was support for the assertion that operational errors were increasing in facilities in which URET was being deployed. To that end, we undertook an examination of operational errors across the period of transition from operation before URET was in place to operations after URET was initially implemented. 4 The Federal Aviation Administration (FAA) has established a separation standard in the en route environment of 5 nautical miles horizontally and either 1,000 or 2,000 feet vertically depending on altitude and operating state, e.g., “reduced vertical separation minima (RVSM). In the terminal environment, horizontal separation is generally between 3 and 5 nautical miles depending on the type of aircraft. An operational error results from violation of these separation standards 5 At the time of this part of the analysis, these were four ARTCCs, Memphis (ZME), Indianapolis (ZID) , CLeavelend (ZOB) and Kansas City (ZKC). The “causes” of these increased errors were attributed to different functions depending on what organization was interpreting the assertion. So on the one hand, the error increase might be attributed to the URET system and version being used, and on another hand the error increase might be attributed to the fact that as a condition of its implementation various agreements and limited immunity from the impact of operational error had been reached between the FAA and the collective bargaining unit for the air traffic controllers.

URET Analysis Report HAIL Report :2005-2442-01 San Jose State University
It should be noted that in any multi-year analysis of operational error in NAS operations there are a multitude of factors that influence traffic and the human operators’ ability to manage that traffic. Operational errors (OEs) in the process of air traffic management have been extensively studied from a number of perspectives. In brief example, and far from an exhaustive list, these include
• OEs as a function of airspace Rodgers, 1993 ; Mayberry, Kropp, Kirk, Breitler, & Wei,1995)
• OEs as a function of sector characteristics (Rodgers, Mogford & Mogford, 1998). • OEs as a function of the organization, training, procedure and feedback processes
(Shappell, S.A., & Wiegmann, D.A., 2000; Ferrante, Jouniaux, Loo, Nicolas, Cabon & Mollard, 2004).
• OEs as a function of operator load (Bier, V.M., Caldwell, B.S., Gibson, N.M. & Kapp, E.A., 1996)
• OEs as responsive to operator age (Broach, 1999) • OEs relationship to information required and provided (Endsley & Rodgers, 1994) • OEs as a function of the impact of automation and controller awareness (Endsley &
Rodgers,1997). • OEs as a function of memory requirements (Stein & Garland, 1993).
These studies have, in turn, either been guided by or have generated “taxonomies” or frameworks by which the errors observed can be classified with models of structures and processes that represent not only the physical components but also the informational and social/organizational aspects of ATM (e.g., Shappell, & Wiegmann, 2000, Shorrock and Kirwan, 1988), POWER (Mills, Pfeidler and Manning, 2002) and HERA-JANUS, which represents a harmonization of European and United States supported error modeling, (Isaac, Shorrock, Kennedy, Kirwan, Andersen and Bove, 2003; Issac and Pounds, 2001). So the interpretation of error rates must be understood in the broad context of operation in the NAS, and the perspective for the analysis must be clearly defined With this caveat in mind we proceeded to review operational error in those centers associated with URET implementation.
2.2.1 Method: Operational Error Analyses: These data were collected by examination of the full operational error report (FAA Form 7210-3 Final Operational Error/Deviation Report) for Operational Errors (OE)s reported from:
• Indianapolis (ZID) 1999-2002 • Memphis (ZME) 1999-2002 • Cleveland (ZOB) 2001-2002 • Kansas City (ZKC) 2001-2002
All operational error reports for each facility in the time frame indicated were examined. Each operational error report was examined with reference to whether or not equipment was a contributing factor to the error. If there was a reference to equipment, the full report and the narrative were analyzed and summarized to identify the conditions of operation and the causal path of the error evolution. While these reports are subject to interpretation on the part of the interviewer and the interviewee, the numbers operational errors can be used to access the trend of

URET Analysis Report HAIL Report :2005-2442-01 San Jose State University
errors across the period of implementation of URET. Figure 1 provides the result of that enumeration.
OE Trends
0
10
20
30
40
50
60
70
ZME1999
ZME2000 ZME2001 ZME2002 ZID1999 ZID2000 ZID2001 ZID2002 ZOB2001 ZOB2002 ZKC2001 ZKC2002
ZME 1999
ZME2000
ZME2001
ZME2002
ZID1999
ZID2000
ZID2001
ZID2002
ZOB2001
ZOB2002
ZKC2001
ZKC2002
Figure 1. Illustrates the overall trends in these data over the years of initial introduction of URET and its adoption in initial daily use. Statistical analysis supports what is clearly visible. There is no systematic trend in operational error as a function of URET implementation in these centers. Examination of the distribution of operational errors attributed to URET versus those not so attributed is provided in Table 1. Table 1. Operational Error Reports with direct reference to URET as the source of error.
Year Total OE OE non-uret OE uret ZME 1999 18 16 2ZME2000 31 29 2ZME2001 42 42 0ZME2002 22 15 7ZID1999 57 ZID2000 47 ZID2001 46 46 0ZID2002 61 46 15ZOB2001 61 61 0ZOB2002 62 38 14ZKC2001 28 ZKC2002 23 13 10

URET Analysis Report HAIL Report :2005-2442-01 San Jose State University
TOTAL 168 112 46
2.3 URET Analysis: Sources of Error The trend in error across implementation time frame does not support the assertion that URET implementation, per se, increases operational error. However, detailed examination of the operational errors attributed to URET through the narratives associated with the error reports does show a systematic distribution of error “causes” with reference to URET .
URET OE Attribution
distraction 13%
procedural13%
vis search 46%
comm24%
disagreement2%
commission2%
Figure 2. Shows these causes as a percentage of all “URET-Attributed” errors across all four centers.
A statistical analysis indicates that all causes are not equally likely (Χ2 = 4.82 dof =2, p < 0.05). As indicated in figure 2, the predominant “cause” for the error, when attribution was URET, was “visual search”. In decreasing order the most likely causes after visual error were communication, distraction and procedural error, then intention not carried out as desired (commission) and finally “disagreement” between the human operator and the URET system.6
Further analyses were undertaken with respect to the operating conditions at the time of the URET-ascribed error. These included:
6 Users reported having a disagreement with either the “alert” function in URET – which was common, or having a disagreement with the accuracy of the resolution in trial planning mode, which was less common. Here the human operator said “it [URET] thinks there will be a conflict, I disagree and will take no action.

URET Analysis Report HAIL Report :2005-2442-01 San Jose State University
• Number of air traffic controllers on duty and the likelihood of error (R2 = 0.33) with a higher probability of error with one versus two controllers in the sector. It worth noting, as we will discuss in the Field Observation Section of this report, that URET was designed as an Data-Controller tool. However, it seems to contribute to staffing a sector with one, rather than two, controllers.
• The number of aircraft being controlled at the time of the error (R2 = -0.69). Which indicates that there is a slight negative correlation between the number of aircraft and the likelihood of error This is consistent with the general finding that ATC (and other complex system) error tends not to occur at traffic peaks, but rather in the immediate aftermath of a busy period.
2.3.1 Visual Search Error Since visual search problems were cited most often in the causal attribution of error to URET, we decided to undertake a functional decomposition of this error in the process of field observation. The questions asked of the human operator in this paradigm are of the form provided by Reason (1990 p. 125): “What kind of information-handling device could operate correctly for most of the time, but also produce the occasional wrong response characteristic of human behavior.” The analysis of human performance in joint cognitive systems then look to two basic interactions to answer that question. First, what are the models of the basic information processing elements and functions that the human operator brings to task (Card, Moran and Newell, 1983). In these models the issue of limitations (perceptual, memorial, cognitive or motor) are provided to anticipate how humans might be overloaded by task requirements. Humans do not have infinite bandwidth and, in fact, have some unique attributes that determine what types of tasks we can and cannot do simultaneously. There are established theories that address these issues such as the Wicken’s Multiple Resource Theory (Wickens,1984). Second, what are models of the requisite constraints on those functions imposed by interaction with the decision aiding system, in this case, with the “sorting algorithms of the URET system. The human operator’s function in the distributed air/ground ATM system includes visual monitoring, perception, spatial reasoning, planning, decision-making, communication, procedure selection and execution. Human operators sharing control and information with automated aiding systems and with other operators in the control of complex dynamic systems will, by the nature of those systems, need to perform several tasks within the same time frame or within closely spaced time frames. What makes it absolutely essential to analyze multi-tasking and task management in systems where both the human-operator and the system can both take initiative is the fact of limits to human bandwidth, information storage/retrieval capacity, and our ability to focus attentional resources that clearly affect performance. To this end we analyzed the use of the URET interfaces by controllers in the field. This functional analysis suggested a dilemma in the use of the aircraft list interface (ACL) which functions as an electronic version of the flight list. The next section of this report will provide a detailed analysis of the ACL, here we want to suggest a technologically induced potential problem in the use of the URET system
URET Analysis Report HAIL Report :2005-2442-01 San Jose State University
Aircraft Count & Complexity Increases
Flight Progress Information Sorting Strategy ??
Automated Posting “Position-in-Sector”
Visual Search Load Increases
Manual Posting
Manual Manipulation Load
Increases
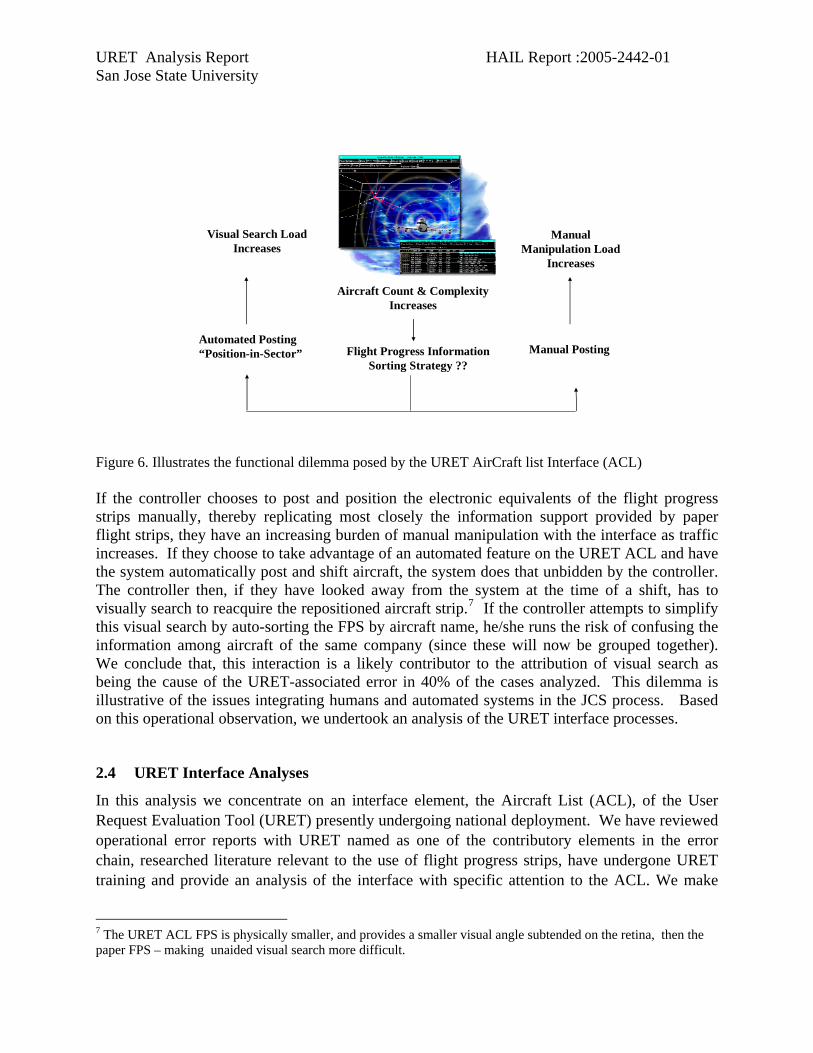
Figure 6. Illustrates the functional dilemma posed by the URET AirCraft list Interface (ACL) If the controller chooses to post and position the electronic equivalents of the flight progress strips manually, thereby replicating most closely the information support provided by paper flight strips, they have an increasing burden of manual manipulation with the interface as traffic increases. If they choose to take advantage of an automated feature on the URET ACL and have the system automatically post and shift aircraft, the system does that unbidden by the controller. The controller then, if they have looked away from the system at the time of a shift, has to visually search to reacquire the repositioned aircraft strip.7 If the controller attempts to simplify this visual search by auto-sorting the FPS by aircraft name, he/she runs the risk of confusing the information among aircraft of the same company (since these will now be grouped together). We conclude that, this interaction is a likely contributor to the attribution of visual search as being the cause of the URET-associated error in 40% of the cases analyzed. This dilemma is illustrative of the issues integrating humans and automated systems in the JCS process. Based on this operational observation, we undertook an analysis of the URET interface processes.
2.4 URET Interface Analyses
In this analysis we concentrate on an interface element, the Aircraft List (ACL), of the User Request Evaluation Tool (URET) presently undergoing national deployment. We have reviewed operational error reports with URET named as one of the contributory elements in the error chain, researched literature relevant to the use of flight progress strips, have undergone URET training and provide an analysis of the interface with specific attention to the ACL. We make
7 The URET ACL FPS is physically smaller, and provides a smaller visual angle subtended on the retina, then the paper FPS – making unaided visual search more difficult.

URET Analysis Report HAIL Report :2005-2442-01 San Jose State University
observations and assessment in two of three levels of description of the ACL, thus:
1. Analysis of the graphical user interface (GUI) of the ACL: This is an analysis of the skin of the interface with respect to principles and practice of human computer interaction. The simple question being posed is “Does the interface function in ways that support the work to be performed?”
2. Analysis of the use of the ACL from the perspective of a strip replacement: This analysis focuses on the use of strips, the history of their electronic replacement and comments on the ACL as an “electronic strip replacement”.
3. Analysis and design recommendation of the URET GUI from the broader perspective of the work of air traffic management, traffic flow and safe, efficient and orderly control of air traffic. This broader perspective will not be reported here as it waits on our completing a broad set of field observations, and then synthesis of these observations to design recommendations.
2.4.1 Conclusions of Current Use: Controllers use strips (and consequently rely on the ACL as a strip replacement) to provide:
• A reference to flight information (especially route information). The elimination of time over fix in the ACL has been noted as diminishing this support function, even though the information is available elsewhere and supported through conflict alerting.
• Annotating actions concerning a flight. Annotation by moving flights to special access area is possible but as noted difficult to perform. The lack of use of the alt/speed sections of the ACL also speak to a reduction of support in this function. There is still some controversy about the relative ease of entry through keyboard vs. handwriting. Despite that, there is no doubt that asking the controllers to maintain flight update by both methods is a non-starter. The accuracy of updating the flight plan to the host then affects the accuracy of the URET conflict predictions. This tight coupling (which did not occur in the standard HOST update process) along with the removal of information that allows the controller quick visual reference to future conflict places a premium on data entry, and this changes the relative priority of this task. This also raises an issue of procedural definition for updates to host for URET operations, and for configuration of the ACL in two person teams.
• Ordering and placement. Ordering of strips to provide some representation of traffic, or placement — e.g. slanted — to highlight a particular strip. Here the lack of drag and drop capability significantly inhibits controller manual control of the strips and reduced their utility in coordination. The difficulty also encourages the use of auto sort functions based on sorting schemes chosen by the controller. The auto sort process has been noted in the

URET Analysis Report HAIL Report :2005-2442-01 San Jose State University
operational error reports associated with URET to cause confusion, increase visual search and to decrease situation awareness.
2.4.2 Implications for Future Use and Development: In addition to the current use of ACL (“the primary URET interface”) as a strip replacement, there are plans to extend its use to include controller-pilot data link communications (CPDLC), to support resolution advisory as well as traffic conflict (PARR) and to provide an indication of weather conditions in relation to the filed routes for flights. In light of the issues raised in Section 1 of this report on the GUI of the ACL, we feel that significant analysis and some empirical work are needed to determine whether the ACL as currently provided (including those updates in Build 2) can support these additional functions without incurring cost. Specifically, 48% of operational error ascribed to URET CCLD was associated with visual search. The addition of more fields and columns of information as triggers for information seeking (clicking and expanding) by the controller does not seem likely to help the visual search problem. Further the palette of color-coding is rapidly meeting discriminability and recognizability constraints.
2.5 Suggested Approach
Given the results of previous studies, we can begin to discern what would be a fruitful direction in which to develop the URET ACL. One of the major pitfalls would appear to be building a rigid system that does not allow flexible, dynamic reconfiguration of work effort across multiple controllers in response to contextual demands. Expressed differently, a successful system would be one that works as well for a single controller working the PVD, using the ACL as a replacement for paper flight progress strips to keep track of current traffic, while also supporting a controller team consisting of separate R-side and D-side controllers, in which case the ACL (and URET) would perform much more in a planning and strategic capacity. Clearly, the distribution of cognitive effort is vastly different in these two cases, yet URET would need to be able to accommodate both of these frequently occurring situations—without major reconfiguration.
In addition to such a flexible representation (i.e., one that supports economy of cognitive resources) previous studies suggest that an electronic replacement of paper flight progress strips should possess two other characteristics:
• The main display should provide high-level information that acts as a pattern display. As such, it would provide queues to learned traffic patterns, a rapidly accessible indication of known situation types, and trend information.
• Lower-level, more detailed information should be able to be called up from the main display in such a manner that the information on the main display is not lost. In other words, subsequent queries to the system should not loose the information context in which the queries are placed.
With regard to the ACL in URET, the current implementation embodies some of these desirable characteristics (for example, overview route information is provided and more detailed [complete] information can be called up if necessary without loosing the overview). However,

URET Analysis Report HAIL Report :2005-2442-01 San Jose State University
there appears to have been no clear philosophy behind the URET ACL and, as a result, there are many inconsistencies in the interface. Proposed additions to the ACL (e.g., weather information) appear to continue this somewhat haphazard development, apparently driven more by technological capability than by any coherent vision or researched information need on the behalf of air traffic controllers. There is a substantial risk that pursuing such a development effort will lead to a cognitively cumbersome and inflexible system that remains largely unused, because the high-stakes, dynamic, event-driven world of air traffic control cannot accommodate the cognitively expensive strategies that such systems impose on practitioners (cf. Casey, 1993; Landauer, 1995; Beyer & Holtzblatt, 1998).
In particular, careful thought needs to be given to the balance between automated functionality on the one hand and information presentation on the other hand. If the desire is to keep controllers “in the loop” and to provide URET as a decision support tool (rather than as a decision making system) then it needs to be designed in such a manner that the decision making authority of controllers is not undermined, but rather enhanced.
The detailed results of the interface analysis is provided in Appendix 3 of this report. Implication of the interface design on its use in operations is provided in the next section on Field Observations.
2.6 URET: Field Observations Four centers, Cleveland, Kansas City, Washington, Indianapolis were visited during 2004. Eighteen (18) sectors were observed along with 192 controllers for over 48 hours of operation. The observation areas included high-altitude, descent sectors, departure sectors, split and joined sectors, special use airspace, and significant weather events. Traffic counts ranged from 12 aircraft per hour in a sector to a high of 68 aircraft per hour in the observed sectors. The average count was 26 aircraft per hour.
Based on the operational error data, on our interface analysis, and on the subject matter interview, we were interested in our observation to understand the inter facility and inter sector differences in the use of URET. In addition, we had developed several hypotheses with respect to the use of URET based on our Cognitive Engineering Approach. The field observations are arranged according to these hypotheses.
2.6.1 Use of URET Alerting Functions We observed the number of alerts that were checked based on URET assessment of risk. In the observation period eight (8) alerts were accessed and the URET route evaluation tool was used to examine the potential conflict.
We consider this to be a fairly low number of actions associated with a conflict alerting system that had on average 8-24 alerts in a given hour of observation. The reason for the low reference

URET Analysis Report HAIL Report :2005-2442-01 San Jose State University
to the URET flagged alerts were given in interviews with the controllers. The first issue was false alarms. There was, in controller’s opinions, a high rate of false alarms depending on sector geometry and traffic pattern with the worst case being sectors in which there was a high percentage of aircraft changing altitude. The controllers also pointed that aircraft that were indicated as being in a non-conflict situation, could be in conflict unless controller action to manage to the flight plan were taken.
As traffic densities increase the number of aircraft on vectors also increases, as controllers maneuvered traffic to avoid conflicts. The number of host updates decreases as aircraft are put on temporary vectors with intention to return to route. This increases the number of alerts provided by URET with respect to anticipated conflicts. These alerts are effectively false alarms as the controller understands that they intend to return the aircraft to route prior to any subsequent conflict. This is a positive feedback cycle in which the use of the midterm conflict alerting function of URET is undermined by necessity to maneuvered traffic.
COMMENTS: The lack of attention to URET alerts in sectors with a large number of altitudes is problematic because data on sector complexity and operational errors (Rodgers, Mogford & Mogford, 1998) indicate that it is sectors with a significant number of altitude changes that contribute significantly to operational error counts.
The reduction in the use of URET conflict alert as traffic density increases falls into the pattern of automation aiding design in which they are least useful and least used when most needed.
2.6.2 Use of URET Route Evaluation Functions We observed the number of times trajectory planning was engaged to support route request evaluation. The number of times URET was used spontaneously (that is without our requesting a demonstration of its use) was 24 times in the observation period. Since this route evaluation by the Data Controller was cited as one of the primary functional contributions of the URET system. This frequency of use does not seem to support that primary purpose.
2.6.3 Use of URET route development and Host entry functions We observed that the use of the “controller preferred routing” option, in which controllers can pre-develop preferred alternative routing for aircraft given previously experienced constraints, was a very positively received development. The single button click for route amendment to the Host was universally appreciated and used in those facilities in which that drop of the software development supported this function.

URET Analysis Report HAIL Report :2005-2442-01 San Jose State University
COMMENT: Just as the use of the electronic strip reduces controller-team workload, the use of controller preferred routing functions reduces the controller-team workload. However, some concern is raised here in that the use URET tends to move the system into what Woods and Dekker, 200 call a “stretched” system in which the aiding provided by automation that offloads the workload of the operator is offset by the use of fewer operators in the same task, or in increasing the operator load and duty cycle demand. We observed fewer two-person sectors that might otherwise be expected, and longer use of one-person sectors into higher traffic loads than might otherwise be expected.
2.6.4 Use of Aircraft Flight List (ACL) sorting functions We observed a method by which controllers used the sorting process in the electronic flight strip operations, given the operational error reports’ citation of visual distraction and our prediction of high visual search load under “time in sector” sorting. Specifically we were interested in the use of the following options: sort by position in sector, sort manually, sorted by departure time, and sort by aircraft identifier. Our prior analysis of the use of the electronic flight strip function in URET suggested and led to a hypothesis that sorting by aircraft identification would be the preferred mode of operation in the medium to high density operations. Table 2 provides the observation data that uphold that hypothesis. For each observed user of URET we noted the sorting option employed
Sort by Time in Sector Manual Sort Sort by Departure Time Sort by Aircraft ID 14 % 9 % 1% 52 % As we anticipated the controllers generally used a sorting method that would reduce visual search time. Unfortunately, given that in the aircraft ID mode of sorting the all aircraft with the same company designator are held together, the probability for call sign confusion also increases in this sort mode.
2.6.5 Use of URET in controller coordination functions URET supports some of the work of the radar controller. It allows the radar controller to anticipate requirements for point outs. It provides the radar associate a broader view on incoming traffic without interfering with the radar controller. It allows the radar associate to support and anticipate downstream conflict alerts on the basis of action in his sector.
Interface features in the current version of URET allow the radar controller to open a scrolling bar on aircraft on his radar. The radar controller can then make changes to altitude and speed were heading of the selected aircraft by scrolling on a bar and when closing the radar display, that changed speed, heading or altitude is loaded into the Host. It is possible for the radar controller to make these entries without being observed by the radar associate, if there is one on-

URET Analysis Report HAIL Report :2005-2442-01 San Jose State University
duty. When these changes have been made and downloaded the human computer interface provides an impression that the necessary action has been taken. This compelling interface was no doubt developed in support of future data link capability, whereby clearances can be uploaded from the radar controller to the aircraft flight management system. However at present such a link capability is not supported. The result is that the radar controller can receive the impression they have completed a clearance which has not yet been communicated to the intended aircraft. Further, these actions can appear to have been completed and are not able to be easily cross-checked by the data-controller because closing the scrollbar results in changes to the Host database. In my 48 hours of observation, I have three times observed entries been made on the radar position and loaded into the host without the aircraft in question having been informed the intended clearance. The compellingness of the interface, along with the lack of crosscheck ability, makes this particular completion error very likely, in my opinion.
2.6.6 Other URET use observations Controllers have complained that full route information is not clearly available due to space limitations and constraints and he aircraft list interface. In particular, destinations are often not available. To make them available, the controller must move route information to scratch pad display interface and this takes extra work. Coded departure routes and other exceptional status routes were cited as often not seen, leading to aircraft actions to actions which are surprising to the controllers. In particular, in the Cincinnati area, close to the Canadian border, international flights not registered in the URET database often are a surprise to the controller. As with many features which allow expansion of Windows, where to place the expanded window so as not to overlay important traffic becomes a significant issue especially in high density information.
2.6.7 URET Training Training for these of your ad is non-uniform across the facilities. The range of training options is from simple instructions as to the use of URET interface processes through expanded and strategic training to attempt to allow the controllers take advantage of URET functionality. As result of this variation, training across facilities the users mental models differ widely and the use of the system varies significantly. Even within a facility training differences occur as a function of an areas style results in different uses of URET capability.
3 Conclusions URET, if fully used, represents a significant variation controller work. Its intended use as a conflict detection and route evaluation tool does not seem to be the predominant use to which it is put in the field. Its secondary interface in the aircraft list has become the primary impact of URET implementation. That ACL allows controllers to operate in a single person configuration

URET Analysis Report HAIL Report :2005-2442-01 San Jose State University
by the reduction of an annual workload associated with managing strips. In my opinion, that benefit is offset by the difficulty in use of the current ACL interface presentation modes. In particular, the predominant use of aircraft ID as a sorting function seems likely to lead to error. The fact that the electronic flight strip allows more time to be spent in a single controller configuration undermines the express intended use of URET as a route evaluation tool. I've not observed the use URET has a route evaluation tool by a controller working a sector alone during my field observations.
Based on prior experience with automation, we have some predictions make as to URET’s use. First, its use as a route evaluation tool varies by controller, by facility, by center, by traffic complexity and traffic load. The route evaluation function will be under-utilized (at least with respect to route evaluation as its primary intended operational implementation). URET alerting is not currently attended by controllers and is not likely to be used in the near future. There are several reasons as to why this occurs. First there is an issue of user trust. The comment heard is: “I think this will not work but URET thinks it will; however, I'm the one that gets the deal”. Second there is significant false alarm rate and this rate increases as traffic density increases with aircraft put on temporary vectors. There's also confusion with respect to the levels of alert represented by the colors on the ACL.
A longer-term issue for URET, and similar medium-term conflict alerting system, as well as the variety of optimization systems that are intended to been implemented in the next-generation air traffic system, is the issue of changing the controllers work and subsequently changing the controllers performance capabilities. For example, take the simple case of the next-generation conflict alerting system (assuming controllers come to, or by traffic densities have to, trust the system. Controllers will come to rely on alerts and will depend upon the system to provide than those alerts. Since alerts tend to be aircraft of aircraft conflict controllers will spend time de- conflicting pairs of aircraft. If they see this as their sole job then there's the potential for a reduced attention to the efficiency and an overall reduced effectiveness in airspace utilization.
4 References Aldrich, T.B., Szabo S.M., & Bierbaum C.R. (1989). The development and application of models to
predict operator workload during system design. In G.R., MacMillan, D. Beevis, E. Salas, M. H.,Strub, R. Sutton, & L. van Breda ( Eds). Applications of Human Performance Models to System Design, NY: Plenum Press.
Andersson, R. (1994). "Representation and requirements: The value of ethnography in system design",
Human-Computer Interaction, vol 9, pp. 151-182.
Baddeley, A. D., & Hitch, G. J. (1974). Working Memory. In G. Bower, (Ed.). Advances in Learning and Motivation. (pp. 47-90). NY: Academic Press.

URET Analysis Report HAIL Report :2005-2442-01 San Jose State University
Baron, S. and Corker, K. (1989). Engineering-Based Approaches to Human Performance Modeling. in Applications of Human Performance Models to System Design. Grant, McMillan, et al., (Eds.). NY: Plenum Publishing.
Bartlett, F.C. (1932). Remembering. London: Cambridge University Press. Bier, V.M., Caldwell, B.S., Gibson, N.M. and Kapp, E.A. (1996). The effects of workload, information
flow, and shift length on coordinated task performance and human error. Final Report 133-Z572. Center for Human Performance in Complex Systems. University of Wisconsin.
Broach, D. (1999). An examination of the relationship between Air Traffic Controller Age and En Route Operational errors. Proceedings of the 10th International Symposium on Aviation Psychology, Columbus, Ohio, May.
BILLINGS, C. E. (1996). Aviation Automation: The Search for A Human-Centered Approach. Mahwah,
New Jersey, Earlbaum Billings, C. E., & Woods, D. D. (1995, April). Coordination coupling and complexity in the future
aviation system. Proceedings of the VIII International Symposium on Aviation Psychology, Columbus, OH.
BRESOLLE, M.C., BENHACENE,R., BOUDES,N., PARISE,R.(2000). “Advanced Decision Aids for
Air Traffic Controllers: Understanding Different Working methods from a Cognitive Point of View” , CENA, (3rd USA-Europe Air Traffic Management R&D Seminar, Napoli,Italy.
Card, S., Moran, T. & Newell, A. (1983). The Psychology of Human-Computer Interaction. NJ:
Erlbaum. Card, S., Moran, T. & Newell, A. (1986). The model human processor. In K. Boff, L. Kaufman, & J.
Thomas (Eds.). Vol. 2. Handbook of perception and human performance NY: Wiley. Corker, K.M., & Smith, B. (1993, October). An architecture and model for cognitive engineering
simulation analysis: Application to advanced aviation analysis. Presented at AIAA Conference on Computing in Aerospace, San Diego, CA.
Craik, K.J.W. (1947). The theory of the human operator in control systems: I. The operator as an
engineering system. British Journal of Psychology, 38, 56-61. Dorner, D. 1996. The logic of failure: recognizing and avoiding error in complex situations. Reading,
MA: Addison Wesley. Endsley, M. (1988, October). Design and evaluation for situation awareness enhancement. Proceedings
of the Human Factors Society Annual Meeting (pp.97-101). Anaheim, CA. Endsley, M. (1995). Towards a theory of situation awareness. Human Factors 37(1) 32-64. Endsley, M. and Rodgers, M. (1997). Distribution of Attention, Situation Awareness, and
Workload in a Passive Air Traffic Control Task: Implications for operational errors and automation. DOT/FAA/AM-9713, July.

URET Analysis Report HAIL Report :2005-2442-01 San Jose State University
Endsley, M. and Rodgers, M. (1994). Situation Awareness Information Requirements for En Route Air Traffic Control. DOT/FAA/AM-94/27, December.
Engh, T., Yow A., & Walters, B. (1998). An evaluation of discrete event simulation for use in operator
and crew performance simulation. Report to U.S. Nuclear Regulatory Commission, Office of Public Affairs (OPA). Washington, DC.
Ferrante, O., Jounaiux, P, Loo, T., Nicolas, G. Cabon, P., and Mollard, R. (2004). Application
of ADREP 2000 taxonomy for analysis and the encoding of aviation accidents and incidents: a human factors approach. Human Factors and Aerospace Safety 4(1), pp. 19-48.
Firby, R.J. (1989). Adaptive Execution in Complex Dynamic Worlds. Ph.D. Dissertation, Computer Science, New Haven, CT: Yale University.
Gray, W.D. John, B.E., & Atwood, M.E. (1993). Project Ernestine: A validation of GOMS for prediction
and explanation of real-world task performance. Human-Computer-Interaction, 8, (3), 237-209. Harshell, J. & Dahl, S. (1988). Simulation model developed to convert production to cellular
manufacturing layout. American Institute of Industrial Engineers Norcross, GA. Hendy, K.C. & Farrell, P.S.E. (1997). Implementing a model of human information processing in a task
network simulation environment. (DCIEM 97-R-71) Defence (sic) and Civil Institute of Environmental Medicine: Ontario, Canada.
Hollnagel, E. & Woods, D. D. (1983). "Cognitive Systems Engineering: New wine in new bottles". Int. J. of Man-Machine Studies, 18, 583-600. Isaac, A., Shorrock, S. T., Kennedy, R., Kirwan, B., Andersen, H. and Bove, T. (2003), The
Human Error in Air Traffic Management Technique (HERA-JANUS), EUROCONTROL Info Ref. # 021217-01 HRS/HSP 002-REP-03, EUROCONTROL, Brussels, Belgium.
Isaac, A. and Pounds, J. (2001), ‘Development of an FAA-EUROCONTROL Approach to the
Analysis of Human Error in ATM’, Proceedings of the 4th USA/Europe R&D Seminar, FAA/EUROCONTROL.
John, B. E., & Kieras, D. E. (1996). The GOMS family of user interface analysis techniques: Comparison
and contrast. ACM Transactions on Computer-Human Interaction, 3, 320-351. Kieras, D. (1988). Towards a practical GOMS, model methodology for user-interface design. In M.
Helander (Ed.) Handbook of Human Computer Interaction (pp. 135-158). Amsterdam: Elsevier. Klein, G. (1997). An Overview of Naturalistic Decision Making Applications. In Zambok, C. & Klein,
G. (Eds.). Naturalistic Decision Making, NJ: Erlbaum. Laughery, K.R., & Corker, K., (1997) Computer modeling and simulation of human/system performance.
In G. Salvendy (Ed.). The Handbook of Human Factors, NJ Erlbaum.

URET Analysis Report HAIL Report :2005-2442-01 San Jose State University
Lee, J. & Sanquist, T. (1993, October). Modeling techniques for shipboard manning (sic): A review and plan for development. Proceedings of the Human Factors and Ergonomics Society 39th Annual Meeting, (1, 564-568). San Diego, CA.
Mayberry, P.W., Kropp, K.V., Kirk, K.M., Breitler, A.L., & Wei, M.S. (1995). Analysis of
operational errors for air route traffic control centers. Alexandria, VA: The CNA Corporation.
McMillan, G.R., Beevis, D., Salas, B.E., Strub, M.H., Sutton, R., & van Breda, L. (1989). Applications of human performance models to system design. NY: Plenum Press.
Mills, S., Pfleiderer, E. and Manning, C. (2002), ‘POWER: Objective Activity and Taskload
Assessment in En Route Air Traffic Control’, Federal Aviation Administration, Washington, D.C.
Newell, A. (1990). Unified Theories of Cognition. (pp. 111-146). Cambridge, MA: Harvard University
Press. Newell, A., & Simon, H.A. (1976). Computer science as empirical inquiry: Symbols and search.
Communications of the Association for Computing Machinery, 19(3), 113-126. Nyce, J. M. & Löwgren, J. (1995). "Toward foundational analysis in human-computer interaction". In P.
J. Thomas (ed.), The Social and Interactional Dimensions of Human-Computer Interfaces. Cambridge, UK: Cambridge University Press.
Post, J & Knorr, D. (2003). Free Flight Program Update. 3rd USA/Europe Air Traffic Management R&D Seminar, Naples, Italy, 13-16 June.
Odani, A. et al. (1997). Existing and required modeling capabilities for evaluating ATM systems and concepts. (NASA-NAG2-1997) Moffett Field, CA, NASA Ames Research Center.
Orasanu, J. & Fisher, U. (1997). Finding decisions in natural environments: The view from the cockpit.
In Zambok, & C. Klein, G. ( Eds.) Naturalistic Decision-Making, NJ Erlbaum. Pew, R. & Mavor, A. (1998). Modeling human and organizational behavior: Applications to military
simulations. National Research Council. Washington, DC. Pew, R. W. & Mavors, A. S. (Eds.) (1998). Modeling Human and Organizational Behavior: Applications
to Military Simulations. Washington DC: National Academy Press. Rasmussen, J., Pejtersen, A. M., Goodstein, L. P. (1994). Cognitive Systems Engineering. NY Wiley. Reason, J. T. (1990) Human Error. Cambridge: University Press. Rodgers, M., Mogford, R. and Mogford, L. (1998). The Relationship of Sector Characteristics to
Operational Error. DOT/FAA/AM-98/14. Rodgers, M. (1993). An Examination of the Operational Error Database for Air Route Traffic
Control Centers. DOT/FAA/AM-93/72, December.

URET Analysis Report HAIL Report :2005-2442-01 San Jose State University
Sarter, N. & Woods, D.D. (1995). Strong Silent and Out-of-the-Loop: Properties of Advanced (Cockpit)
Automation and Their Impact on Human-Automation Interaction. Technical Report CSEL 95-TR-01, Columbus, Ohio : Cognitive System Engineering Laboratory, Ohio State University.
Serafty, D., MacMillan, J., Entin, E. & Entin, E. (1997). The decision-making expertise of battle
commanders. In Zambok, & C. Klein, G. (Eds.). Naturalistic Decision-Making, NJ Erlbaum.
Shappell, S.A., & Wiegmann, D.A. (2000). The Human Factors Analysis and Classification System – HFACS (Technical report DOT/FAA/AM-00/7). Washington, DC: Office of Aviation Medicine.
Sheridan, T. B., & Ferrell, W. R. (1969). Human control of remote computer manipulators. Proceedings
of the International Joint Conference on Artificial Intelligence, Washington, DC. Sheridan, T.B. (1992) Telerobotics, Automation, and Human Supervisory Control. Cambridge: MIT
press. Shorrock, S.T. and Kirwan, B. (1988), ‘The development of TRACEr Technique for
Retrospective Analysis of Cognitive Errors in ATM’, in D. Harris (ed.), Proceedings of the 2nd International Conference on Engineering and Cognitive Ergonomics, Oxford, England, Ashgate.
Stein, E. and Garland, D. (1993). Air traffic controller working memory: considerations in air traffic control tactical operations. FAA Tech Report DOT/FAA/CT-TN93/37.
Swain, A. D., &Guttmann, H.E. (1983). Handbook of human reliability analysis with emphasis on
nuclear power plant applications. (NUREG/CR-1278) Albuquerque, NM: Sandia National Laboratories.
Tulga, M. K., & Sheridan, T.B. (1980). Dynamic decisions and workload in multi-task supervisory
control. IEEE Transactions on Systems Man and Cybernetics, SMC-10, 5:217-231. Tyler, S., Neukom, C. Logan, M. & Shively, J. (1998, October). The MIDAS human performance model.
Proceedings of the Human Factors and Ergonomics Society 42nd Annual Meeting. (pp. 320-325). Chicago, IL.
Weizeman, J. (1976). Computer power and human reason: From judgment to calculation. Berkeley
Heights, NJ: Freeman Press. Wickens, C. D. (1984). Processing resources in attention. In R. Parasurraman & R. Davies (Eds.).
Varieties of Attention, Washington DC: National Academic Press. WICKENS, C., MAVOR, A. PARASURAMAN, R. and MCGEE, J. P. (1998). The Future of Air Traffic
(Washington, D.C. National Academy Press). Woods, D. D. & Dekker, S. W. A. (2000). "Anticipating the effects of technological change: A new era of
dynamics for Human Factors". Theoretical Issues in Ergonomics Science, 1(3), 272-282. Systems Engineering: New wine in new bottles". Int. J. of Man-Machine Studies, 18,

URET Analysis Report HAIL Report :2005-2442-01 San Jose State University
583-600.

APPENDIX 1 Discussion of Cognitive System Engineering Cognitive Systems Engineering (CSE) is an approach to the study and development of complex systems in which human and machine both constitute entities with cognitive capabilities. Such systems are denoted Joint Cognitive Systems (JCS). A point of departure for CSE is that it is meaningful to consider JCSs as a single unit of analysis (Hollnagel & Woods, 1983). While the physical division between humans and machines in a JCS remains quite defined, from a cognitive perspective, the JCS is considered as a whole. In other words, it is the system as a whole that is considered capable of cognitive work such as setting goals, assessing the state of the world, affecting change, modifying goals, managing feedback, and exerting control. The implications for CSE are several. More traditional approaches to human factors have been concerned with information gathering, assessment, and communication. One component of CSE is indeed to study and design how information and knowledge is gathered, maintained, and passed among the various agents within the system. Complementary to this, CSE is also concerned with overall system qualities, such as robustness to perturbations, its ability to deal with novel and unique circumstances, the dynamics of the system as a whole, the distribution of work across agents within the system, and the communication between those agents. CSE draws upon a number of disciplines and sources of inspiration. One of the more prominent ones of these is the ecological approach to visual perception (Gibson, 1969; later expanded by others into an ecological approach to cognition in general). In doing so, it recognizes the importance of the environments in which a cognitive agents (human or machine) are immersed (e.g., Flach, Hancock, Caird, & Vicente, 1995; Flach, 2000). Expressed differently, this is known as the agent-environment mutuality. For CSE, this means that the problems faced by a JCS and the practitioners within the system have to be understood from their perspective within the system and the environment (cognitive ecology) in which it exists and operates. Indeed, the full implication of the agent-environment mutuality principle is that the problems do not exist other than within this relationship (Winograd & Flores, 1986; Howard & Woods, forthcoming paper). One example of this is to contrast the justifications for investments in new technology with the reality that such investments (in technology, procedures, training, or other changes) often have to contend with. In some cases, investments are more informed and are justified upon their presumed impact not only on performance, but also on coordination and collaboration among the practitioners within a system. In many cases, this justification is done on the basis of performance optimization from a single point of view. While in these cases the performance is often considered at a system-wide level, they tend to overlook the considerable (unspecified and thus hidden) work needed by humans to supply the "glue" to fit the new technology in the old system. Often the cases considered are best-case scenarios, or consider only a reduced set of circumstances that the system as a whole finds itself facing. These "envisioned worlds" of future practice are subject to a number of characteristics (Woods & Dekker, 2000). For any not-yet-existing, envisioned system, there are multiple views of what that future is (plurality). Except in simple, toy cases, JCSs are always comprised of multiple agents which are immersed in multiple, different environments. Each such agent/environment

combination has its own set of goals, tasks, functions, resources, priorities, and success criteria which shape their expectations of what future systems of practice will entail. Each view into this future is underspecified in terms of the impact that the proposed technology will have on practice within a system: the narrow performance criteria mentioned above is an extreme example, but even many other efforts, the focus is on system functionality, procedures, and performance measurements, system status measurements (workload, amount of communication, and similar measurements). Rarely is the impact that new technology will have on the constraints that a system operates under much of a consideration, yet this can lead to powerful insights in terms of how well the investment will succeed. The proposed designs are often ungrounded: many times they fail to incorporate what practitioners in the existing system have learnt from current practice; many times they also fail to take into considerations what has been learnt by the human factors community about cognition in complex, industrial systems. A final characteristic of envisioned worlds is that expectations are poorly calibrated: very often, they are overly optimistic in that the envisioned (performance) benefits will be reached and that they are considered the only impact that the investment will have. Cognitive systems engineering tries to manage this set of complexities by acknowledging that there are always multiple perspectives involved; that each view of the future is going to be underspecified, ungrounded, and poorly calibrated. It does this through a process of understanding a field of practice (from a cognitive perspective), attempting to create grounded candidate designs, and assessing these in terms of their probable impact on a joint cognitive system. Understanding a field of practice was initially known as cognitive task analysis (CTA) but has subsequently expanded and become known more generally as cognitive work analysis (CWA; Vicente, 1999). Its focus is less on procedures and protocol and more on eliciting, through observation, interviews, and empirical study (such as simulation, or interaction with prototypes) the fundamental characteristics of a given type of work. These consist of the goals of the work (what is trying to be achieved), functions in the domain at various levels of abstraction (how the goals can be achieved), the constraints that those functions operate under (what influences which functions are used and how), and the implementation of the domain functions (what equipment, procedures, tools are used to physically achieve the goals). The result of CWA is a cognitive description of a work domain. While it is grounded in a specific domain, the aim is also to abstract from that and express the work that takes place in a more general, cognitive language. This allows us to make connections between different work domains and to produce more generalized, reusable knowledge that is relevant to cognitive work. Attempting to assess the impact that proposed new technology will have on a JCS through solely analytical methods is an impossibility. System designers and developers do not know enough about the subtle nuances and variations in the work that practitioners use as a matter of course (the "glue"). Conversely, practitioners seldom know how to articulate this, nor know enough

about how new technology can be exploited to be able to envision truly novel ways of reorganizing or restructuring work. It is only in the collaborative process of assessing prototypes and their suitability within a certain domain (that is, a certain agent-environment ecology) that we are able to systematically narrow this gap. The process of discovery does not end with a requirements specification step: designing, developing, and assessing prototypes from a usefulness and (domain) functional point of view elicits knowledge about the domain and the work performed therein in a way that observational studies and interviews alone are not able to do. The key to this is to approach prototypes as tools for discovery and to consider them hypotheses of what would be useful (Woods, 1998). By assessing the performance of the JCS as a whole through simulated use of prototypes, we can calibrate our expectations of how the proposed technology will impact cognition and collaboration. A series of such hypothesize/design/evaluate cycles allows us to manage the four characteristics of envisioned worlds. Involving all the various stakeholders covers the multiple perspectives (plurality); through well-chosen, realistic, scenarios we can assess the impact on cognition and collaboration (underspecification) achieve more realistic assessments of what effects the technology will have (calibration); by a combination of general CSE knowledge, using the CWA to guide the prototype design, and by involving practitioners in realistic simulations, our designs become grounded both theoretically and in practice. This has been a very quick overview of CSE. At first glance, it may appear to seem very similar to a lot of existing systems development activities, but this similarity tends to be superficial. CSE's concern is less with objects and things, and more with the relationship between agents (both machine and human) and the environment in which they operate; it is less concerned with procedures and tasks, and more concerned with the constraints that agents both exploit and are limited by in order to achieve their goals (which shape procedures and tasks); it is less concerned with prototypes as artifacts, and more concerned with prototypes as a way of learning about a domain and a way of capturing that knowledge. Appendix 1: References Flach, J., Hancock, P., Caird, J., & Vicente, K. (Eds.). (1995). An ecological approach to human machine systems. Lawrence Erlbaum Flach, J. M. (2000). An ecological approach to human-machine systems. In Proc. IEA 2000/HFES 2000 Congress. Gibson, J. J. (1966). The senses considered as a perceptual system. Boston, MA: Houghton Mifflin. Gibson, J. J. (1979). The ecological approach to visual perception. Boston, MA: Houghton Mifflin. Hollnagel, E. & Woods, D. D. (1983). "Cognitive Systems Engineering: New wine in new bottles". Int. J.

of Man-Machine Studies, 18, 583-600. Vicente, K. J. (1999). Cognitive Work Analysis: Towards safe, productive, and healthy computer-based work. Mahwah, NJ: Lawrence Erlbaum Associates. Woods, D. D. (1998). "Commentary: Designs are hypotheses about how artifacts shape cognition and collaboration". Ergonomics, 41(2), 169-173. Woods, D. D. & Dekker, S. W. A. (2000). "Anticipating the effects of technological change: A new era of dynamics for Human Factors". Theoretical Issues in Ergonomics Science, 1(3), 272-282. Systems Engineering: New wine in new bottles". Int. J. of Man-Machine Studies, 18, 583-600. Vicente, K. J. (1999). Cognitive Work Analysis: Towards safe, productive, and healthy computer-based work. Mahwah, NJ: Lawrence Erlbaum Associates. Woods, D. D. (1998). "Commentary: Designs are hypotheses about how artifacts shape cognition and collaboration". Ergonomics, 41(2), 169-173. Woods, D. D. & Dekker, S. W. A. (2000). "Anticipating the effects of technological change: A new era of dynamics for Human Factors". Theoretical Issues in Ergonomics Science, 1(3), 272-282.

Appendix 2: URET: Design Interviews Martin Howard 1 A source of motivation for this approach came from the literature concerning an ecological approach to cognitive systems (e.g., Flach et. al., 1995; Flach, 2000; Hollnagel & Woods, 1986), particularly those portions of the field concerned with the design of envisioned systems (e.g., Woods, 1998; Woods & Dekker, 2000). Woods & Dekker (2000) show four properties of envisioned systems that must be managed during design processes, or usability concerns are likely to be discovered during deployment and use. Again, experiences from our evaluation of URET led us to explore to what degree these properties of envisioned systems had been managed in the URET project. 1.2 Theoretical basis: Cognitive Systems Engineering CSE draws upon a number of disciplines and sources of inspiration. Of the more prominent is the ecological approach to visual perception (Gibson, 1969; later expanded by others into an ecological approach to cognition in general). In doing so, it recognizes the importance of the environments in which a cognitive agents (human or machine) are immersed (e.g., Flach, Hancock, Caird, & Vicente, 1995; Flach, 2000). Expressed differently, this is known as the agent-environment mutuality. For CSE, this means that the problems faced by a JCS and the practitioners within the system have to be understood from their perspective within the system and the environment (cognitive ecology) in which it exists and operates. Indeed, the full implication of the agent-environment mutuality principle is that the problems do not exist other than within this relationship (Winograd & Flores, 1986; Howard & Woods, forthcoming paper). One example of this is to contrast the justifications for investments in new technology with the reality that such investments (in technology, procedures, training, or other changes) often have to contend with. Ideally such investments are informed and are justified upon their presumed impact not only on performance, but also on cognition and collaboration among the practitioners within a system. In many cases this justification is done on the basis of performance optimization from a single point of view. While in these cases the performance is often considered at a system-wide level, they tend to overlook the considerable (unspecified and thus hidden) work needed by humans to supply the "glue" to fit the new technology in the old system. Often the cases considered are best-case scenarios, or consider only a reduced set of circumstances that the system as a whole finds itself facing. These "envisioned worlds" of future practice are subject to a number of characteristics (Woods & Dekker, 2000). For any not-yet-existing, envisioned system, there are multiple views of what that future entails (plurality). Except in simple, toy cases, JCSs are always comprised of multiple agents which are immersed in multiple, different environments. Each such agent/environment

combination has its own set of goals, tasks, functions, resources, priorities, and success criteria which shapes their expectations of what future systems of practice will entail. Each view into this future is under-specified in terms of the impact that the proposed technology will have on practice within a system: the narrow performance criteria mentioned above is an extreme example, but even many other efforts, the focus is on system functionality, procedures, and performance measurements, system status measurements (workload, amount of communication, and similar measurements). Rarely is the impact that new technology will have on the constraints that a system operates under much of a consideration, yet this can lead to powerful insights in terms of how well the investment will succeed. The proposed designs can be ungrounded: many times they fail to incorporate what practitioners in the existing system have learnt from current practice; many times they also fail to take into considerations what has been learnt by the human factors community about cognition in complex, industrial systems. Finally, expectations are often poorly calibrated: they tend to be overly optimistic in that the envisioned (performance) benefits will be reached and that they are considered the only impact that the investment will have. CSE tries to manage this set of complexities by acknowledging that there are always multiple perspectives involved; that each view of the future is going to be under-specified, ungrounded, and poorly calibrated. It does this through a process of understanding a field of practice (from a cognitive perspective), attempting to create grounded candidate designs, and assessing these in terms of their probable impact on a joint cognitive system. Understanding a field of practice was initially known as cognitive task analysis (CTA) but has subsequently expanded and become known more generally as cognitive work analysis (CWA; Vicente, 1999). Its focus is less on procedures and protocol and more on eliciting, through observation, interviews, and empirical study (such as simulation, or interaction with prototypes) the fundamental characteristics of a given type of work. These consist of the goals of the work (what is trying to be achieved), functions in the domain at various levels of abstraction (how the goals can be achieved), the constraints that those functions operate under (what influences which functions are used and how), and the implementation of the domain functions (what equipment, procedures, tools are used to physically achieve the goals). The result of CWA is a cognitive description of a work domain. While it is grounded in a specific domain, the aim is also to abstract from that and express the work that takes place in a more general, cognitive language. This allows us to make connections between different work domains and to produce more generalized, reusable knowledge that is relevant to cognitive work. Attempting to assess the impact that proposed new technology will have on a JCS through solely analytical methods is an impossibility. System designers and developers do not know enough about the subtle nuances and variations in the work that practitioners use as a matter of

course (the "glue"). Conversely, practitioners seldom know how to articulate this in a way that makes design possible, so the naïve approach of merely asking practitioners for lists of requirements is ineffective. While practitioners are experts at performing their work, they are not necessarily experts in information technology and may not know enough about how new technology can be exploited to be able to envision truly novel ways of reorganizing or restructuring work. Through the collaborative process of assessing prototypes and their suitability within a certain domain (i.e., a certain agent-environment ecology) that we are able to systematically narrow this gap. The process of discovery does not end with a requirements specification step: designing, developing, and assessing prototypes from a usefulness and (domain) functional point of view elicits knowledge about the domain and the work performed therein in a way that observational studies and interviews alone are not able to do. One key component of this is to approach prototypes as tools for discovery and to consider them hypotheses of what would be useful (Woods, 1998). By assessing the performance of the JCS as a whole through simulated use of prototypes, we can calibrate our expectations of how the proposed technology will impact cognition and collaboration. A series of such hypothesize/design/evaluate cycles allows us to manage the four characteristics of envisioned worlds. Involving all the various stakeholders covers the multiple perspectives (plurality); through well-chosen, realistic, scenarios we can assess the impact on cognition and collaboration (under-specification) achieve more realistic assessments of what effects the technology will have (calibration); by a combination of general CSE knowledge, using the CWA to guide the prototype design, and by involving practitioners in realistic simulations, our designs become grounded both theoretically and in practice. 1.2 Focus of study The objectives of the interview study were to document and understand: • The methods by which ATC systems are developed (methodology); • The methods and criteria for assessment of success (evaluation); • The types of tradeoffs in the process (practice); This was done with a focus on how it was determined what to build, how it was determined what would be useful, and how the impact of proposed systems was assessed. The main focus, based upon prior experience, was on URET/CCLD, but the study also touched on other systems at various stages of development, evaluation, and deployment: TMA, ERAM, Dynamic Density, Dynamic Reduced Vertical Separation, and CTAS as a whole. 2 Method

The study took the form of a series of semi-structured interviews. The personal interview method was chosen due to the exploratory nature of the study: it enables the interviewer to quickly and easily ask follow-up questions for clarification, to explore an issue in greater depth, or to ask a respondent to elaborate on a previous answer. Semi-structured interviews are ones in which some of the questions are pre-defined. They have the advantage over fully structured interviews, in which the list of questions is fixed, in that they allow the interview to be sensitive to and discover issues which the respondent may consider central and important, but which had been overlooked or unknown by the interviewer at the time of planning. They offer the advantage of an unstructured interview, in which none of the questions are pre-defined, in that a list of questions can be supplied to the respondent in advance, letting them know what the theme and subject of the interview will be. The choice of interview method must be governed by the purpose of the study. For this study, a semi-structured interview offered the greatest combination of flexibility and structure and a high likelihood yielding information suitable for the chosen analysis method. 2.1 Respondents Respondents were selected in collaboration with Jacqueline Rehmann of the FAA Tech Center in New Jersey. The selection was not random, but a targeted selection, based upon the desire to interview people who were or had been involved in the design, development, evaluation, and deployment of en-route ATC systems. Participation was entirely voluntary, but none of the people approached declined to participate. Three people were unable to participate due to events not related to this study. In total, 21 respondents were interviewed. The respondents worked at all levels of the FAA and included former ATCs, technical staff, and managerial staff. In addition to eighteen FAA employees, respondents also included three people from MITRE. Respondents did not include anyone from Lockheed Martin, the company contracted to build URET/CCLD, nor other potential stakeholders from from the aviation industry (e.g., airlines, or manufacturers). 2.2 Interviews The interviews were conducted during two periods between February 24th and March 11th 2004 at the FAA technical facility in New Jersey and at the FAA HQ in Washington, DC. The interviews varied considerably in length (from 22 minutes to 77 minutes, with median and average both just over 30 minutes) depending upon the respondents and their experience relative to the focus of the study. The interviews were recorded using a digital voice recorder, and later transcribed. The transcripts were anonymized and respondents identified by the markers 'R1' through 'R21'. 2.3 Analysis method Prior to analysis, the interview transcriptions were coded to remove any personally identifying

information. The analysis does not depend upon knowledge of any individual, other than their job function and experience of en-route ATC systems design, development, or deployment. As such, no further information regarding the respondents will be given in this report. The analysis method employed is known variously as analytical ethnography (Andersson, 1994) or foundational analysis (Nyce & Löwgren, 1995). This seeks to avoid taking category labels at face value, but rather to analytically determine what lies behind the labels. In doing so, it has the potential to uncover complexities that are otherwise hidden, and to reveal multiple readings of the same category label (cf. the notion of plurality in the 'Envisioned Worlds Problem', Woods & Dekker, 2000). As an example imagine a study among high school teachers to determine requirements for a new school schedule planning program to run on personal computers. Rather than asking teachers directly what they would consider 'useful' and taking their responses literally or very close to face value (i.e., seeing them as a requirements specification), an analytical approach would involve a more general discussion around the issue of schedule planning. Teachers would be asked to provide specific examples of the work they do, problems they may have encountered, things they find frustrating, as well as what they consider to be the most important aspects of the work, the sequence in which things are done, and how schedule planning dovetails with other activities at the school. These and other questions would all revolve around the category of 'planning'. The analysis would then seek to decompose the category 'planning' (and other categories found during the data collection) into its constituent components and to translate these into something that could be understood by the design community. It is very likely that different teachers would have different views of what 'planning' actually consisted of. It is very likely that different teachers would use the same category word, but mean different things by it from either each other, or more probably, from the interviewer's use of the word. As an example, consider the software community's technical reading of 'to default' compared to the financial community's usage of the same verb. It is also very likely that this is knowledge which they take for granted and thus find hard to articulate directly, or do not ever think to do. Rather, it is articulated through examples, or by correcting misassumptions by the interviewers as they ask questions (interestingly enough, asking 'dumb' questions can be a very powerful knowledge elicitation technique). Foundational analysis does not reify any one particular reading of common sense. While the interviewers and analyst are likely to have their own interpretations of what 'planning' for the high school domain is, this is suspended in favor of critically analyzing the respondents' readings. Likewise, no one respondent's answers is necessarily given greater weight than any others. Multiplicity of views is a fact of life and its nuances need to be understood, perhaps in terms of differing experience or expertise among respondents, if it is to be successfully accommodated. What foundational analysis does is to 'take apart' and to 'put back together' not only what practitioners tell us and regard as common sense, but also what designers and

developers take for granted as well. This requires sustained analysis of what the software development community has tended to pretty much take at face value: informant statements, intentions, and actions. Foundational analysis can help us better understand what others regard as the natural order of things. 3 Results Analysis of the interviews reveal a complex set of issues that governed (and continue to govern) the design and development of en-route ATC systems. This is particularly true of URET, which initially formed part of the Free Flight program, selected for fast-track deployment. Two main themes have been identified and are elaborated upon below, with supporting quotations from the interviews where appropriate. The first of these themes concern the investigation of what would constitute a 'useful' system to those destined to integrate it in their work (in this case, en-route air traffic controllers). The second theme looks at the types of system evaluation and validation that takes place. 3.1 Investigation of usefulness The FAA has for many years strived towards an automated approach to conflict detection and resolution, with research programs such as the FAA's Automated En Route Air Traffic Control (AERA) and MITRE's Advanced Automation Suite (AAS) originating in the late 1970s to early 1980s timeframe. The respondents answers suggest that this vision was initially of a fully automated system that operated with minimal human intervention, but that this has been modified in later decades towards automation-based assistance to human ATCs. (From the interviews, it is unclear whether the reasons for this were purely technical or not and the issue has not been explored further.) The motivation for this research effort appears to have been a combination of performance increase (more planes in the same airspace) while retaining or improving the level of safety (maintained number or reduced number of separation violations). Around the time of the Free Flight program, a portion of what was the AAS becomes the User Request Evaluation Tool (URET). The decision is taken that this constitutes "mature technology" and emphasis shifts towards the production of an operational strength system. However, it would appear that during this timeframe (mid-1990s), there is a shift in focus from what constituted the design vision in the AAS system to what constitutes the vision for URET. A good example of this is the aircraft list (ACL) in URET. Initially, the purpose and intent for URET was to act as a query tool to probe for potential conflicts between aircraft and aircraft, or aircraft and airspace.
And in 1995 the FAA said "okay lets use some of that [the AAS] research and put out what they called the User Request Evaluation Tool". Which started out to be basically the controller would say, “the user or somebody wants this change: Lets evaluate it to see if it has any conflicts”.

R18
In this transition from the AERA and AAS into URET, the concept was trimmed down and modified from its original form:
[...] probably the biggest difference was the original AERA concept was a complete sector sweep that’s done and air traffic wanted to... for a whole combination of reasons like it's hard to put things on the R-side... wanted to start out with it as a strategic tool on the D-side. And I think that was a huge shift in the concept.
R18
The MITRE URET prototype was placed in facilities (Indianapolis and later Memphis) and underwent evaluation and further development. As the evaluations progressed, the focus of the tool changed somewhat. In addition to supporting user requests, it also continuously monitored the flights that it knew about to alert controllers to future potential conflicts, regardless of whether the tool had been explicitly asked to probe for this or not.
And they gave us a bunch of feedback and basically the biggest thing they said at the beginning was well we can't just have you just try the one that I'm asking about: We want more of a continuous conflict detection. [...] So tell us when there's a problem.
R18
URET was thus intended to be a strategic planning tool for D-side use. Some respondents suggests that this was at the request of the controllers who stated that there was no physical space for the additional display and perhaps little time for the R-side to use URET. However, it would appear that even on the D-side, workload was an issue and that adding the task of strategic planning was problematic. In response to this and, presumably, because the information was needed by URET to do conflict detection, the decision was made to make electronic flight data available.
And in the in the mid 90’s they [MITRE] took it [the URET prototype] [...] to Indianapolis center to get input from the controllers. It was during that time that the concept that including electronic flight data came about [...]. It was a conflict probe, but in the when they first went to Indianapolis Center and brought URET there they came to the realization that the people on the assistant controllers position, on the D position, were processing paper, stuffing strips and doing that. They basically told MITRE... and I wasn’t there... but they told MITRE “unless you can help us deal with workload, there is no way we have time to take on strategic planning”, which is what URET bought to the controllers. So from that, MITRE worked with them to devise the electronic flight data piece of URET.
R20
However, the history behind this may be longer, and possibly reversed. One respondent suggests an alternate version, in that the FAA had been exploring electronic flight progress strips concepts for some time:
[...] we essentially had 2 requirements. One from the early 70’s which was electronic display of flight strips and they had a program here called ETABS which... about every 5 or

6 years we would try to use whatever the latest technology was to attempt to 1) replace the flight strip printers, and 2) provide this strategic conflict prediction.
R12
This suggests that the ACL in the MITRE URET prototype was not just an opportunistic display of information that the URET conflict probe used, but actually one of two coordinated functions that the FAA had been looking into up to a decade earlier. Seen in this light, the ACL is the primary function and conflict detection is something that electronic flight strips enable and is thus the secondary function.
[...] they [MITRE] also had something else that the FAA had been trying to do since I started to work here which was a form of electronic flight strips. Right now what’s going on in the control centers they have paper flight strips, they rip the flight strips off, put them up on a little clickety-clack board, that controllers move. And they still are using paper. One of the features of the MITRE of prototype also was a form of electronic flight strip, where the aircraft’s current ID, flight plan, and the other notations would be displayed electronically.
R12
Despite this history, the official standpoint was and remains that the electronic flight information available in URET was never intended to replace the paper strips.
Now there was never any intent for URET to replace the paper. So, till this day we are not trying to do that. However, we do provide a significant amount of flight data management... electronic flight data.
R20
One reading of this history gives thus that it appears that what was once an FAA research program to look into creating electronic flight progress strips, with conflict detection and monitoring as a secondary (background) function, has been modified into an officially supported, strategic planning and conflict probe tool, with electronic flight data as an optional extra: In essence, an almost complete reversal of the original intent. There are two things that stand out: (a) the transition from automation with minimal human intervention, to decision support tool; (b) the initial abandonment and subsequent (partial) reintroduction of electronic flight progress strips. In both cases, ATC feedback after interacting with system concepts provided significant changes (e.g., the reintroduction of automated conflict detection, electronic FPSs). While the initial design of URET appears to have concentrated on technical issues and expended relatively little effort on critically assessing the design problem from a 'usefulness' perspective, end users (i.e., ATCs) have forced the issue at certain points though those changes. As a result usability issues have been discovered through the involvement of end users in the design and development process has forced an (implicit) examination of the notion of 'usefulness'. This has, in turn, had an impact on the development. Despite this there are two reasons why this particular approach is not readily desirable. On the one hand, the lessons

learned must be considered in light of the cost of effort involved in making these discoveries. The early use of analytical investigation of the work domain using techniques such as cognitive task analysis (Rasmussen, 1986) or process-tracing (Woods & Hollnagel, 1987) would have revealed critical components of system usefulness at a considerably lower cost than has been the case. This is particularly true in light of the reformulation of design vision with the change from the AAS program to the URET development program. The second reason lies in that end users ought not be charged with the responsibility of providing this information. Practitioners within a field take expertise for granted and do not possess the necessary analytical distance required to bring this to light. As Karasti (2001) puts it, ‘...practitioners take the most fundamental aspects of their ordinary work practices for granted... It is not their task but the fieldworker’s to reveal and make visible aspects of work practice that practitioners cannot make explicit’. The analysis of complex, professional work requires considerable, second-order effort. This is what in the end will yield data and insight relevant to a given problem and domain (Graves & Nyce, 1992; Nyce & Löwgren, 1995). Because of this lack of analytical distance, the only way practitioners can assess usefulness is through use and the most manifest way this is displayed is when a mismatch occurs — situations that, if they manifest undesirable consequences, in hindsight often get labeled as 'human error'. It is interesting to note that this particular practitioner community appears to be sensitive to this issue, as expressed through various MoUs which grants immunity under certain conditions in which the URET/CCLD is used. In some sense, this is deferring the evaluation of 'usefulness' until a system has become fully developed and deployed. The above must be seen in the light of the manner in which system investment decisions are taken and the contractual and legal framework governing their design and development. While the AERA and AAS research programs were explorations into the feasibility (both from a technical and practical perspective) of new technology for ATC operations, it appears from this study that this method was short-cut for URET and URET/CCLD in order to reduce time to deployment. At the same time the URET concept differs in important ways from the preceding research knowledge base and, more importantly, was modified as the result of practitioner input during development. This situation is further complicated by the process required for systems acquisition, in which the incumbent party (in URET's case MITRE/CAASD) is barred from development and deployment of the operational system. While mechanisms exist to pass technical hardware and software requirements between the various parties at this junction, the mechanisms in place for the human factors do not seem to be as robust. 3.2 System evaluation and validation An integral part of the URET/CCLD effort has been system performance evaluation. This is reflected by the establishment of an organizational unit devoted to the development, collection, and analysis of system metrics. From a joint-cognitive systems perspective, this is an interesting and laudable step. The concern, from a CSE point of view, is not the practice of collecting

metrics as such, but rather what the metrics measure. The en-route ATC systems metrics serve a business purpose, rather than a technical, design, or human factors purpose:
[...] between '97 and '98 there was a big push to start putting out tools that focused on our customers. MITRE and NASA had both delivered tools that... by the people that were close to them, there was some concern that they were not ready for prime time. [...] we established a metrics team, that worked closely with the customers. [...] the metrics were established at the beginning of this timeframe when we were going to try to reproduce these two R&D prototype sites, Dallas and Indianapolis, and try to take these prototype sites and fan out to additional sites. So metrics were established with the customers in mind, since we were mainly [sic] customer metrics.
R15
'Customer' here refers to the FAA's customers, such as airlines, Airplane Owners and Pilots Association, National Business Aircraft Association, but also aircraft manufacturers (many of these organizations are represented through the RTCA). This is reflected in the kinds of concerns that existed during the development of the metrics:
What are the expectations of the customer? How do we measure that impact? How do we normalize [per] conditions? What are the things that are important? How do we look at adverse effects of metrics? In other words, if we’re doing something good at our primary center, how do we check that we’re not making things worse at the surrounding centers or at the surrounding airports? [...] The focus of our metrics were return on investment: direct routings for URET, better altitudes. Those save the users operating costs, quantifying the improvement to the business environment for the customers versus our cost to put the systems out. For TMA it was "are we improving fuel use on descent?" and "are we improving throughput at the runway?"
R15
The collection of metrics served the purpose of driving investments decisions:
And then we produced the results, and those results would be part of making the decision for a full-[out?] deployment... of the system.
R15
The metrics collected are quantitative, system-external metrics that measure overall system performance in terms of throughput, capacity, and cost (to operators). However, the metrics are also used, in part and indirectly, to calibrate and guide development efforts:
[...] we saw that the curve at a rate [of] four times the others [...] it was alarming... and what we found was, it was because they were having problems and were having to put things in twice... so the airspace in DC was written such that URET was choking on some of the messages from the HOST [...] there were changes that were made. [...] The way things really work, is I think the metrics help quantify what people feel. I mean, when controllers were using this, they see, like in Chicago, that it's not working, and we see in the data that

it's not working in certain sectors, and then we work out, [asking] is it a procedural thing? What enhancement would have to be [implemented] [...] and there have been some little tweaks in URET [...] the metrics maybe don't identify the problem, people feel the problem in using it and can see it, if they're experienced. What the metrics do is help quantify that... [They can] say that "this really is different", [or] "we really aren't getting this change".
R15
From a CSE perspective, this approach is interesting because, from one point of view, it takes a joint-cognitive systems view. System performance is considered as a whole and one could imagine replacing parts of the system while retaining many of the metrics as a (expensive) way of comparing one JCS to another. However, from a CSE perspective, this also represents a missed opportunity, because system-internal metrics do not appear to be collected. Issues such as work distribution across tasks, collaboration, coordination, and workload bottlenecking risk going unnoticed by the external metrics. As noted by Respondent 15, such issues are first discovered and raised by practitioners and subsequently double-checked in the system performance metrics to validate the claims. While this approach has been successfully used to modify the technical component of the system (as in the example above) there is an inherent risk that the external metrics will not show a proportional effect: this is because expert practitioners typically act as the 'glue' between technical components in order to make the system as a whole work (cf., "Laws that Govern Cognitive Work", Woods, 2002). The higher the skill of the practitioners, the more difficult it becomes to find such variations in the objective, external metrics, because the practitioners behind-the-scenes efforts limit the variation manifested at a system-wide level — often at a considerable internal workload expense. Such 'hidden' work has safety implications by stretching and stressing system resource availability, which in effect reduces the overall system's ability to manage uncertainty and variation. This can push a system towards its operational boundaries, reducing safety margins, and can act as a contributory factor to operational errors. This view is reflected in the types of evaluations that are conducted with each release of the software. There is a very extensive, detailed, and meticulously maintained program to ensure that software releases fulfill the technical specification and that their introduction into the larger network of (technical) systems does not adverse affect those existing systems. There is also extensive evaluation of the algorithms used to do conflict prediction.
So there are 2 major facets to this and one was [...] was the integration with the existing systems [to see] if there was [any] impact... because URET is considered a tool right, so one we had to ensure there is no impact [on] the HOST operations in the DSR operations. And the other objective of URET was to work as well as if not better as the MITRE prototype and that all the changes that needed to be done to do this integration and go on to the URET, the new URET CCLD hardware did not impact the algorithms and everything else that was used. So that it worked to do that, today’s program is is to bring focus on this current URET hardware that we are not impacting. We continue to do accuracy testing, we continue to as the systems evolving constantly and new functions brought in and everything else... that we still have this standard set of test that we ran back then and we continue to run [...] plus the testing of all the new functions and interfaces.
R11

Testing is done for each requirement in the specification:
[For example] American Airlines 423, modify altitude from 327 to 333. [Then we] check and make sure that [the] altitude has been updated to 333. So that’s an issue. I technically had about 600 high-level system function requirements and then about 3000 low-level software related requirements.
R12
While such low-level testing can, by definition, not take place until implementation, human factors evaluation of these en route ATC tools in terms of their impact on work organization is also taking place at the same time.
The simulation that we recently completed was a study investigating the colocation of the three controlled tools at the controllers workstation. URET, TMA and Data-link. [...] [This study was performed in 2003] when we completed data collection on this study with the controllers.
R4
The evaluation and testing of low-level software functionality can impact and delay deployment, but is unlikely to require major redesign of the system. By contrast, human factors evaluation that takes a JCS view, looking at how the proposed new technical system impacts working practices, workload distribution, collaboration, and coordination may reveal issues that may require such extensive rethinking of the design. In part, the reason for this lack appears to be the way in which the FAA approaches the entire issue of developing and deploying systems. As one respondent put it (in the interest of guaranteeing the anonymity of this respondent, the identifier has been removed completely):
I read your two page summary and it implied a rational decision making process with proactive planning and that is an idealized belief [...] We were kidding each other the other day that the FAA rather than define mission lead statements, functional requirements, or desired requirements generally goes out and buys equipment and tries to field it without adequate development [...] even though most [involved] in the acquisition [process] seems to realize for our particular population this does not work. [...] One of the best examples was STARS [...] which built a system which was essentially built for their designers. Our air traffic controllers took one look at it and it scared the hell out of them.
The human factors organization within the FAA is chiefly a research organization and not involved with acquisitions or deployment, outside of the Office of the Chief Scientist for Human Factors (AR100):
They [AR100] fund our research work but they won’t fund our acquisition support work. That comes through AUA, ATV, AND: various organizations that decide they want us to work with them.
R1
Interviewer: What kind of work does that involve?

R1: It can involve anything from the full person in-the-loop simulation, the much smaller levels of consulting, prototyping, prototyping to specification, creation of design requirements or what we call thin specs which is essentially a prototyping documentation behind it are often done in conjunction with subject matter expertise and that documents the efforts as interactive relationship with subject matter experts of my researchers.
While many of these concerns may be addressed through the use of human factors standards, this is complicated by a lack of such standards:
Well an organization can choose to use any standard they wish. If they are, for example, going to write specification for a contract than they can use [a design guide developed by the human factors research lab that have been declared a standard by its funders] as a standard if they wish.
R1
In essence, it appears that the much of what would be considered fundamental human factors considerations in reality are either optional or relatively weakly supported. In practice, during projects facing time and resource pressures, this renders them less useful to those involved in, particularly, systems acquisition. Rather than act as a safe-guard, aid, and quality assurance tool during systems definition and acquisition, this lack of tools, guidelines, and standards for human factors risks pushing core CSE issues towards becoming empty paper-only requirements which have no lasting or fundamental impact on system design. 4 Conclusions By many measures URET/CCLD is a success story and is hailed as such among the overwhelming majority of those interviewed. As such there is a certain measure of reluctance to discuss what could be perceived as problems and instead a desire to focus on the successful lessons learned during the project. These include a new way of designing and deploying systems organized around cross-disciplinary teams, evolutionary build-test-modify-deploy cycles, and constant system monitoring through an extensive program of metrics collection and analysis. These are valuable lessons and reflect the considerable challenge and achievement of introducing such novel working practices into the extraordinary complex world of developing and deploying en-route ATC systems. There is also an opportunity for additional learning. As outlined above, the issue of design problem appears to have been largely equated to the issue of "technical problem". The focus was largely on how to build the system, not on what system to build. The issue of whether strategic planning forms part of ATC work or, if it constitutes a new function, how it integrates with and affects existing work appears to have been largely a non-issue beyond the definition of procedures for operating the interface. This is carried through during the URET training that we observed, which focussed solely on how to manipulate the tool and leaves the issue of its integration into existing working practices unanswered. It is reflected in the testing procedures which almost exclusively focus on constructional quality: software metrics such as robustness, correctness to specification, and technical integration with existing systems. It is further reflected

in how those potentially most concerned with 'usefulness' of the technology at the 'sharp end' (i.e., the air traffic controllers) have negotiated into place mechanisms to defer the assessment of 'usefulness' until the tools have been fully operationally deployed and to mitigate any adverse side effects those tools may introduce. Many of the activities of a JCS-oriented approach are already in place, but these would benefit from a clear focus that separates these from classic systems engineering practices. Doing so would ensure that such an explicit focus can be maintained throughout the design, development, and deployment of new systems. As it stands the JCS view risks becoming lost: while ensuring that none of the little details are overlooked, responsibility and authority for the overall guiding vision and fundamental human factors concerns are at times unclear. Experience from this study shows that there is a tremendous amount of skill and competence with regard to how to build very complex systems within the FAA. There are well documented, rigorous, and detailed techniques and suites of tools to support the processes of how to build these complex systems. What this interview study and the observational study of URET/CCLD training and use together suggest, is that there is also a need for well documented, rigorous, and detailed techniques for determining what to build. Such techniques and methods need to go beyond 'common sense' approaches to determining what constitutes a useful system, by making explicit the expertise of practitioners. In specific terms, the conclusions are:
(a) The systems design and deployment process would benefit from CSE-based tools and methods that provide a framework for a JCS-oriented approach to systems design and evaluation; (b) Such tools and methods need to be sensitive to lessons learned within the research fields of cognitive systems engineering and an ecological approach to cognitive systems. (c) Such tools and methods need to be developed in a manner consistent with and integrated into the existing R&D cycle for new systems within the FAA. (d) Such tools, if used early in the design process, have the potential to reduce redesign and development costs at later stages.
Point (c) is a commentary of the usefulness of design and development tools themselves: just as practitioners are immersed within a domain, so are designers. Appendix 2: References Andersson, R. (1994). "Representation and requirements: The value of ethnography in system
design", Human-Computer Interaction, vol 9, pp. 151-182.

Flach, J., Hancock, P., Caird, J., & Vicente, K. (Eds.). (1995). An ecological approach to human machine systems. Lawrence Erlbaum.
Flach, J. M. (2000). "An ecological approach to human-machine systems". In Proc. IEA 2000/HFES 2000 Congress.
Gibson, J. J. (1966). The senses considered as a perceptual system. Boston, MA: Houghton Mifflin.
Gibson, J. J. (1979). The ecological approach to visual perception. Boston, MA: Houghton Mifflin.
Hollnagel, E. & Woods, D. D. (1986). "Cognitive Systems Engineering: New wine in new bottles". Int. J. of Man-Machine Studies, 18, 583-600.
Howard, M. V. & Woods, D. D. (2002). "Design as Storytelling: An ecological approach to engineering design". In M. V. Howard, Usefulness in Representation Design, doctoral dissertation no. 753, Linköping, Sweden: Linköping Institute of Technology.
Karasti, H. (2001). Increasing sensitivity towards everyday work practice in system design. Unpublished dissertation no. A 362, University of Oulu, Department of Information Processing, Oulu.
Nyce, J. M. (2000). "Argument, assumption, and representation in C2: A critical agenda for ROLF". In C. Sundin and H. Friman (eds.), ROLF 2010: The way ahead and the first step. Stockholm: National Defense College.
Nyce, J. M. & Löwgren, J. (1995). "Toward foundational analysis in human-computer interaction". In P. J. Thomas (ed.), The Social and Interactional Dimensions of Human-Computer Interfaces. Cambridge, UK: Cambridge University Press.
Nyce, J. M. & Bader, G. (2002). "On foundational categories in software development practice". In C. Floyd, Y. Dittrich, and R. Klischewski (eds.), Social Thinking - Social Practice. Cambridge, MA: MIT Press.
Rasmussen, J. (1986). Information processing and human-machine interaction. New York: North Holland.
Reason, J. (1990). Human error. Cambridge, UK: Cambridge University Press.
Woods, D. D. (1998). "Commentary: Design are hypotheses about how artifacts shape cognition and collaboration". Ergonomics, 41(2), 169-173.
Woods, D. D. & Dekker, S. W. A. (2000). "Anticipating the effects of technological change: A new era of dynamics for Human Factors". Theoretical Issues in Ergonomics Science, 1(3),

272-282.
Woods, D. D. (2002). "Laws that Govern Cognitive Work", Flash-based electronic media pamphelet, URL: http://csel.eng.ohio-state.edu/productions/laws/

Draft URET ACL Report 3/1/03
Appendix 3: Examination of the use of the URET Graphical User Interface & AirCraft List as a strip replacement
A3.1 Introduction............................................................................................................................. 1 2 URET ACL GUI: Functions as a Human Computer Interface ............................................... 2
2.1 Overview......................................................................................................................... 2 2.1.1 Interaction ............................................................................................................... 3 2.1.2 Information Coding................................................................................................. 4 2.1.3 Information Presentation......................................................................................... 6
3 URET ACL GUI: Function as a strip replacement................................................................. 6 3.1 Current Use of Flight Progress Strips: ............................................................................ 6
3.1.1 Properties of FPS vs. EFPS..................................................................................... 7 3.1.2 Coordination and Work Organization..................................................................... 8 3.1.3 Towards flexible representations ............................................................................ 9 3.1.4 Economy of cognitive resources........................................................................... 10
4 Summary of Issue and Suggestions for Future Research...................................................... 11 4.1 Basic Functionality ....................................................................................................... 11 4.2 Expanded Functionality ................................................................................................ 12 4.3 Suggested Approach ..................................................................................................... 12
5 References............................................................................................................................. 14 Appendix 3B: Paper Versus Electronic Strips. ............................................................................. 16
A.3.1 Introduction
In this analysis we concentrate on an interface element, the Aircraft List (ACL), of the User Request Evaluation Tool (URET) presently undergoing national deployment as part of the FAA’s Free Flight Phase One plan. We have reviewed operational error reports with URET named as one of the contributory elements in the error chain, research literature relevant to the use of flight progress strips, have undergone URET training and made some limited observation of the use of URET with specific attention to the ACL. We make observations and assessment in two of three levels of description of the ACL, thus:
1. Analysis of the graphical user interface (GUI) of the ACL: This is an analysis of the skin of the interface with respect to principles and practice of human computer interaction. The simple question being probed is “Does the interface function in ways that support the work to be performed?”
2. Analysis of the use of the ACL from the perspective of a strip replacement: This analysis focuses on the use of strips, the history of their electronic replacement and comments on the ACL as an “electronic strip replacement”.
3. Analysis and design recommendation of the URET GUI from the broader perspective of the work of air traffic management, traffic flow and safe, efficient and orderly control of air traffic. This broader perspective will not be reported here as it waits on our completing a broad set of field observations, and then synthesis of these

Draft URET ACL Report 3/1/03
observations to design recommendations.
This report provides our analyses to his point. We will, in the next three months, undertake a more extensive field analysis and supplement this report.
A.3.2 URET ACL GUI: Functions as a Human Computer Interface
This report is the result of an analytical evaluation of the URET/CCLD ACL GUI. The technique used was a cognitive walkthrough, based upon the author having participated in and completed the computer-based instruction (CBI) program that air traffic controllers go through as part of their introduction to the URET/CCLD system (here forth only referred to as URET).
A “cognitive walkthrough” is a technique used by researchers in the analysis of a prototype interface, or functional analysis scenarios based on an operational concept or specific technology under study (cf. Polson, Lewis, Rieman, J. and Wharton, C., 1992). The system is systematically analyzed through several levels of abstraction with specific reference to the information pathways, decision requirements, authority and responsibility interactions among the cognitive agents in the system. This systematic analysis is conducted among designers, regulators and practitioners for foreseeable normal and off-nominal operations of the system. The process supports cognitive task design decision early in the development of system concepts and prototypes.
This evaluation is concerned with issues directly concerning the UI. Issues of information presentation, interaction, and access to functionality have been considered, but larger issues of the context of work are as noted above withheld until further field studies can be conducted.
This analysis provides input primarily on URET Build 1, however we have had some exposure through practical exercises with URET in the dynamic simulator used Build 2. Where differences between these systems are relevant for the purposes of this evaluation, they will be noted in this report.
A.3.1.1 Overview
We will provide a brief summary of the URET interface to support the comments and analyses that follow. URET uses a windows-icons-mouse-pulldown menus (WIMP) interface metaphor (Verplank, 1988). The user controls an on-screen mouse pointer with a three-button trackball. The buttons are referred to as the left, middle, and right buttons. On the whole, placing the pointer over an object in the interface and clicking one of the buttons accomplishes the following actions:
• Left: Selection • Middle: Special • Right: Delete
The system is loosely based upon the X Window System's Motif window manager. However, with the exception of the menus attached to the window borders themselves (for resizing, moving, maximizing, minimizing, lowering, raising, and restoring windows) menus are not used

Draft URET ACL Report 3/1/03
in the URET.
At the top (or, if relocated by the operator, at the bottom) of the screen is a blue bar containing special function buttons which act as quick-selectors for the various windows in the system. From this, the aircraft list (ACL), departure list (DEP), graphic plan display (GPD), message windows, and system status windows are accessible. This navigation bar also contains the current time and the sector number to which the URET system is attached.
A.3.1.1.1 Interaction
A.3.1.1.1.1 Navigation Along the top of each window, inside the window border, are a number of “buttons”. These are flat, two-dimensional, white, rectangles with labels inside them. When the pointer is placed over a button, the button is highlighted to indicate that it is selectable. Non-selectable options are dimmed and do not react when the pointer is placed over them.
Button labels come in two flavors: Buttons which immediately take some action upon being clicked are labeled with just a name, as in [ Text ]. Buttons which, when clicked, pop up another window are labeled with a name and an ellipses, as in [ Text...].
Most of these buttons have the logical function that menus have in a correctly implemented WIMP interface. Clicking them brings up another window containing further options. However, in URET these are located in a separate window which is disconnected from the button (i.e., menu-title) which instantiated it. This disconnect violates principles of HCI design and is known to introduce visual search time and load in task performance (Card, 1982).
In Build 1, this menu window typically pop up on the opposite side of the screen, making the disconnect between menu button and menu options even greater. In Build 2, the new window containing the menu options is in the proximity of the button that triggered its instantiation, but it is still a separate window.
This breaks with the WIMP menu conventions that ATCs are used to (we assume they are used to Macintosh, Linux, or Windows systems from office and personal use) and thus requires the operator to remember the particular characteristics of the URET interface as different from those more commonly used. In addition, because of the greater size of windows compared to ordinary pull-down menus, they require greater amount of screen space, greater mouse pointer movements to access, and occlude greater amounts of information.
This accession process is further complicated by the fact that some options in the pop-up menu window are themselves ones with ellipses and thus lead to another window. For example, selecting the [ Map Options...] menu in the GPD brings up a small window with two options. Clicking on either of these brings up a new window (overlaying the GPD) in which display options for the GPD can be set. However, the small window brought up in step one also remains on the screen, which would not be the case with an ordinary WIMP menu.
A.3.1.1.1.2 Trackball button usage Consistency of function, metaphor, structure, etc. in an interface is universally cited as a key

Draft URET ACL Report 3/1/03
design guideline for successful use of the interface (Shneiderman, 1998). However, the mapping between trackball buttons and their assigned functions is inconsistent and, worse, changes without any notification to the user. The case where this has the most serious potential consequences is the remapping of the right trackball button.
Right-clicking on something in the interface is used to remove it. However, there is inconsistency in this mapping. While right-clicking on an aircraft identifier in the ACL (or departure list, or trial plans list) will remove the entry from the list altogether, right-clicking on a yellow altitude field (i.e., an IAFDOF warning) within an ACL entry will remove the yellow color coding but leave the ACL entry in the list.
When the mouse cursor is in the “special” box in an ACL entry, right-clicking it will highlight the entire list entry. A second right-click in the same place removes the highlighting. This is the only time the right mouse button is not used to remove or delete something.
1.1.1.1 No drag-and-drop Entries in the ACL (or departure list) can be posted into the special attention area. Once in this area, entries are not sorted, regardless of whether an automatic or manual posting mode has been selected for the rest of the list. Because of the lack of drag-and-drop interaction, moving entries around in the special attention area requires a convoluted sequence of clicking small caret symbols (^) positioned after the aircraft identifier in each list entry, positioning a target line (using the cursor) between two entries where you wish to move your list entry, and then clicking another caret symbol to conclude the operation (while remembering whether to click the caret symbol of the one above or below the intended new location).
As a result, few list entries are ever moved in the special attention area, once placed there. This also reduces the usefulness of the special attention area, since one of its benefits (as seen by controllers) is that automatic sorting never affects this area — and thus any order created by the controller is preserved. We will discuss the use of sorting and arrangement of strips in part 2 of this report on “strip replacement”.
1.1.2 Information Coding The coding of information in the URET UI has several significant design shortcomings. Some of these are more obvious, while others are subtle, but still, in our opinion, important to the effectiveness of the interface.
1.1.2.1 Propositional brightness coding Brightness coding is used propositionally in the URET UI. This is to say that brightness of a specific hue in itself contains information that conditions its interpretation. Brightness coding is something that should probably be avoided in general. It is subject to a significant variation in interpretation dependent on the specific display characteristics, the ambient lighting and the use of the coding as absolute or relative to other hues at different levels of brightness (Nagy, and Sanchez, 1992; Narborough–Hall, C. S. (1985). Using brightness to distinguish between semantic categories is particularly problematic and was specifically called out in operational

Draft URET ACL Report 3/1/03
error reports examined. In URET, red and yellow alerts also have “muted” counterparts, muted red, or muted yellow. The muted alerts signify that the alert condition will be met during an altitude change of one or more of the involved aircraft.
Brightness coding works when the frame of reference is given (i.e., when the full scale of brightness is always visible) and when the judgments are relative (i.e., “the same” or “not the same”, or “more” or “less”). In URET, it is essentially impossible to tell whether an alert is a red or muted red alert (or yellow or muted yellow) unless both alert types are visible at the same time. Since this is not always the case, this information is essentially perceptually unavailable without the controller resorting to calling up the GPD and looking at the flight path for maneuver start points (MSP) and maneuver end points (MEP) on the flight track.
1.1.2.2 Propositional color coding Another information coding problem lies in the use of color. Not counting the muted variants, there are three main types of alert: red, yellow, and blue (although technically this is closer to cyan) (Macbeth, 2001). Because of the color technology of displays (using additive color technology), the perceptual salience of “pure” colors is different. The color red is represented by only red light (sub-pixels, or electrons hitting phosphors), while the color yellow requires both red and green light. As a result, the true brightness (in terms of perceptual salience) of yellow pixels on the screen is higher than that of red pixels.
In practical terms for the URET UI this translates into the alert coded yellow and blue (actually cyan, which is made up of green and blue light) are substantially easier to see and capture attention to a much greater degree than do the red alerts. Which, of course, is entirely counter to their priority in terms of actual conflicts. It is worsened by the black background which serves to emphasize the differences in brightness, making the yellow and cyan stand out even more.
1.1.2.3 “Flat” visual hierarchy In the URET UI, there is no layering of information. Neither color, transparency, nor alpha channels are used, though this is recommended design practice (Bier, Stone, Fishkin, Buston, and Baudel, 1994). This results in a display in which information is either occluded by overlaying objects, too much information is squeezed into a small screen space, or different structures are not visually distinguishable from each other.
An example of this is the GPD. The Map Options allows the user to control which map features to display, such as sector boundaries (low, high, ultrahigh), restricted airspace, fixes, jetways, Victor airways, and more. Each of these are drawn on the map with solid white pixels. Some differential coding is used (dashed lines, double thickness lines) but on the whole, it is essentially impossible to view all (or even more than two or three) map features at the same time while preserving the information structure. The only information layering that takes place on the GPD is that flight paths for selected flights appear in color (green, cyan, yellow, or red, depending upon alert status).

Draft URET ACL Report 3/1/03
1.1.3 Information Presentation In addition to the low level information coding issues presented above, there are a number of issues with regard to how information is (or is not) presented in URET.
1.1.3.1 Heading/Speed column It is unclear what value the Heading/Speed column has in the ACL. Its intended use is never pointed out during the CBIs. All information in this column has to be entered manually, which is odd, since the URET software must already have access to this information in order for it to make the trajectory forecasts it does. Because of the added work of having enter this information manually (and, continually update it if it is to be useful) all controllers we observed using URET collapsed this column to a three-character wide blank space.
1.1.3.2 Conflict notification As the primary URET display, the recommended practice is to keep the ACL always present on the screen and indeed to have it fill the screen. Thus when other windows are brought up, the ACL is still present, although below the smaller, overlying windows. Aircraft to aircraft conflict type is shown in the ACL (red and yellow alerts). Alert information for an entry includes the number of conflicts (coded numerically), whether they take place during altitude change (brightness coding), and whether they are in an adjacent sector (presence of a '+' sign) or not (absence of same). There is nothing in the alert information on the ACL which shows which aircraft are in conflict with each other. To get this, the GPD must be called up. This issue of which aircraft are in conflict and how readily that information is available is revisited in section 2 on strip replacement.
2 URET ACL GUI: Function as a strip replacement
This portion of our report presents is an attempt at an overview and classification of studies conducted concerned with the work of air traffic controllers in the use of strips. These studies do not restrict themselves to the mere usage of strips, but usually relate current strip functionality to how they can be replaced by an electronic counterpart. In doing so they typically adopt a view of assessing the functions that current strips provide and explore whether and how all those functions can be represented in the electronic equivalent of the strips. A number these studies have been looked at and then classified with regard to cognitive themes — both those explicitly and implicitly present in the papers. As such, it forms part of a “gap analysis” of the research on ATC work (particularly with regard to electronic flight strips for en-route controllers).
2.1 Current Use of Flight Progress Strips:
In an recent survey and review study Durso and Manning, (2002) identify three primary categories for the use of strips:
1. As a reference to flight information (especially route information). 2. Annotating actions concerning a flight. 3. Ordering/placement. Ordering of strips to provide some representation of traffic, or
placement—e.g. slanted- to highlight a particular strip.

Draft URET ACL Report 3/1/03
These functions thus seem to provide support for a large part of the scope of air traffic controller work. But to what extent they really are central to performing the tasks of air traffic control is not self evident. The Durso and Manning (2002) review study tries to shed some light on this matter. The study — partly reported before in Vortac, Edwards, Jones, Manning and Rotter (1992) and Vortac, Edwards and Manning (1994) — examined the importance of strips to controllers, and discusses some issues related to trying to computerize flight progress strips. A summary of this study is found in Appendix A, while here we will summarize the research and apply it to the ACL operation.
2.1.1 Properties of FPS vs. EFPS Durso and Manning (2002) have provided information about the use of strips and controller culture around their use. The research suggests that strips serve several functions (elaborated below) of information management and team coordination. However, the research also indicated that air traffic management (studied under nominal conditions) is not adversely affected by reduction of the strips’ size, mobility, or in fact, removal. Care must be taken in interpretation of these results given the fairly benign conditions under which the studies were performed. However, the data lend evidence to an assertion that paper strips per se are not absolutely required in air traffic management practice. The question then is what techniques might be used to provide the information management and coordinative functions the strips are known to provide.
The flight progress information on a strip is a record of the intentions of a particular aircraft. This information provides the controller with an estimate of what they can expect to happen within the next approximately twenty minutes. Once the strip is being used, through notation and placement, it also becomes a record of what has happened in the sector. This annotation — e.g. circling salient bits of information — can serve as an attention getter, aiding the controller’s memory about certain past or pending actions. Another role of annotation can be to keep track of inter-sector coordination. For instance by marking a new ETA over a sector entry fix, a controller keeps track of the interaction they has had with other sectors, and their implications for their work. Strips thus have a dual role of providing information about both the past and the future, aiding the controller in planning subsequent actions. Or as Hughes, Randall and Shapiro (1993) put it: “All these various bits of information add responsibility and accountability to the strips, making them a public document; a working representation of an aircraft’s control history and a work site of controlling”
Another cited benefit of strips is there flexibility. Even though large parts of the air traffic control system are highly proceduralized — e.g. pilot-to-controller communications, strip annotation, etc- strip provide a means of personalizing the information. This is one of the key assets of paper strips, that their use is highly adaptive to personal style of the controller. For instance, controllers can group the strips in clusters of aircraft related to the various fixes. Within these clusters they could then make further distinctions between the aircraft by placing the strips along a timeline of when they are supposed to be over that particular fix. The benefit of strips is that not every controller has to work according to this principle. Another controller could use a complete different set of rules to structure the information. By clustering strips into meaningful

Draft URET ACL Report 3/1/03
groups, controllers can put a structure onto the information that allows them to easily link the patterns of information in front of them to their mental representation of traffic. This allows them to see the information in a sequential way that matched sequential nature of traffic flow through a portion of airspace.
A study performed by Hughes, Randall and Shapiro (1993) also looks into the process of trying to provide flight progress information in an electronic form, but from a different perspective than Durso and Manning (2002). They use ethnographic methods to inform the design of a strip replacement system. In their approach they advocate that any electronic version of flight progress information is not a one-to-one copy of the old system. By providing controllers with a new way of interacting with information, one provides them with new ways and constraints of accessing the information. Consequently, designing a new system is not trying to map the functions of the legacy system in the new system, but judge what these new ways and constraints of interaction will be. Such an assessment will give deeper understanding of the future use of the system. The way in which Hughes, Randall and Shapiro (1993) try to accomplish this is not by analyzing the properties of the legacy system, but by exploring the work that controllers do and see how flight progress information (note how this is not focused on just strips) is used to support this work.
2.1.2 Coordination and Work Organization A number of strip replacement studies have examined flight progress strips from the point of view of how work is coordinated and organized around strip usage. One of the central actions regarding strip usage is writing on strips. Writing on strips is very often combined with some manipulation of the strip, e.g. offsetting it to remember to check whether a pilot has conformed to a certain clearance. Writing usually has clear precursors, like a new aircraft entering the sector, or controllers issuing a command to pilots. The updating of strips, through writing on them, frequently occurs in concentrated blocks, in which multiple writing actions are performed.
It has been shown that, on average, a controller makes about 26 markings on strips per minute (Durso, Batsakes, Crutchfield, Braden and Manning, 2001). Some type of markings are however more frequent than others. They also vary in how important controllers deem such markings for their work. Annotating clearances on strips has a high frequency and is regarded as very important by controllers, coordinated clearances also believed to be important, but occur much less frequent. The type of marking that is deemed of lowest importance is a planned clearance, and they are also very infrequent. In total 84% of all controllers said that marking strips is very important for adding the following functions:
• Memory • Communication • Organization • Workload reduction
Of these memory and communication related marking occur most often.
Berndtsson & Normark (1999) examined the coordinative function of FPSs across individuals.

Draft URET ACL Report 3/1/03
Their study of a closed-circuit TV system at use in Copenhagen Airport suggested that the planned introduction of a computerized and increasingly automated system (scheduled for 2003 at the time of their writing the paper) could be possible if the coordinative functions of the existing system were carried through in the new computerized system.
They noted that the coordination functions were used chiefly to support controllers who were working “downstream” from any given position. They recommended:
A new system therefore has to support the controllers need to align their work to what others have done—distributing appropriate information regarding the changing state of the colleagues' work to the right recipients.
However, it should be noted that rather than “push” this information to the right recipients, often it is a case of making the information available to be “pulled” by the recipients. Their second recommendation regards the preservation of at-a-glance information display and peripheral awareness, which are noted strategies employed by controllers to monitor the state of work. Their third recommendation is the provision of targeted messages to specific viewers of a given channel. Their final recommendation deals with the balance between “push” and “pull” messages, or the intrusiveness of the system.
Others have been interested in these peripheral information aspects of strip usage. The work by Mackay et. al. (1998) set out to explore the design space for augmented reality FPS replacements. They concentrated on three problems: that of capturing information on the strips, how to track the location of the strips, and how to present information onto the strips. Using video, touch-sensitive technology, and a strip board that sensed individual strip placement based upon electrically coded identities, they also explored — through controller participation — what they characterize as the “media space”: the sliding scale between peripheral and focused awareness. Their conclusions are that the strips play a role beyond the informational value written on them (suggesting the idea that strip placement, and the method in which strips are handed off between controllers do not constitute “informational” value) and these coordinative functions are at risk from efforts to replace physical strips with automated systems.
Thus strips also have communicative and coordinative functions in addition to the information printed upon them (MacKay, 1999). A way in which this becomes obvious is when a controller places a strip in the visual field of another controller to indicate some necessary action. Another way strips are used for communication is when a “fresh” controller comes onto a sector. Very often experienced controllers update strips, until shortly before they are going to be replaced. At that point they annotate the strips to reflect the current situation in the sector.
2.1.3 Towards flexible representations While a substantive amount of research has looked at flight strip usage with an eye towards electronic strip replacements (i.e., what would electronic flight strips look like and how would you use them) others have argued that the issue that should be looked into is not so much of representing the functionality of paper strips in an electronic version, but how to effectively capture flight data in an electronic form.

Draft URET ACL Report 3/1/03
Hopkin (1995) points out that representing flight information in tabular form requires cognitive effort to integrate. This integration is over multiple mediums: paper strips, PVD, etc. The challenge is to integrate all different kinds of information into a single practical format.
“Air traffic control can be viewed as a collaborative activity in which strips are an embodiment of the working division of labor.”
Considering the opportunities afforded by modern information processing equipment opens for the possibility of information continuums, in which the representation of flight information has the ability to change in granularity depending upon what the controllers’ interests and tasks are at any given point in time. As pointed out by Marsden and Krois (1997):
“The ODID principle of displaying minimum information and accessing supplementary information on request co-located on the radar display, demonstrated an efficient approach that could eventually replace paper strips.”
Gronlund et. al. (2002) developed a tool for ATC en-route controllers. Controllers were divided up into teams of two, each team consisting of a planner and a tactician (the implementer of a plan). The planner had to communicate the plan to the tactician verbally.
The tool created a sequencing of aircraft, based upon time to a fix. Unlike URET, no optimization was involved (it appears to have been a visualization tool more than anything else). Evaluation looked at workload (NASA-TLX assessment) and concluded that there was a beneficial reduction in workload for the tactician.
In addition to this, they found a tradeoff between more detailed plans and performance. As plan complexity increased, performance suffered. The authors suggest that the more detailed plans result in cognitive rigidity (although they do not define this term) and thus poorer performance. If we interpret “cognitive rigidity” to mean a reduction in the ability to dynamically and actively distribute cognition across agents and artifacts, then this would also lend support to the idea that practitioners manage constraints in an ecology at least partly through active and continuous redistribution of cognitive effort.
2.1.4 Economy of cognitive resources Bressolle’s et. al. study of ATCs use of the ERATO decision support system noted that controllers complemented traffic pattern cues in the state information presented to them, with knowledge gained through experience to make complex assessments regarding the future state of the traffic flow. One key to understanding this “default knowledge” (their term) appears to lie in its level of abstraction: it was grounded in, but abstracted from, real world traffic patterns. As such, the researchers discovered that the ERATO decision support tool needed to present information that bridged this “abstraction gap”. Particularly noteworthy is the support for a continuum of interaction: the initial interactions provide more abstract, overview information, while continued interaction with the system provides more detailed information — and thus a mechanism for controllers to use the ERATO tool as a “hypotheses” testing or “what-if” exploration tool — enabling controllers to calibrate their knowledge of the current situation.
Draft URET ACL Report 3/1/03
Their conclusions sums things up nicely:
Data collected about the use of the ERATO tool showed different strategies in the way controllers use it. Further detailed analysis highlighted that these strategies revealed an economy of cognitive resources, tending to minimize data acquisition or input into the system.
A cognitive perspective has showed that default knowledge is a way to achieve this economy, and allows the controller to perform a cognitive tradeoff. The principles and examples given illustrate how widespread the usage of this default knowledge can be and the fact that it can cover almost all aspects of the task. It also gives clues as to how some errors occur, which are the fallout of this default reasoning at work.
Similar findings are echoed in other studies. Halversson (1994) studied ATCs use of technology as part of the Center TRACON Automation System (CTAS), specifically the Final Approach Spacing Tool (FAST). She applied the theoretical framework of distributed cognition in an in situ observation study of ATC work.
Her analysis of the hand-off procedure led her to the discovery that the cursor was used as an in-the-world representation of where in the scan pattern the controllers’ attention was focused as they worked their way back sequentially through the list of aircraft towards the last aircraft (the one that needed to be accepted). In particular, the cursor could be left at a position on the screen during interruptions to provide a quick visual bookmark of where in the sequence the controller was upon returning.
This can be seen as support for the hypotheses that a cognitive system will find cognitively economic strategies for dealing with a task by actively distributing task and representations across agents and artifacts (c.f. Howard, Woods, & Dekker, submitted) and that this—in turn—can lead to unexpected use of technology in ways which designers never imagined (presumably because they didn't have a sufficiently detailed understanding of the ecology of the domain).
3 Summary of Issues and Suggestions for Future Research
3.1 Basic Functionality
As cited above the controllers use strips (and consequently rely on the ACL as a strip replacement) to provide:
• A reference to flight information (especially route information). The elimination of time over fix in the ACL has been noted as diminishing this support function, even though the information is available elsewhere and supported through conflict alerting.
• Annotating actions concerning a flight. Annotation by moving flights to special access area is possible but as noted difficult to perform. The lack of use of the alt/spad sections of the ACL also speak to a reduction of support in this function. There is still some controversy about the relative ease of entry

Draft URET ACL Report 3/1/03
through keyboard vs. handwriting. Despite that, there is no doubt that asking the controllers to maintain flight update by both methods is a non-starter. The accuracy of updating the flight plan to the host then affects the accuracy of the URET conflict predictions. This tight coupling (which did not occur in the standard HOST update process) along with the removal of information that allows the controller quick visual reference to future conflict places a premium on data entry, and this changes the relative priority of this task. This also raises an issue of procedural definition for updates to host for URET operations, and for configuration of the ACL in two person teams.
• Ordering and placement. Ordering of strips to provide some representation of traffic, or placement — e.g. slanted — to highlight a particular strip. Here the lack of drag and drop capability significantly inhibits controller manual control of the strips and reduced their utility in coordination. The difficulty also encourages the use of auto sort functions based on sorting schemes chosen by the controller. The auto sort process has been noted in the operational error reports associated with URET to cause confusion, increase visual search and to decrease situation awareness.
3.2 Expanded Functionality
In addition to the current use of ACL (“the primary URET interface”) as a strip replacement, there are plans to extend its use to include controller-pilot data link communications (CPDLC), to support resolution advisory as well as traffic conflict (PARR) and to provide an indication of weather conditions in relation to the filed routes for flights. In light of the issues raised in Section 1 of this report on the GUI of the ACL, we feel that significant analysis and some empirical work are needed to determine whether the ACL as currently provided (including those updates in Build 2) can support these additional functions without incurring cost. Specifically, 48% of operational error ascribed to URET CCLD was associated with visual search. The addition of more fields and columns of information as triggers for information seeking (clicking and expanding) by the controller does not seem likely to help the visual search problem. Further the palette of color-coding is rapidly meeting discriminability and recognizability constraints.
3.3 Suggested Approach
Given the themes of previous studies, we can begin to discern what would be a fruitful direction in which to develop the URET/CCLD ACL. One of the major pitfalls would appear to be building a rigid system that does not allow flexible, dynamic reconfiguration of work effort across multiple controllers in response to contextual demands. Expressed differently, a successful system would be one that works as well for a single controller working the PVD, using the ACL as a replacement for paper flight progress strips to keep track of current traffic, while also supporting a controller team consisting of separate R-side and D-side controllers, in which case the ACL (and URET) would perform much more in a planning and strategic capacity. Clearly, the distribution of cognitive effort is vastly different in these two cases, yet URET would need to be able to accommodate both of these frequently occurring situations—without

Draft URET ACL Report 3/1/03
major reconfiguration.
In addition to such a flexible representation (i.e., one that supports economy of cognitive resources) previous studies suggest that an electronic replacement of paper flight progress strips should possess two other characteristics:
• The main display should provide high-level information that acts as a pattern display. As such, it would provide queues to learned traffic patterns, a rapidly accessible indication of known situation types, and trend information.
• Lower-level, more detailed information should be able to be called up from the main display in such a manner that the information on the main display is not lost. In other words, subsequent queries to the system should not loose the information context in which the queries are placed.
With regard to the ACL in URET, the current implementation embodies some of these desirable characteristics (for example, overview route information is provided and more detailed [complete] information can be called up if necessary without loosing the overview). However, there appears to have been no clear philosophy behind the URET ACL and, as a result, there are many inconsistencies in the interface. Proposed additions to the ACL (e.g., weather information) appear to continue this somewhat haphazard development, apparently driven more by technological capability than by any coherent vision or researched information need on the behalf of air traffic controllers. There is a substantial risk that pursuing such a development effort will lead to a cognitively cumbersome and inflexible system that remains largely unused, because the high-stakes, dynamic, event-driven world of air traffic control cannot accommodate the cognitively expensive strategies that such systems impose on practitioners (cf. Casey, 1993; Landauer, 1995; Beyer & Holtzblatt, 1998).
In particular, careful thought needs to be given to the balance between automated functionality on the one hand and information presentation on the other hand. If the desire is to keep controllers “in the loop” and to provide URET as a decision support tool (rather than as a decision making system) then it needs to be designed in such a manner that the decision making authority of controllers is not undermined, but rather enhanced.
These characteristics suggest that some future research directions that ought to yield interesting and informative results, with regard to both research and design efforts, include the following:
1. Decomposition of the concept of traffic ‘flow’ both with regard to its operationalized components (and thus metrics) and to its linguistic, social, and representational components.
2. A description of how cognitive work is actively managed and distributed across agents and artifacts to manage ‘flow’. If possible, the establishment of appropriate quality metrics for this process should be supported
3. Identifying a suitable theoretical framework for explaining how cognitive work is distributed across agents and artifacts. Such a framework must be able to account for the previous point, but also be applicable across domains (the

Draft URET ACL Report 3/1/03
proposed theoretical framework of distributed cognition would appear to be a suitable starting place).
4. Design of new cognitive agents or artifacts that successfully participate in the management of flow (i.e., with regard to the metrics established in step 1), such that an evaluation with regard to the previously established quality metrics (step 2) shows that the process is not impaired (or even improved).
A successful such research program would have to provide descriptions of a domain at a number of different levels of abstraction:
A description of a cognitive ecology. This addresses issues such as the domain functional goals, the constraints on perception and action (i.e., the situated meaning), and the tasks and activities performed (Flach, 2000). A good description would provide correct answers to questions regarding what can be done, what cannot be done, and how (expert) practitioners work within the constraints to achieve the domain functional goals.
The sociality of work. This considers how cognitive resources are distributed across multiple agents and artifacts. Issues of resource management, perception, action, attention, memory, processing capacity, mediation, coordination, communication, feedback, and control need to be addressed at this level.
Representations. A description of the representations employed in the domain and how they are used. This includes both internal representations (“mental models”) and external representations (artifacts).
A research program that succeeds in accomplishing these steps would provide several valuable contributions to the theory of Joint Cognitive Systems and the practice of Cognitive Systems Engineering.
4 References
Albright, C. A., Truitt, T. R., Barile, A. L., Vortac, O. U., & Manning, C. A. (1995). Controlling traffic without flight progress strips: Compensation, workload, performance, and opinion. Air Traffic Control Quarterly, 2, 229-248.
Beir, E., M. Stone, K. Fishkin, W. Buxton, T. Baudel (1994). A taxonomy of see-through tools. Proceedings of CHI’94 Human Factors n Computing Systems ACM (New York). Pp 358-364.
Beyer, H. & Holtzblatt, K. (1998). Contextual Design: Defining Customer-centered Systems, San Diego, CA: Academic Press.
Card, S. (1982). User perceptual mechanisms in the search of computer commend menus. Proceedings Human Factors in Computer Systems, ACM (March) , Washington , DC. Pp. 95-100.

Draft URET ACL Report 3/1/03
Casey, S (1993). Set phasers on stun — and other true tales of design, technology, and human error. Santa Barbara, CA: Aegean.
Durso, F. T., & Manning, C. A. (2002), “Spinning papers into glass: transforming flight progress strips”, Human Factors and Aerospace Safety, 2.
Durso, F. T., Truitt, T. R., Hackworth, C. A., Albright, C. A., Bleckley, M. K., & Manning, C. A. (1998). Reduced Flight Progress Strips in En Route ATC Mixed Environments. (Report No. DOT/FAA/AM-98/26). Washington, DC: FAA Office of Aviation Medicine.
Flach, J. M. (2000). “Discovering situated meaning: An ecological approach to task analysis”. In J. Schraagen, S. Chipman, & V. Shalin (Eds.), Cognitive task analysis. Mahwah, NJ: Lawrence Erlbaum Associates.
Hughes, J. A., Randall, D. & Shapiro, D. (1993). From ethnographic record to system design: some experiences from the field. Computer Supported Cooperative Work, 1, 123-141.
Landauer, T. K. (1995). The trouble with computers: Usefulness, usability, and productivity. Cambridge, MA: MIT Press.
Macbeth, G. (2001). Munsell Conversion Program. Retrieved 10/10/01, 2001, from the World Wide Web: www.munsell.com
Marsden, A. & Krois, P. (1997). FAA ODID IV En-route Baseline Comparison Simulation Final Report, EEC Report No. 311, EUROCONTROL Experimental Centre, B. P. 15, Brétigny-sur-Orge CEDEX, France.
Nagy, A. L., & Sachez, R. R. (1992). Chromaticity and Luminance as Coding Dimensions in Visual Search. Human Factors, 34(5), 601 - 614.
Narborough - Hall, C. S. (1985). Recommendations for Applying Color Coding to Air Traffic Control Displays. Displays, July, 131 - 137.
Polson, P.G., Lewis, C., Rieman, J. and Wharton, C. (1992) “Cognitive walkthroughs: a method for theory-based evaluation of user interfaces” International Journal of Man-Machine Studies, volume 36, pp. 741-773.
Shneiderman, B. (1998) Designing the User Interface (3rd edition). Addison Wesley Longman Inc. Menlo Park, Ca.
Verplank, W. (1988). Graphic challenges in designing object-oriented user interfaces. In M. Helander (ed). Handbook of Human Computer Interaction. Elsevier Science Publishers, Amsterdam, The Netherlands (1988) pp. 365-376.
Vortac, O.U., Edwards, M. B., Jones, J. P., Manning, C. A., & Rotter, A. J. (1992, November). En Route Air Traffic Controllers' Use of Flight Progress Strips: A Graph-Theoretic Analysis. (Report No. DOT/FAA/AM-92/31). Washington, DC: FAA Office of Aviation Medicine.

Draft URET ACL Report 3/1/03
Vortac, O.U., Edwards, M.B., Fuller, D. K., & Manning, C. A. (1993). Automation and cognition in air traffic control: An empirical investigation. Applied Cognitive Psychology, 7, 631-651.
Vortac, O.U., Barile, A. B., Albright, C. A., Truitt, T. R., Manning, C. A. & Bain, D. (1996). Automation of flight data in air traffic control. In D. Hermann, C. McEvoy, C. Hertzog, P. Hertel, & M. K. Johnson, (Eds.) Basic and Applied Memory Research, Volume 2. Mahwah, NJ: Lawrence Erlbaum Associates.
Appendix 3B: Paper vs. electronic Strips
Durso and Manning (2002) report provide six arguments with regard to the transition from paper to electronic flight strips.
Automation Roadblocks
Future automated systems rely on up-to-date information. For these systems to—e.g. conflict detection systems- work properly the host should always hold information reflecting the current situation. Controllers, however, currently do not update all flight information in the host, e.g. heading/speed changes are not entered. Updating both Host information and flight progress strips will lead to double the workload for controllers. In a study reported by Crown Communications Inc. (1999), controllers were using both URET CCLD and strips. When controllers had to update their strips, they had no time to use the planning mode of URET. (They do however not mention anything about how problematic it might be for controllers to update the host continuously, even in high traffic situations.)
Workload issues
Another problem might be that keeping 2 data sources updated could lead to confusion, when in some cases the information on strips could conflict with the info in the host. A number of studies in which strip usage was limited suggest that strips are not a necessity to the work of controllers. One of the allegories of strips is that arranging them in certain ways can aid the controller. Counting the number of strip movements would support this view. On average controllers move strips about 7 times per minute. Vortac, Ewards, Fuller and Manning (1993) studied the effects of controllers not being able to manipulate strips. In this study strips were glued to the bay, and controllers had no pencils. The results showed no deficits and even some benefits resulting from this condition. Controllers granted more pilots their requests and granted them sooner. Albright, Truitt, Barile, Vortac and Manning (1995) performed a study in which strips were removed altogether. In that study controllers seemed to compensate for this condition by requesting more CRD readouts. The performance of the controllers was not negatively affected by the lack of strips. Some controllers hinted that the extra CRD requests diverted their attention away from the PVD. This was however unfounded, in actual fact controllers without strips spent 19% more time scanning the PVD. Another condition that Vortac, Barile, Albright, Truitt, Manning and Bain (1996) experimentally assessed, was replacing the paper strips with one line electronic information that contained limited flight data. Also for this condition no performance deficits were observed when compared to the condition of control with paper flight progress strips.
Controllers like strips

Draft URET ACL Report 3/1/03
One of the ways in which strips support controllers is by granting them previews into conflicts before an aircraft has actually entered their sector. This function is much less supported by only using a PVD. Currently, however, the Host computer already can provide some flightplan information electronically to the controllers.
Paper strips functionality has become partly obsolete
Over the last decades the extent and the quality of radar coverage over the US has improved considerably. Because of this, the PVD has taken over a central role in providing information to the controller. Another change is that strips are no longer the sole record of what happens in the NAS. For instance, a large number of parameters from the Host are nowadays recorded as well. Another function of strips is believed to memorize information better by marking it on strips. There is evidence however that controllers have come up with other memory adding strategies, e.g. changing the length of the leader line to zero after having handed of an aircraft.
Anachronistic strips
The use of new workstations meant that there is less space for stripbays. This lead to a reduction of the stripsize from 8’ x 1 3/8’ to 6 3/8’ x 1 3/8’. Durso, Truitt, Hackworth, Albright, Bleckly and Manning (1998) showed that strips could not be much smaller than 6 3/8’ x 1 3/8’ for many enroute applications. Another point of concern here is strips are a too static a presentation of information. When in a free-flight-like environment control moves form strategic to more tactical –e.g. when pilots are allowed to vector their aircraft around weather to their own plan- flightplan information represented on strips can quickly become outdated.
Problems with pro-strip arguments
a. Ascribed advantages of paper over glass i. Keyboard entries are seen as more cumbersome than paper markings. According
to Manning and Durso (2002), a large number of strip marking are unessential. (They do however not mention that most new systems will highly rely on data entries of controllers for the various algorithms to work well.)
ii. The range of entries possible on a computer is restricted. According to Durso and Manning (2002) a large part of the strip markings in many facilities have already been standardized, rendering this an invalid argument.
iii. Computer entries restrict the sequence of entries. This depends entirely on the way data entry will be implemented in the software.
iv. Glass would restrict the movability of information throughout the workspace. Durso and Manning (2002) say that the occasions on which strips can be passed from hand to hand are minimized due to the mission critical nature of ATC operations.
v. Screen displays offer less ways of differentiating between bits of information. Durso and Manning state (2002) that the PVD already makes the necessary distinction by depicting each flight as a single entity. Differentation is achieved by linking all the information about that entity to its symbol.

Draft URET ACL Report 3/1/03
b. Evolution of flight strips: The argument is that over the years of use, strips have become a highly versatile tool for controllers. Durso and Manning try to show with the studies mentioned above that controllers can easily do without strips though. c. Backup issue: The argument is that strips are the only hardcopy of information in case of a major system failure. However in case of a major failure, strips only provide accurate information about the aircraft last known position. An electronic strip replacement system can easily provide the exact same information using electricity from a backup power source.