Guest Paper Time students studying Quantity · PDF fileand Full-Time students studying...
21
Networks Issue 19, March 2016 97 Guest Paper What’s the Difference? Analysis of variance in satisfaction / importance metrics between Part-Time and Full-Time students studying Quantity Surveying at Anglia Ruskin University Matt East ([email protected]) Faculty of Science and Technology Abstract This project investigated the variance in perceived satisfaction and importance across academic and ancillary services between part-time and full-time students on the Quantity Surveying course at Anglia Ruskin University. Using a bespoke mixed methods approach, students were surveyed and asked to highlight incidents that played a key part in affecting their satisfaction/dissatisfaction with the University. Analysis indicated on average, there was little variance in priority, satisfaction, or importance between the two groups of students. Quality of teaching has the greatest impact on satisfaction, both positively and negatively for both groups of students, and is seen as most important, while response time from academics offered the lowest satisfaction and variance between groups around perceived importance. Analysis showed a large proportion of students did not use a large number of ancillary services, but of these, the Library, online systems, and computers were recorded as both the most satisfactory and most important services, while Transport/Parking was highlighted as important to both groups of students, and with low satisfaction, in particular for full-time students. A number of faculty level and institutional recommendations have been made, including improving quality of teaching, academic understanding and feedback to students, developing clear communication strategies for services, expectations and institutional offerings, alongside a shift in focus by the institution away from doctorate requirements over professional experience. Recommendations for ancillary services include more detailed communication around transport/ parking services, and improvements to the Catering service. Keywords Student Satisfaction, Part-Time Students, Full-Time Students
Transcript of Guest Paper Time students studying Quantity · PDF fileand Full-Time students studying...
Networks Issue 19, March 2016 97
Guest Paper
What’s the Difference? Analysis of variance in satisfaction / importance metrics between Part-Time and Full-Time students studying Quantity Surveying at Anglia Ruskin University
Matt East ([email protected]) Faculty of Science and Technology
Abstract
This project investigated the variance in perceived satisfaction and importance across academic and ancillary services between part-time and full-time students on the Quantity Surveying course at Anglia Ruskin University. Using a bespoke mixed methods approach, students were surveyed and asked to highlight incidents that played a key part in affecting their satisfaction/dissatisfaction with the University.
Analysis indicated on average, there was little variance in priority, satisfaction, or importance between the two groups of students. Quality of teaching has the greatest impact on satisfaction, both positively and negatively for both groups of students, and is seen as most important, while response time from academics offered the lowest satisfaction and variance between groups around perceived importance. Analysis showed a large proportion of students did not use a large number of ancillary services, but of these, the Library, online systems, and computers were recorded as both the most satisfactory and most important services, while Transport/Parking was highlighted as important to both groups of students, and with low satisfaction, in particular for full-time students.
A number of faculty level and institutional recommendations have been made, including improving quality of teaching, academic understanding and feedback to students, developing clear communication strategies for services, expectations and institutional offerings, alongside a shift in focus by the institution away from doctorate requirements over professional experience.
Recommendations for ancillary services include more detailed communication around transport/parking services, and improvements to the Catering service.
Keywords
Student Satisfaction, Part-Time Students, Full-Time Students

98 Networks Issue 19, March 2016
Literature Review
Student Experience
The term Student Experience is now widely used in the higher education (HE) sector. Since the introduction of fees in 2003, the student experience has been at the heart of HE league tables, and a key element in decision making. More recently, following publication of the Browne report (2010) white paper, Securing a sustainable future for higher education: an independent review of higher education funding and student finance, student experience has been placed at the forefront of proposed investment in HE following the increase in fees. While Browne (2010) proposed investment to improve the student experience, the expression has more recently become a repetitive and totemic phrase used throughout the sector (Sabri, 2011).
The National Student Survey (NSS) has become a key metric for defining quality, categorised as Student Satisfaction, and encompasses key criteria that are widely used to define the quality of student experience. Since its introduction, the NSS has been a driving force for institutional change, emphasising Browne’s (2010) intentions by ‘putting students at the heart of change making within HE’. Although many criticise the power and focus of the NSS, this is still regarded as the tool for benchmarking quality across Higher Education Institutions (HEI) in the UK. Sabri (2011) states that through primarily measuring academic quality, the NSS unintentionally ‘intensifies discourse that steadily elevates ‘the student experience’ and detracts attention away from the broader institutional, financial, and socio-political issues’. Townley et al. (2013) support this, and throughout their research they indicate that students’ sense of community can play a key role in satisfaction relating to academic matters, and also plays an influential role in affecting retention, progression and further study rates.
As the NSS primarily looks at academic services, wider literature looks deeper into this through measuring wider service quality. Douglas et al. (2008), for example, outline the inherent difficulty in measuring service quality due to highly subjective individual definitions of quality, importance, and impact. Furthermore, Bolton and Drew (2001) state that service quality precedes satisfaction, while Lee et al. (2000) state that service quality leads to satisfaction. Douglas, McClelland and Davies (2008) take the latter view, agreeing with Cronin and Taylor, who argue that:
Service providers need to know whether their objective should be to deliver a satisfied customer, who will then develop a perception of high service quality, or that they should aim for high service quality as a way of increasing customer satisfaction (Cronin & Taylor, 1992)
Nevertheless, while sectoral level analysis is important, all institutions are different. Each HEI offers a different homogenised experience based on the weighting and amount of financial resources, the ethos and strategic focus of the institution, the focus on social/cultural capital, and the way these areas are promoted and communicated to students (Reay, Crozier & Clayton, 2010). Therefore comparing intrinsic value and impact on ‘student experience’ is very complex and challenging. In addition, the impact of ‘other’ ancillary services is growing, as further support and experience offerings grow and become ingrained, further developing institutional value propositions.
The consumer/partner paradox
Throughout the sector, ‘student as consumer’ is a commonly used metaphor. However, the level of consumerism is widely debated. Molesworth et al. (2011) outline three common criteria for levels of consumerism found within the sector (see Table 1).

Networks Issue 19, March 2016 99
Table 1: Levels of consumerism within HE. Source: Molesworth et al. (2011)
Some see University from a consumerist perspective with the University supplying education as a product which is consumed by students. However, Kandiko (2013) showed that students predominantly viewed education as more of a partnership, with investment from both stakeholders. Students also felt there was more of a ‘partnership of aims’ rather than ‘a partnership of means’ with academic staff at course level demonstrating more of a micro level partnership (i.e. the Course) than macro (i.e. the University).
Williams (2012), Kandiko (2013) and Molesworth et al. (2011) discuss students’ personal perceptions as consumers after the introduction of £9,000 fees. Although the majority of students did not specifically regard themselves as outright consumers of a product, their perceptions of interaction with their institutions all showed strong indications of a consumerist relationship. A major finding from Kandiko’s (2013) study was that students have a consumerist ethos towards HE, and consider ‘value for money’ as a priority, regardless of mode of study, course, and so on. Many students wondered whether obtaining a degree was worth the financial cost, mainly relating to intrinsic focus, rather than looking at societal economic gains, suggesting that students predominantly attended HE for personal improvement or CV enhancement. Kandiko (2013) highlights three areas of student focus when considering value for money:
• Embodiment of value: contact time, quality of teaching, and so on
• Tangible value: resources, capital
• Return on investment: output, knowledge transfer, personal gain based on monetary perception of worth
Molesworth et al. (2011) outline how changes in fees structure since 2001 have impacted student perceptions and approaches towards HE, although Kandiko (2013) shows increasing fees has had minimal impact on consumer expectations. The National Union of Students (NUS) believes the consumer model reduces educational interactions to ‘mere transactions’, and ‘de-values the role and expertise of educators’:
The students as consumers model assumes that the experience of attending higher education is something that can be packaged and sold; it turns students into customers and teachers into service providers (NUS, 2012)
Instead the NUS view students as co-creators of their own knowledge and self-perpetuated success (NUS, 2012). Molesworth et al. (2009) support this, making clear cases around discourse of quality, consumerism leading change, and the driving forces of academic quality. Based on Fromm’s (1993) humanist philosophies, Molesworth et al. (2011) deduce that, ‘The current HE market discourse promotes a mode of existence, where students seek to ‘have a degree’ rather than to ‘be’ learners’. The balance of delivering a service, and being in a true partnership with students/customers is important (NUS, 2012). This model is
Role Students
Consumer
1. The student consumes educational services for his/her own pleasure and interest 2. The student buys education diplomas for improving his/her position on the labour market
(CV Boost) 3. The student buys techniques, skills and knowledge for becoming a knowledge worker and
self-regulated learner
Personal management
1. The student invests into his/her own human capital though education as his/her body and mind will be like a company supplying services to the market.
2. To increase his/her value the student updates his/her ‘software’ according to the principles of demand and supply
3. The student uses education to achieve an employable and reasonable CV and hereby conduct studies and life in an accountable way
Commodity
1. The Social Investment State ensures that education is wisely invested into human capital and that the education outputs produce real economic growth
2. The state manages its human capital in an accountable, transparent, competitive and efficient way
3. The state has to provide corporation with highly skilled human capital for being able to compete with other countries in the knowledge economy
What’s the Difference? Analysis of variance in satisfaction / importance metrics between Part Time and Full Time students studying at Anglia Ruskin University
100 Networks Issue 19, March 2016
visible in the HE sector with the growing reliance on, and marketing of, consumer feedback and satisfaction data via the NSS and Key Information Statistics (KIS). Molesworth et al. (2011) argue, however, that many students do not make rational decisions about their route through HE, but that many will be attracted by the ‘glossy prospectus and promises of lifestyle’ rather than the ‘level of intellectual stimuli presented from the academic perspective’ (Brown & Carasso, 2013).
The variability in mode of study
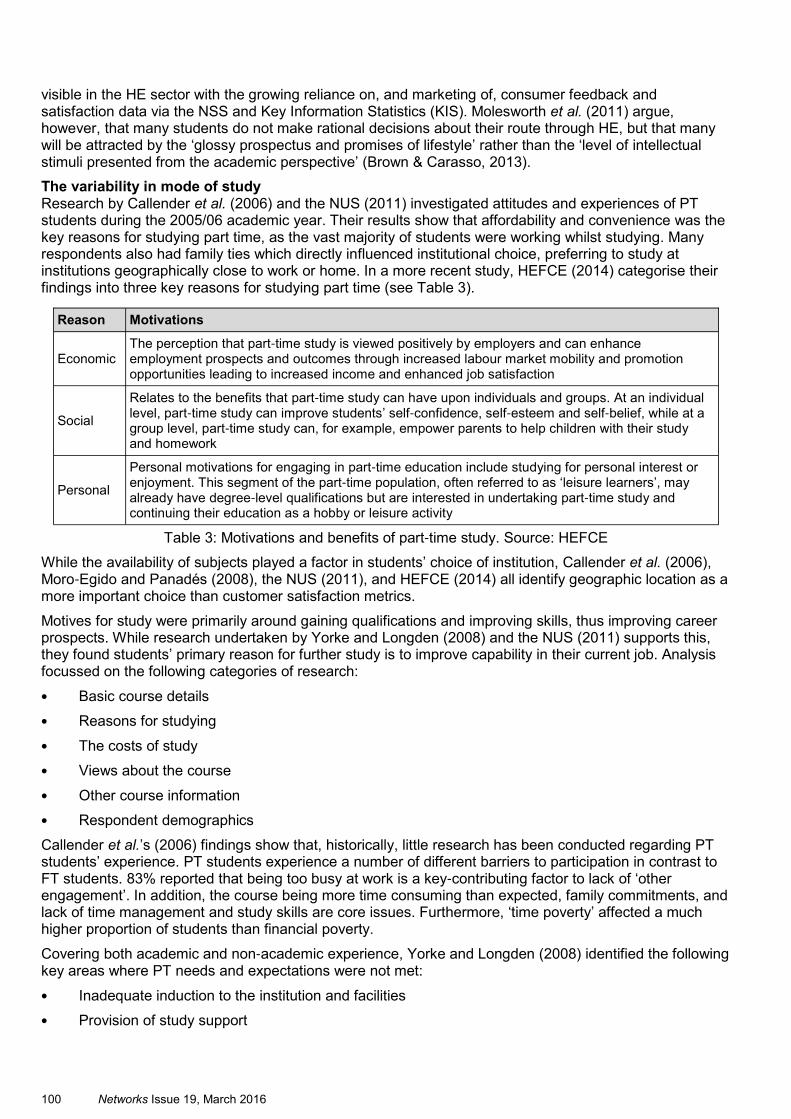
Research by Callender et al. (2006) and the NUS (2011) investigated attitudes and experiences of PT students during the 2005/06 academic year. Their results show that affordability and convenience was the key reasons for studying part time, as the vast majority of students were working whilst studying. Many respondents also had family ties which directly influenced institutional choice, preferring to study at institutions geographically close to work or home. In a more recent study, HEFCE (2014) categorise their findings into three key reasons for studying part time (see Table 3).
Table 3: Motivations and benefits of part-time study. Source: HEFCE
While the availability of subjects played a factor in students’ choice of institution, Callender et al. (2006), Moro-Egido and Panadés (2008), the NUS (2011), and HEFCE (2014) all identify geographic location as a more important choice than customer satisfaction metrics.
Motives for study were primarily around gaining qualifications and improving skills, thus improving career prospects. While research undertaken by Yorke and Longden (2008) and the NUS (2011) supports this, they found students’ primary reason for further study is to improve capability in their current job. Analysis focussed on the following categories of research:
• Basic course details
• Reasons for studying
• The costs of study
• Views about the course
• Other course information
• Respondent demographics
Callender et al.’s (2006) findings show that, historically, little research has been conducted regarding PT students’ experience. PT students experience a number of different barriers to participation in contrast to FT students. 83% reported that being too busy at work is a key-contributing factor to lack of ‘other engagement’. In addition, the course being more time consuming than expected, family commitments, and lack of time management and study skills are core issues. Furthermore, ‘time poverty’ affected a much higher proportion of students than financial poverty.
Covering both academic and non-academic experience, Yorke and Longden (2008) identified the following key areas where PT needs and expectations were not met:
• Inadequate induction to the institution and facilities
• Provision of study support
Reason Motivations
Economic
The perception that part-time study is viewed positively by employers and can enhance employment prospects and outcomes through increased labour market mobility and promotion opportunities leading to increased income and enhanced job satisfaction
Social
Relates to the benefits that part-time study can have upon individuals and groups. At an individual level, part-time study can improve students’ self-confidence, self-esteem and self-belief, while at a group level, part-time study can, for example, empower parents to help children with their study and homework
Personal
Personal motivations for engaging in part-time education include studying for personal interest or enjoyment. This segment of the part-time population, often referred to as ‘leisure learners’, may already have degree-level qualifications but are interested in undertaking part-time study and continuing their education as a hobby or leisure activity

Networks Issue 19, March 2016 101
• The lack of modular choice for PT students specifically
• The lack of allowances made for PT students. This includes timetable considerations, opening hours of facilities, and administrative offices, and general support mechanisms and systems for PT students
• Academics who did not appreciate the challenges of part-time study
• Lack of social opportunities created for PT students specifically
A study by Moro-Egido and Panadés (2008) had similar findings, and their longitudinal analysis of PT and FT student satisfaction demonstrated clear variance in focus and priorities consistently over four years. Their research highlights a number of key reasons for lower levels of satisfaction:
• Extra-curricular opportunities are significantly less available to PT students. These are often seen as ‘core’ elements of University life, such developing peer relationships, student networking, living arrangements and social activities
• PT students are more likely to critique applicability of their courses compared to experienced requirements at work
• Because of time constraints, PT students are more likely to critique poor lectures ‘harshly’, but conversely will value good lectures more
• There is a consistent perception that PT delivery is simply ‘extended’ versions of a FT delivery, leading to a student perception that they are ‘lesser’ students’
• The lack of bespoke delivery and a feeling of being ‘shoe-horned’ into FT delivery
• Poor course design for PT delivery is also a factor
• PT students compare facilities (such as computers and laboratory equipment) to that used in industry. It was found in many cases, institutional equipment did not meet industry standards
A clear definition of satisfaction remains elusive, however, as Moro-Egido and Panadés (2008) state, ‘there is still no consensus as to how satisfaction should be defined, how it can be measured and how its determinants can be assessed’. It should also be noted that research by the NUS (2011) supports Moro-
Egido and Panadés’ (2008) findings around satisfaction, in which they list many elements of dissatisfaction from FT-centric approaches.
Lamond, Proverbs and Wood (2013) researched the specific factors impacting student satisfaction on Built Environment courses. This research utilised the NSS questions to identify discourse in perceptions from national findings and those across a course group. However, based on findings from previous research undertaken by the Council and Heads of Built Environment (CHOBE), they grouped the questions differently to the NSS (Proverbs & Lamond, 2008), and created groups for teaching quality, quality of feedback, student support, and advice. Their research identified a widespread variance of responses at an individual level, implying students were experiencing very different standards across the courses surveyed.
Research Design and Methodology
The aim of the project was to determine the nature and extent of the variation in experience of PT and FT students. The areas of investigation were both satisfaction and importance of both the academic experience and ‘secondary’ ancillary services. The research identified positive and negative ‘critical incidents’ in both academic and non-academic activities.
An exploratory research approach (Hussey & Hussey, 1997) was used for this project, due to the lack of research previously undertaken in this area at the University. The main objectives of this project were to:
• Identify the key variances in satisfaction between PT and FT students
• Identify the key variances in perception of importance of services and delivery between PT and FT students
• Identify the ‘critical incident’ points in both areas
What’s the Difference? Analysis of variance in satisfaction / importance metrics between Part Time and Full Time students studying at Anglia Ruskin University

102 Networks Issue 19, March 2016
• Identify recommendations for course and institution
Data Collection
Data was gathered during ‘core’ modules for the course specific to this study across all levels (i.e. Levels 4, 5, and 6) and modes of study. To enable a higher response rate from the potential participants, the survey was also posted to the Virtual Learning Environment (VLE).
The total number of students on the Quantity Surveying course group is 242, spanning three years of study, and both PT and FT delivery methods (Anglia Ruskin, 2015). To allow for the most representative sample, ‘core’ modules from each academic year were targeted in the first semester of 2014/15 academic year. Longitudinal data was collected to address Rowley’s (2003) concern that student satisfaction varies from academic year to academic year, as students switch from comparing perceptions and expectations, to previous experience as they progress through their course.
Results and Analysis
A total of 116 responses were received from the 242 students on the course, resulting in a 47.9% response rate, of which 23 were FT and 93 were PT students (see Table 4).
Table 4: Proportion of response rate by mode of study
As Figure 1 shows, there is considerable variance in numbers of students and PT/FT balance over the three years of the course. While each level of study has a far higher number of PT students, the level of FT students has nearly doubled year on year over the past three years.
Figure 1: Count of response rate by level of study (PT/FT Drill down)
Satisfaction/Importance – Academic Services
Satisfaction with Learning and Teaching activities The majority of students indicated they were satisfied with their academic experience (Figure 2). Both groups of students report they are most dissatisfied with the time taken for academics to respond to their queries, and most satisfied with the VLE, with minimal variation in mean scores. Overall, FT students were ‘very satisfied’ more frequently than PT students (Figures 2 and 3). This is in line with Callender et al.’s (2006) findings, where they indicated that PT students are generally more critical due to life experience gained whilst working in industry, and comparing experience to real world (Yorke & Longden, 2008).
Students Responses Actual number
PT 93 210
FT 23 32
Total 116 242
% Response rate
44.3
71.9
47.9

Networks Issue 19, March 2016 103
Figure 2: Satisfaction with Learning and Teaching activities (Count – PT students)
Figure 3: Satisfaction with Learning and Teaching activities. (Count – FT students)
Table 5 indicates the difference in perceived satisfaction between PT and FT students (1 = most satisfied, 12 = least satisfied).
What’s the Difference? Analysis of variance in satisfaction / importance metrics between Part Time and Full Time students studying at Anglia Ruskin University

104 Networks Issue 19, March 2016
Table 5: Satisfaction with Learning and Teaching activities. (Ranked by Mean)
Response time from academics scored the lowest level of satisfaction for both FT and PT students. Similarly, both groups were dissatisfied with the amount of contact time. PT students were especially dissatisfied with communication, rating feedback, contact time, and response time as the least satisfactory elements of their study. While the greatest variation between the two groups concerns quality of feedback, where PT students are much less satisfied than their FT counterparts. Conversely, FT students are considerably less satisfied with their relationship with academics than PT students.
Importance of Learning and Teaching activities
Figure 4 and Figure 5 show the levels of importance reported by PT and FT students respectively.
Figure 4: Importance of Learning and Teaching activities (PT students)
Part Time (mean) Rank Full Time (mean)
The VLE (3.26) 1 Learning and teaching activities (3.14)
Teaching facilities (3.18) 2 Teaching facilities (3.14)
Assignment relevant to your course (3.08) 3 The VLE (3.14)
Quality of teaching (2.97) 4 Assignments relevant to the course (3.14)
Relationship with academics (2.95) 5 Quality of teaching (3.0)
Teaching materials (2.94) 6 Course hardware and software (3.0)
Course hardware and software (2.94) 7 Quality of feedback (2.95)
Learning and teaching activities (2.92) 8 Course timetable (2.95)
Course timetable (2.85) 9 Teaching materials (2.95)
Contact time (2.71) 10 Relationship with academics (2.81)
Quality of feedback (2.69) 11 Contact time (2.71)
Response time from academics (2.66) 12 Response time from academics (2.67)

Networks Issue 19, March 2016 105
Figure 5: Importance of Learning and Teaching activities (FT students)
Both FT and PT students regard quality of teaching, assignment relevance, and quality of feedback as very important. However PT students regard response time from academics much more important than FT students. Surprisingly, PT students felt the course timetable was the least important element of their learning and teaching experience, yet the mean still rated this as ‘important’, which contradicts Callender et al.’s (2006) research. It could be perceived that as PT students are scheduled on one day of study, the perception of this question may have referred more to the ‘order’ of lectures and practicals, rather than spread of lectures over a week, hence the discrepancy with the institutional perception.
Satisfaction/Importance – Ancillary Services
The summary of responses in Table 6 show that some ancillary services are not used by a large proportion of students, and PT students in particular. Analysis indicates that PT and FT students use roughly the same number of services, but for that they are used by a greater proportion of FT students. Yorke and Longden (2008) argue that this discrepancy is caused by PT students experiencing a higher level of ‘time poverty’. In addition, many of the services that PT students do not use are not directly linked to academic study, or are less relevant to PT students (e.g. Accommodation Services), therefore these results are unsurprising. PT students use those services relevant to them as much as FT students.
In Table 9, red cells indicate those areas where less than a quarter of PT students use the service, indicating potential communication, awareness, and/or relevance issues.
What’s the Difference? Analysis of variance in satisfaction / importance metrics between Part Time and Full Time students studying at Anglia Ruskin University

106 Networks Issue 19, March 2016
Table 6: Proportion of student use by mode of study (Ancillary services)
A high proportion of students across the course reported they did not use the Students’ Union, Student Services, Sporting Facilities, Social Activities, Accommodation, and Financial Services. While Accommodation Services are relevant to only a relatively small proportion of students, future research should investigate why students do not use services generally associated with indicating engagement (i.e. Sporting Facilities, Social Facilities, and the Students’ Union).
Figure 6: Satisfaction of ancillary services (Full Data)
PT and FT students are equally satisfied and/or dissatisfied with ancillary services (see Figure 7 and Figure 8). The area with highest satisfaction for both FT and PT students is the University Library. In contrast, the Accommodation Service was rated with the lowest satisfaction, with 90% of PT and 60% of FT students reporting they did not use the service. In line with the research undertaken by Yorke and Longden (2008) and Moro-Egido and Panadés (2008), this could be in part due to inadequate induction; the lower level of engagement by PT students could have been expected whilst such disengagement from FT students is not as expected.
Service
Proportion of use (%)
PT students FT students
Library 99 95
Computers 95 95
Online University Systems 93 95
Catering Services 85 81
Transport/Parking Services 80 76
Student Services 43 67
Sporting Facilities 24 62
Students’ Union 23 67
Finance Services 21 52
Social Activities 19 57
Accommodation Services 12 43

Networks Issue 19, March 2016 107
Figure 7: Satisfaction with ancillary services (PT students)
Figure 8: Satisfaction with ancillary services (FT students)
The biggest area of satisfaction for both PT and FT students are the University Library and ‘online services’, which is consistent with research conducted by both Callender et al. (2006) and the NUS (2011). The biggest area of dissatisfaction for FT students is Transport/Parking. Although the proportion of use is low, especially with PT students, those who use services such as Student Services and the Students’ Union are highly satisfied.
Table 7 shows that both student groups report higher levels of satisfaction with academic-related services than ancillary services. As noted above, the University Library holds the highest satisfaction in both student groups, followed by Computers, Online Systems, and Catering respectively. Perhaps the most unexpected result relates to Transport/Parking, where FT students rate their satisfaction lower than PT students, although both are a cause for concern.
What’s the Difference? Analysis of variance in satisfaction / importance metrics between Part Time and Full Time students studying at Anglia Ruskin University

108 Networks Issue 19, March 2016
Table 7: PT / FT Satisfaction with ancillary services (Ranking by Mean)
Importance
As with Satisfaction, many students reported not using services. Table 8 shows that proportionately, the majority (>75%) of all students use the Library, University Computers, and the Catering Services, while Sporting Facilities, Social Activities, Accommodation, Finance, the Students’ Union, and Student Services have large variance in use by mode of study, with FT using such services more regularly. As Moro-Egido and Panadés (2008) concluded in previous research, many students do not perceive many ancillary services as ‘core’ elements of University life, and do not engage due to time constraints.
Table 8: Use of ancillary services (PT / FT drill down)
While Sporting Facilities (52%) and Social Activities (43%) are the least important areas for PT students, the least important service for FT students is Catering Services (33%). Table 9 also shows how important Transport/Parking, Library, Computer Services, and Online Systems are to both groups of students. However, all of these services received good satisfaction from students apart from Transport/Parking, which is highlighted as the primary area of dissatisfaction from both groups. It is important to note that Sporting Facilities, Social Activities, and the Students’ Union are the least important services for PT students, again, in line with Yorke and Longden (2008), highlighting ‘time poverty’ as core rationale for not
Part Time Full Time
Service Mean Service Mean
1 Library 4.16 Library 4.29
2 Computers 3.90 Computers 4.14
3 Online Systems 3.86 Online Systems 4.10
4 Catering Services 3.17 Catering Services 3.38
5 Transport/Parking 2.53 Student Services 3.10
6 Student Services 2.26 Students’ Union 2.95
7 Students’ Union 1.65 Sporting Facilities 2.67
8 Sporting Facilities 1.64 Social Activities 2.48
9 Finance Services 1.48 Finance Services 2.33
10 Social Activities 1.42 Transport/Parking 2.19
11 Accommodation 1.29 Accommodation 1.81
Service
Proportion of use (%)
PT students FT students
Library 99.0 98.0
Computers 97.0 97.0
Catering Services 88.0 75.0
Sporting Facilities 38.0 66.0
Social Activities 27.0 70.0
Accommodation Services 21.0 72.0
Finance Services 26.0 81.0
Transport/Parking Facilities 74.0 89.0
Online University Systems 93.0 94.0
Students’ Union 38.0 73.0
Student Services 53.0 80.0

Networks Issue 19, March 2016 109
engaging with social type activities. Overall, these findings are broadly in line with Callender et al. (2006), Moro-Egido and Panadés (2008), and the NUS (2011) relating to engagement with ancillary services.
Table 9: Importance of ancillary services (PT / FT Drill down)
Critical Incident Analysis
The qualitative questions on the survey generated a total of 605 individual coded comments were analysed using NVivo. These comments were coded into 76 sub-themes from which 12 umbrella themes were generated (see Table 10).
Table 10: Qualitative coding grouping
Learning and Teaching
PT and FT students both reported that academic activities have the greatest impact on their learning and teaching experience, with almost equal numbers of positive and negative comments. PT students also made a large number of negative comments about Feedback (see Table 11). PT students overall have more ‘dissatisfiers’ (Douglas et al., 2009) than FT, relating mainly to Personal Issues, Teaching, Timetable, and the General University.
Question
Part Time Full Time
Proportion Important
Proportion Unimportant
Proportion Important
Proportion Unimportant
Library 98.0% 2.0% 100.0% 0.0%
Computers 96.0% 4.0% 100.0% 0.0%
Catering Services 67.0% 33.0% 66.7% 33.3%
Sporting Facilities 48.0% 52.0% 76.5% 23.5%
Social Activities 57.0% 43.0% 71.4% 28.6%
Accommodation Services 61.0% 39.0% 92.3% 7.7%
Finance Services 77.0% 23.0% 85.7% 14.3%
Transport/Parking Facilities 88.0% 13.0% 100.0% 0.0%
Online University Systems 94.0% 6.0% 100.0% 0.0%
Students’ Union 63.0% 38.0% 92.9% 7.1%
Student Services 76.0% 24.0% 92.9% 7.1%
Themes
Number of coded elements
Sub-themes
Academic 18 Teaching knowledge, quality, marking
Facilities 12 Ancillary services available on site
Feedback 4 Quality and consistency of feedback
Campus Life 6 Meeting new people/social life
Travel 3 Parking/Park and Ride
Teaching 6
Specific mention of modules, module guides, prolonged lectures
External Issues 5 Self-motivation, personal commitments
University General 7 Customer service, communication
IT 3 VLE and other online systems
Timetable 2 Cancelled lectures
Assessment 3 Type of assessment, relevance of assessment
Part-Time Experience 4 Being a part time student
What’s the Difference? Analysis of variance in satisfaction / importance metrics between Part Time and Full Time students studying at Anglia Ruskin University

110 Networks Issue 19, March 2016
Table 11: Learning and Teaching comments (Overall count)
Positive (satisfiers) PT and FT students both report that ‘academic’ elements have the greatest impact on their learning and teaching experience. Table 12 lists the core themes as highlighted by PT and FT students.
Table 12: Positive critical incidents, Learning and Teaching
Quality of teaching is evidently the single area with the most positive impact. PT and FT students praised the knowledge of academic staff and teaching quality. In particular, enthusiastic and engaging lecturing was highlighted, especially when applying theory to real situations. One student, for example, noted that,
Having a good lecturer such as [lecturer name] who explains each of his modules thoroughly, as well as ensuring we are happy with other modules also
Students highlighted the impact of specific lecturers on their overall experience of academic study suggesting that these individuals play a key role in enthusing students, whilst also teaching on a large number of core modules, and can positively impact otherwise negative perceptions of academic study.
PT Students FT Students
Positive Negative Positive Negative
Academic 33 39 8 9
Assessment 2 3 0 1
Campus Life 1 0 0 0
External Issues 4 3 1 0
Facilities 6 0 0 0
Feedback 7 17 4 3
IT 4 1 1 0
PT Experience 0 1 0 1
Personal 0 2 1 1
Teaching 4 5 4 2
Timetable 0 8 0 0
Travel 0 1 0 0
University General 1 3 0 2
Parent Theme
Frequency
Illustrative Comment PT FT
Academic
Quality of Teaching 11 2
Quality of teaching has been very good. Apply theory to real situations based on their experiences
Lecture Delivery 3 0 Interactive and practical lessons.
Course Leader 4 1
Having [name] as a lecturer has made me enjoy being in lectures and makes learning fun
Quick response from Academic
3 0
The lecturer is always available to guide via telephone or email
Specific lecturer 11 2 The individual lecturers
External Issues
Self-Motivation 4 1
My first poor mark for a piece of work hit home that I had to put more effort in
Facilities Socialising 3 0 Social interactions with those around on campus
Feedback
Feedback on Assessment
7 2 Value of feedback given by lecturers

Networks Issue 19, March 2016 111
Similarly, a specific lecturer can positively impact an otherwise negative perception of a module/other academic.
[Lecturer name] agreeing to give feedback on another lecturer’s assignment when he was unavailable
The course leader (named individual) was highlighted in particular as having a very positive impact on the course overall, both in capacity as lecturer, module tutor, and course leader. Many students associated the positive elements of the course primarily with a single named lecturer, with one going so far as to suggest that,
without [lecturer name] the QS degree would not be as beneficial. If he left, with the current lecturers, the course would not be delivered as well
Negative (dissatisfiers) As with positive analysis, academic elements attracted the greatest number of negative comments (see Table 13), which is consistent with Yorke and Longden (2008). Whilst sub-themes varied, academic comments categorised as both satisfiers and dissatisfiers suggests that this area is highly volatile, and is the most essential area to maintain and grow quality to ensure happy students.
Table 13: Negative critical incidents. Learning and Teaching (count of nodes)
The two aspects which attracted the highest frequency of negative comments were quality of the academic (quality of lecturer) and quality of feedback on assessment, demonstrating students’ perceptions of the significance of academic study. Proportionately, these issues were highlighted more by PT students than FT. Students were concerned about academics’ subject knowledge, referring to lecturers just reading out PowerPoint slides, or being perceived to have ‘crammed’ before the lecture, with student lamenting that,
It would also help if the lecturers know about the subject matter that they are teaching
Students also reported their dissatisfaction with academic staff that had not worked in industry, noting how,
Certain lecturers [are] not from the industry therefore cannot pass on experience
Parent Theme
Frequency
Illustrative Comment PT FT
Academic
Inconsistent marking
3 1
[Tutors] do not seem to mark off the same criteria, therefore if you are taught from one tutor and marked by the other, it’s highly likely that you could be marked down
Lecturer contradictions
3 0
There appears to be no consistency throughout the lecturers and their marking
Lecturers not knowing subject matter
6 2
Lecturers have little knowledge on the module content and are not interested in the subject and purely read from slides.
Poor Lecturer Communication
3 0 Some lecturers aren’t the best at describing things
Poor Lecturers 10 6
When the lecturer just gives you a piece of work or assignment and expects you to understand
Quality of Teaching
4 0 Teaching isn't great
Specific Lecturer 3 3 [lecturer name]
Topic Relativity 6 0
That module was pointless and useless. Quantity surveyors do not need to know about saps. Just a space filling module which could be used with something actually relevant to the Quantity Surveying
Feedback
Feedback on Assessment
14 0
Feedback on some of our coursework elements are shocking and do not give you enough information to grow and understand where you can improve from the task
Timetable
Length of lectures
4 0
Lectures are too long. Concentration levels decrease towards end of lectures
What’s the Difference? Analysis of variance in satisfaction / importance metrics between Part Time and Full Time students studying at Anglia Ruskin University

112 Networks Issue 19, March 2016
Problems with feedback on assessment were raised several number of times by PT students, who highlighted issues with low quality of (or in some cases a lack of) feedback, delay before receiving feedback, and a lack of consistency in feedback/marking between lecturers. One student, for example, complained that they,
Got 75-80% in previous stages however in final stage only managed 35%. Reason for this mark was rubbish no back up whatsoever
Analysis of qualitative results indicate that PT students are more likely to highlight and detail elements of dissatisfaction, which is in line with analysis undertaken by Aldridge and Rowley (1998). Analysis also shows that PT students are more concerned about quality of teaching and depth of feedback, whilst FT students are more concerned about teaching style and lecturer experience in the industry.
Proportionately, nearly a quarter of all FT students raised an issue about poor teaching, indicating their experience of teaching may have differed from PT, with approximately one in nine highlighting this as an issue.
Ancillary Services
Both PT and FT students report positive and negative issues relating to campus life and facilities. Contrary to the quantitative data, the biggest area of dissatisfaction relates to Travel/Parking for PT students, with 13 coded comments highlighted, whilst FT relates to facilities (see Table 14).
Table 14: Ancillary services parent codes (Overall count)
Positive (satisfiers) The majority of positive comments relate specifically to the University Library, primarily focused around the ease of access to online resources, the facilities overall, and the positive working environment (see Table 15). For one student, at least,
The library being mainly online is excellent. The private study rooms in the library have assisted when doing group exercises
PT Students FT Students
Positive Negative Positive Negative
Academic 2 0 0 0
Assessment 0 0 0 0
Campus life 5 3 7 4
External issues 1 2 1 0
Self-motivation 0 0 1 0
Facilities 23 8 6 5
Feedback 0 0 0 0
IT 6 0 0 0
PT experience 1 2 0 0
Personal 0 0 2 0
Teaching 0 0 0 0
Timetable 0 0 0 1
Travel 3 13 0 2
University general 0 3 1 2
Networks Issue 19, March 2016 113
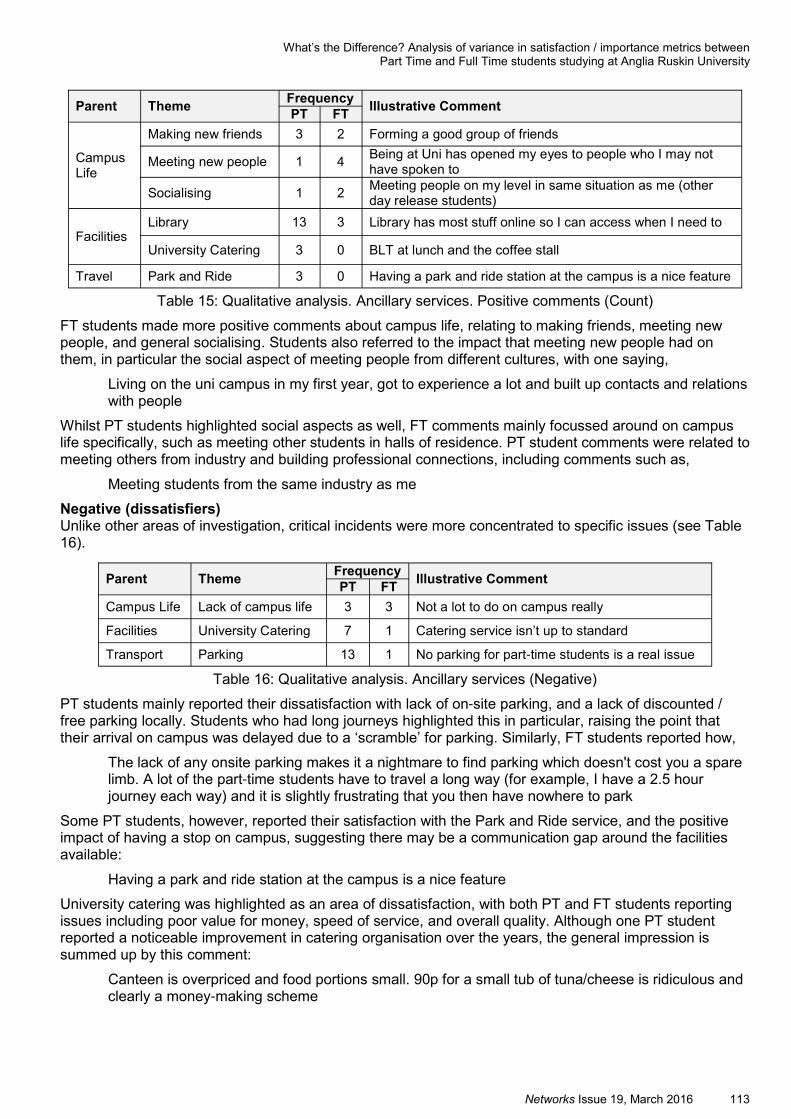
Table 15: Qualitative analysis. Ancillary services. Positive comments (Count)
FT students made more positive comments about campus life, relating to making friends, meeting new people, and general socialising. Students also referred to the impact that meeting new people had on them, in particular the social aspect of meeting people from different cultures, with one saying,
Living on the uni campus in my first year, got to experience a lot and built up contacts and relations with people
Whilst PT students highlighted social aspects as well, FT comments mainly focussed around on campus life specifically, such as meeting other students in halls of residence. PT student comments were related to meeting others from industry and building professional connections, including comments such as,
Meeting students from the same industry as me
Negative (dissatisfiers) Unlike other areas of investigation, critical incidents were more concentrated to specific issues (see Table 16).
Table 16: Qualitative analysis. Ancillary services (Negative)
PT students mainly reported their dissatisfaction with lack of on-site parking, and a lack of discounted / free parking locally. Students who had long journeys highlighted this in particular, raising the point that their arrival on campus was delayed due to a ‘scramble’ for parking. Similarly, FT students reported how,
The lack of any onsite parking makes it a nightmare to find parking which doesn't cost you a spare limb. A lot of the part-time students have to travel a long way (for example, I have a 2.5 hour journey each way) and it is slightly frustrating that you then have nowhere to park
Some PT students, however, reported their satisfaction with the Park and Ride service, and the positive impact of having a stop on campus, suggesting there may be a communication gap around the facilities available:
Having a park and ride station at the campus is a nice feature
University catering was highlighted as an area of dissatisfaction, with both PT and FT students reporting issues including poor value for money, speed of service, and overall quality. Although one PT student reported a noticeable improvement in catering organisation over the years, the general impression is summed up by this comment:
Canteen is overpriced and food portions small. 90p for a small tub of tuna/cheese is ridiculous and clearly a money-making scheme
Parent Theme
Frequency
Illustrative Comment PT FT
Campus Life
Making new friends 3 2 Forming a good group of friends
Meeting new people 1 4
Being at Uni has opened my eyes to people who I may not have spoken to
Socialising 1 2
Meeting people on my level in same situation as me (other day release students)
Facilities
Library 13 3 Library has most stuff online so I can access when I need to
University Catering 3 0 BLT at lunch and the coffee stall
Travel Park and Ride 3 0 Having a park and ride station at the campus is a nice feature
Parent Theme
Frequency
Illustrative Comment PT FT
Campus Life Lack of campus life 3 3 Not a lot to do on campus really
Facilities University Catering 7 1 Catering service isn’t up to standard
Transport Parking 13 1 No parking for part-time students is a real issue
What’s the Difference? Analysis of variance in satisfaction / importance metrics between Part Time and Full Time students studying at Anglia Ruskin University

114 Networks Issue 19, March 2016
Both PT and FT students reported the lack of campus life as an area of dissatisfaction. Both groups of students reported the lack of activity on campus overall, meaning socialising opportunities were restricted, or, as student put it,
not a lot happens on campus
For FT students, the lack of ‘outside’ events for socialisation was an issue. PT students raised the general issue of PT students not really socialising with each other, and also noted a lack of activities specifically arranged to cater for PT students:
Life on campus is dull. Nothing set up for part time students, nothing going on
Findings
There is little difference in the perceptions of satisfaction of academic services between PT and FT students. Although analysis of Likert scale data indicates a very minor variation in outcomes, it is not statistically significant. However, the ordering of satisfaction does differ between study modes. Both FT and PT students report high levels of dissatisfaction with communication from academic staff, with response time to queries being classified as the area with lowest satisfaction for both groups. Similarly, contact time with academics, and quality of feedback are also areas of concern. Collectively these three issues indicate a generic communication issue, and consequently academic staff should develop their communication approaches, to ensure that contact time is as effective as possible.
Satisfaction vs. Importance – Academic Services
Table 17 shows ranking of satisfaction and importance against each other, with red cells indicating where Satisfaction rating are lower (by three ranking points) than importance ratings. Regardless of study mode, all students indicate that Quality of Teaching, Assignment Relevance, and Quality of Feedback are the three most important elements of their course. However, while both groups are relatively satisfied with Assignment Relevance (ranked third by PT students and fourth by FT students) and Quality of Teaching (ranked fourth by PT students and fifth by FT students), they were much less satisfied with Quality of Feedback, which was ranked seventh by FT students and eleventh by PT students.
Table 17: Satisfaction vs. Importance ranking of Academic Services
Rank
Part-Time Full-Time
Satisfaction Importance Satisfaction Importance
1 The VLE Quality of Teaching
Learning and teaching activities
Quality of Teaching
2 Teaching Facilities
Assignment relevance to your course
Teaching facilities
Assignment relevance to your course
3
Assignment relevant to your course
Quality of feedback The VLE Quality of feedback
4 Quality of teaching
Response time from academics
Assignments relevant to the course
Learning and teaching activities
5
Relationship with academics
Teaching facilities Quality of teaching The VLE
6 Teaching materials Teaching materials
Course hardware and software
Response time from academics
7
Course hardware and software
Learning and Teaching activities
Quality of feedback Teaching materials
8
Learning and Teaching activities
Course hardware and software
Timetable Teaching facilities
9 Course timetable The VLE Teaching materials Contact time
10 Contact time Contact time
Relationship with academics
Course timetable
11 Quality of feedback
Relationship with your academics
Contact time
Relationship with your academics
12
Response time from academics
Course timetable
Response time from academics
Course hardware and software

Networks Issue 19, March 2016 115
Critical Incident Technique (CIT) analysis also highlighted very clearly that quality of teaching is by far the most important factor to students’ academic experience, both as a critical satisfier and dissatisfier. Therefore, Quality of Teaching, while somewhat subjective as a concept (Sabri, 2011), must be prioritised by the course team as a primary focus of development. Students also reported concerns around academics lacking subject knowledge, contradicting each other, and adopting inconsistent marking approaches. As all these factors are related to teaching quality, this adds weight to the argument to focus on staff development. As Sabri (2011) outlines, this is commonplace when discussing student experience due to subjectivity of terms and phrases used.
Quality of Feedback received the highest code level in CIT analysis. Students reported the lack of ‘feed forward’ (i.e. ensuring students learn from mistakes and improve future performance) guidance. Similarly, students specifically highlighted poor academic practice related to both formative and summative assessment and feedback tasks, and in-class work in the free text comments. Students also highlighted lengthy response time from academics as a concern, which includes elements of feedback.
Satisfaction vs. Importance – Ancillary Services
There is little variation in satisfaction or importance ratings between PT and FT students, relating to non-
academic services. Both PT and FT students ranked satisfaction and importance equally as important across both modes, as Table 18 shows.
Table 18: Satisfaction vs Importance ranking (Ancillary services)
Transport/Parking is the main area which requires focus, as this is regarded as important to both student groups, with low satisfaction for FT. It could be deduced, however, that as this is not such an issue for PT students, it is more a communication issue around the services available, even more for FT students. Contrary to quantitative findings, the qualitative issues highlight the most prevalent dissatisfier is Transport/Parking, in particular from PT students.
Conclusion
Results suggest little variation in Satisfaction levels between academic areas. Although the ranking order varied somewhat, no significant differences were identified. Relating to ancillary services, very little disparity was observed in ranking order. However, PT students are less satisfied overall with the services offered. One unanticipated outcome was the lack of use of specific services by both groups of students, with over 50% of students not using certain services (see Table 6).
Both groups of students indicated the areas of highest Importance were Quality of Teaching, Quality of Feedback, and Assignment Relevance. Unexpectedly PT regarded their timetable as the least important element of academic studies, whilst FT felt course hardware and software were the least important. Overall, minimal variances in mean scores were identified throughout.
Rank
Part Time Full Time
Satisfaction Importance Satisfaction Importance
1 Library Library Library Computers
2 Computers Computers Computers Library
3 Online Systems Online Systems Online Systems Online Systems
4 Catering Services Catering Services Catering Services Transport/Parking
5 Transport/Parking Transport/Parking Student Services Catering Services
6 Student Services Student Services Students’ Union Student Services
7 Students’ Union Sporting Facilities Sporting Facilities Sporting Facilities
8 Sporting Facilities Students’ Union Social Activities Students’ Union
9 Finance Services Finance Services Finance Services Accommodation
10 Social Activities Social Activities Transport/Parking Social Activities
11 Accommodation Accommodation Accommodation Finance Services
What’s the Difference? Analysis of variance in satisfaction / importance metrics between Part Time and Full Time students studying at Anglia Ruskin University

116 Networks Issue 19, March 2016
While there was minimal variance in ranking order of ancillary services, mean scores of service importance were lower for PT than FT students, primarily down to the large proportion of students not using services due to perceived relevance in the main.
Both PT and FT students reported a large number of specific examples of ‘critical incidents’ relating to Quality of Teaching, Quality of Feedback, and Response Times from Academics. As noted above, Quality of Teaching in particular was highlighted in both positive and negative aspects, implying this is the most volatile element of the academic study. Drilling down further, a number of key incidents were highlighted from both student groups relating to academic consistency and academic knowledge.
Ancillary services overall appeared to be consistent between student groups. The high quality of library services was regarded as impacting satisfaction positively, whilst catering was regarded as needing improvement. The largest area impacting dissatisfaction was Transport/Parking. However, as discussed previously, this issue would benefit from improvements in managing student expectations, as both positive and negative comments relating to parking were received. Contrary to the findings of Ham and Hayduk (2003), from qualitative feedback specifically, it appears ancillary services do not have a significant impact on overall satisfaction in the main, although specific elements of services do have a small impact (such as Transport/Parking and Catering).
References
Aldridge, S. and Rowley, J., 1998. Measuring customer satisfaction in higher education. Quality Assurance in Education, Vol. 6, No. 4, pp. 197-204.
Anglia Ruskin University, 2015. Student data information. Cambridge, Chelmsford, and Peterborough: Anglia Ruskin University.
Bolton, R. and Drew, J., 1991. A Multistage Model of Customers’ Assessments of Service Quality and Value. Journal of Consumer Research, Vol. 17, No. 4, pp. 375-384.
Brown, R. and Carasso, H., 2013. Everything for Sale? The marketisation of UK Higher Education. Abington: Routledge.
Browne, J., 2010. Securing a sustainable future for higher education: An independent review of higher education funding and students finance in England. [Online] Available at: https://www.gov.uk/government/uploads/system/uploads/attachment_data/file/422565/bis-10-1208-securing-sustainable-higher-education-
browne-report.pdf [Accessed 23 February 2016].
Callender, C., Wilkinson, D. and Mackinon, K., 2006. Part-time students and part-time study in higher education in the UK. Strand 3: A survey of students’ attitudes and experiences of part-time study and its costs 2005/06. [Online] Universities UK. Available at: http://www.universitiesuk.ac.uk/highereducation/Documents/2006/ParttimeStrand3.pdf [Accessed 18 January 2015].
Cronin, J. and Taylor, S., 1992. Measuring Service Quality: A Reexamination and Extension. Journal of Marketing, Vol. 56, No. 3, pp. 55-68. [Online] Available at: http://www.jstor.org/stable/1252296 [Accessed 31 January 2015].
Douglas, J., McClelland, R. and Davies, J., 2008. The development of a conceptual model of student satisfaction with their experience in higher education. Quality Assurance in Education, Vol. 16, No. 1, pp. 19-35.
Fromm, E., 1993. The Art of Being. London: Constable.
HEFCE, 2014. Pressure from all sides: Economic and policy influences on part-time higher education. [Online] HEFCE. Available at: http://www.hefce.ac.uk/media/hefce/content/pubs/2014/201408d/HEFE2014_08d.pdf [Accessed 31 Jan. 2015].
Ham, L. and Hayduk, S., 2003. Gaining competitive advantages in Higher Education: Analyzing the gap between Expectations and Perceptions of Service Quality. International Journal of Value-Based Management, Vol. 16, No. 3, pp. 223-242.
Hussey, J. and Hussey, R., 1997. Business Research. A Practical guide for undergraduate and postgraduate students. London: Macmillan.

Networks Issue 19, March 2016 117
Kandiko, C., 2012. Student expectations and perceptions of higher education. Kings College London. [Online] Available at: http://www.kcl.ac.uk/study/learningteaching/kli/research/student-experience/QAAReport.pdf [Accessed 18 January 2015].
Lamond, J., Proverbs, D. and Wood, T., 2013. What Matters to Built Environment Students. York: Higher Education Academy. [Online] Available at: https://www.heacademy.ac.uk/sites/default/files/built-environment-students.pdf [Accessed 23 February 2016].
Lee, H., Lee, Y. and Yoo, D., 2000. The determinants of perceived service quality and its relationship with satisfaction. Journal of Services Marketing, Vol. 14, No. 3, pp. 217-231.
Molesworth, M., Nixon, E. and Scullion, R., 2009. Having, being and higher education: the marketisation of the university and the transformation of the student into consumer. Teaching in Higher Education, Vol. 14, No. 3, pp. 277-287.
Molesworth, M., Nixon, E. and Scullion, R., 2011. The Marketisation of Higher Education and the Student as Consumer. London: Routledge.
Moro-Egido, A. and Panadés, J., 2008. An Analysis of Student Satisfaction: Full-Time vs. Part-Time Students. Social Indicators Research, Vol. 96, No. 2, pp. 363-378. [Online] Available at: http://link.springer.com/article/10.1007%2Fs11205-009-9482-1 [Accessed 23 January 2015].
National Union of Students, The (NUS), 2011. Part Time Students Briefing. London: National Union of Students.
National Union of Students, The (NUS), 2012. A Manifesto of Partnership. [Online] Available at: http://www.nusconnect.org.uk/resourcehandler/0a02e2e5-197e-4bd3-b7ed- e8ceff3dc0e4/ [Accessed 23 January 2015].
Proverbs, D. G. and Lamond, J., 2008. National Student Survey of building courses: analysis of 2007 survey responses. Unpublished: CHOBE/University of Wolverhampton.
Reay, D., Crozier, G. and Clayton, J., 2010. ‘Fitting in’ or ‘standing out’: working-class students in UK higher education. British Educational Research Journal, Vol. 36, No. 1, pp. 107-124.
Rowley, J., 2003. Designing student feedback questionnaires. Quality Assurance in Education, Vol. 11, No. 3, pp. 142-149.
Sabri, D., 2011. What’s wrong with ‘the student experience’? Discourse: Studies in the Cultural Politics of Education, Vol. 32, No. 5, pp. 657-667.
Townley, G., Katz, J., Wandersman, A., Skiles, B., Schillaci, M. J., Timmerman, B. E. and Mousseau, T. A., 2013. Exploring the Role of Sense of Community in the Undergraduate Transfer Student Experience. Journal of Community Psychology, Vol. 41, No. 3, pp. 277-290.
Yorke, M. and Longden, B., 2008. The experiences of part-time students in higher education: A study from
the UK. [Online] Available at: https://www.heacademy.ac.uk/sites/default/files/part-
time_student_experience_of_he_1.pdf [Accessed 23 February 2016].
What’s the Difference? Analysis of variance in satisfaction / importance metrics between Part Time and Full Time students studying at Anglia Ruskin University