GTmetrix Performance Report - Magedelight · 2019-03-29 · are using page speed in their ranking...
14
Report generated: Test Server Region: Using: PageSpeed Score (96%) YSlow Score (92%) Fully Loaded Time 3.5s Total Page Size 4.35MB Requests 52 How does this affect me? Studies show that users leave a site if it hasn't loaded in 4 seconds; keep your users happy and engaged by providing a fast performing website. As if you didn't need more incentive, Google has announced that they are using page speed in their ranking algorithm. About GTmetrix We can help you develop a faster, more efficient, and all-around improved website experience for your users. We use Google PageSpeed and Yahoo! YSlow to grade your site's performance and provide actionable recommendations to fix these issues. About the Developer GTmetrix is developed by the good folks at GT.net, a Vancouver-based performance hosting company with over 23 years experience in web technology. https://gt.net/ What do these grades mean? This report is an analysis of your site with Google and Yahoo!'s metrics for how to best develop a site for optimized speed. The grades you see represent how well the scanned URL adheres to those rules. Lower grades (C or lower) mean that the page can stand to be faster using better practices and optimizing your settings. What's in this report? This report covers basic to technical analyses on your page. It is categorized under many headings: Executive: Overall score information and Priority Issues History: Graphed history of past performance Waterfall: Graph of your site's loading timeline Technical: In-depth PageSpeed & YSlow information These will provide you with a snapshot of your performance. Performance Report for: http://jewelgo.theme.magedelight.com/ Thu, Mar 28, 2019 3:40 AM -0700 Vancouver, Canada Chrome (Desktop) 62.0.3202.94, PageSpeed 1.15- gt1.2, YSlow 3.1.8 Top 5 Priority Issues Avoid bad requests A (92) AVG SCORE: 98% CONTENT HIGH Optimize the order of styles and scripts A (92) AVG SCORE: 94% CSS/JS HIGH Defer parsing of JavaScript A (96) AVG SCORE: 71% JS HIGH Leverage browser caching A (96) AVG SCORE: 60% SERVER HIGH Specify a cache validator A (98) AVG SCORE: 94% SERVER HIGH The web should be fast. Executive Summary Analyze your site at https://gtmetrix.com Page 1 of 14
Transcript of GTmetrix Performance Report - Magedelight · 2019-03-29 · are using page speed in their ranking...

Report generated:
Test Server Region:
Using:
PageSpeed Score
(96%)
YSlow Score
(92%)
Fully Loaded Time
3.5s
Total Page Size
4.35MB
Requests
52
How does this affect me?
Studies show that users leave a site if it hasn't loaded in 4 seconds; keepyour users happy and engaged by providing a fast performing website.
As if you didn't need more incentive, Google has announced that theyare using page speed in their ranking algorithm.
About GTmetrix
We can help you develop a faster, more efficient, and all-aroundimproved website experience for your users. We use Google PageSpeedand Yahoo! YSlow to grade your site's performance and provideactionable recommendations to fix these issues.
About the Developer
GTmetrix is developed by the good folksat GT.net, a Vancouver-basedperformance hosting company with over23 years experience in web technology.
https://gt.net/
What do these grades mean?This report is an analysis of your site with Google andYahoo!'s metrics for how to best develop a site for optimizedspeed. The grades you see represent how well thescanned URL adheres to those rules.
Lower grades (C or lower) mean that the page can stand tobe faster using better practices and optimizing your settings.
What's in this report?This report covers basic to technical analyses on your page. Itis categorized under many headings:
Executive: Overall score information and Priority IssuesHistory: Graphed history of past performanceWaterfall: Graph of your site's loading timelineTechnical: In-depth PageSpeed & YSlow information
These will provide you with a snapshot of your performance.
Performance Report for:http://jewelgo.theme.magedelight.com/
Thu, Mar 28, 2019 3:40 AM -0700
Vancouver, Canada
Chrome (Desktop) 62.0.3202.94, PageSpeed 1.15-gt1.2, YSlow 3.1.8
Top 5 Priority Issues
Avoid bad requests A (92) AVG SCORE: 98% CONTENT HIGH
Optimize the order of styles and scripts A (92) AVG SCORE: 94% CSS/JS HIGH
Defer parsing of JavaScript A (96) AVG SCORE: 71% JS HIGH
Leverage browser caching A (96) AVG SCORE: 60% SERVER HIGH
Specify a cache validator A (98) AVG SCORE: 94% SERVER HIGH
The web should be fast. Executive Summary
Analyze your site at https://gtmetrix.com Page 1 of 14

HistoryPage load times
Time to First Byte Onload Time Fully Loaded
Page sizes and request counts
Requests HTML Size Total Page Size
PageSpeed and YSlow scores
PageSpeed Score YSlow Score
Mar 2711:00PM
Mar 2711:30PM
Mar 2812:00AM
Mar 2812:30AM
Mar 2801:00AM
Mar 2801:30AM
Mar 2802:00AM
Mar 2802:30AM
Mar 2803:00AM
Mar 2803:30AM
0s
5s
10s
15s
Mar 2711:00PM
Mar 2711:30PM
Mar 2812:00AM
Mar 2812:30AM
Mar 2801:00AM
Mar 2801:30AM
Mar 2802:00AM
Mar 2802:30AM
Mar 2803:00AM
Mar 2803:30AM
977KB
1.91MB
2.86MB
3.81MB
4.77MB
40
45
50
55
60
65
Mar 2711:00PM
Mar 2711:30PM
Mar 2812:00AM
Mar 2812:30AM
Mar 2801:00AM
Mar 2801:30AM
Mar 2802:00AM
Mar 2802:30AM
Mar 2803:00AM
Mar 2803:30AM
70%
75%
80%
85%
90%
95%
100%
History
Analyze your site at https://gtmetrix.com Page 2 of 14

Waterfall Chart
The waterfall chart displays the loading behaviour of your site in your selected browser. It can be used to discover simple issues such as 404's ormore complex issues such as external resources blocking page rendering.
JewelGo-Homepage200 jewelgo.t… 16.8 KB200 d2x22yov… 1.9 KB200 d2x22yov… 82.7 KB404 d2x22yov… 496 B200 d2x22yov… 1.2 KB200 d2x22yov… 7.6 KB200 d2x22yov… 4.5 KB200 d2x22yov… 32.1 KB200 d2x22yov… 2 MB200 d2x22yov… 4.5 KB200 d2x22yov… 3 KB200 d2x22yov… 13.3 KB200 d2x22yov… 47.2 KB200 d2x22yov… 202.9 KB200 d2x22yov… 346.6 KB200 d2x22yov… 329.6 KB200 d2x22yov… 8.6 KB200 d2x22yov… 9.7 KB200 d2x22yov… 6.4 KB200 d2x22yov… 9.7 KB200 d2x22yov… 86.3 KB200 d2x22yov… 187.4 KB200 d2x22yov… 3.3 KB200 d2x22yov… 4 KB200 d2x22yov… 3.7 KB200 d2x22yov… 2.2 KB200 d2x22yov… 3.4 KB200 d2x22yov… 120.6 KB200 d2x22yov… 4.6 KB200 d2x22yov… 4.9 KB200 d2x22yov… 5.4 KB200 d2x22yov… 9.4 KB200 d2x22yov… 14.3 KB200 d2x22yov… 10.9 KB200 d2x22yov… 234.1 KB200 d2x22yov… 3.9 KB200 d2x22yov… 18.2 KB200 d2x22yov… 1.1 KB200 d2x22yov… 14.5 KB200 d2x22yov… 18 KB200 d2x22yov… 17.8 KB200 d2x22yov… 379.8 KB
200 d2x22yov… 18.3 KB200 d2x22yov… 15.8 KB200 d2x22yov… 1.1 KB200 d2x22yov… 908 B200 d2x22yov… 11.2 KB200 jewelgo.t… 957 B200 google.co… 714 B200 d2x22yov… 1.9 KB200 gstatic.co… 90.7 KB200 d2x22yov… 0
1.27s56.9ms94.7ms
54.7ms54.5ms64.3ms63.4ms75.3ms
333.5ms72.1ms
149.8ms159.5ms170.5ms192.1ms
234.1ms251ms263.3ms273.2ms282.2ms293.3ms328.2ms340.9ms349.1ms360.2ms369.2ms
452.9ms179.3ms190.8ms199.6ms208.1ms217.4ms226.4ms235.2ms243.3ms252.9ms
21.2ms20.4ms11.7ms20.5ms20.1ms20ms
13.3ms
11.3ms8.4ms
10.3ms10.8ms9ms
413.7ms59.2ms15.5ms
67.3ms0ms
/calendar.min.cssstyles-m.min.cssswatches.min.csspopup.min.cssfont-awesome.m…animate.min.cssstyles-l.min.css90159831aba051…styles.csslogo.svglogo.j.pngmenu-right-hot-c…subscribe-now-po…banner01.pngbanner02.png215x215category…215x215category…215x215category…215x215category…spotlight-bg.jpgspotlight-ring.png5.jpg4.jpg3.jpgprint.min.css1.jpgring.pnglogo01.pnglogo02.pnglogo03.pnglogo04.pngdefault_brand.pngfooter-logo.pngfooter-diamond.p…Blank-Theme-Ico…opensans-400.wo…header-bg.jpgmd-ico-jewelgo.t…opensans-700.wo…opensans-300.wo…menu-bg.png
opensans-600.wo…loader-2.giffooter-bg.jpgjs-translation.jsonloader-1.gifload?sections=ca…api.js?onload=glo…favicon.icorecaptcha__en.jsfavicon.ico
Waterfall Chart
Analyze your site at https://gtmetrix.com Page 3 of 14

(10.9 MB Uncompressed)52 Requests 4.4 MB 3.51s (onload: 2.96s)
Waterfall Chart
Analyze your site at https://gtmetrix.com Page 4 of 14

Page Load TimingsRUM Speed Index: 1,946
Redirect0ms
Connect187ms
Backend0.9s
TTFB1.1s
First paint1.9s
Contentful paint1.9s
DOM int.2.6s
DOM loaded2.6s (113ms)
Onload3.0s (5ms)
This is the time spent redirecting URLs before the final HTML page is loaded. Common redirectsinclude:
Redirect from a non-www to www (eg. example.com to www.example.com)Redirect to a secure URL (eg. http:// to https://)Redirect to set cookiesRedirect to a mobile version of the site
Some sites may even perform a chain of multiple redirects (eg. non-www to www, then to a secureURL). This timing is the total of all this time that's spent redirecting, or 0 if no redirects occurred.
In the Waterfall Chart, Redirect duration consists of the time from the beginning of the test until just before we start the request of the final HTMLpage (when we receive the first 200 OK response).
During this time, the browser screen is blank! Ensure that this duration is kept to short by minimizing your redirects.
Once any redirects have completed, Connection duration is measured. This is the time spentconnecting to the server to make the request to the page.
Technically speaking, this duration is a combination of the blocked time, DNS time, connect time andsending time of the request (rather than just connect time). We've combined those components into asingle Connection duration to simplify things (as most of these times are usually small).
In the Waterfall Chart, Connection duration consists of everything up to and including the "Sending"time in the final HTML page request (the first 200 OK response).
During this time, the browser screen is still blank! Various causes could contribute to this, including a slow/problematic connection between thetest server and site or slow response times from the site.
Once the connection is complete and the request is made, the server needs to generate a responsefor the page. The time it takes to generate the response is known as the Backend duration.
In the Waterfall Chart, Backend duration consists of purple waiting time in the page request.
There are a number of reasons why Backend duration could be slow. We cover this is our "Why is mypage slow" article.
Redirect duration
Connection duration
Backend duration
Page Load Timings
Analyze your site at https://gtmetrix.com Page 5 of 14

Time to First Byte (TTFB) is the total amount of time spent to receive the first byte of the responseonce it has been requested. It is the sum of "Redirect duration" + "Connection duration" + "Backendduration". This metric is one of the key indicators of web performance.
In the Waterfall Chart, it is calculated at the start of the test until just before receiving on the pagerequest and represented by the orange line.
Some ways to improve the TTFB include: optimizing application code, implementing caching, fine-tuning your web server configuration, or upgrading server hardware.
First paint time is the first point at which the browser does any sort of rendering on the page.Depending on the structure of the page, this first paint could just be displaying the background colour(including white), or it could be a majority of the page being rendered.
In the Waterfall Chart, it is represented by the green line.
This timing is of significance because until this point, the browser will have only shown a blank pageand this change gives the user an indication that the page is loading. However, we don't know howmuch of the page was rendered with this paint, so having a early first paint doesn't necessarily
indicate a fast loading page.
If the browser does not perform a paint (ie. the html results in an blank page), then the paint timings may be missing.
Time to First Byte (TTFB)
First paint time
Page Load Timings
Analyze your site at https://gtmetrix.com Page 6 of 14

First Contentful Paint is triggered when any content is painted - i.e. something defined in the DOM(Document Object Model). This could be text, an image or canvas render.
This timing aims to be more representative of your user's experience, as it flags when actual contenthas been loaded in the page, and not just any change - but it may often be the same time as FirstPaint.
Because the focus is on content, the idea is that this metric gives you an idea of when your userreceives consumable information (text, visuals, etc) - much more useful for performance assessment
than when a background has changed or a style has been applied.
If the browser does not perform a paint (ie. the html results in an blank page), then the paint timings may be missing.
DOM interactive time is the point at which the browser has finished loading and parsing HTML, andthe DOM (Document Object Model) has been built. The DOM is how the browser internally structuresthe HTML so that it can render it.
DOM interactive time isn't marked in the Waterfall Chart as it's usually very close in timing to DOMcontent loaded.
DOM content loaded time (DOM loaded or DOM ready for short) is the point at which the DOM isready (ie. DOM interactive) and there are no stylesheets blocking JavaScript execution.
If there are no stylesheets blocking JavaScript execution and there is no parser blocking JavaScript,then this will be the same as DOM interactive time.
In the Waterfall Chart, it is represented by the blue line.
The time in brackets is the time spent executing JavaScript triggered by the DOM content loadedevent. Many JavaScript frameworks use this event as a starting point to begin execution of their code.
Since this event is often used by JavaScript as the starting point and delays in this event mean delays in rendering, it's important to make surethat style and script order is optimized and that parsing of JavaScript is deferred.
Onload time occurs when the processing of the page is complete and all the resources on the page(images, CSS, etc.) have finished downloading. This is also the same time that DOM complete occursand the JavaScript window.onload event fires.
Note that there may be JavaScript that initiates subsequent requests for more resources, hence thereason why Fully loaded timing is preferred.
In the Waterfall Chart, it is represented by the red line.
The time in brackets is the time spent executing JavaScript triggered by the Onload event.
Note that Onload time was the previous default for when to stop the test prior to Feburary 8th, 2017.
First contentful paint time
DOM interactive time
DOM content loaded time
Onload time
Page Load Timings
Analyze your site at https://gtmetrix.com Page 7 of 14

PageSpeed RecommendationsRECOMMENDATION GRADE RELATIVE TYPE PRIORITY
Avoid bad requests A (92) AVG SCORE: 98% CONTENT HIGH
The following requests are returning 404/410 responses. Either fix the broken links, or remove the references to the non-existent resources.
http://d2x22yov9ava8w.cloudfront.net/static/version1553250341/frontend/Magedelight/JewelGo/en_US/Magento_Swatches/css/swatches.min.css
Optimize the order of styles and scripts A (92) AVG SCORE: 94% CSS/JS HIGH
The following external CSS files were included after an external JavaScript file in http://jewelgo.theme.magedelight.com/. To ensure CSSfiles are downloaded in parallel, always include external CSS before external JavaScript.
http://d2x22yov9ava8w.cloudfront.net/media/styles.css
Defer parsing of JavaScript A (96) AVG SCORE: 71% JS HIGH
50.0KiB of JavaScript is parsed during initial page load. Defer parsing JavaScript to reduce blocking of page rendering.
http://d2x22yov9ava8w.cloudfront.net/static/version1553250341/_cache/merged/90159831aba0517d7b8b58c2675addf9.min.js (42.8KiB)http://jewelgo.theme.magedelight.com/ (7.2KiB of inline JavaScript)
Leverage browser caching A (96) AVG SCORE: 60% SERVER HIGH
Leverage browser caching for the following cacheable resources:
https://www.google.com/recaptcha/api.js?onload=globalOnRecaptchaOnLoadCallback&render=explicit (5 minutes)
Specify a cache validator A (98) AVG SCORE: 94% SERVER HIGH
The following resources are missing a cache validator. Resources that do not specify a cache validator cannot be refreshed efficiently.Specify a Last-Modified or ETag header to enable cache validation for the following resources:
https://www.google.com/recaptcha/api.js?onload=globalOnRecaptchaOnLoadCallback&render=explicit
Minify HTML A (98) AVG SCORE: 98% CONTENT LOW
Minify HTML for the following resources to reduce their size by 2.4KiB (16% reduction).
Minifying http://jewelgo.theme.magedelight.com/ could save 2.4KiB (16% reduction) after compression. See optimized version.
Specify image dimensions A (99) AVG SCORE: 98% IMAGES MEDIUM
The following image(s) are missing width and/or height attributes.
PageSpeed Recommendations
Analyze your site at https://gtmetrix.com Page 8 of 14

http://d2x22yov9ava8w.cloudfront.net/media/bannerslider/banner01.png (Dimensions: 601 x 677)http://d2x22yov9ava8w.cloudfront.net/media/bannerslider/banner02.png (Dimensions: 601 x 677)http://d2x22yov9ava8w.cloudfront.net/static/version1553250341/frontend/Magedelight/JewelGo/en_US/Magedelight_GuideTheme/images/logo.svghttp://jewelgo.theme.magedelight.com/
Minify JavaScript A (99) AVG SCORE: 89% JS HIGH
Minify JavaScript for the following resources to reduce their size by 1.2KiB (1% reduction).
Minifying https://www.gstatic.com/recaptcha/api2/v1552285980763/recaptcha__en.js could save 1.0KiB (2% reduction) after compression. See optimized version.Minifying http://d2x22yov9ava8w.cloudfront.net/static/version1553250341/_cache/merged/90159831aba0517d7b8b58c2675addf9.min.js could save 160B(1% reduction) after compression. See optimized version.Minifying https://www.google.com/recaptcha/api.js?onload=globalOnRecaptchaOnLoadCallback&render=explicit could save 42B (9% reduction) aftercompression. See optimized version.
Optimize images A (99) AVG SCORE: 70% IMAGES HIGH
Optimize the following images to reduce their size by 1.2KiB (8% reduction).
Losslessly compressing http://d2x22yov9ava8w.cloudfront.net/media/catalog/category/cache/215x215category03.jpg could save 281B (5% reduction). See optimized version.Losslessly compressing http://d2x22yov9ava8w.cloudfront.net/media/md_testimonial/resized/100x100/5.jpg could save 281B (11% reduction). See optimized version.Losslessly compressing http://d2x22yov9ava8w.cloudfront.net/media/md_testimonial/resized/100x100/1.jpg could save 276B (11% reduction). See optimized version.Losslessly compressing http://d2x22yov9ava8w.cloudfront.net/media/md_testimonial/resized/100x100/3.jpg could save 208B (7% reduction). See optimized version.Losslessly compressing http://d2x22yov9ava8w.cloudfront.net/media/md_testimonial/resized/100x100/4.jpg could save 197B (6% reduction). See optimized version.
Minify CSS A (99) AVG SCORE: 95% CSS HIGH
Minify CSS for the following resources to reduce their size by 241B (3% reduction).
Minifying http://d2x22yov9ava8w.cloudfront.net/static/version1553250341/frontend/Magedelight/JewelGo/en_US/Magedelight_Testimonial/css/font-awesome/css/font-awesome.min.css could save 238B (4% reduction) after compression. See optimized version.Minifying http://d2x22yov9ava8w.cloudfront.net/media/styles.css could save 3B (1% reduction) after compression. See optimized version.
Enable gzip compression A (99) AVG SCORE: 82% SERVER HIGH
Enable compression for the following resources to reduce their transfer size by 203B (49% reduction).
Compressing http://d2x22yov9ava8w.cloudfront.net/static/version1553250341/frontend/Magedelight/JewelGo/en_US/Magedelight_Popup/css/popup.min.css could save 203B (49% reduction).
Avoid landing page redirects A (100) AVG SCORE: 98% SERVER HIGH
You scored 100% on this recommendation - nothing to do here!
PageSpeed Recommendations
Analyze your site at https://gtmetrix.com Page 9 of 14
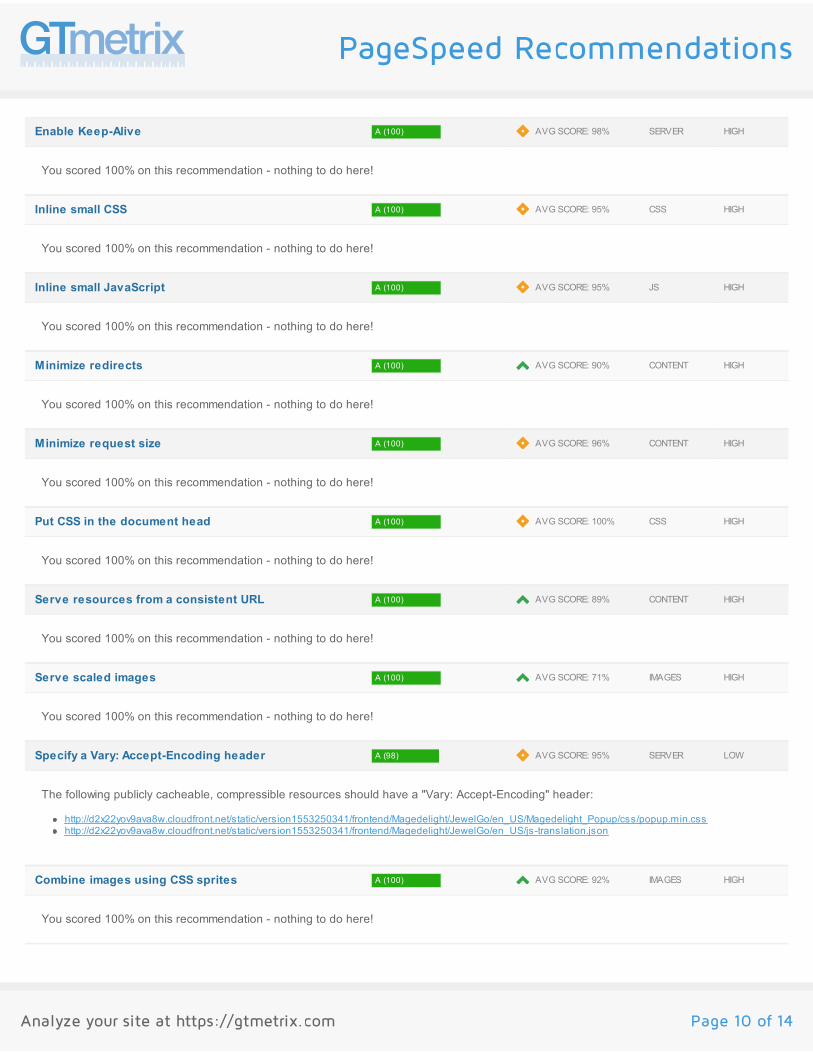
Enable Keep-Alive A (100) AVG SCORE: 98% SERVER HIGH
You scored 100% on this recommendation - nothing to do here!
Inline small CSS A (100) AVG SCORE: 95% CSS HIGH
You scored 100% on this recommendation - nothing to do here!
Inline small JavaScript A (100) AVG SCORE: 95% JS HIGH
You scored 100% on this recommendation - nothing to do here!
Minimize redirects A (100) AVG SCORE: 90% CONTENT HIGH
You scored 100% on this recommendation - nothing to do here!
Minimize request size A (100) AVG SCORE: 96% CONTENT HIGH
You scored 100% on this recommendation - nothing to do here!
Put CSS in the document head A (100) AVG SCORE: 100% CSS HIGH
You scored 100% on this recommendation - nothing to do here!
Serve resources from a consistent URL A (100) AVG SCORE: 89% CONTENT HIGH
You scored 100% on this recommendation - nothing to do here!
Serve scaled images A (100) AVG SCORE: 71% IMAGES HIGH
You scored 100% on this recommendation - nothing to do here!
Specify a Vary: Accept-Encoding header A (98) AVG SCORE: 95% SERVER LOW
The following publicly cacheable, compressible resources should have a "Vary: Accept-Encoding" header:
http://d2x22yov9ava8w.cloudfront.net/static/version1553250341/frontend/Magedelight/JewelGo/en_US/Magedelight_Popup/css/popup.min.csshttp://d2x22yov9ava8w.cloudfront.net/static/version1553250341/frontend/Magedelight/JewelGo/en_US/js-translation.json
Combine images using CSS sprites A (100) AVG SCORE: 92% IMAGES HIGH
You scored 100% on this recommendation - nothing to do here!
PageSpeed Recommendations
Analyze your site at https://gtmetrix.com Page 10 of 14

Avoid CSS @import A (100) AVG SCORE: 98% CSS MEDIUM
You scored 100% on this recommendation - nothing to do here!
Prefer asynchronous resources A (100) AVG SCORE: 100% JS MEDIUM
You scored 100% on this recommendation - nothing to do here!
Specify a character set early A (100) AVG SCORE: 100% CONTENT MEDIUM
You scored 100% on this recommendation - nothing to do here!
Avoid a character set in the meta tag A (100) AVG SCORE: 100% CONTENT LOW
You scored 100% on this recommendation - nothing to do here!
PageSpeed Recommendations
Analyze your site at https://gtmetrix.com Page 11 of 14

YSlow RecommendationsRECOMMENDATION GRADE RELATIVE TYPE PRIORITY
Minify JavaScript and CSS F (0) AVG SCORE: 72% CSS/JS MEDIUM
There are 16 components that can be minified
inline <script> tag #2inline <script> tag #3inline <script> tag #4inline <script> tag #5inline <script> tag #6inline <script> tag #7inline <script> tag #11inline <script> tag #14inline <script> tag #15inline <script> tag #16inline <script> tag #23inline <script> tag #25inline <script> tag #26inline <script> tag #27inline <script> tag #28inline <script> tag #29
Make fewer HTTP requests C (76) AVG SCORE: 31% CONTENT HIGH
This page has 8 external stylesheets. Try combining them into one.
Avoid HTTP 404 (Not Found) error A (95) AVG SCORE: 98% CONTENT MEDIUM
There is 1 request that is 404 Not Found
http://d2x22yov9ava8w.cloudfront.net/static/version1553250341/frontend/Magedelight/JewelGo/en_US/Magento_Swatches/css/swatches.min.css
Add Expires headers A (100) AVG SCORE: 27% SERVER HIGH
You scored 100% on this recommendation - nothing to do here!
Compress components with gzip A (100) AVG SCORE: 86% SERVER HIGH
You scored 100% on this recommendation - nothing to do here!
Use a Content Delivery Network (CDN) A (100) AVG SCORE: 23% SERVER MEDIUM
Using a CDN YSlow doesn't recognize? Specify your CDNs in your User Settings.
Avoid URL redirects A (100) AVG SCORE: 89% CONTENT MEDIUM
You scored 100% on this recommendation - nothing to do here!
YSlow Recommendations
Analyze your site at https://gtmetrix.com Page 12 of 14

Make AJAX cacheable A (100) AVG SCORE: 100% JS MEDIUM
You scored 100% on this recommendation - nothing to do here!
Remove duplicate JavaScript and CSS A (100) AVG SCORE: 100% CSS/JS MEDIUM
You scored 100% on this recommendation - nothing to do here!
Avoid AlphaImageLoader filter A (100) AVG SCORE: 99% CSS MEDIUM
You scored 100% on this recommendation - nothing to do here!
Reduce the number of DOM elements A (100) AVG SCORE: 92% CONTENT LOW
You scored 100% on this recommendation - nothing to do here!
Use cookie-free domains A (100) AVG SCORE: 53% COOKIE LOW
You scored 100% on this recommendation - nothing to do here!
Use GET for AJAX requests A (100) AVG SCORE: 100% JS LOW
You scored 100% on this recommendation - nothing to do here!
Avoid CSS expressions A (100) AVG SCORE: 99% CSS LOW
You scored 100% on this recommendation - nothing to do here!
Reduce DNS lookups A (100) AVG SCORE: 70% CONTENT LOW
jewelgo.theme.magedelight.com: 2 components, 102.6K (16.8K GZip)d2x22yov9ava8w.cloudfront.net: 40 components, 10996.6K (2220.2K GZip)www.google.com: 1 component, 0.8K (0.4K GZip)www.gstatic.com: 1 component, 266.9K (92.6K GZip)
Reduce cookie size A (100) AVG SCORE: 100% COOKIE LOW
You scored 100% on this recommendation - nothing to do here!
Make favicon small and cacheable A (100) AVG SCORE: 100% IMAGES LOW
You scored 100% on this recommendation - nothing to do here!
Configure entity tags (ETags) A (100) AVG SCORE: 94% SERVER LOW
YSlow Recommendations
Analyze your site at https://gtmetrix.com Page 13 of 14

You scored 100% on this recommendation - nothing to do here!
Make JavaScript and CSS external (n/a) CSS/JS MEDIUM
Only consider this if your property is a common user home page.
There is a total of 29 inline scripts
YSlow Recommendations
Analyze your site at https://gtmetrix.com Page 14 of 14