GSBS Protons 2 - uthgsbsmedphys.org Protons 2.pdfGSBS Protons 2 A neutron walks into ... practice...
63
4/21/10 1 GSBS Protons 2 A neutron walks into a bar joke A proton walks into the same bar joke CT ECLIPSE Anderson Filter EVERCORE GE AWW MOSAIQ HITACHI DELIVERY HITACHI MACHINE SHOP MILLING Machines ISIS PIAS DR UNITS Information Flow for Proton Treatments Understanding information flow is an important responsibility of the clinical physicist.
Transcript of GSBS Protons 2 - uthgsbsmedphys.org Protons 2.pdfGSBS Protons 2 A neutron walks into ... practice...

4/21/10
1
GSBS Protons 2
A neutron walks into a bar joke A proton walks into the same bar
joke
CT ECLIPSE Anderson Filter
EVERCORE
GE
AWW
MOSAIQ HITACHI
DELIVERY
HITACHI MACHINE
SHOP
MILLING
Machines
ISIS PIAS
DR UNITS
Information Flow for Proton Treatments
Understanding information flow is an
important responsibility of the clinical physicist.

4/21/10
2
Scattering Dosimetry Parameters 144 hours beam time
• Per energy, assume that there are approximately 350 point measurements, which require 1 plus minutes per point to measure for an approximate total of 480 minutes to perform.
• 6 hours/energy x 8 energies x 3 rooms is 144 hours of beam time for dosimetric parameter measurements.

4/21/10
3
Scattering Dosimetry Parameters
• Relative Output Factors for different energies and different snouts from the calibration condition
• SOBP factors, i.e. changes in output as SOBP width changes
• Range Shifter factors, i.e. changes in the output as the range is decreased using range shifters
• Off-axis factors (both along and perpendicular to path of beam)
• Inverse Square factors MU = Dwater,nc / (ROF.SOBPF.RSF.SOBPOCF.OCR.FSF.ISF)
Reference SOBPs
• 250 MeV 10 cm SOBP • 225 MeV 10 cm SOBP • 200 MeV 10 cm SOBP • 180 MeV 10 cm SOBP • 160 MeV 10 cm SOBP • 140 MeV 6 cm SOBP • 120 MeV 4 cm SOBP • 100 MeV 3 cm SOBP

4/21/10
4
Relative Output Factors Medium Snout
• 250 MeV 1.000 • 225 MeV 0.978 • 200 MeV 0.922 • 180 MeV 0.881 • 160 MeV 0.802 • 140 MeV 0.853* • 120 MeV 0.940* • 100 MeV 0.911* • * Reference SOBP changed.
Relative Output Factors Large Snout
• 250 MeV 1.000 Medium Snout • 250 MeV 1.092 Large Snout • 225 MeV 1.046 Large Snout • 200 MeV 0.967 Large Snout • 180 MeV 0.897 Large Snout • 160 MeV 0.827 Large Snout

4/21/10
5
SOBP Factors – Large Snout SOBP (cm)
250 MeV 25.0 cm
225 MeV 20.6 cm
200 MeV 16.5 cm
180 MeV 13.7 cm
2 1.494 1.535 1.556 1.638 4 1.267 1.285 1.299 1.336 6 1.154 1.150 1.158 1.176 8 1.086 1.062 1.073 1.072 10 1 1 1 1 12 0.962 0.949 0.938 0.937 14 0.925 0.916 0.881 16 0.892 0.872 0.832
SOBP Factors Gantry 2 Large Snout
SOBP 160 MeV 11.0 cm
140 MeV 10.0 cm
120 MeV 6.4 cm
2 cm 1.748 1.407 1.289
4 cm 1.404 1.141 1.000
6 cm 1.224 1.000 0.809
8 cm 1.100 0.903
10 cm 1.000

4/21/10
6
Range Shifter (RS) Factors Medium Snout
RS cm 250 MeV
225 MeV
200 MeV
180 MeV
160 MeV
0 1 1 1 1 1 0.5 0.998 0.995 0.991 0.988 0.981 1 0.996 0.990 0.982 0.975 0.962 1.5 0.995 0.985 0.973 0.963 0.943 2 0.990 0.980 0.964 0.950 0.924 2.5 0.984 0.974 0.953 0.935 0.900 3 0.978 0.969 0.919 3.5 0.973 0.960 4 0.970 0.951
Range Shifter (RS) Factors Large Snout
RS cm 250 MeV
225 MeV
200 MeV
180 MeV
160 MeV
0 1 1 1 1 1 0.5 0.993 0.990 0.987 0.984 0.975 1 0.987 0.980 0.975 0.966 0.951 1.5 0.981 0.974 0.963 0.945 0.927 2 0.976 0.968 0.951 0.924 0.894 2.5 0.968 0.959 0.941 0.904 0.894 3 0.957 0.951 3.5 0.946 0.933 4 0.936 0.915

4/21/10
7
Gantry at 270 degrees – Couch Centered
Gantry at Zero Degrees Couch to the Side

4/21/10
8
Commissioning Equipment
• PTW scanner – 4 seconds per point
• TG 51 tanks with PTW TN30013 and Markus chambers.
• Other water tanks • Solid water • EBT and EDR 2 film • Special Jigs
Farmer Type Local Standards PTW TN30013
• Typical calibration factor: 5.441 x 10⁷ Gy/C
• Vented sensitive volume of 0.6 cm3
• Suitable as therapy chamber for use in water
• Flat energy response

4/21/10
9
PTW Waterproof Farmer Chamber • The 0.6 cm3 PTW Farmer chamber type 30013 is a
waterproof standard chamber for absolute photon and electron dosimetry with therapy dosimeters to be used in water or in solid-state material. The nominal photon energy range is from 30 kV to 50 MV, the electron energy range is from 6 MeV to 50 MeV. This chamber type is of rugged construction, since the wall material is graphite with a protective acrylic cover and the electrode is made of aluminum. The guard ring is designed up to the measuring volume. The chamber is supplied with a cable of 1m length. Different connector types are available. A calibration certificate for calibration in absorbed dose to water or air kerma is included with each chamber. Air density correction is required for each measurement.
Parallel Plate Chambers • PTW TN34045 (0.02 cc
polyethylene-graphite window) Typical factor: 1.349 x 10⁹ Gy/C
• PTW Bragg Peak Chamber (8 cm diameter, 10.5 cc, 0.411 g/cm2 front window. Typical factor: 3.225 x 10⁸ Gy/C

4/21/10
10
Advanced Markus Chamber • The Advanced Markus chamber1 is a further development of the
classic Markus chamber, featuring a wide guard ring design to avoid perturbation effects by reducing the influence of scattered radiation from the housing. Since the outer shape is identical with the Markus chamber, all existing Markus chamber phantom plates and adapters can be used with the Advanced Markus chamber. The small sensitive volume makes the chamber ideal for dose distribution measurements in a water phantom, giving a good spatial resolution. The chamber features a flat energy response within the nominal energy range from 2 MeV to 45 MeV. With the very thin membrane of only 0.03 mm polyethylene, the chamber is suitable for use in solid state phantoms. The chamber comes with a protective acrylic cover of 0.87 mm thickness (1 mm water equivalence) for use in water. A calibration certificate with a 60Co calibration factor given in absorbed dose to water is included. Air density correction is required for each measurement. A radioactive check device is available as an option. The chamber cable length is 1.05 m.
Bragg Peak Chamber • The Bragg peak chambers are designed to measure the exact
location of the Bragg peak in therapy proton beams. The large diameters of the chambers allow the measurement of the complete proton beam diameter (non-scanned) including the scattered protons. The chambers are waterproof and consequently can either be used in air behind a water column or in a water phantom. In water, both Bragg peak chambers can be used for measurements of horizontal beams. Due to the thicker entrance and exit windows, the 34070 Bragg peak chamber can additionally be used in vertical beams where measurements are performed in different water depths. The cable length is 2.5 m. The Bragg peak chamber 34070 can also be used as a large area chamber for photon measurement. The large entrance window with a diameter of 84 mm makes the chamber suitable for the measurement of the dose area product of narrow photon beams.

4/21/10
11
Proton Beam Calibrations
A brief history (based upon an article by Medin et al., PMB 45 (2000) 3195-3211
Clinical proton beam dosimetry
• Prior to 1986 – there were no national or international recommendations.
• 1986 - AAPM TG 20 Report – AAPM Report 16 – Protocol for heavy charged-particle therapy beam dosimetry
• 1991 European Clinical Heavy Particle Dosimetry Group (ECHED): Code of practice for clinical proton dosimetry.

4/21/10
12
ECHED Code of Practice
• More extensive data provided • Formalism on the use of tissue-equivalent
(A-150 plastic) ionization chambers • Worksheet with explicit descriptions on
how to perform the dosimetry measurements.
• 1994 update with ICRU Report 49 stopping powers.
ICRU 59 - 1998
• Clinical Proton Dosimetry Part 1: Beam Production, Beam Delivery and Measurement of Absorbed Dose
• Part 2 is still being developed. • The first world wide attempt to standardize
clinical proton dosimetry.

4/21/10
13
ICRU 59
• Diminished the role of Faraday Cups and calorimeters, as compared to earlier protocols.
• The first choice of a reference dosimeter for absolute dosimetry is a thimble ionization chamber calibrated in a Co-60 beam in terms of: – Either air kerma or exposure – Or absorbed dose to water
IAEA TRS-398
• Absorbed Dose Determination in External Beam Radiotherapy: An International Code of Practice for Dosimetry based on Standards of Absorbed Dose to Water.
• Published by the IAEA on behalf of IAEA, WHO, PAHO, and ESTRO.
• Authors are mainly from Europe but also Japan, New Zealand, and the US (Saiful Huq)

4/21/10
14
IAEA 398 Chapters
• 1. Introduction • 2. Framework • 3. N D,w Based Formalism • 4. Implementation • 5. Code of Practice for Cobalt-60 • 6. Code of Practice for High Energy
Photon Beams
IAEA 398 Chapters
• 7. Code of Practice for High Energy Electron Beams
• 8. Code of Practice for Low Energy Kilovoltage X-Ray Beams
• 9. Code of Practice for Medium Energy Kilovoltage X-Ray Beams
• 10. Code of Practice for Proton Beams • 11. Code of Practice for Heavy-Ion Beams

4/21/10
15
IAEA 398 Appendicies
• Appendix A. Relation between N k and N D,w based upon codes of practice
• Appendix B. Calculation of k Q,Q0 and its uncertainty
• Appendix C. Photon Beam Quality Specification
• Appendix D. Expression of Uncertainties
Medin paper conclusions
• There is a discrepancy between the fundamental quantities W air and w air , as adopted in ICRU 59 and IAEA 398.
• The difference in the recommended ratio wair/Wair is as large as 2.3%. 0.6% of this is
due to ambient air (ICRU) and dry air (IAEA). The remaining discrepancy is due to the different numerical procedure used to determine wair

4/21/10
16
Medin paper conclusions
• Stopping power ratios, water-to-air, in 398 are based upon Monte Carlo calculations, including the effect of secondary electrons and nuclear inelastic collisions.
• These may differ up to 0.5%, as compared to ICRU 59, for the proton energies studied.
Medin paper conclusions
• ICRU 59 does not take into account the effect of the difference in build-up cap material and chamber wall material at the calibration beam quality (Co-60), in the case of air kerma based calibrations. This can introduce errors of approximately 1%.

4/21/10
17
Medin paper conclusions
• ICRU 59 does not include correction factors for ionization chamber perturbation effects, which for Co-60, which is in the denominator of KQ.
• These can be significant – 3% for the NE 2571 chamber and the Capintec PR-05 chamber.
Medin paper conclusions
• When the absorbed dose to water is determined in the proton beam, some of the differences cancel out.
• The final difference in calculated k Q factors varies between –1.5% and + 2.6%, depending upon the proton beam quality and chamber type.

4/21/10
18
Recommended wp/WQ Values in air from different protocols
• Protocol Value Date • AAPM 34.3 + 4.0% 1986
• ICRU 59 34.8 + 2.0% 1998
• IAEA 398 34.23 + 0.4% 2000
Reference Conditions for the Determination of Proton Beam Quality (Rres)
IAEA 398 Table 10.I • Phantom material • Chamber type
• Reference point of chamber
• Water • Cylindrical and plane-
parallel • Cylindrical: On the central
axis at the center of the cavity volume
• Plane-parallel: inner surface of the window at its center

4/21/10
19
Reference Conditions for the Determination of Proton Beam Quality (Rres)
IAEA 398 Table 10.I • Position of reference
point of chamber • SSD
• Field size at the phantom surface
• At the point of interest
• Clinical treatment distance
• 10 cm x 10 cm – for small field applications, 10 cm x 10 cm or the largest field available.
Reference Conditions for the Determination of Proton Beam Quality (Rres)
IAEA 398 Table 10.II • Phantom material • Chamber type
• Measurement depth • …
• Water • For Rres > 0.5 g cm-2,
cylindrical and plane parallel
• For Rres < 0.5 g cm-2, plane-parallel
• Middle of SOBP • …

4/21/10
20
PTC-H Statement of Calibration
• For a 250 MeV beam of protons, for a 10 cm x 10 cm using the medium snout, at the center of a 10 cm SOBP (which will be at a depth of approximately 24 cm) at a TSD of 246 cm, 1 MU will equal 1 cGy (water).
• This will put the point of calibration at approximately 270 cm, the nominal isocenter distance.
Spencer-Attix (=10 keV) stopping-power ratios, water to air, for clinical proton beams as a function of the beam quality index Rres. The curve is a fit to mono-energetic stopping-power ratios calculated by Medin and Andreo using the Monte-Carlo code PETRA. The data include the transport of secondary electrons and nuclear inelastic processes, and the basic proton stopping-powers are taken from ICRU Report 49.

4/21/10
21
Calculated values of kQ for various cylindrical and plan-parallel ionization chambers commonly used for reference dosimetry, as a function of proton beam quality Q (Rres).
Percentage depth-dose distribution for a modulated proton beam. Indicated on the figure are the reference depth Zref (middle of the SOBP), the residual range at Zref used to specify the quality of the beam, Rres and the practical range Rp.

4/21/10
22
IAEA Dosimeter reading and correction for influence
quantities
IAEA Dosimeter reading and correction for influence
quantities • M1 Ratio of dosimetry reading in nC and
MU’s • K T,P is the normal factor that we are all
used to.

4/21/10
23
IAEA Dosimeter reading and correction for influence
quantities
IAEA Dosimeter reading and correction for influence quantities
• K recom or k s
• For pulsed beams, IAEA 398 recommends that the correction factor be derived using the two-voltage method. The recombination factor k s at the normal operating voltage V1 is obtained from:

4/21/10
24
IAEA 398: Absorbed dose to water at reference dept, z ref
• The absorbed dose calibration of monitor at z ref is:
Percentage depth-dose distribution for a modulated proton beam. Indicated on the figure are the reference depth Zref (middle of the SOBP), the residual range at Zref used to specify the quality of the beam, Rres and the practical range Rp.

4/21/10
25
Definitions
• Z ref is the middle of the SOBP • R p is the practical range – the depth of the
10% distal relative dose curve • R res is the distance from R p to Z ref
IAEA 398 10.2.2
• In horizontal beams, the window of the phantom should be made of plastic and of thickness twin between 0.2 cm and 0.5 cm.
• The water equivalent thickness (in g cm-2) of the phantom window should be taken into account when evaluating the depth at which the chamber is to be positioned.

4/21/10
26
IAEA 398 10.2.2
• For non-waterproofed chambers, a waterproofing sleeve should be used, made of PMMA, and preferably not thicker than 1.0 mm.
• The air gap between the chamber wall and the waterproofing sleeve should be sufficient (0.1 mm to 0.3 mm) to allow the air pressure in the chamber to equilibrate.
IAEA 398 10.3.1 Beam Quality Index
• R res is chosen as the beam quality index. • The residual range R res (in g cm-2) at a
measurement depth z is defined as R res = Rp – z
Where z is the depth of measurement. For protons, the quality Q is not unique for a
particular beam, but is also determined by the reference depth z ref chosen for measurement

4/21/10
27
IAEA 398 10.3.2 Measurement of Beam Quality
• The residual range R res should be derived from a measured depth-dose distribution, as shown in Table 10.1.
• Water, cylindrical or plane-parallel, 10 cm x 10 cm, etc.
• Water should be 5 cm beyond all 4 sides of the largest field size and 5 g cm-2 beyond the maximum depth
Local Standard Chambers
• PTW 30013 S/N 1469 5.439 107 Gy/C
• PTW 30013 S/N 1831 5.446 107 Gy/C
• Markus S/N 300 1.350 x 10⁹ Gy/C
• Electrometer: Dose 1 Dosimeter • Scanditronix/Wellhofer 1.001kelec

4/21/10
28
Calibration Conditions
• Unit F2 Nominal Energy: 250 MeV • Practical Range: 28.5 cm • Field size: 10 cm x 10 cm • Reference SSD: 247.0 cm • Depth of Chamber: 23.5 cm • Width of SOBP: 10 cm • Beam quality, Q (Rres) 5 g cm-2
Readings as a function of depth 10 cm SOBP, Range 28.5 cm
Chamber 1469
• Depth Reading • 22.5 cm 5.849 nC • 23.5 cm 5.875 nC • 24.5 cm 5.879 nC
• Note: Depth is not a critical factor.

4/21/10
29
End Effect in Air Chamber plus Build-Up Cap
Classic Techniques
• End effect is approximately 0.20 MU.
• Not clear why we measured in air.
IAEA Dosimeter reading and correction for influence
quantities
• MQ = 0.2374 nC/MU x 0.994 x 1.001 x 1.0 x 1.0 = 0.2337 nC/MU

4/21/10
30
IAEA 398: Absorbed dose to water at reference dept, z ref
• The absorbed dose calibration of monitor at z ref is:
Calculated values of kQ for various cylindrical and plan-parallel ionization chambers commonly used for reference dosimetry, as a function of proton beam quality Q (Rres).
Chamber
PTW 30013
5 g cm-2
Table 10.III
kQ 1.030

4/21/10
31
Chamber 30013 kQ as a function of beam quality
• Beam quality (g cm-2) kQ – 20 1.029 – 10 1.030 – 5 1.030 – 3 1.030 – 2 1.031 – 1 1.032
Absorbed dose to water at the reference depth
• Corrected meter reading x the absorbed dose to water calibration factor x beam quality correction factor
• 0.2362 nC/MU x 1.03 x 5.439 x 107 Gy/C x10-9 C/nC x 102 cGy/Gy = 1.323 cGy/MU

4/21/10
32
Calibration Adjustment
• In order to have a 1.0 cGy/MU, Hitachi control system must receive the appropriate factor for both the main and sub-dose monitors. This is the only function which can be performed by physicists in “Service Mode”.
• Another calibration is performed.
G1 Calibration May 1, 2006
• 250 MeV, practical range 28.5 cm, SOBP width 10 cm, Reference SSD 246.5 cm, reference depth 23.5 cm, beam quality 5 cm
• PTW 30013, s/n 1831 5.446 x 10⁻² Gy/nC • ktp 0.999, kpol 1.0, kelec 1.001, ks 1.0 • M1 0.1782 nC/MU • MQ 0.1782 nC/MU

4/21/10
33
G1 Calibration May 1, 2006 • MQ 0.1782 nC/MU
• Absorbed dose to water at reference depth • 0.1782 nC/MU x 1.03 x 5.446 x 107 Gy/C =
0.9996 x 10⁻² Gy/MU or 0.9996 cGy/MU
• Markus chamber MQ 0.007441 nC/MU
• Calibration difference: Markus/30013 1.0064
F2 Calibration June, ‘07

4/21/10
34
PTC H Scanning Beam Program Goal IMPT
Approaching 24 months of operation No apertures – No compensators
MUs from The TPS Pelvic Fields Only
250 patients treated with this technique First hospital based practice to use scanning beams
“Making cancer history” Managed by Mosaiq
Limited by Eclipse V 8.1 Single Gaussian Eclipse V 8.9, March 2010 clinical release date
Pencil Beam Scanning Nozzle
Y scanning magnet
X scanning magnet
Profile monitor
Spot position monitor
Helium chamber
Main and sub-dose monitor

4/21/10
35
Spot position checked after each spot. Maximum MUs per spot is 0.04 MUs.

4/21/10
36
Scanning Beam One Non-Prostate Patient
10 YO Recurrent Rhabdomyosarcoma JL
• Ranges 12 cm to 19 cm • 20 layers 652 spots R and 17 layers
642 spots L • TPS dose 88.8 cGy – 20.1 MU • Treatment delivery time: < 1 minute
Recurrent Rhabdomyosarcoma 10 YO Male Scanning Beam
21 energy changes with ranges from 12.0 cm to 18.9 cm – 655 spots

4/21/10
37
BLLPB Field 17 CP JL • CP Spot Energy (MeV) Weight • 0 30 178.6 0.057048 • 1 37 176.2 0.068263 • 2 69 173.7 0.129447 • 3 82 171.3 0.148287 • 4 53 168.8 0.084155 • 5 53 166.2 0.086347 • 6 61 163.9 0.098074 • 7 48 161.6 0.065658 • 8 50 159.5 0.068745 • 9 40 157.4 0.050372 • 10 37 155.3 0.045654 • 11 31 153.2 0.038943 • 12 22 151.0 0.024910 • … • 17 3 143.2 0.003271
Calibration of Dose Monitor
• A MU is defined at the center of a 1 liter volume which is receiving a uniform dose, – Max range: 30.6 cm; Max Energy: 221.8 MeV – Min range: 21.0 cm; Min Energy: 178.6 MeV – Total 18 energies (18 layers) – Spot spacing: 8mm – Total spots: 6760 – Total MU: 217.13 – Dose at the isocenter: 217.13 cGy at the center of the
volume
4/21/10
38
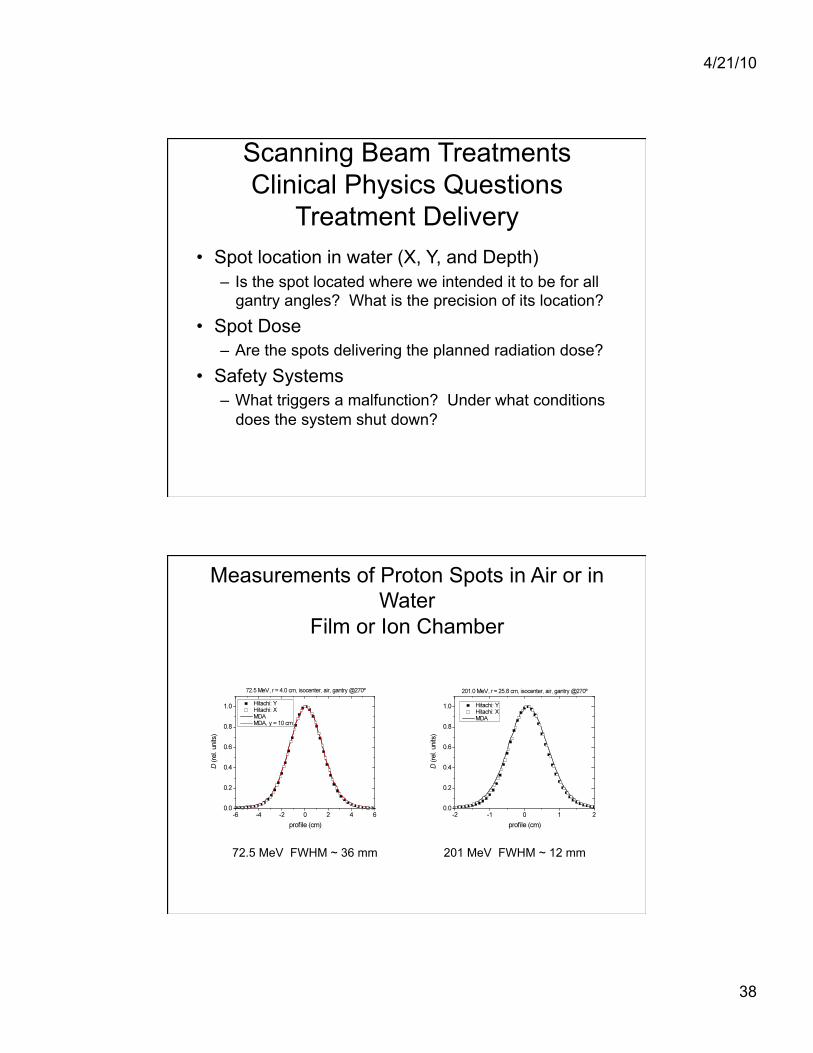
Scanning Beam Treatments Clinical Physics Questions
Treatment Delivery • Spot location in water (X, Y, and Depth)
– Is the spot located where we intended it to be for all gantry angles? What is the precision of its location?
• Spot Dose – Are the spots delivering the planned radiation dose?
• Safety Systems – What triggers a malfunction? Under what conditions
does the system shut down?
Measurements of Proton Spots in Air or in Water
Film or Ion Chamber
72.5 MeV FWHM ~ 36 mm 201 MeV FWHM ~ 12 mm

4/21/10
39
Range 11.0 cm Profile in water
Ion Chamber: One point at a time
FWHM of a single spot in air for protons with ranges of 4 cm to 30.6 cm

4/21/10
40
Lateral profiles in water at 20 cm for 221.8 MeV
Courtesy: G. O. Sawakuchi, PhD.
Proton Scanning Beams for IMPT 94 energies to modulate the depth
• Monte Carlo simulated data (Uwe Titt, Ph.D.) are used as input data for the planning system – Validated with limited number of energies – Integrated depth doses are in MeV/cm3 and need to
be converted to Gy/MUmm2

4/21/10
41
Pristine Bragg Peak TPS Input Data – Also in air spot profiles Monte Carlo Calculated and Measured Normalization Dose in Gy/MU versus range Normalization measurements: 2 cm depth, 8 cm chamber
94 Energies: Ranges from 4.0 cm to 30.6 cm
Basic Information about Bragg Peak Chamber
• Nominal sensitive volume: 10.5 cm3. • Sensitive volume: r = 42 mm, t = 2 mm. • Nominal response: 325 nC/Gy. • Reference point 3.5 mm front chamber surface. • Entrance window: 3.47 mm PMMA. • WET window: 4 mm. • ND,Wkq = (3.1810.023)x106 Gy/C
– Average 3 inter-comparison

4/21/10
42
Monte Carlo Integrated Depth Dose at Depth of 2.0 cm
For lower proton energies, a 4 cm radius chamber does not capture the entire spot.
IMPT • Intensity modulated proton therapy (IMPT) – the weight
of each spot is optimized using an inverse planning process with or without dose constraints to the target volumes and critical structures
• IMPT – Single field optimization (SFO): • Each field is optimized to deliver an uniform dose across the
target volume • Multiple fields can be used for treatment
• IMPT – Multi-field optimization (MFO): • All spots from all fields are optimized simultaneously

4/21/10
43
IMPT: SFO vs. MFO SFO
• “Open Field” for simpler volume
• Uniform dose distribution • Less sensitive to
uncertainties • Should use SFO plan if
IMPT plan is not significantly better
MFO
• “Patch Field” for complex volume
• More versatile to get a good plan
• But more sensitive to uncertainties
• Robustness of MFO is important
• Have not treated patient using MFO
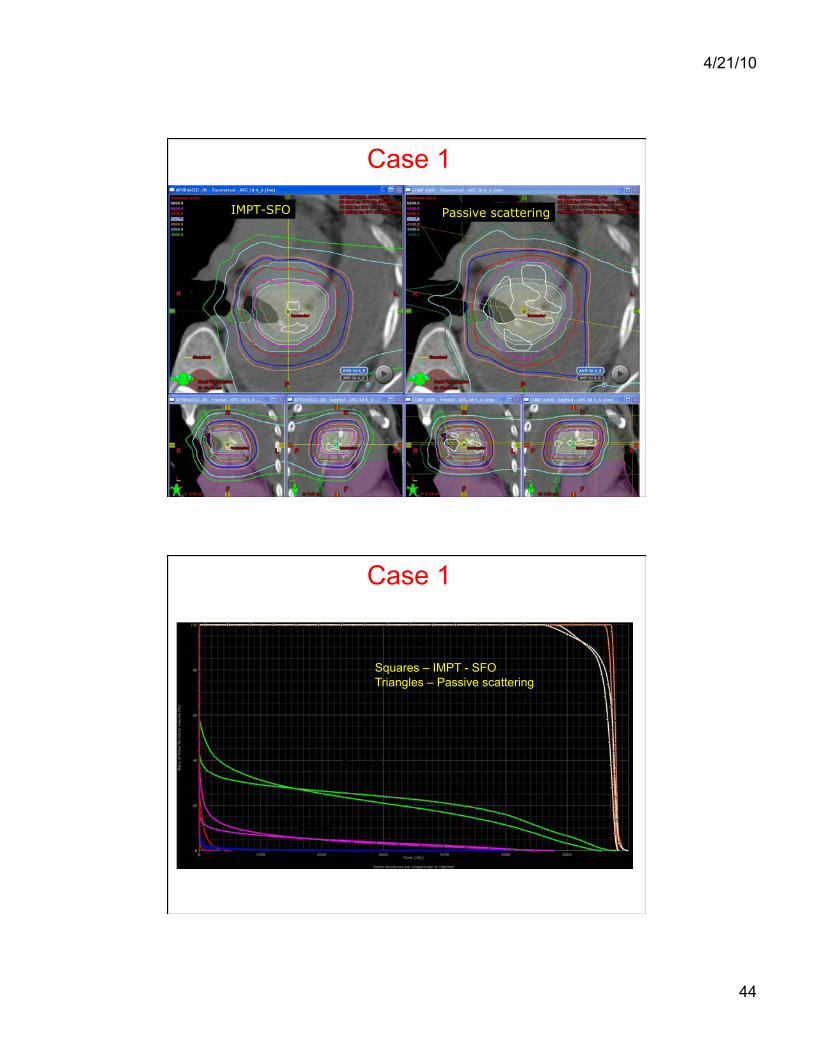
Case 1 • MR#820983 • 61 year old female with history of
leiomyosarcoma • Post pneumonectomy with
positive margin at the pulmonary artery and staple line
• Postoperative proton therapy • 66 CGE: 50 + 16
4/21/10
44
Case 1
IMPT-SFO Passive scattering
Case 1
Squares – IMPT - SFO Triangles – Passive scattering
Esophagus
Heart
Total lung
Spinal cord
4/21/10
45
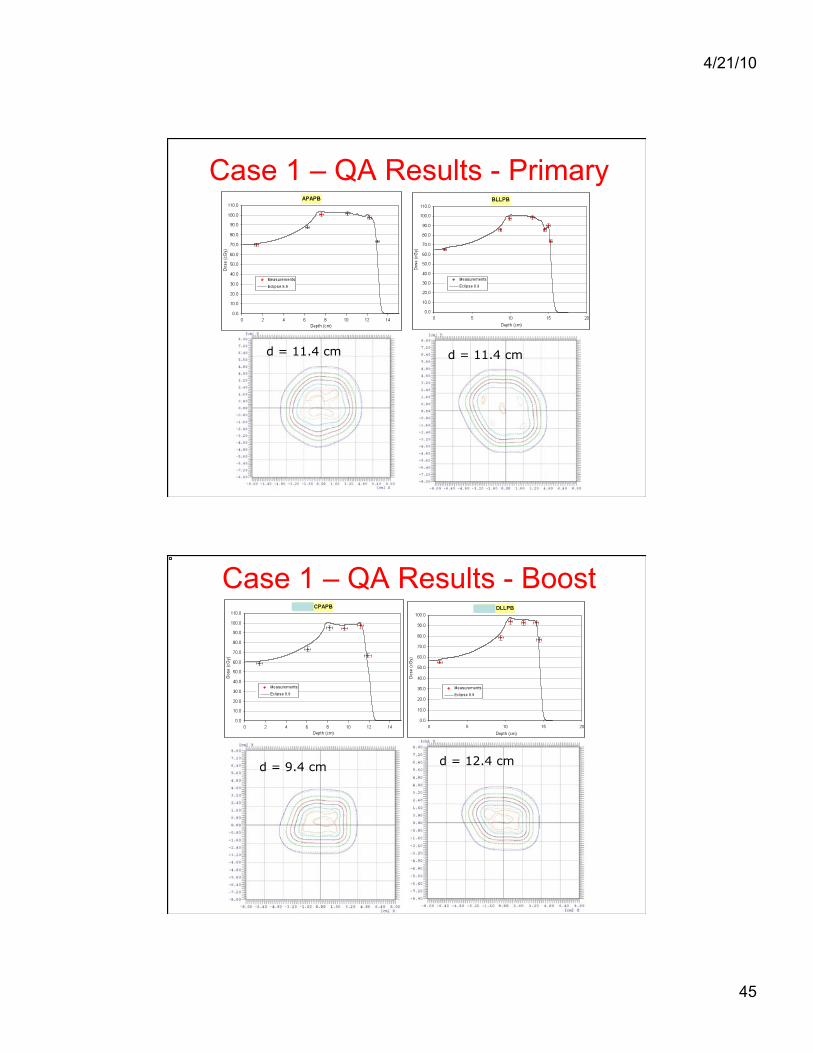
Case 1 – QA Results - Primary
d = 11.4 cm d = 11.4 cm
Case 1 – QA Results - Boost
d = 9.4 cm d = 12.4 cm

4/21/10
46
Case 2 • MR#830369 • 14-yr-old boy • Osteosarcoma right sacrum • 50 CGE
Case 2
Rectum Bladder
Bowel

4/21/10
47
Case 2 – QA results
Case 3 • A 39 yr old female (MR#822380) • Chondrosarcoma of the base of skull
• Planning objectives: – CTV: 70 Gy – Brain stem: < 1 cc > 60 Gy – Optical nerves and chiasm: < 58 Gy – Temp lobes: < 1 cc > 70 Gy – Others: cochleas, spinal cord, hippocampuses, eyes,
and lenses

4/21/10
48
Anatomy
Beam angles - MFO
1
2 3
4
5
6 7
8
• Two plans to improve robustness • Each has 4 fields
• 1-4 • 5-8

4/21/10
49
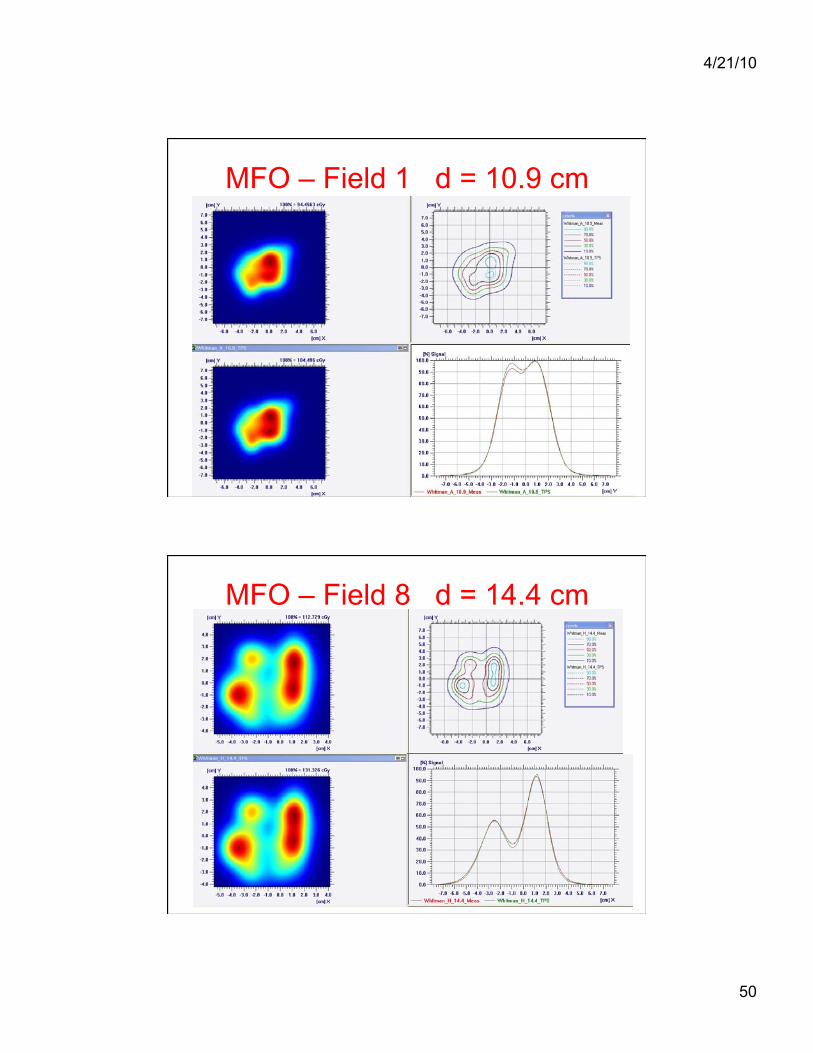
Plan results - MFO
MFO – Field 1 d = 10.9 cm
4/21/10
50
MFO – Field 1 d = 10.9 cm
MFO – Field 8 d = 14.4 cm

4/21/10
51
MFO – Field 8 d = 14.4 cm
Comparison of Normalization Dose
Field Depth (cm)
Eclipse (CcGE)
Eclipse (cGy)
Meas (cGy)
Diff (%)
1 9.9 102.8 93.5 91.8 1.8% 1 10.9 104.5 95.0 94.5 0.6% 1 14.4 24.5 22.3 20.6 8.1% 3 3.9 105.2 95.6 90.6 5.6% 3 6.4 169.9 154.5 147.1 5.0% 4 5.4 101.2 92.0 88.6 3.8% 4 9.9 132.0 120.0 114.3 5.0% 5 5.4 135.7 123.4 120.0 2.8% 5 10.9 194.6 176.9 167.8 5.4%

4/21/10
52
Comparison of Normalization Dose
Field Depth (cm)
Eclipse (CcGE)
Eclipse (cGy)
Meas (cGy)
Diff (%)
6 5.4 58.7 53.4 51.2 4.2% 6 8.9 103.4 94.0 91.0 3.3% 7 5.4 39.1 35.5 33.5 6.1% 7 9.9 105.7 96.1 91.0 5.6% 7 14.9 83.1 75.5 69.8 8.2% 8 5.4 85.7 77.9 75.1 3.7% 8 14.4 131.3 119.4 112.7 5.9%
Avg = 4.7% Stdev = 2.1% Min = 0.6% Max = 8.2%
Beam angles - SFO
Field 3
Field 1
Field 2

4/21/10
53
Plan results - SFO
SFO - Field 1 d = 5.4 cm
Difference in normalization = -0.3%

4/21/10
54
SFO - Field 1 d = 5.4 cm
SFO - Field 3 d = 11.4 cm
Difference in normalization = 3.7%

4/21/10
55
SFO - Field 3 d = 11.4 cm Avg = 2.0%
Stdev = 1.4% Min = -0.3% Max = 3.7%
Comparison of Normalization Dose
Field Depth (cm)
Eclipse (CcGE)
Eclipse (cGy)
Meas (cGy)
Diff (%)
1 5.4 44.1 40.1 40.2 -0.3% 1 11.4 64.2 58.4 57.0 2.4% 1 13.4 71.4 64.9 64.3 0.9% 2 5.4 72.8 66.2 65.2 1.6% 2 11.4 74.3 67.5 65.1 3.7% 3 5.4 67.3 61.2 60.1 1.9% 3 11.4 71.6 65.1 62.7 3.7%
Avg = 2.0% Stdev = 1.4% Min = -0.3% Max = 3.7%

4/21/10
56
IMPT-SFO IMPT-MFO
DVH Comparison: MFO vs. SFO
GTV
Spinal cord
L Optical Nerve
Brain Stem
Squares - MFO Triangles - SFO
R Optical Nerve

4/21/10
57
CTV
L Temp Lobe
Optical Chiasm
R Temp Lobe
DVH Comparison: MFO vs. SFO Squares - MFO Triangles - SFO
Case 4
• MR#833148 • 9 year old boy • Non-disseminated pure pineal
germinoma

4/21/10
58
Passive IMPT-SFO
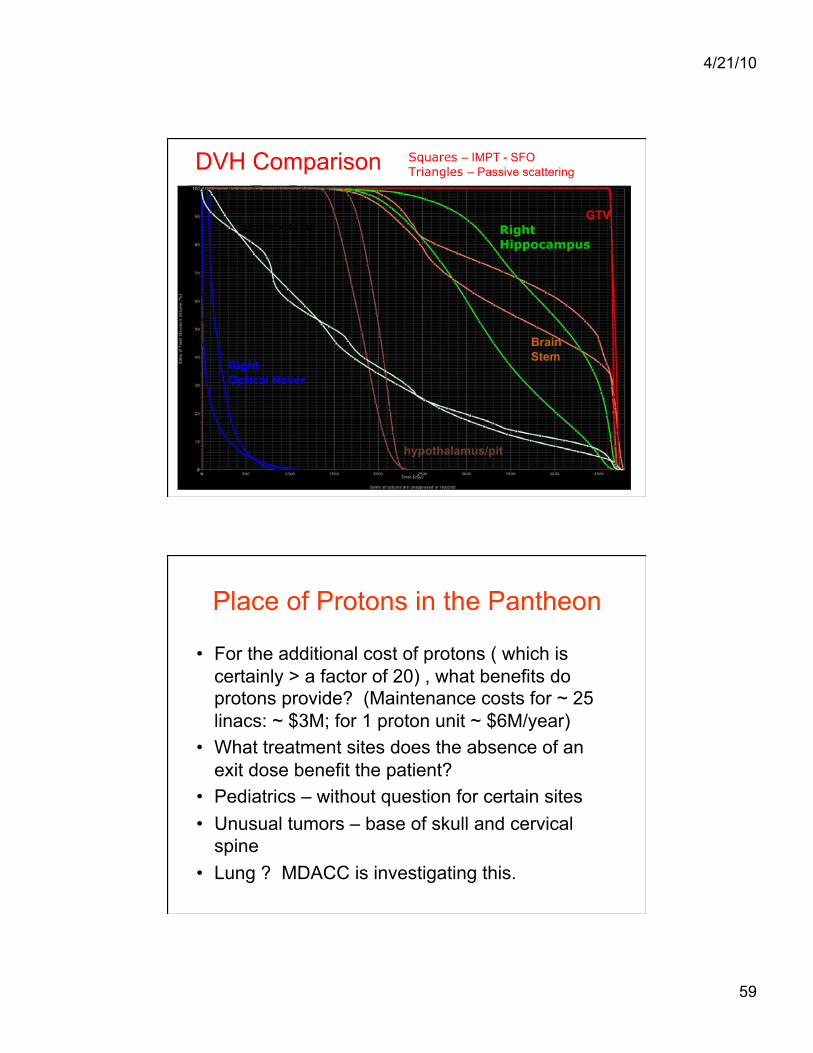
DVH Comparison
CTV45
Left Cochlea
Optical Chiasm
Whole Brain
Squares – IMPT - SFO Triangles – Passive scattering
Left Hippocampus
Right Cochlea
Left Optical Nerve
CTV23.4
4/21/10
59
DVH Comparison
GTV
hypothalamus/pit
Right Optical Never
Brain Stem
Squares – IMPT - SFO Triangles – Passive scattering
Right Hippocampus
Brain - GTV
Place of Protons in the Pantheon
• For the additional cost of protons ( which is certainly > a factor of 20) , what benefits do protons provide? (Maintenance costs for ~ 25 linacs: ~ $3M; for 1 proton unit ~ $6M/year)
• What treatment sites does the absence of an exit dose benefit the patient?
• Pediatrics – without question for certain sites • Unusual tumors – base of skull and cervical
spine • Lung ? MDACC is investigating this.

4/21/10
60
Image-Guided Adaptive Conformal Photon vs Proton Therapy, with Concurrent Chemotherapy, for Locally
Advanced Non-Small Cell Lung Carcinoma: Pneumonitis and Locoregional Recurrence
PI: Zhongxing Liao MD
Pathologically proven, unresected, locoregionally advanced NSCLC without evidence of hematogenous metastases (stage IIB-IIIB disease according to the 6th edition of the AJCC Staging Manual).
Primary Objective
• Assess toxicity (TRP) or locoregional recurrence, whichever comes first, among patients treated with image-guided adaptive photon therapy (IGAXT, group 1) or proton therapy (IGAPT, group 2). – Workflow issue:
• what system the contouring will occur (Pinnacle or Eclipse)?
– MDACC: both systems will be used. Pinnacle may be used more for contouring

4/21/10
61
Photon vs. Proton Lung Protocol
Photon vs. Proton Lung Protocol

4/21/10
62
3 Field Lung Plan to 74 CGE
Introduction 160 MeV, Medium Snout, Different SOBP’s
• Precisely measured in water. • What about in a patient?
– Not quite sure.
Protons Stop!

4/21/10
63
Some papers • Gillin,M., Sahoo,N., Bues, M. et al. Commissioning of discrete spot
scanning proton delivery system at the University of Texas M.D. Anderson Cancer Center, Proton Therapy Center, Houston. Med. Phys. 37, 154-163, 2010.
• Arjomandy,B., Sahoo, N., Zhu, X.R. et al. An overview of the comprehensive proton machine quality assurance procedures implemented at the University of Texas M.D. Anderson Cancer Center Proton Therapy Center-Houston. Med. Phys. 36, 2269-2282, 2009.
• Sahoo, N., Zhu, X.R., Arjomandy, B., et al. A procedure for calculation of monitor units for passively scattered proton radiotherapy beams. Med. Phys. 35, 5088-5097, 2008.
• Arjomandy,B., Sahoo,N., Ding, X. et al. Use of a two-dimensional ionization array chamber for proton beam quality assurance. Med. Phys. 35, 3889-94.