Gsas Intro Rvd
25
Introduction to GSAS and Rietveld Refinement R.B. Von Dreele, Advanced Photon Source Argonne National Laboratory Recent Quote seen in Rietveld e-mail: “Rietveld refinement is one of those few fields of intellectual endeavor wherein the more one does it, the less one understands.” (Sue Kesson) Stephens’ Law – “A Rietveld refinement is never perfected, merely abandoned”
-
Upload
william-bautista -
Category
Documents
-
view
229 -
download
0
Transcript of Gsas Intro Rvd
Introduction to GSAS and Rietveld
Refinement
R.B. Von Dreele, Advanced Photon Source
Argonne National Laboratory
Recent Quote seen in Rietveld e-mail:
“Rietveld refinement is one of those few fields of
intellectual endeavor wherein the more one does it, the less one understands.” (Sue Kesson)
Stephens’ Law –
“A Rietveld refinement is never perfected, merely abandoned”
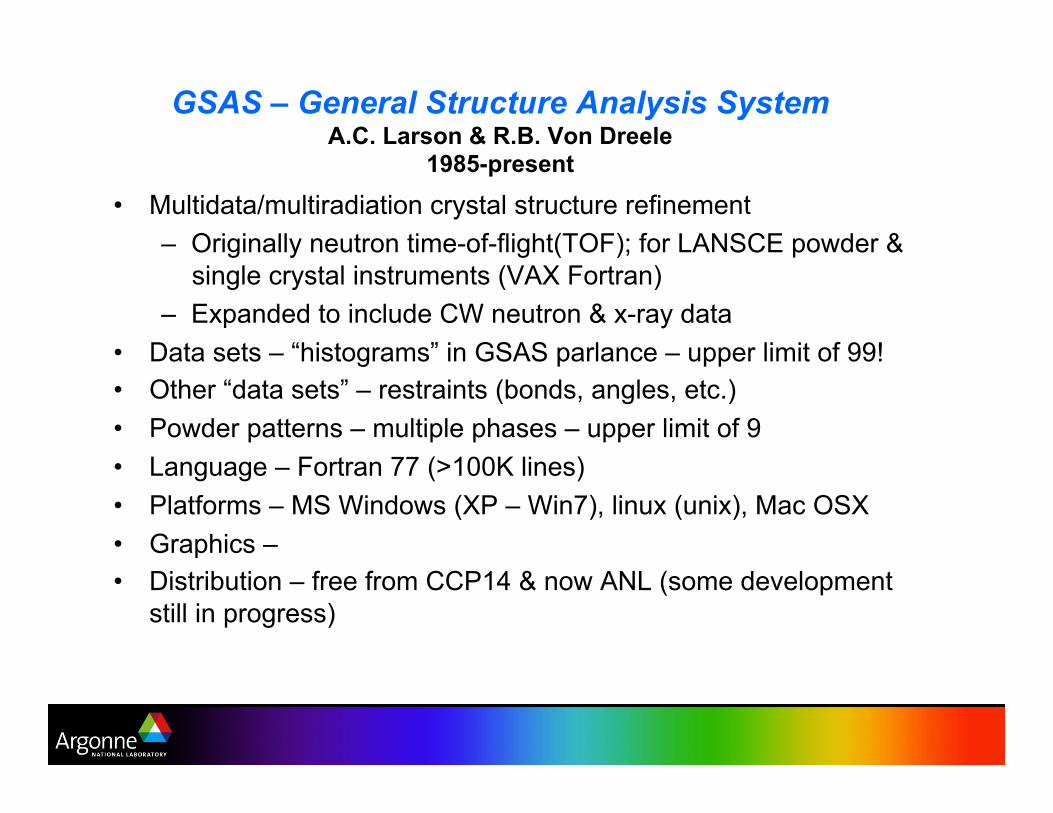
GSAS – General Structure Analysis System A.C. Larson & R.B. Von Dreele
1985-present
•! Multidata/multiradiation crystal structure refinement
–! Originally neutron time-of-flight(TOF); for LANSCE powder &
single crystal instruments (VAX Fortran)
–! Expanded to include CW neutron & x-ray data
•! Data sets – “histograms” in GSAS parlance – upper limit of 99!
•! Other “data sets” – restraints (bonds, angles, etc.)
•! Powder patterns – multiple phases – upper limit of 9
•! Language – Fortran 77 (>100K lines)
•! Platforms – MS Windows (XP – Win7), linux (unix), Mac OSX
•! Graphics –
•! Distribution – free from CCP14 & now ANL (some development
still in progress)
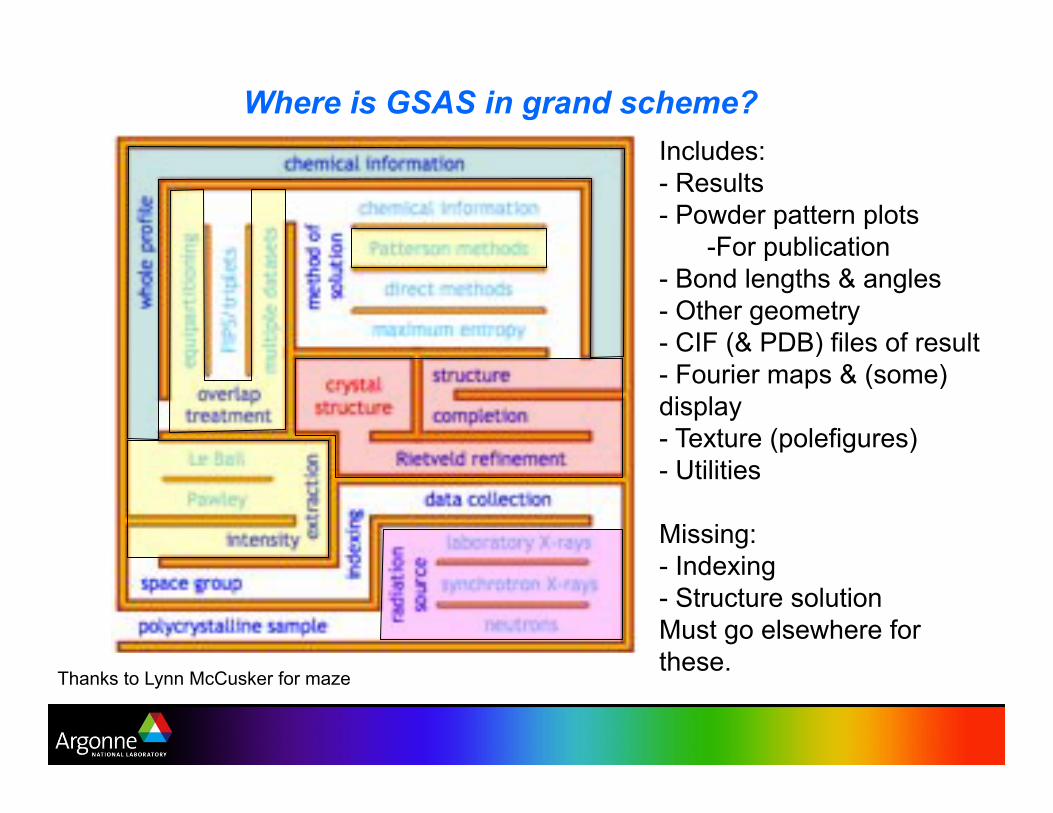
Where is GSAS in grand scheme?
Thanks to Lynn McCusker for maze
Includes:
-! Results
-! Powder pattern plots
-!For publication
-! Bond lengths & angles
-! Other geometry
-! CIF (& PDB) files of result
-! Fourier maps & (some)
display
-! Texture (polefigures)
-! Utilities
Missing:
-! Indexing
-! Structure solution
Must go elsewhere for
these.
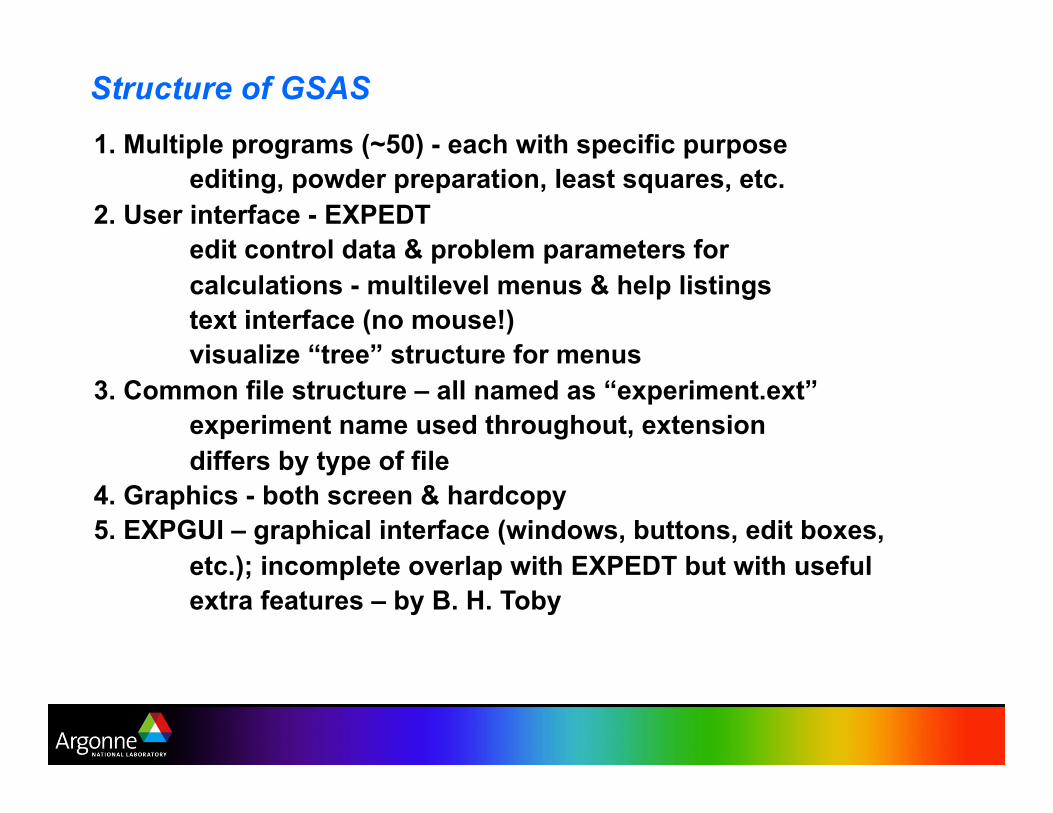
Structure of GSAS
1. Multiple programs (~50) - each with specific purpose
editing, powder preparation, least squares, etc.
2. User interface - EXPEDT
edit control data & problem parameters for
calculations - multilevel menus & help listings
text interface (no mouse!)
visualize “tree” structure for menus
3. Common file structure – all named as “experiment.ext”
experiment name used throughout, extension
differs by type of file
4. Graphics - both screen & hardcopy
5. EXPGUI – graphical interface (windows, buttons, edit boxes,
etc.); incomplete overlap with EXPEDT but with useful
extra features – by B. H. Toby
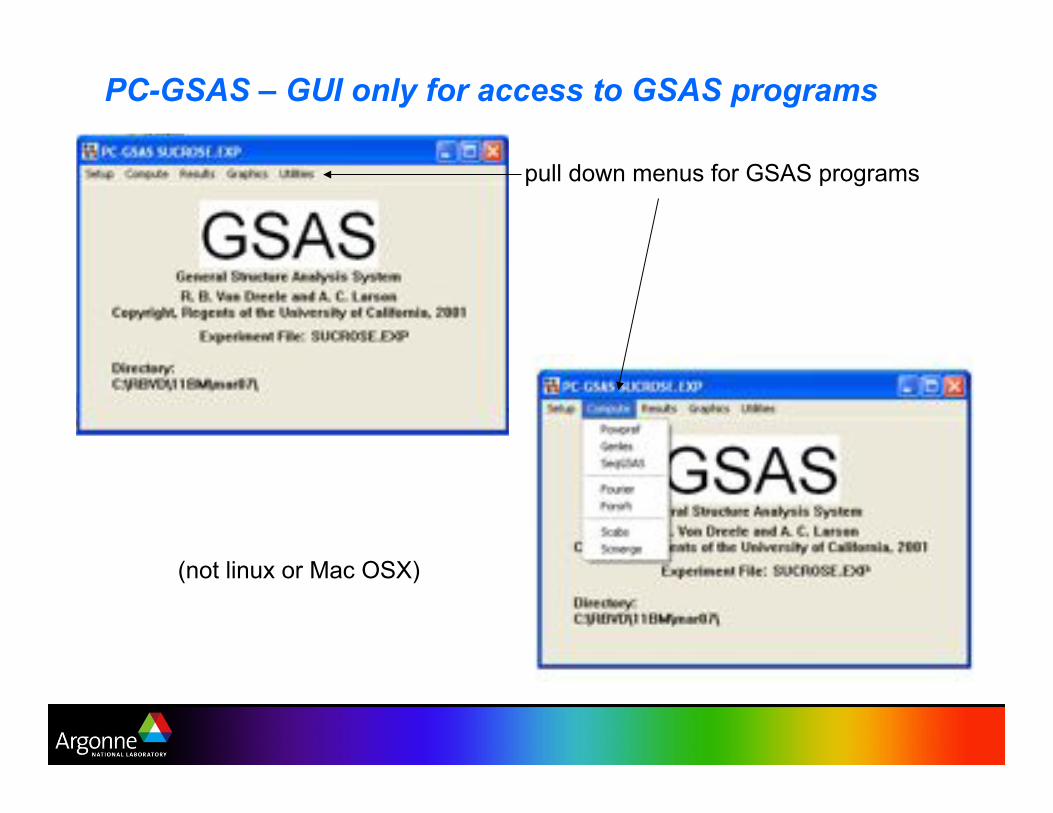
PC-GSAS – GUI only for access to GSAS programs
pull down menus for GSAS programs
(not linux or Mac OSX)

GSAS & EXPGUI interfaces
EXPEDT data setup option (<?>,D,F,K,L,P,R,S,X) >
EXPEDT data setup options:
<?> - Type this help listing
D - Distance/angle calculation set up
F - Fourier calculation set up
K n - Delete all but the last n history records
L - Least squares refinement set up
P - Powder data preparation
R - Review data in the experiment file
S - Single crystal data preparation
X - Exit from EXPEDT
On console screen
Keyboard input – text & numbers
1 letter commands – menu help
Layers of menus – tree structure
Type ahead thru layers of menus
Macros (@M, @R & @X commands)
GSAS – EXPEDT (and everything else):
Numbers – real: ‘0.25’, or ‘1/3’, ‘2.5e-5’ or ‘s25’ (for sin25) all allowed
Drag & drop for e.g. file names
Macro files: add comments after !
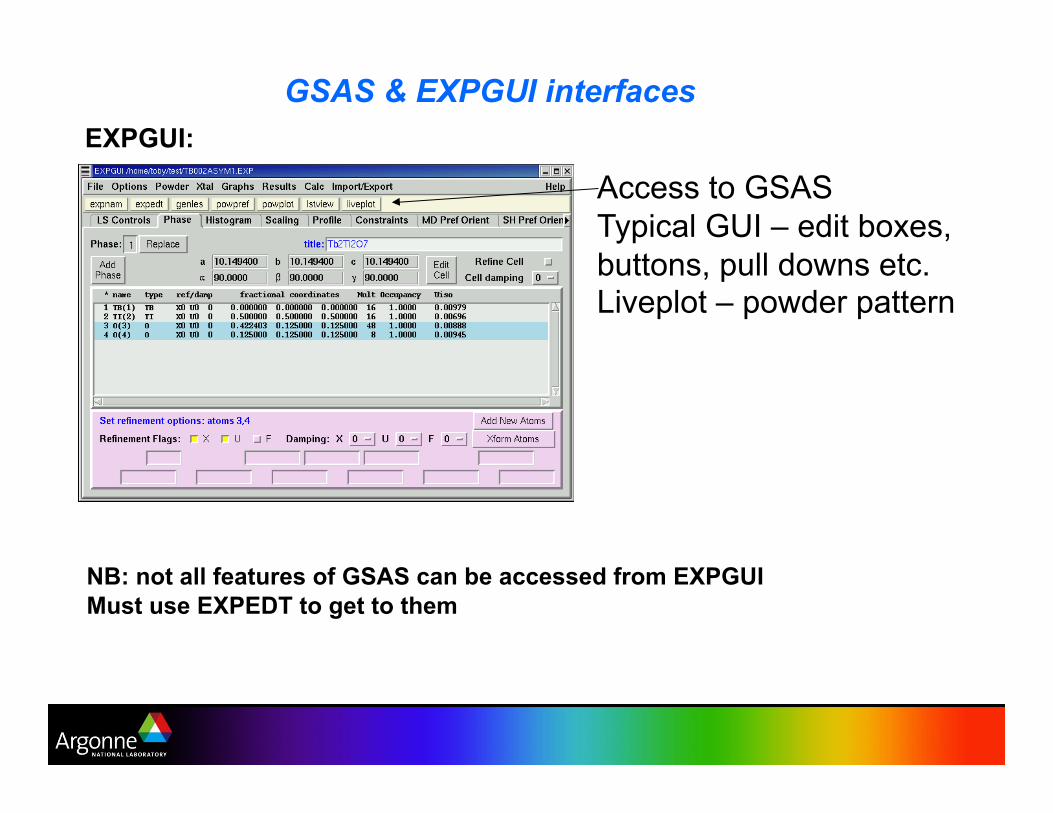
GSAS & EXPGUI interfaces
EXPGUI:
Access to GSAS
Typical GUI – edit boxes,
buttons, pull downs etc. Liveplot – powder pattern
NB: not all features of GSAS can be accessed from EXPGUI
Must use EXPEDT to get to them
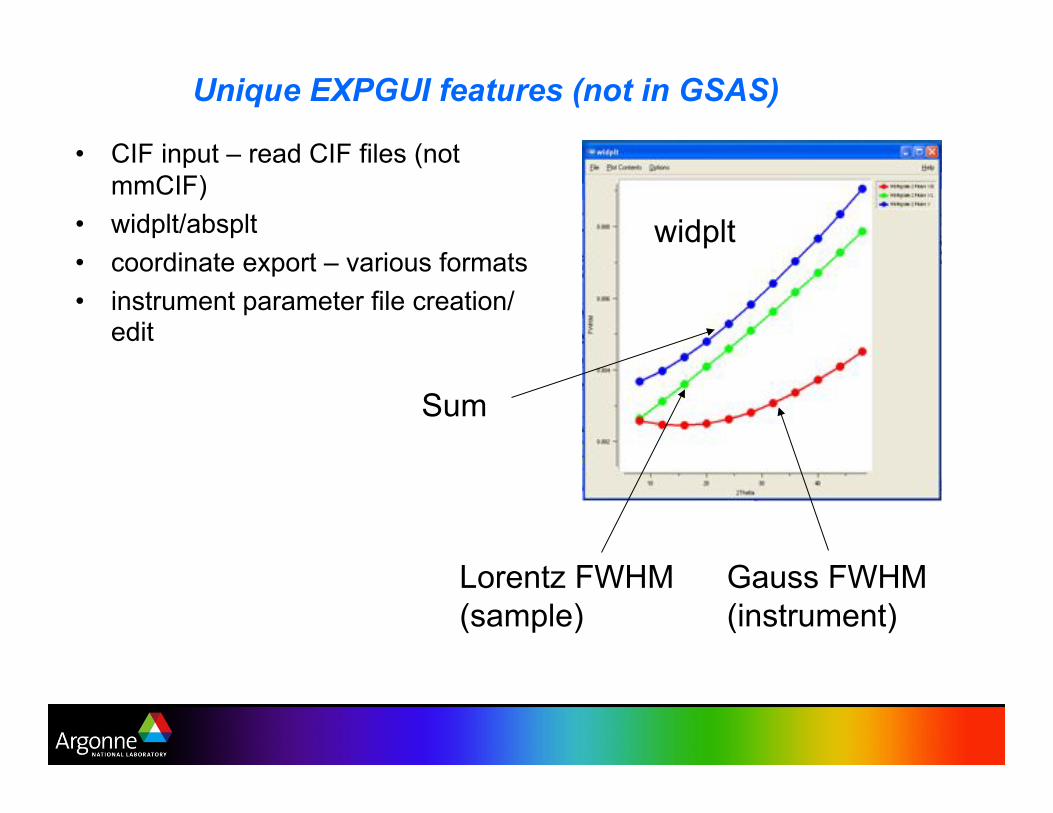
Unique EXPGUI features (not in GSAS)
•! CIF input – read CIF files (not
mmCIF)
•! widplt/absplt
•! coordinate export – various formats
•! instrument parameter file creation/edit
Gauss FWHM
(instrument)
Lorentz FWHM
(sample)
Sum
widplt
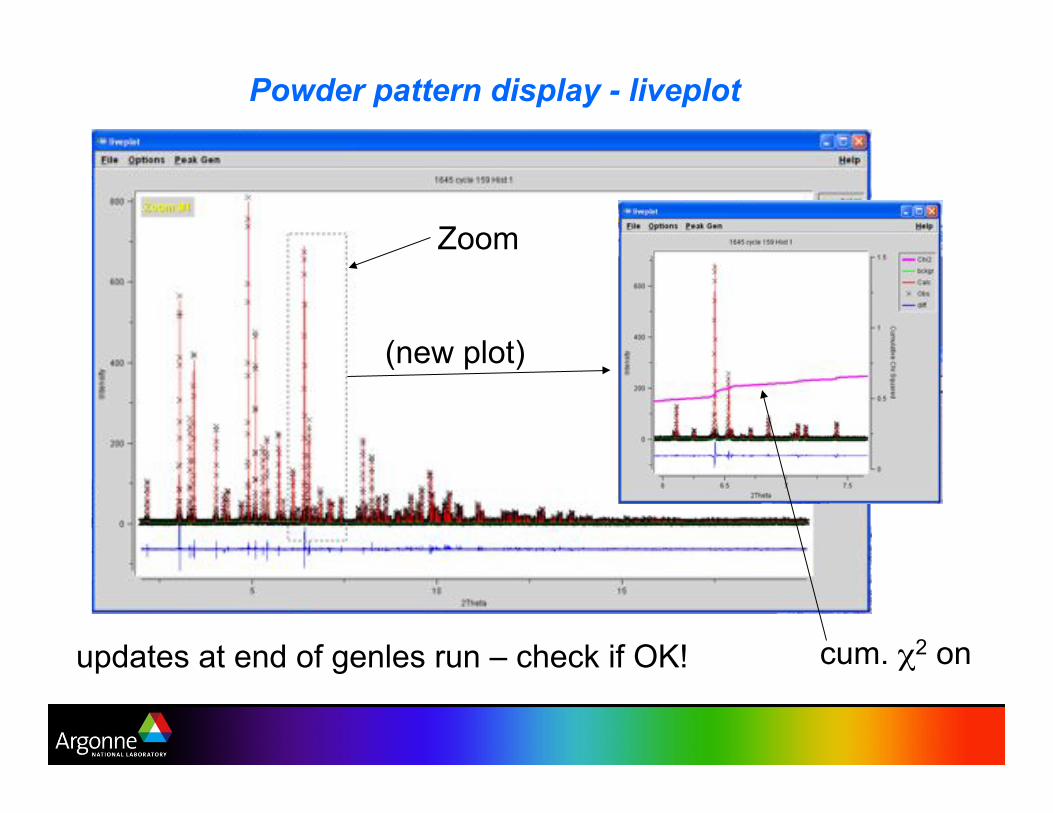
Powder pattern display - liveplot
Zoom
(new plot)
cum. !2 on updates at end of genles run – check if OK!
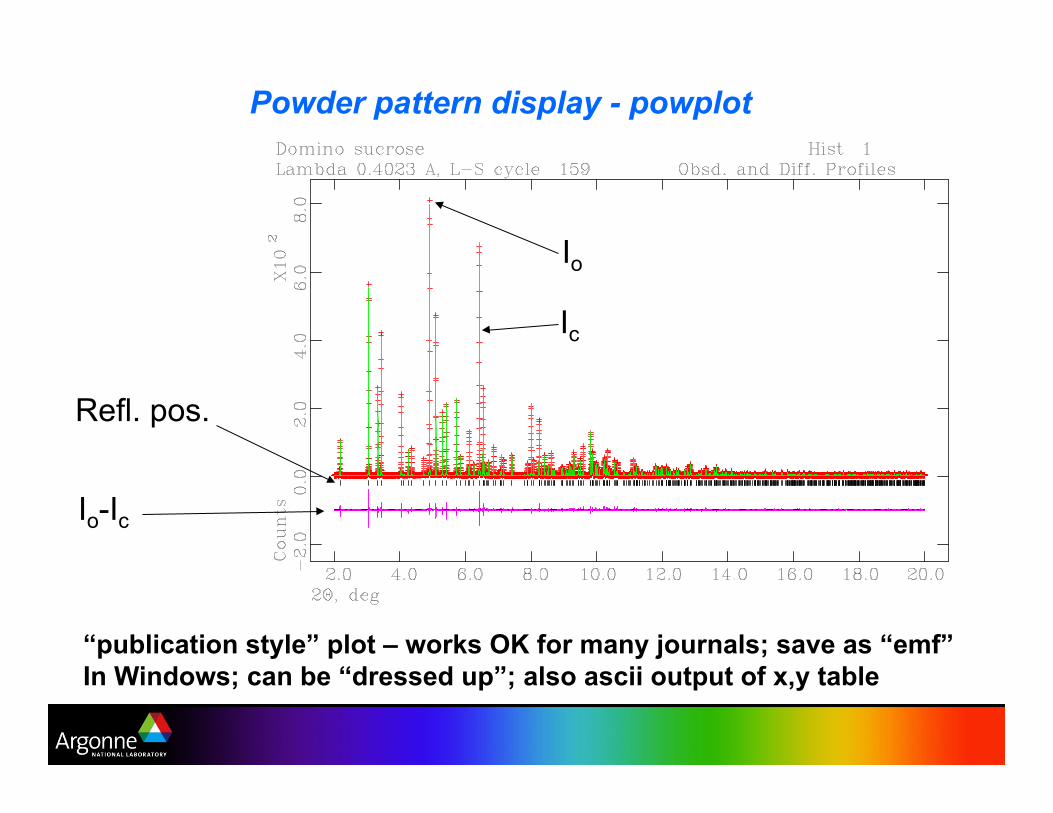
Powder pattern display - powplot
“publication style” plot – works OK for many journals; save as “emf”
In Windows; can be “dressed up”; also ascii output of x,y table
Io-Ic
Refl. pos.
Io
Ic
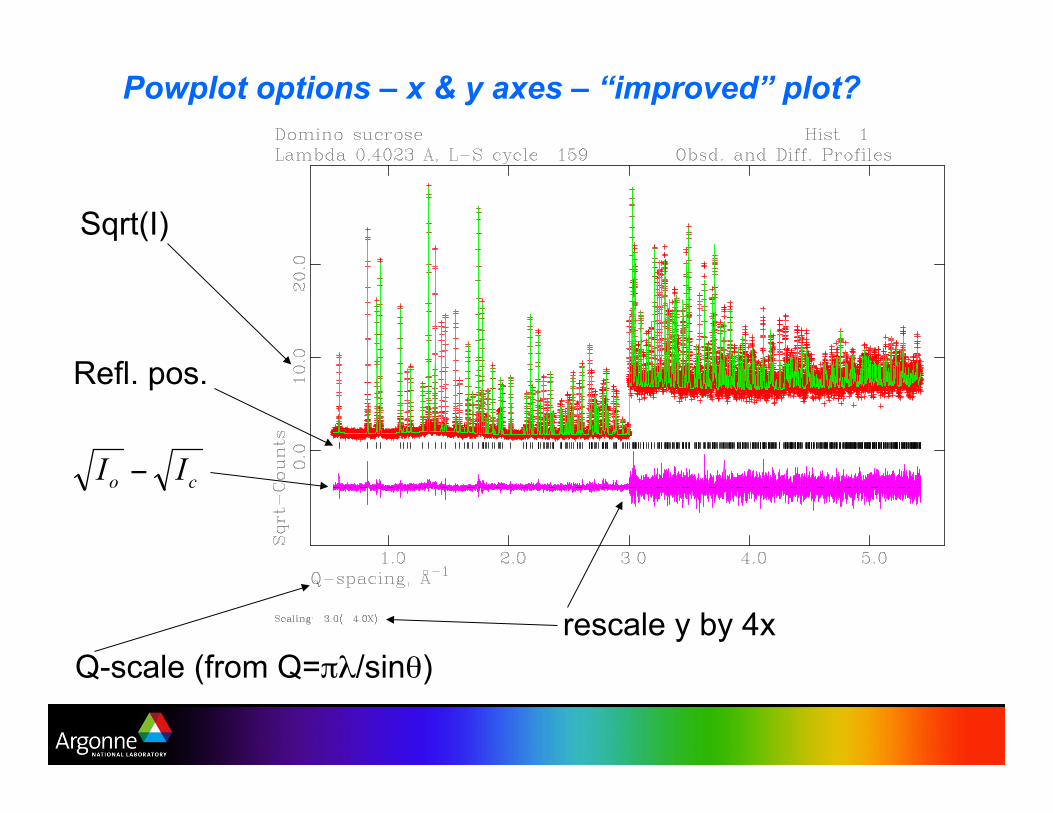
Powplot options – x & y axes – “improved” plot?
Sqrt(I)
Q-scale (from Q="#/sin$)
rescale y by 4x
Refl. pos.
Citations:
•!GSAS:
A.C. Larson and R.B. Von Dreele, General Structure Analysis
System (GSAS), Los Alamos National Laboratory Report LAUR
86-748 (2005).
•!EXPGUI:
B. H. Toby, EXPGUI, a graphical user interface for GSAS, J.
Appl. Cryst. 34, 210-213 (2001).
Distribution kits include both GSAS & EXPGUI
To date: GSAS >5000 citations, EXPGUI >1000 citations
Demonstration – refinement of fluroapatite from lab CuKa data
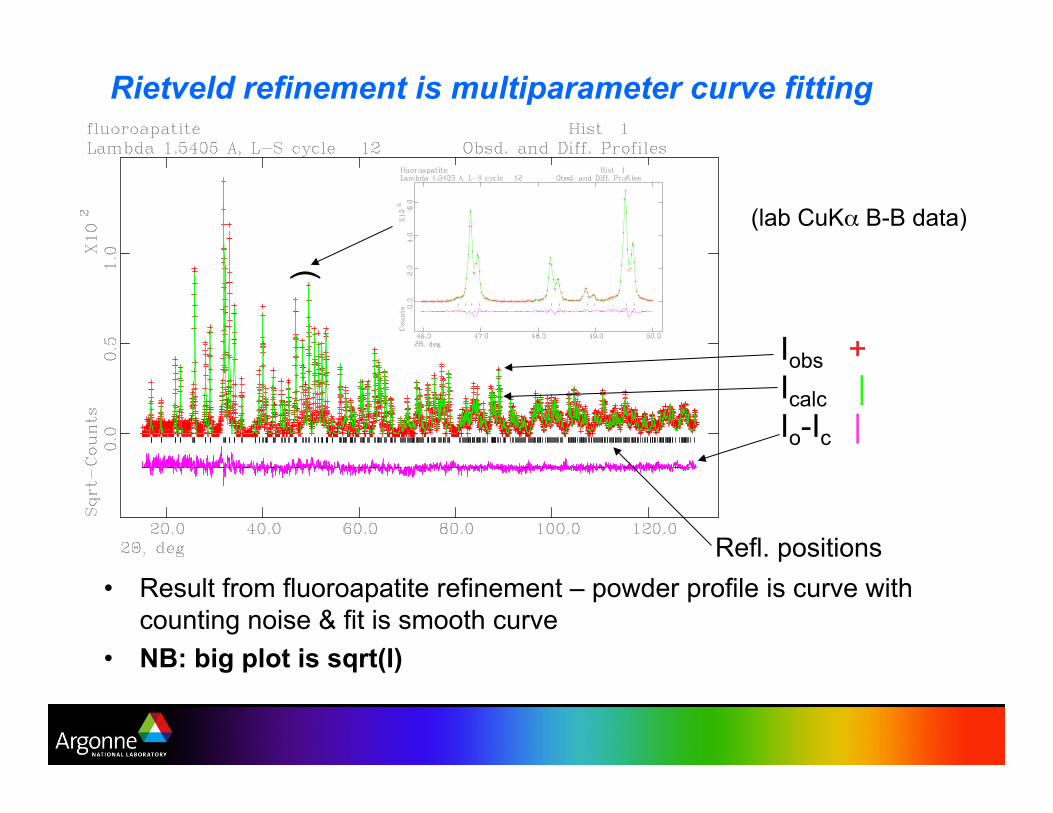
•! Result from fluoroapatite refinement – powder profile is curve with
counting noise & fit is smooth curve
•! NB: big plot is sqrt(I)
Rietveld refinement is multiparameter curve fitting
Iobs +
Icalc |
Io-Ic |
)
Refl. positions
(lab CuK% B-B data)
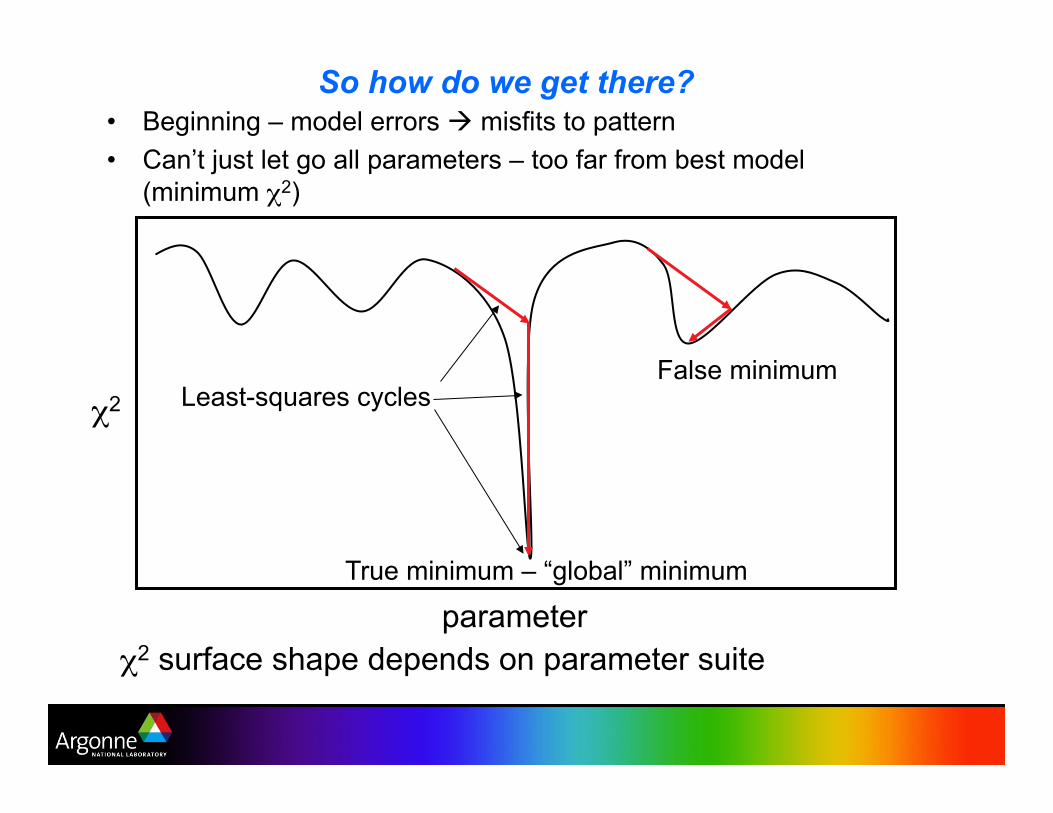
So how do we get there? •! Beginning – model errors ! misfits to pattern
•! Can’t just let go all parameters – too far from best model
(minimum !2)
!2
parameter
False minimum
True minimum – “global” minimum
Least-squares cycles
!2 surface shape depends on parameter suite
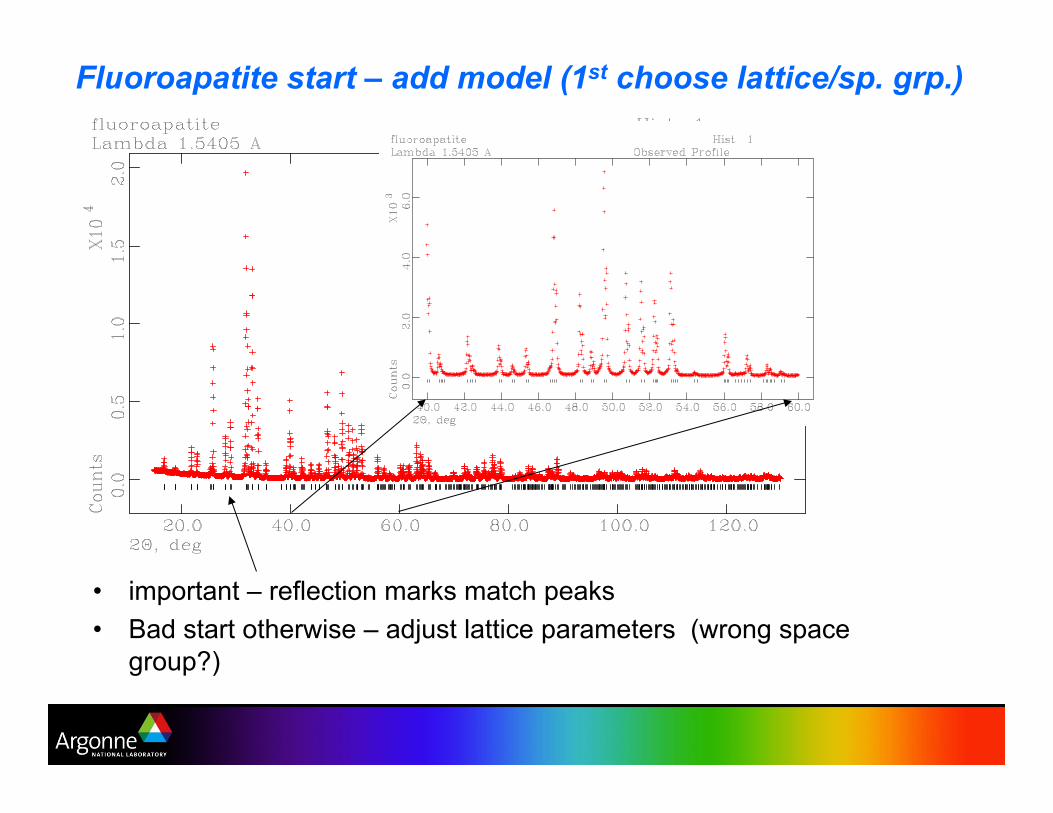
Fluoroapatite start – add model (1st choose lattice/sp. grp.)
•! important – reflection marks match peaks
•! Bad start otherwise – adjust lattice parameters (wrong space
group?)
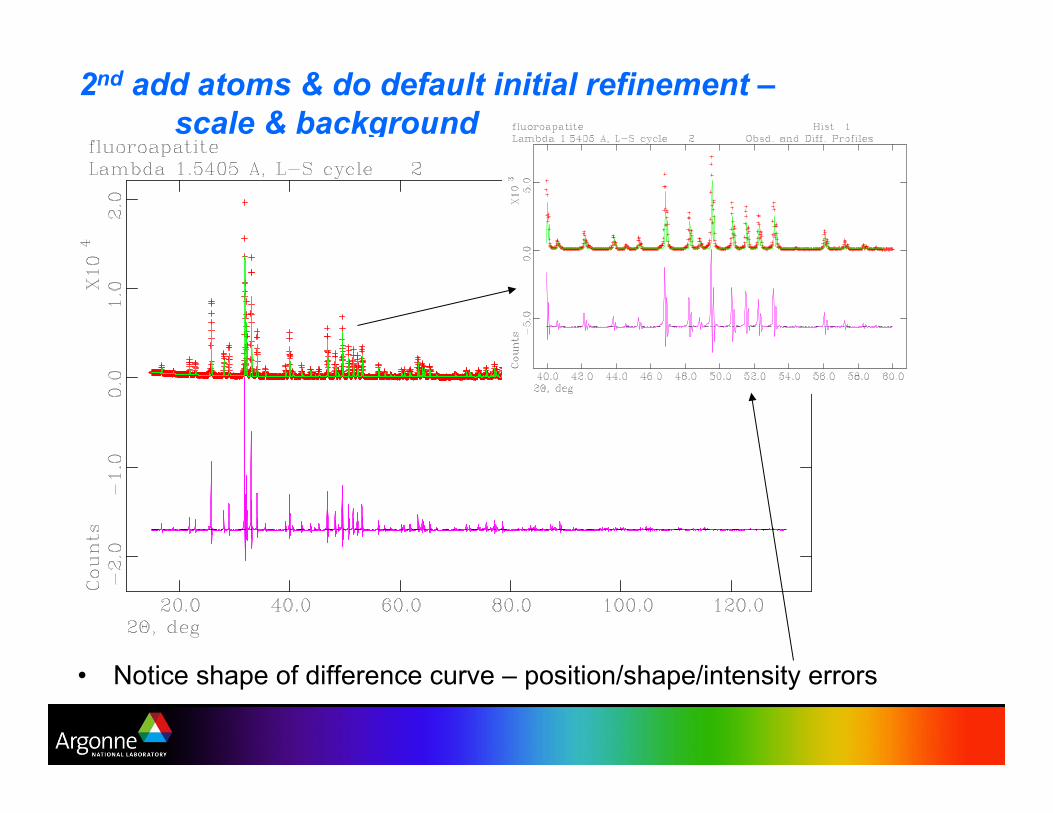
2nd add atoms & do default initial refinement –
scale & background
•! Notice shape of difference curve – position/shape/intensity errors
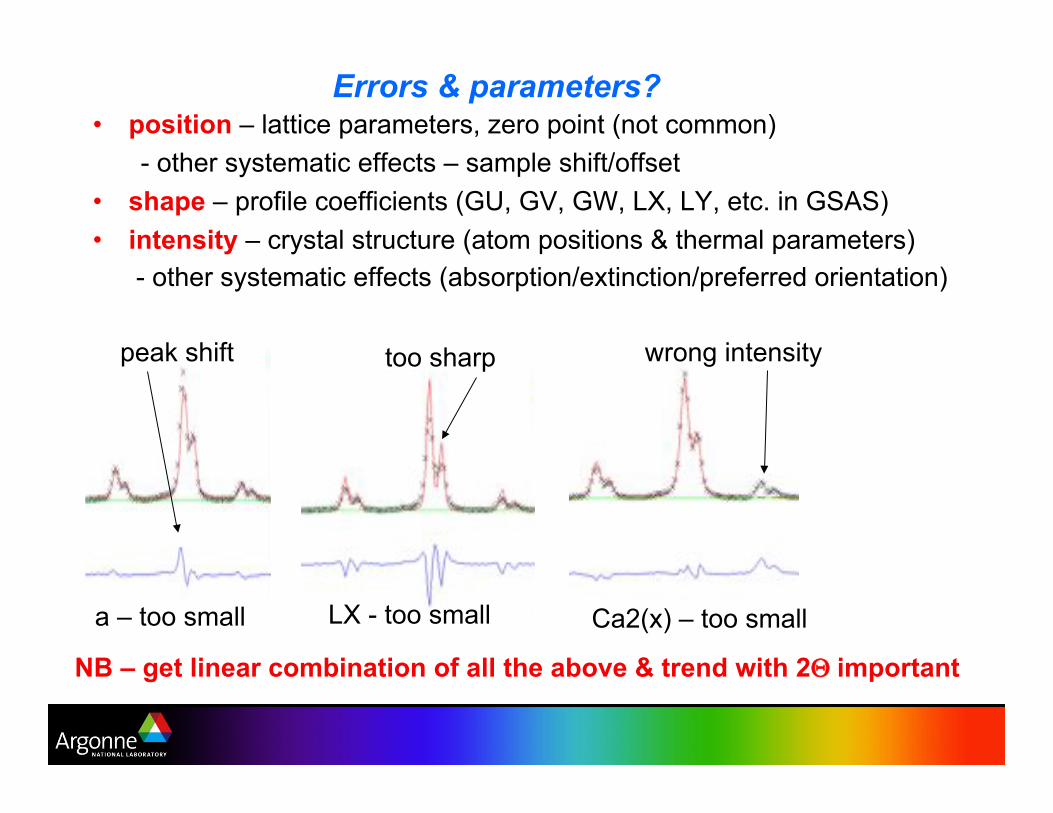
Errors & parameters? •! position – lattice parameters, zero point (not common)
- other systematic effects – sample shift/offset
•! shape – profile coefficients (GU, GV, GW, LX, LY, etc. in GSAS)
•! intensity – crystal structure (atom positions & thermal parameters)
- other systematic effects (absorption/extinction/preferred orientation)
NB – get linear combination of all the above & trend with 2& important
a – too small LX - too small Ca2(x) – too small
too sharp peak shift wrong intensity
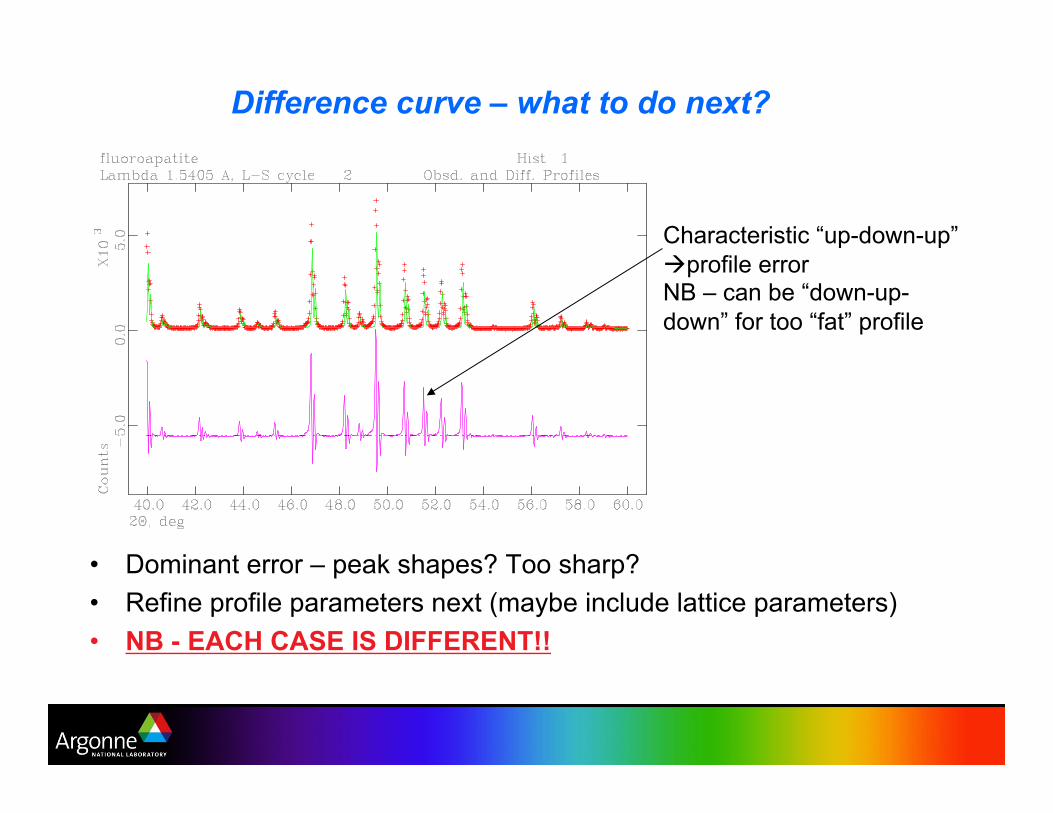
Difference curve – what to do next?
•! Dominant error – peak shapes? Too sharp?
•! Refine profile parameters next (maybe include lattice parameters)
•! NB - EACH CASE IS DIFFERENT!!
Characteristic “up-down-up”
!!profile error NB – can be “down-up-
down” for too “fat” profile
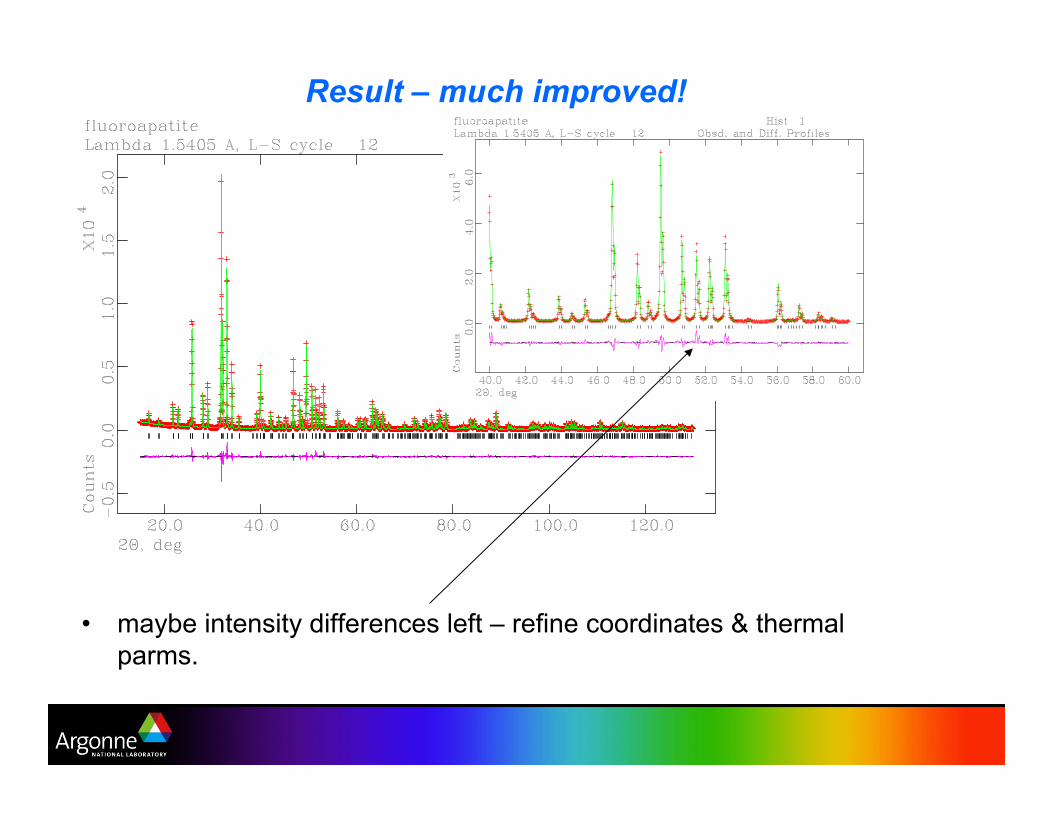
Result – much improved!
•! maybe intensity differences left – refine coordinates & thermal
parms.
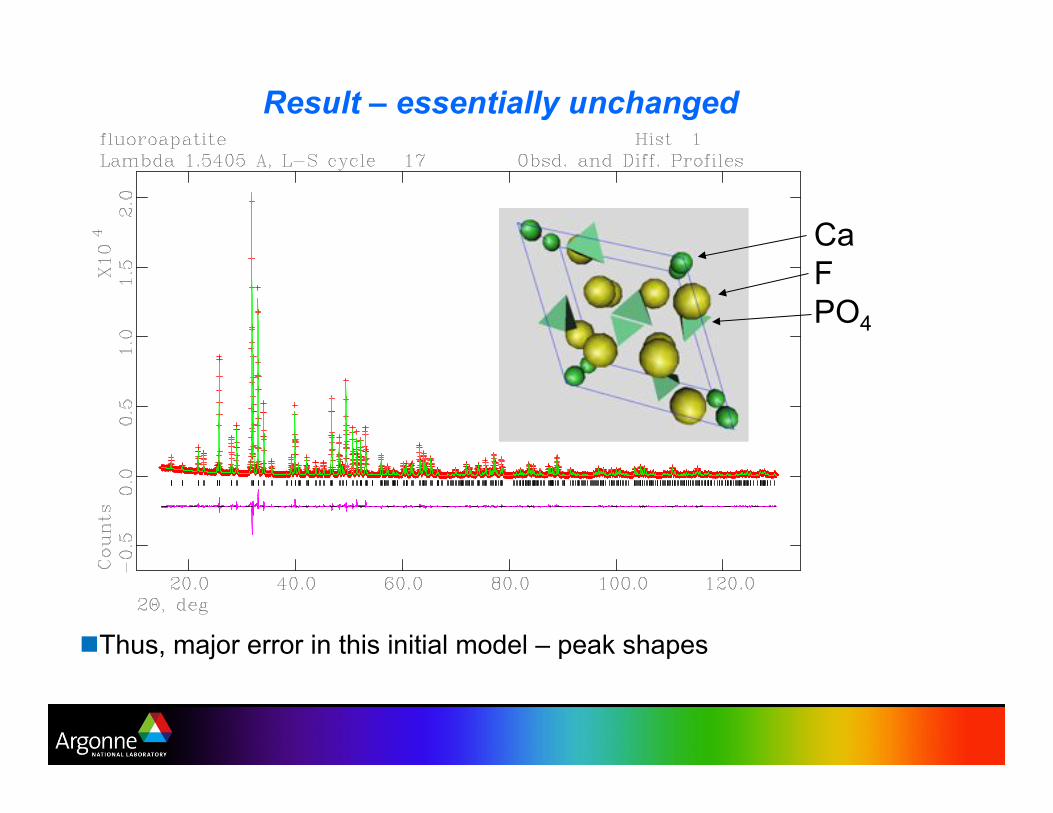
Result – essentially unchanged
"!Thus, major error in this initial model – peak shapes
Ca
F
PO4
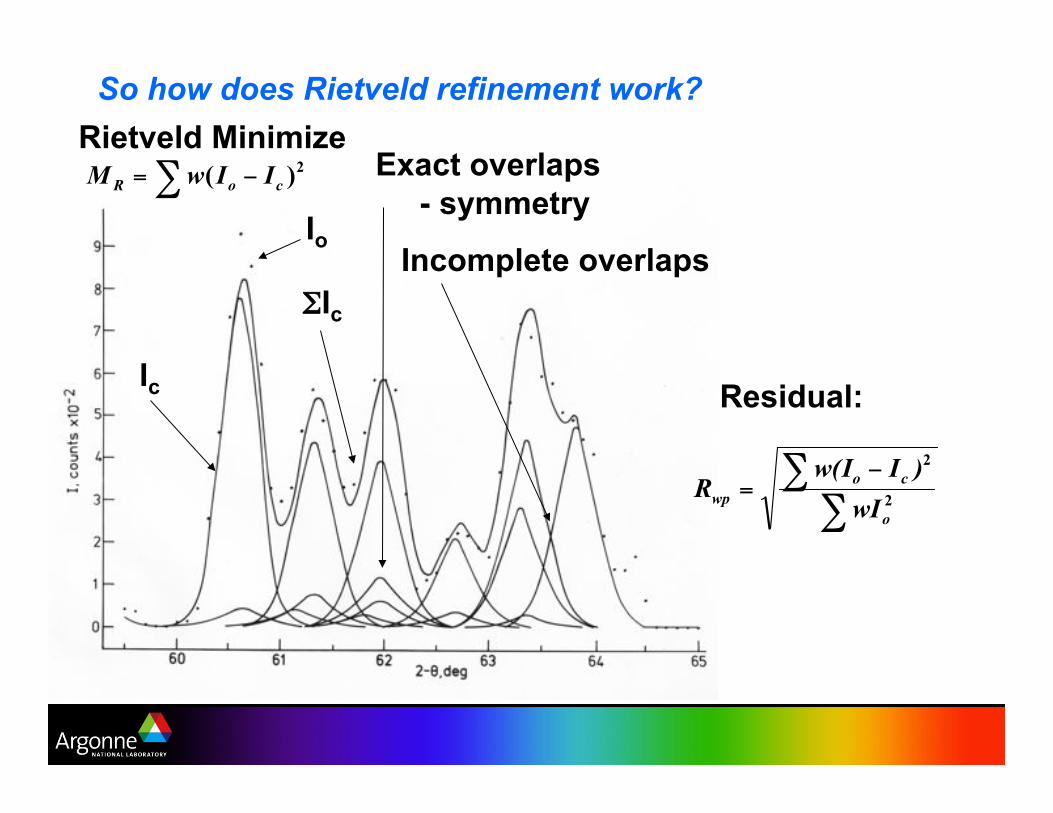
So how does Rietveld refinement work?
Exact overlaps
- symmetry
Incomplete overlaps Io
'Ic
Residual:
Rietveld Minimize
Ic
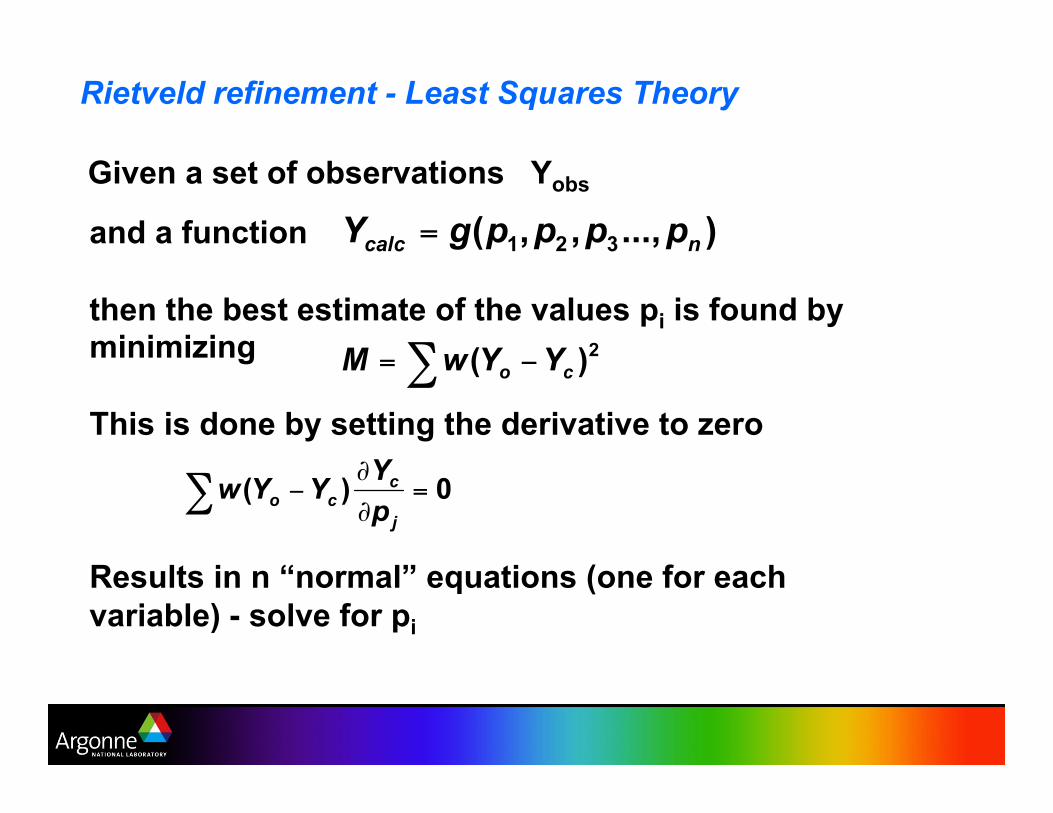
Rietveld refinement - Least Squares Theory
and a function
then the best estimate of the values pi is found by minimizing
This is done by setting the derivative to zero
Results in n “normal” equations (one for each
variable) - solve for pi
Given a set of observations Yobs
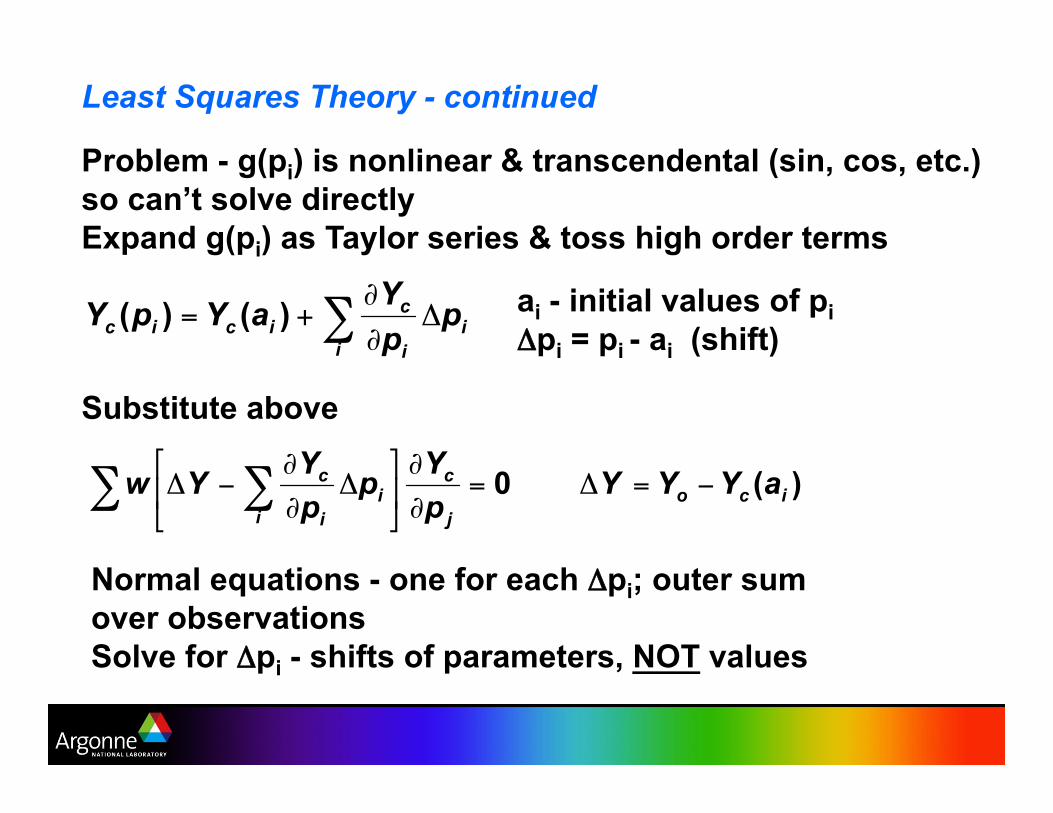
Least Squares Theory - continued
Problem - g(pi) is nonlinear & transcendental (sin, cos, etc.)
so can’t solve directly
Expand g(pi) as Taylor series & toss high order terms
Substitute above
ai - initial values of pi
(pi = pi - ai (shift)
Normal equations - one for each (pi; outer sum
over observations
Solve for (pi - shifts of parameters, NOT values
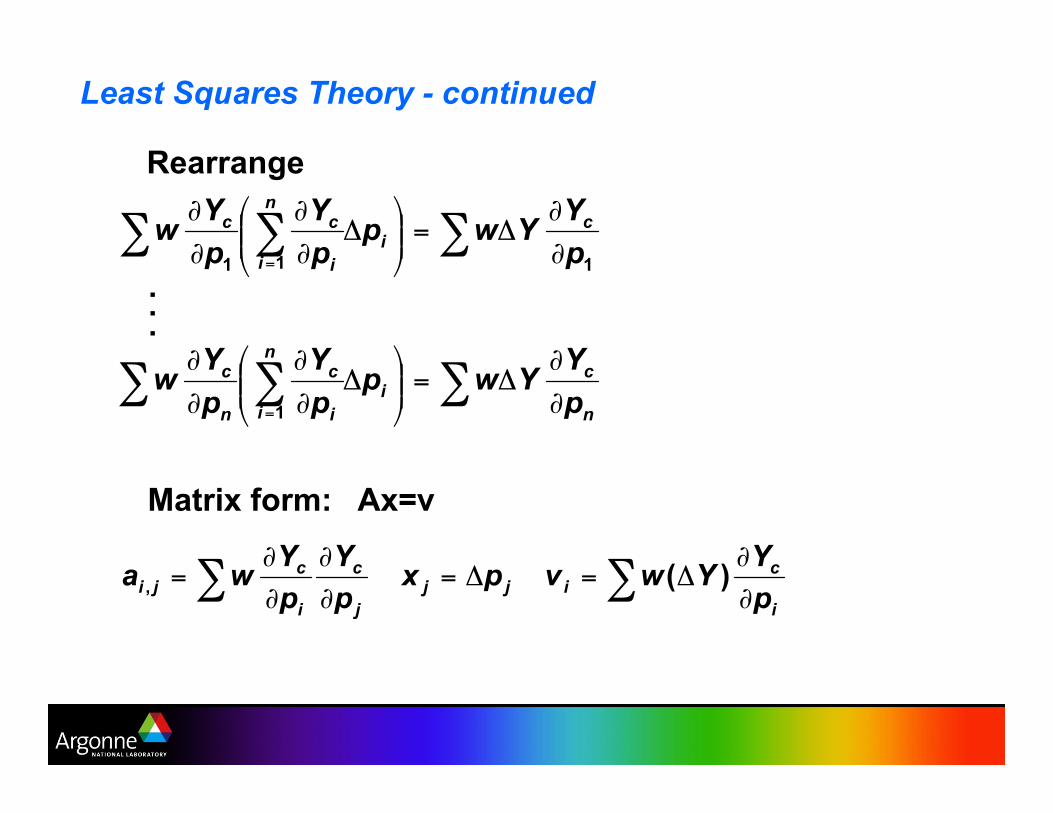
Least Squares Theory - continued
Rearrange
.
.
.
Matrix form: Ax=v
Least Squares Theory - continued
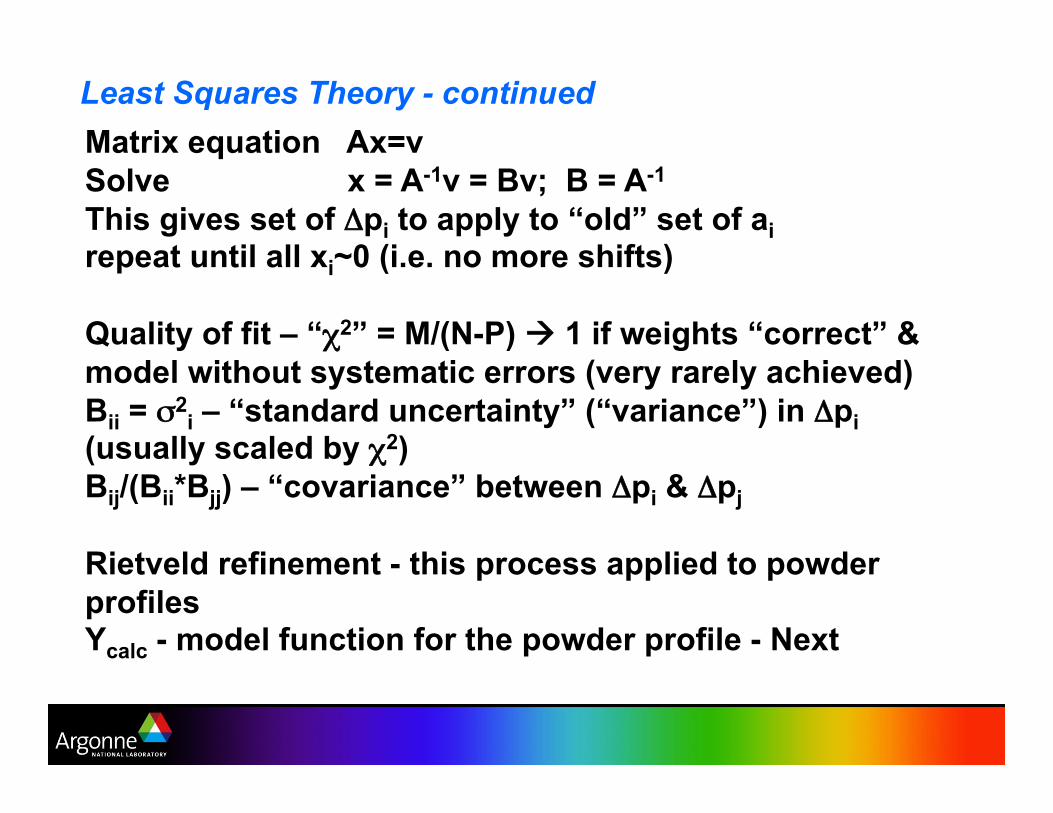
Matrix equation Ax=v
Solve x = A-1v = Bv; B = A-1
This gives set of (pi to apply to “old” set of ai repeat until all xi~0 (i.e. no more shifts)
Quality of fit – “!2” = M/(N-P) ! 1 if weights “correct” &
model without systematic errors (very rarely achieved)
Bii = )2i – “standard uncertainty” (“variance”) in (pi
(usually scaled by !2)
Bij/(Bii*Bjj) – “covariance” between (pi & (pj
Rietveld refinement - this process applied to powder
profiles Ycalc - model function for the powder profile - Next