GRUYERE RESOURCE INCREASES TO ASX Code GOR 6.2 MILLION ... · 4/22/2016 · Central Bore Mineral...
41
ASX Announcement 22 April 2016 Page 1 of 41 ASX Code GOR ABN 13 109 289 527 COMPANY DIRECTORS Ian Murray Executive Chairman Justin Osborne Executive Director Russell Davis Non-Executive Director Tim Netscher Non-Executive Director Martin Pyle Non-Executive Director Kevin Hart Company Secretary CONTACT DETAILS Principal & Registered Office Level 2, 26 Colin Street West Perth WA 6005 www.goldroad.com.au [email protected] T +61 8 9200 1600 F +61 8 9481 6405 GRUYERE RESOURCE INCREASES TO 6.2 MILLION OUNCES INCLUDING 0.5 MILLION OUNCES MEASURED Highlights Gruyere Mineral Resource increases 10% to 6.2 million ounces of gold 148 million tonnes at 1.30 g/t Au for 6.16 million ounces of gold 0.5 g/t Au cut‐off and A$1,700/oz Au (previously 0.7 g/t Au cut‐off and A$1,600/oz Au) Measured Resource increases 633% to 0.5 million ounces of gold 14 million tonnes at 1.18 g/t Au for 0.53 million ounces based on 15 kilometres of closely spaced Reverse Circulation (RC) drilling Equates to approximately two years of Pre‐Feasibility Study production Indicated Resource converted to Measured Resource with minimal variance Geological interpretation and mineralisation model confirmed and refined Primary mineralisation controls extend closer to surface than previously interpreted Leached gold zone restricted to Weathered (clay and saprolite) Domain affecting only 0.5% of the Mineral Resource Boundary between leached zone and Primary Domain well understood and delineated Gold Road Resources Limited (“Gold Road” or the “Company”) is pleased to announce completion of the latest update of the Gruyere Mineral Resource estimate in accordance with the 2012 JORC Code. The Gruyere Gold Project, situated 200 kilometres east of Laverton in Western Australia (Figure 1), now hosts a Mineral Resource totalling 147.7 million tonnes at 1.30 g/t Au for a total of 6.16 million ounces of gold, including 13.86 million tonnes at 1.18 g/t Au for a total of 0.53 million ounces of gold in the Measured category (9% of the total resource metal). Gold Road Executive Director, Justin Osborne said: "After completing a detailed infill drilling programme in late 2015, equivalent to grade control drilling in its spacing, we now have a greater understanding of the top 100 metres of the geology and mineralisation of the Gruyere Deposit. This next iteration of the Gruyere Mineral Resource now includes a significant quantity of Measured Resource which has been upgraded from previously classified Indicated Resource with no material change in the contained tonnes, grade or ounces. This gives us a tremendous level of confidence to take into the Feasibility Study, and future mining operations, that the resource model itself provides a very good predictor of the Gruyere mineralisation. The geological team have once again delivered an outstanding result and continue to improve on our significant knowledge of the Gruyere Deposit in readiness for future Project developments.” For personal use only
Transcript of GRUYERE RESOURCE INCREASES TO ASX Code GOR 6.2 MILLION ... · 4/22/2016 · Central Bore Mineral...

ASX Announcement 22 April 2016
Page 1 of 41
ASX Code GOR
ABN 13 109 289 527
COMPANY DIRECTORS
Ian Murray Executive Chairman
Justin Osborne Executive Director
Russell Davis Non-Executive Director
Tim Netscher Non-Executive Director
Martin Pyle Non-Executive Director
Kevin Hart Company Secretary
CONTACT DETAILS
Principal & Registered Office Level 2, 26 Colin Street West Perth WA 6005
www.goldroad.com.au [email protected]
T +61 8 9200 1600 F +61 8 9481 6405
GRUYERE RESOURCE INCREASES TO
6.2 MILLION OUNCES INCLUDING 0.5 MILLION OUNCES MEASURED
Highlights
Gruyere Mineral Resource increases 10% to 6.2 million ounces of gold
148 million tonnes at 1.30 g/t Au for 6.16 million ounces of gold
0.5 g/t Au cut‐off and A$1,700/oz Au (previously 0.7 g/t Au cut‐off and
A$1,600/oz Au)
Measured Resource increases 633% to 0.5 million ounces of gold
14 million tonnes at 1.18 g/t Au for 0.53 million ounces based on
15 kilometres of closely spaced Reverse Circulation (RC) drilling
Equates to approximately two years of Pre‐Feasibility Study production
Indicated Resource converted to Measured Resource with minimal variance
Geological interpretation and mineralisation model confirmed and refined
Primary mineralisation controls extend closer to surface than previously interpreted
Leached gold zone restricted to Weathered (clay and saprolite) Domain affecting only 0.5% of the
Mineral Resource
Boundary between leached zone and Primary Domain well understood and delineated
Gold Road Resources Limited (“Gold Road” or the “Company”) is pleased to announce completion of the latest
update of the Gruyere Mineral Resource estimate in accordance with the 2012 JORC Code. The Gruyere Gold
Project, situated 200 kilometres east of Laverton in Western Australia (Figure 1), now hosts a Mineral Resource
totalling 147.7 million tonnes at 1.30 g/t Au for a total of 6.16 million ounces of gold, including 13.86 million tonnes
at 1.18 g/t Au for a total of 0.53 million ounces of gold in the Measured category (9% of the total resource metal).
Gold Road Executive Director, Justin Osborne said: "After completing a detailed infill drilling programme in late
2015, equivalent to grade control drilling in its spacing, we now have a greater understanding of the top 100 metres
of the geology and mineralisation of the Gruyere Deposit. This next iteration of the Gruyere Mineral Resource now
includes a significant quantity of Measured Resource which has been upgraded from previously classified Indicated
Resource with no material change in the contained tonnes, grade or ounces. This gives us a tremendous level of
confidence to take into the Feasibility Study, and future mining operations, that the resource model itself provides
a very good predictor of the Gruyere mineralisation. The geological team have once again delivered an outstanding
result and continue to improve on our significant knowledge of the Gruyere Deposit in readiness for future Project
developments.”
For
per
sona
l use
onl
y

Page 2 of 41
Figure 1: Location and Geology of Yamarna Belt (plan view MGA Grid) showing Gold Road’s 100% tenements (blue outline) and
Gold Road‐Sumitomo South Yamarna Joint Venture tenements (red outline), Mineral Resources, Ore Reserves and main Exploration Projects.
For
per
sona
l use
onl
y

Page 3 of 41
Mineral Resource Update
Gold Road has completed an update to the Mineral Resource at its 100% owned Gruyere Gold Project in
accordance both with the 2012 JORC Code and with commonly accepted best practice for gold resource
evaluation1. The updated Mineral Resource now totals 147.71 million tonnes at 1.30 g/t Au for a total of 6.16
million ounces of gold, which represents a 15% increase in tonnes, a 5% decrease in grade and a 10% increase in
metal compared to the previous Mineral Resource (Tables 1 and 2). The updated Mineral Resource includes 13.86
million tonnes at 1.18 g/t Au for 0.53 million ounces in the Measured resource category, which represents 9% of
the total resource metal, and is located in the upper 100 metres of the deposit (Figure 2) which would be available
during the early years of mine development.
The Central Bore and Attila Trend Mineral Resources remain unchanged from the September 2015 Mineral
Resource estimate.
Table 1: Mineral Resource tabulation for the Yamarna Leases – April 2016
Project Name (cut‐off grade) Tonnes (Mt)
Grade (g/t Au)
Contained Metal
(Moz Au)
Gruyere (0.5 g/t Au) 147.71 1.30 6.16 % Total Gold Road
Resource 93%
Measured 13.86 1.18 0.53 % M 9%
Indicated 91.12 1.29 3.79 % I 61%
Measured and Indicated 104.98 1.28 4.31 % M and I 70%
Inferred 42.73 1.35 1.85
Central Bore (1.0 g/t Au) 0.63 9.0 0.18 % Total Gold Road
Resource 3%
Measured 0.04 26.5 0.04 % M 20%
Indicated 0.40 9.0 0.12 % I 63%
Measured and Indicated 0.44 10.71 0.15 % M and I 83%
Inferred 0.19 5.0 0.03
Attila Trend (0.7 g/t Au) 5.30 1.59 0.27 % Total Gold Road
Resource 4%
Measured 0.66 1.96 0.04 % M 15%
Indicated 3.85 1.52 0.19 % I 70%
Measured and Indicated 4.51 1.59 0.23 % M and I 85%
Inferred 0.79 1.59 0.04
Total 153.64 1.34 6.61
Measured 14.57 1.29 0.60 % M 9%
Indicated 95.37 1.33 4.09 % I 62%
Measured and Indicated 109.94 1.33 4.70 % M and I 71%
Inferred 43.7 1.37 1.92
Notes: Gruyere Mineral Resource reported at 0.5 g/t Au cut‐off, constrained within a A$1,700/oz Au optimised pit shell based on mining and processing parameters from the PFS (ASX announcement dated 8 February 2016), and geotechnical parameters consistent with the previous Mineral Resource estimate (ASX announcement dated 16 September 2015). Central Bore Mineral Resource reported at 1.0 g/t Au cut‐off (2014 Annual Report). Attila Trend (Attila and Alaric) Mineral Resource reported at 0.7 g/t Au cut‐off, constrained within a A$1,600/oz Au optimised pit shell (ASX announcement dated 16 September 2015). All Mineral Resources are completed in accordance with the 2012 JORC Code. All figures are rounded to reflect appropriate levels of confidence. Apparent differences may occur due to rounding.
1 Optiro review and endorsement letter Appendix 3.
For
per
sona
l use
onl
y

Page 4 of 41
The updated Mineral Resource is based on 357 RC holes for 41,264 metres and 113 diamond holes (Figures 2 and
3) for 31,109 metres (including 14,694 metres of RC pre‐collars) for a total of 87,066 metres drilled since the
discovery in October 2013 (ASX announcement dated 14 October 2013). The Gruyere drilling includes an additional
150 grade control equivalent RC holes (14,837 metres) and two diamond holes (673 metres) completed since the
previous Mineral Resource estimate (September 2015), which has contributed to a greater understanding of the
geological and mineralisation controls critical to the Mineral Resource estimate.
The major changes to the evaluation parameters used in reporting the Mineral Resource include lowering the cut‐
off grade to 0.5 g/t Au compared to the previous 0.7 g/t Au cut‐off. This is a result of the detailed calculation of
potential mining cut‐off grade economics determined as part of the Gruyere Pre‐Feasibility Study (PFS) completed
post the previous Mineral Resource announcement. This also aligns the Mineral Resource cut‐off grade with the
reported Ore Reserve (ASX announcement dated 8 February 2016).
The updated Mineral Resource has also been constrained and reported at an increased gold price of A$1,700 per
ounce gold, compared to the previous A$1,600 per ounce gold, which reflects an increasing Australian gold price
and the Company’s view of potential future pricing. The combination of lower cut‐off grade and increased gold
price are the major contributors to the 10% increase in overall Mineral Resource ounces in this update.
For
per
sona
l use
onl
y

Page 5 of 41
Figure 2: Gruyere Deposit longitudinal projection (looking west, Gruyere Grid) illustrating resource categories and April 2016 Mineral Resource constraining pit shell and PFS pit designs.
Drilling type and significant previously reported extensional intersections are also highlighted. Drill access restricted due to sand dunes.
For
per
sona
l use
onl
y

Page 6 of 41
Mineral Resource Variance and Sensitivity The updated Mineral Resource estimate represents an increase of 0.54 million ounces (+10%) compared to the
previous Mineral Resource (Table 2). The major variances are attributed to:
greater tonnage, and lower grade, available as a result of lowering of the cut‐off grade to 0.5 g/t Au from
0.7 g/t Au, in line with more detailed understanding of the cut‐off grade economics derived from the PFS
and the reported Ore Reserve; and
a slightly deeper optimised shell (previously 600 now 620 metres below surface at the deepest part of the
shell) as a result of increasing the constraining gold price to A$1,700/oz Au from A$1,600/oz Au in line with
an increasing Australian gold price and the Company’s view of potential future pricing.
Table 2: Summary Mineral Resource variance for Gruyere – April 2016 (updated) vs Previous
Resource Category
Tonnes (Mt) Grade (g/t Au) Metal (Moz Au) Change % Change
Previous April 2016
Previous April 2016
Previous April 2016
Tonnes (Mt)
Grade (g/t Au)
Metal (Moz Au)
Tonnes (Mt)
Grade (g/t Au)
Metal (Moz Au)
Measured 1.58 13.86 1.41 1.18 0.07 0.53 775% ‐16% 633% 12.28 ‐0.23 0.45
Indicated 93.48 91.12 1.35 1.29 4.05 3.79 ‐3% ‐4% ‐6% ‐2.37 ‐0.05 ‐0.26
Total M & I 95.07 104.98 1.35 1.28 4.12 4.31 10% ‐5% 5% 9.91 ‐0.07 0.19
Inferred 33.31 42.73 1.40 1.35 1.49 1.85 28% ‐4% 24% 9.42 ‐0.05 0.35
Total M, I & I 128.38 147.71 1.36 1.30 5.62 6.16 15% ‐5% 10% 19.33 ‐0.06 0.54
Notes: Gruyere Mineral Resource reported at 0.5 g/t Au cut‐off, constrained within a A$1,700/oz Au optimised pit shell based on mining and processing parameters from the PFS (ASX announcement dated 8 February 2016), and geotechnical parameters consistent with the previous Mineral Resource estimate (ASX announcement dated 16 September 2015). Previous Gruyere Mineral Resource reported at 0.7 g/t Au cut‐off, constrained within a A$1,600/oz Au optimised pit shell (ASX announcement dated 16 September 2015). All Mineral Resources are completed in accordance with the 2012 JORC Code. All figures are rounded to reflect appropriate levels of confidence. Apparent differences may occur due to rounding.
The 16% reduction in grade of the Measured component of the Mineral Resource is skewed by the large increase
in resource volumes between models, meaning a direct comparison of Measured Resource grade is meaningless.
The previous model only had a small localised volume of Measured Resource (1.6 million tonnes) compared to the
updated model with 13.9 million tonnes. The reconciliation section on the following page discusses this in detail
and demonstrates that the models within the equivalent volume show a change in grade of less than 1% for the
Primary Domain at the 0.5 g/t cut‐off.
The impact of the changes to cut‐off grade and gold price are demonstrated in Table 3, which compares the
previous Mineral Resource to the updated model optimised at A$1,600/oz Au and reported at 0.7 g/t Au cut‐off.
This analysis shows minimal variance (+2% tonnes, ‐1% grade, +1% ounces) between the two resource models
using the same constraints. Therefore, the increase in the updated Mineral Resource is predominantly related to
the cut‐off grade and gold price changes.
Table 3: Comparison of the previous Mineral Resource to the updated model optimised at A$1,600/oz Au and reported at 0.7 g/t Au cut‐off.
Resource Category
Cut‐off Grade (g/t Au)
September 2015 Mineral Resource Updated Model at A$1,600/oz Au Change %
Tonnes (Mt)
Grade (g/t Au)
Ounces (Moz Au)
Tonnes (Mt)
Grade (g/t Au)
Ounces (Moz Au)
Tonnes Grade (g/t Au)
Ounces (Moz Au) (Mt)
M, I & I 0.7 128.38 1.36 5.62 131.59 1.34 5.68 2% ‐1% 1% For
per
sona
l use
onl
y

Page 7 of 41
The updated Mineral Resource model has also been evaluated within pit shells generated at varying gold prices
(±A$200/oz) to determine sensitivity to gold price assumptions. Results are tabulated below and are reported at
the 0.5 g/t Au cut‐off (Table 4). This demonstrates the robust and relatively insensitive nature of the Gruyere
Mineral Resource, which varies by only ‐9% with a decrease in gold price of A$200/oz (‐540 koz less metal at
A$1,500/oz Au), and +9% with an increase of A$200/oz (533 koz more metal at A$1,900/oz Au).
Table 4: Sensitivity to constraining gold price pit shells ± A$200/oz (~11%) of Resource A$1,700/oz Au optimised pit shell.
Gold price (A$/oz)
Total M, I & I M, I & I Change from A$1,700
Tonnes (Mt)
Grade (g/t Au)
Ounces (koz Au)
Ounces (koz Au)
Ounces (%)
$1,500 134.75 1.30 5,621 ‐540 ‐9%
$1,700 147.71 1.30 6,160
$1,900 160.88 1.29 6,693 533 9%
Resource Model Reconciliation Other than monthly mine to mill reconciliation determined after a mining operation starts, the next best test of
the ability of a resource model to predict contained mineralisation is the comparison of the resource outputs with
the addition of new drilling and geological information. As a resource is upgraded in confidence from Inferred to
Indicated and ultimately Measured categories on the basis of increasing data, the level of variance between
iterations is the best measure of the models predictive ability. In this latest iteration for the Gruyere Mineral
Resource a significant volume of Indicated Resource has been upgraded to Measured Resource through the
addition of almost 15,000 metres of close‐spaced RC drilling at the equivalent of grade control spacing. This
upgrade now allows for a reliable assessment of the accuracy of the estimation of Indicated material in the
previous Mineral Resource model. Analysis of the reconciliation data (Tables 5 and 6) demonstrates excellent
predictive performance in estimating the gold mineralisation within the important Primary Domain (99% of the
mineral resource) to a high level of accuracy. The Weathered Domain, which contains only 22,800 ounces (<1% of
the Mineral Resource) showed a significant drop in grade between models (41% at 0.5 g/t cut‐off Au) due to intense
leaching of the gold associated with weathering effects which is better defined with the increased drilling
information. Whilst the quantum of the variance is considerable, the materiality is minimal due to the very small
component and restricted location of the Mineral Resource affected.
The objective of the infill drilling programme was to accurately define mineralisation and reduce risk in the first
two years of the mine production as defined in the PFS. The new data has allowed detailed interpretation of the
weathering profile and shows that the highly continuous Primary Domain mineralisation commences closer to
surface than previously interpreted, and now extends into the transitional and saprock zones. The new data also
indicates the Weathered Domain has a higher degree of leaching of gold than previously interpreted, as previously
described. The detailed changes to the interpretation are discussed further in the following sections.
For
per
sona
l use
onl
y

Page 8 of 41
Table 5: Summary model reconciliation by Domain at 0.5 and 1.0 g/t. The previous model is selected within the Measured volume of the updated model to ensure a same volume comparison.
Mineralised Domain
Cut‐off (g/t Au)
Previous Model in New Measured Volume
Updated Model Measured Only
Variance %
Tonnes (t)
Grade (g/t Au)
Gold (ounces)
Tonnes (t)
Grade (g/t Au)
Gold (ounces)
Tonnes (t)
Grade (g/t Au)
Gold (ounces)
Primary 0.5 12,684,700 1.21 493,000 13,063,800 1.20 502,800 3% ‐1% 2%
Weathered 0.5 613,200 1.51 29,900 799,700 0.89 22,800 30% ‐41% ‐24%
Total 0.5 13,297,600 1.22 522,900 13,863,400 1.18 525,700 4% ‐4% 1%
Primary 1.0 7,629,300 1.47 361,500 8,146,700 1.42 371,700 7% ‐4% 3%
Weathered 1.0 390,000 1.93 24,200 213,900 1.45 10,000 ‐45% ‐25% ‐59%
Total 1.0 8,019,100 1.50 385,700 8,360,600 1.42 381,700 4% ‐5% ‐1%
Table 6: Summary model reconciliation by resource category at 0.5 and 1.0 g/t. The previous model is selected within the Measured volume of the updated model to ensure a same volume comparison.
Resource Category
Cut‐off (g/t Au)
Previous Model in New Measured Volume
Updated Model Measured Only
Variance %
Tonnes (t)
Grade (g/t Au)
Gold (ounces)
Tonnes (t)
Grade (g/t Au)
Gold (ounces)
Tonnes (t)
Grade (g/t Au)
Gold (ounces)
M, I & I 0.5 13,297,600 1.22 522,900 13,863,400 1.18 525,700 4% ‐4% 1%
Measured 0.5 1,394,800 1.40 62,800 13,863,400 1.18 525,700 894% ‐16% 737%
Indicated 0.5 11,768,400 1.21 456,600
Inferred 0.5 134,400 0.82 3,500
M, I & I 1.0 8,019,100 1.50 385,700 8,360,600 1.42 381,700 4% ‐5% ‐1%
Measured 1.0 1,147,900 1.52 56,100 8,360,600 1.42 381,700 628% ‐7% 580%
Indicated 1.0 6,847,500 1.49 328,600
Inferred 1.0 23,700 1.33 1,000
For
per
sona
l use
onl
y

Page 9 of 41
Primary Domain – 99%2 of the Mineral Resource The Primary Domain, which makes up 99% of the total Mineral Resource and 96% of the Stage 1 PFS Pit Design,
reconciles very well between the previous estimate and this update, with a minor increase in tonnes at slightly
lower grade, for more ounces, at the 0.5 and 1.0 g/t cut‐offs Au. The identification of primary mineralisation
controls at higher elevations (20 to 45 metres) than previously defined means that the zones of most continuous
mineralisation characteristic of this Domain are encountered only 2 to 10 metres below surface in the southern
half of the Stage 1 PFS Pit Design.
The minimal change observed in the local reconciliation of the Primary Domain gives added confidence in the
existing geological interpretation and estimation of the remainder of the deposit.
Weathered Domain – 0.5%3 of the Mineral Resource The Weathered Domain, comprising approximately 0.5% of the total Mineral Resource, and 4% of the Stage 1 PFS
Pit Design, reconciles poorly between the two models, with higher tonnage at lower grade for less ounces at 0.5
and 1.0 g/t cut‐offs. New detailed geological data suggests that this Domain has undergone a greater degree of
leaching of gold due to weathering processes than previously interpreted. This results in the use of a lower gold
threshold (0.15 g/t Au compared to the Primary Domain threshold of 0.3 g/t Au) required to define continuous
mineralisation which results in an overall increased tonnage at lower grades.
The impact of the changes to the Weathered Domain on the project economics is minimal due to the very low
volume of mineralisation. Due to greater uncertainty in grade and volume continuity, a 12.5 metre east‐west by
25 metre section spacing infill grade control drilling programme is recommended to be completed prior to mining.
A test program over three 25 metre sections at this spacing was drilled in April to gain further confidence in the
Domain interpretation and estimation. Assays from this small programme are pending.
Drilling and Assay Summary
The updated Mineral Resource is based on a total of 87,066 metres from 470 drill holes (Table 7 and Figure 3)
including 14,837 metres of new RC drilling and results from two new diamond drill holes (15EIS001 and 15GY0300).
All assay information received up to 10 February 2016 was used in the grade estimate for the updated Mineral
Resource. Full details, including comprehensive reporting of assay results and intersections for all extensional drill
holes used in the updated Mineral Resource, have been previously reported and a listing of relevant ASX
announcements is provided in Appendix 2. The close‐spaced RC drilling used in this update is considered to be
operational in nature and detailed reporting of assay information is not considered relevant for reporting
purposes. Similarly, a small amount of data from geotechnical diamond drilling used in the update has not been
reported.
Table 7: Summary of Gruyere Resource Drilling Physicals RC and DDH available to inform the estimate
Drilling Physicals September 2015 Mineral Resource
Hole Type No Holes RC Metres Diamond Metres Total Metres
RC 357 41,264 41,264
Diamond with RC Pre‐collar 73 14,694 16,506 31,199
Diamond only 40 14,603 14,603
Total 470 55,958 31,109 87,066
2 Remaining 0.5 % is included in the Inferred Dispersion Blanket Domain not targeted by the infill drilling. 3 Remaining 0.5 % is included in the Inferred Dispersion Blanket Domain not targeted by the infill drilling.
For
per
sona
l use
onl
y

Page 10 of 41
The new RC drilling has been oriented perpendicular to the dip and strike of the Gruyere Porphyry (‐600 toward
2700) and was focussed in five areas ranging in strike length from 180 to 380 metres and equating to ~75% of the
resource strike length. The program infilled the existing drilling to a 25 by 25 metre spacing to a depth of
approximately 100 metres below surface. The “gaps” in the drilling in Figure 3 reflect the areas that could not be
accessed due to the presence of sand dunes which restrict or prevent drilling access. These areas will be drilled to
grade control drill density when the sand dunes are removed as part of the project development pre‐strip.
Included in the central area is a limited area (50 metre east‐west by 100 metre north‐south) of previous drilling of
12.5 by 12.5 metre and 12.5 metre by 25 metre spaced RC drill holes. Both patterns demonstrate very good short
scale continuity and define the Measured component of the Mineral Resource. Details of drill spacing of Indicated
and Inferred categories are included in the Table 1 report (Appendix 4).
A QAQC report was completed for data relevant to this update showing that results are acceptable, and the
combined new results are improving the overall assay data set. One major recommendation is the inclusion of
more frequent umpire laboratory assay checks, and changing the blanks to a more appropriate material (currently
using dune sand sourced from the Yamarna area).
Figure 3: Gruyere geological interpretation at 9,300 metres Rl (plan view Gruyere Grid) with RC and diamond (DDH) drill hole collars at surface
and pit outlines at surface. Restricted drill access due to sand dunes.
Restricted
drill access
For
per
sona
l use
onl
y

Page 11 of 41
Refinements to the Geological Interpretation
This section outlines refinements made to the geological interpretation for this Resource update. A detailed
description of the regional and local geological interpretation is included in the 16 September 2015 ASX
announcement and the Gold Road paper published in the proceedings of the NewGen Gold Conference in
November 2015.
Definition of the Weathering Profile A full set of 25 metre spaced cross‐sections was generated and manually interpreted, with focus on the weathering
profile and material type boundaries. These sections were spatially referenced using 3D imaging software and
used to guide digital construction of the geological model wireframes, resulting in a smoother and more realistic
interpretation of these boundaries.
As part of the process a material type logging guide was constructed (Appendix 5) as a reference for future logging
and mapping activities, and to provide clear definition of the different material types. The guide is also proved
very useful for communicating material type properties to disciplines other than geology, such as metallurgists to
assist with material classification for processing, and drill and blast engineers for use in ongoing blasting studies.
Mineralisation Controls Interpretation of the closely spaced RC data identified a clear demarcation between the highly weathered (clay
and saprolite) and primary mineralisation controls proximal to the oxide‐saprock interface. A gold leaching
boundary (solid line in Figure 4) has been interpreted in this position and is used to control the interaction between
domains. A hard boundary has been interpreted as there is a very apparent and highly visual change; above this
boundary the mineralisation is lower grade with relatively higher variance and lower continuity; below this
boundary the mineralisation is higher grade, has low variance, and is highly continuous (as discussed further
below).
The cut‐off grade for implicit modelling of the Primary Domain remains unchanged from previous modelling at
0.3 g/t, and the increased drilling data further supports this as the natural mineralisation cut‐off. To achieve the
continuity required for adequate grade modelling and estimation in the Weathered Domain (above the weathering
boundary) the cut‐off grade for implicit modelling is decreased to 0.15 g/t, which has the impact of increasing the
volume and lowering the mean grade of this minor zone when compared to the previous estimate.
Interpretation of the new data, with respect to the existing interpretation, combined with spatial analysis
(variography) shows that gold mineralisation within the Weathered Domain has dominant flat lying controls that
are consistent with re‐mobilisation and/or leaching of gold above the leaching boundary as a result of the
weathering processes.
Gold mineralisation in the saprock and transition zones is related to the same steeply east dipping controls as
interpreted for mineralisation in the fresh rock zone below the base of oxidation (Figure 4 and Table 8). In the
previous model the Domain boundary was interpreted at the saprock to transition boundary, meaning that the
Primary Domain mineralisation controls are now observed much closer to surface than previously interpreted, up
to 20 to 45 metres higher in elevation.
For
per
sona
l use
onl
y

Page 12 of 41
Figure 4: Schematic Gruyere Deposit geological cross sections 50,025 metres N (looking north, Gruyere Grid), illustrating the geological
interpretation of the mineralisation controls and the 25 metre spaced RC drilling. Leaching boundary represented by solid line between oxide and saprock.
Table 8: Summary of parameters used to define and construct the mineralised domains.
Domain Boundary Conditions Mineralised Wireframe Construction
Weathered Hard ‐ above leach boundary inside mineralised wireframe Geologically constrained implicit wireframe, >=0.15 g/t cut‐off, 2 metre internal waste, ignore <2 metre intervals.
Primary Hard ‐ below leach boundary inside mineralised wireframe Geologically constrained implicit wireframe, >=0.30 g/t cut‐off, 2 metre internal waste, ignore <2 metre intervals.
Dispersion Blanket
Hard ‐ inside mineralised wireframe Interval selection vein model
For
per
sona
l use
onl
y

Page 13 of 41
Domain Statistics and Mineralisation Continuity The updated Mineral Resource estimate incorporated a total of 32,293 RC and diamond assays within the
constraining mineralisation wireframes. The raw assays were composited to two‐metre lengths to remove sample
length biases and improve estimation quality.
Domain statistics describe clear differences in mean grade and CV (coefficient of variation, a simple measure of
the variability of a set of assay data) between Domains (Table 9). The higher CV in the Weathered Domain is
consistent with the higher variability implied by the gold re‐mobilisation and leaching interpretation. The low CV,
and global mean grade, in the Primary Domain remains virtually unchanged with the addition of considerable new
assay data which further highlights the extraordinarily consistent behaviour of this gold mineralisation. The
number of samples indicate the relative volumetrics and importance of each Domain.
Table 9: Basic statistics by Domain.
Domain Composite Length
Number of Samples
Min g/t
Max g/t
Mean g/t
Standard Deviation
g/t
Variance g/t2
Co‐efficient of
Variation
Number of
Samples Cut
% Samples
Cut
% Reduction in Mean
Weathered
Raw 1,526 0.01 21.88 0.72 1.54 2.38 2.14
2.0 m 820 0.02 12.22 0.70 1.14 1.29 1.61
2.0 m top‐cut
820 0.02 10.00 0.70 1.07 1.15 1.54 3 0.37% 1.00%
Primary
Raw 30,573 0.01 84.88 1.28 1.50 2.24 1.17
2.0 m 15,285 0.01 43.17 1.28 1.14 1.29 0.89
2.0 m top‐cut
15,285 0.01 30.00 1.28 1.11 1.23 0.87 1 0.01% 0.07%
Dispersion Blanket
Raw 194 0.09 5.87 0.83 0.86 0.74 1.03
2.0 m 106 0.11 3.45 0.85 0.71 0.50 0.83
2.0 m top‐cut
106 0.11 3.45 0.85 0.71 0.50 0.83 ‐ 0.00% 0.00%
A new variogram with shorter ranges than previous was interpreted for the Weathered Domain using the new data
(Table 10). This is consistent with the lower continuity implied by the gold leaching interpretation of this Domain.
This variogram was also used to estimate the Dispersion Blanket Domain (Inferred only) as there is not enough
data to create a meaningful variogram and the Domains share geological and geometric features.
A new variogram was interpreted for the Measured portion of the Primary Domain (predominantly hosted in
saprock and transition). The ranges of the new variogram are similar to the previous model, highlighting the
robustness of this Domain. The variography remained unchanged for the Indicated and Inferred portion of the
Primary Domain (predominantly hosted in fresh) as only minor data was added.
Table 10: Variogram parameters by Domain.
Domain Host Rock and Predominant Material Type
Strike/Dip Variogram Values (variance) Variogram Ranges (m)
Weathered Gruyere Porphyry Saprolite
000 / 00
Nugget 0.35 Dip Strike Perpendicular
C1 0.36 10 35 3
C2 0.24 22 60 6
C3 0.05 50 80 15
Primary Measured
Gruyere Porphyry
Saprock and Transition
000 / 75 E
Nugget 0.35 Dip Strike Perpendicular
C1 0.25 25 25 4
C2 0.25 65 110 7
C3 0.15 275 525 75
Primary Indicated
and Inferred
Gruyere Porphyry Fresh
000 / 75 E
Nugget 0.35 Dip Strike Perpendicular
C1 0.25 25 25 4
C2 0.33 115 145 8
C3 0.07 275 350 60
Dispersion Blanket
Mafic and Intermediate Sequence Saprolite
000 / 00 same as Weathered
For
per
sona
l use
onl
y

Page 14 of 41
Refinements to the Resource Model and Constraints
A detailed description of the previous Mineral Resource modelling parameters and constraints is set out in the ASX
announcement dated 16 September 2015. This section outlines the refinements made to the updated Mineral
Resource model and constraints (Table 1 report, Appendix 4).
New variograms were interpreted for the Weathered Domain and the Measured component of the Primary
Domain (discussed in previous section). Quantitative Kriging neighbourhood analysis was used to test and optimise
the input parameters for estimation by Ordinary Kriging (OK) and Localised Uniform Conditioning (LUC).
Refinement of the LUC estimation involved running six estimation scenarios which were tested and analysed prior
to deciding on final input parameters. The main changes were:
Declustering of the input data in Supervisor where the weight is inversely proportional to the number of
data points in each 12.5 metre X by 25 metre Y by 5 metre Z cell
Use of more cut‐off bins at 0.1 g/t (previously 0.3 g/t) within the uniform conditioning process. This results
in an improved, smoother, and more reliable grade tonnage curve.
A substantial amount of new metallurgical test work allowed minor changes to the metallurgical recoveries applied
by material type and grind size behaviours (Table 1 report, Appendix 4) which are used in the constraining open
pit evaluation.
The updated Mineral Resource has been constrained by an optimised Whittle pit shell to determine the portion of
the total mineralised inventory within the geological model that has a reasonable prospect of eventual economic
extraction. Only Measured, Indicated and Inferred resource categories of mineralisation that fall within this
optimised pit shell have been reported as Mineral Resource. A small amount of mineralised inventory (39,000
ounces) is located within the shell but has not been reported as part of the Mineral Resource due to an insufficient
level of confidence to classify as Inferred. The input parameters for the optimisation are summarised in Table 11.
The main changes impacting the updated Mineral Resource were the changes to cut‐off grade and gold price as
previously discussed.
Table 11: Summary of input parameters used to constrain the Mineral Resource.
Optimisation Parameter Previous Value Updated Value Comment
Cut‐off Grade (g/t Au) 0.7 0.5 PFS value derived from detailed mining study
Gold Price (A$/oz) 1,600 1,700 Increasing gold price environment and longer term view of gold price
Exchange Rate US$0.75:A$1.00 US$0.73:A$1.00 PFS value (this is for reference, there is no impact of currency exchange rates on the Resource evaluation)
Reference Mining Cost (A$/t) 2.52 2.78 PFS value adjusted for contractor mining fleet and larger equipment
Overall Slope Angle Weathered 32.0° ‐ 35.0° 32.0° ‐ 35.0° Unchanged from previous
Overall Slope Angle Fresh 52.0° 52.0° Unchanged from previous
Grind Size 106µm 106µm Unchanged from previous
Fresh Rock Processing Cost* (A$/t) 17.31 18.00 PFS value
*Includes grade control and crusher feed costs.
Future Work
Deeper drilling targeting the extensional potential highlighted by the previously released extensional drill results
below the current resource limits (Figure 2) will be completed in the medium to longer term. An underground
conceptual study completed by AMC consultants for Gold Road concluded that Gruyere has underground mining
potential utilising low cost caving methods.
For
per
sona
l use
onl
y

Page 15 of 41
Production targets
This announcement includes information that relates to a production target which was prepared and first disclosed
under the 2012 JORC Code. This information was included in the Company’s previous announcement of the Pre‐
Feasibility Study on 8 February 2016. This prior announcement is available at the Company’s website. The
Company confirms that all the material assumptions underpinning the production target in the prior
announcement continue to apply and have not materially changed.
For further information please visit www.goldroad.com.au or contact:
Gold Road Resources Ian Murray Executive Chairman Telephone: +61 8 9200 1600
Media and Broker Enquiries Luke Forrestal ‐ [email protected] Annette Ellis ‐ [email protected] Cannings Purple Tel: +61 8 6314 6300
About Gold Road Resources
Gold Road Resources is pioneering development of Australia’s newest goldfield, the Yamarna Belt located 200
kilometres east of Laverton in Western Australia. The Company holds interests in tenements covering
approximately 5,000 square kilometres in the region, which is historically underexplored and highly prospective
for gold mineralisation.
These tenements contain a gold resource of 6.6 million ounces, including 6.2 million ounces at the wholly owned
Gruyere Deposit, which Gold Road Resources discovered in 2013 and is currently the focus of development studies
based on a 3.2 million ounce ore reserve.
While progressing the Gruyere Deposit towards first production, Gold Road Resources continues to explore for
similar‐scale deposits on its own across the Company’s 100% owned North Yamarna tenements and in conjunction
with joint venture partner, Sumitomo Metal Mining Oceania (a subsidiary of Sumitomo Metal Mining Co. Limited),
on its 50% owned South Yamarna tenements.
For
per
sona
l use
onl
y

Page 16 of 41
Competent Person Statement – Gold Road Resources
The information in this report which relates to Exploration Results is based on information compiled by Mr Justin Osborne,
Executive Director for Gold Road. Mr Osborne is an employee of Gold Road, as well as a shareholder and share option holder,
and is a Fellow of the Australasian Institute of Mining and Metallurgy (FAusIMM 209333). Mr Osborne has sufficient experience
that is relevant to the style of mineralisation and type of deposit under consideration and to the activity being undertaken to
qualify as a Competent Person as defined in the 2012 Edition of the “Australasian Code for Reporting of Exploration Results,
Mineral Resources and Ore Reserves”. Mr Osborne consents to the inclusion in the report of the matters based on this
information in the form and context in which it appears.
The information in this report that relates to the Mineral Resource Estimation for Gruyere is based on information compiled by
Mr Justin Osborne, Executive Director for Gold Road and Mr John Donaldson, Principal Resource Geologist for Gold Road. Mr
Osborne is an employee of Gold Road, as well as a shareholder and share option holder, and is a Fellow of the Australasian
Institute of Mining and Metallurgy (FAusIMM 209333). Mr Donaldson is an employee of Gold Road as well as a shareholder,
and is a Member of the Australian Institute of Geoscientists and a Registered Professional Geoscientist (MAIG RPGeo Mining
10147). Messrs Osborne and Donaldson have sufficient experience that is relevant to the style of mineralisation and type of
deposit under consideration and to the activity being undertaken to qualify as Competent Persons as defined in the 2012 Edition
of the “Australasian Code for Reporting of Exploration Results, Mineral Resources and Ore Reserves”. Messrs Osborne and
Donaldson consent to the inclusion in the report of the matters based on this information in the form and context in which it
appears.
The information in this report that relates to the Mineral Resource Estimation for Attila Trend is based on information compiled
by Mr Justin Osborne, Executive Director for Gold Road, Mr John Donaldson, Principal Resource Geologist for Gold Road and Mrs
Jane Levett, Senior Resource Geologist for Gold Road. Mr Osborne is an employee of Gold Road, as well as a shareholder and
share option holder, and is a Fellow of the Australasian Institute of Mining and Metallurgy (FAusIMM 209333). Mr Donaldson
is an employee of Gold Road as well as a shareholder, and is a Member of the Australian Institute of Geoscientists and a
Registered Professional Geoscientist (MAIG RPGeo Mining 10147). Mrs Levett is a part time employee of Gold Road, and is a
Member of the Australasian Institute of Mining and Metallurgy and a Chartered Professional (MAusIMM (CP) 112232). Messrs
Osborne and Donaldson and Mrs Levett have sufficient experience that is relevant to the style of mineralisation and type of
deposit under consideration and to the activity being undertaken to qualify as Competent Persons as defined in the 2012 Edition
of the “Australasian Code for Reporting of Exploration Results, Mineral Resources and Ore Reserves”. Messrs Osborne and
Donaldson and Mrs Levett consent to the inclusion in the report of the matters based on this information in the form and context
in which it appears.
The information in this report that relates to the Mineral Resource Estimation for Central Bore is based on geostatistical
modelling by Ravensgate using sample information and geological interpretation supplied by Gold Road. The Mineral Resource
estimates were undertaken by Mr Craig Harvey, previously Principal Consultant at Ravensgate and Mr Neal Leggo, Principal
Consultant at Ravensgate. Messrs Harvey and Leggo are both Members of the Australian Institute of Geoscientists. Messrs
Harvey and Leggo have sufficient experience relevant to the style of mineralisation and type of deposit under consideration and
to the activity which they are undertaking to qualify as a Competent Person as defined in the 2012 Edition of the “Australasian
Code for Reporting of Exploration Results, Mineral Resources and Ore Reserves.” Messrs Harvey and Leggo consent to the
inclusion in the report of the matters based on this information in the form and context in which it appears.
The Company confirms that it is not aware of any new information or data that materially affects the information included in the original market announcements and, in the case of estimates of Mineral Resources and reserves, that all material assumptions and technical parameters underpinning the estimates in the relevant market announcement continue to apply and have not materially changed. The Company confirms that the form and context in which the Competent Persons’ findings are presented have not materially changed from the original market announcements.
For
per
sona
l use
onl
y

Page 17 of 41
Appendix 1 – Mineral Resource Table and Grade Tonnage Curve
Table: A1.1: Gruyere Mineral Resource by Resource Category at varying gold cut‐off grade
Cut‐off (g/t Au)
Measured Indicated Inferred Total M, I & I
Tonnes (Mt)
Grade (g/t Au)
Ounces (koz)
Tonnes (Mt)
Grade (g/t Au)
Ounces (koz)
Tonnes (Mt)
Grade (g/t Au)
Ounces (koz)
Tonnes (Mt)
Grade (g/t Au)
Ounces (koz)
0.0 14.19 1.16 530.0 91.96 1.28 3,798.7 42.95 1.34 1,851.0 149.09 1.29 6,179.7
0.5 13.86 1.18 525.7 91.12 1.29 3,786.6 42.73 1.35 1,847.7 147.71 1.30 6,160.0
0.7 12.72 1.23 502.8 84.86 1.34 3,659.0 40.44 1.39 1,800.9 138.02 1.34 5,962.7
0.8 11.55 1.28 474.4 78.71 1.39 3,507.2 37.95 1.43 1,739.7 128.22 1.39 5,721.3
0.9 10.08 1.34 434.2 71.06 1.44 3,294.2 34.84 1.48 1,653.3 115.98 1.44 5,381.7
1.0 8.36 1.42 381.7 62.45 1.51 3,027.5 31.11 1.54 1,537.9 101.92 1.51 4,947.1
1.1 6.73 1.51 326.9 53.67 1.58 2,728.2 27.26 1.60 1,406.8 87.66 1.58 4,461.8
1.2 5.33 1.60 275.2 45.19 1.66 2,413.0 23.48 1.68 1,266.2 74.01 1.66 3,954.4
1.5 2.47 1.92 151.9 24.75 1.92 1,531.2 13.62 1.92 839.3 40.83 1.92 2,522.5
Figure A1.1: Gruyere Updated Mineral Resource Grade‐Tonnage Curve for all Resource categories
0.0
1.0
2.0
0.0
20.0
40.0
60.0
80.0
100.0
120.0
140.0
160.0
0.0 0.5 0.7 0.8 0.9 1.0 1.1 1.2 1.5
Gra
de
(g/t
Au
)
Ton
nes
(M
t)
Cut-off grade (g/t Au)
Gruyere Mineral ResourceM, I & I Grade Tonnage Curve
April 2016
Tonnes Grade (g/t Au)
Resource
For
per
sona
l use
onl
y

Page 18 of 41
Appendix 2 – Previous and Relevant Gruyere ASX Announcements and
Published Papers
Date of Announcement
Announcement Title Significance
08/02/2016 Gold Road Pre‐Feasibility Study Information Booklet Information booklet
08/02/2016 Gruyere Pre‐Feasibility Study Confirms Long Life Gold Mine 3.2 Moz Maiden Ore Reserve Reserve Announcement
27/01/2016 Yamarna Exploration Update: Regional Success Continues Drill results
17‐18/11/2015 The Gruyere gold deposit, Yamarna Greenstone Belt, Western Australia – in Conference
proceedings, Case histories of discovery, NewGenGold 2015 Published Paper
16/09/2015 Gruyere Resource Increases to 5.62 Million Ounces; Yamarna Mineral Resource Fully
JORC 2012 Compliant Resource Announcement
07/09/2015 Gruyere gold mineralisation confirmed to more than 1km depth Drill results
10/08/2015 Gruyere Porphyry Intersected 1100m Below Surface Drill results
03/08/2015 Gruyere PFS ‐ Stage 1 Completed Study results
24/06/2015 Gruyere drilling confirms higher grade continuity at depth Drill results
28/05/2015 Gruyere Resource Grows to 5.51m Ounces Gold Resource Announcement
26/05/2015 Key Appointments to Bolster Gruyere Project PFS
25/05/2015 Gruyere Resource and PFS Drilling Completed Drill results
07/05/2015 Further Metallurgical Testwork Success at Gruyere Metallurgical test results
28/01/2015 Audio Broadcast ‐ Completes Gruyere Scoping Study
27/01/2015 Gruyere Scoping Study a Robust Long Life Gold Project Scoping Study results
21/01/2015 Audio Broadcast ‐ Gruyere
20/01/2015 Best Intersection Ever Extends Gruyere Mineralisation Drill results
16/12/2014 Exploration update ‐Sun River ‐Wanderrie, Gruyere & Toto Drill results
04/08/2014 3.84 Million Ounce Gruyere Maiden Gold Resource Resource Announcement
30/07/2014 Gruyere Resource Drill Out ‐ Final Assays Received Drill results
28/07/2014 Gruyere Assays Confirm Continuity Along Strike and at Depth Drill results
07/07/2014 Results of Deep Diamond holes at Gruyere Drill results
03/07/2014 Results of Gruyere Metallurgical Testwork Metallurgical test results
25/06/2014 New Geochemical Anomaly Identified South of Gruyere Deposit Regional exploration
23/06/2014 Gruyere Resource Drilling Completed Drilling update
12/05/2014 Gruyere Drilling Confirms High Grade Trend in Northern Zone Drill results
07/05/2014 Gruyere Drilling Confirms Model and High Grade Controls Drill results
05/05/2014 Gruyere Metallurgical Testing Delivers High Recoveries Metallurgical test results
18/03/2014 Broad Higher Grade Intercepts in Gruyere RC Drilling Drill results
17/03/2014 Gruyere Diamond Drilling Doubles Depth of Mineralisation Drill results
13/03/2014 Gruyere Drilling Confirms Northern High Grade Gold at Depth Drill results
24/02/2014 High Grade Gold Intersection From Gruyere Prospect ‐ amended Drill results
24/02/2014 High Grade Gold Intersection From Gruyere Prospect Drill results
19/02/2014 Continuous Gold Mineralisation Intersected to 250 metres Drill results
17/02/2014 Drilling shows strike potential ‐ Gruyere expanded to 2,600m Drill results
03/02/2014 Exceptional Metallurgical Test Results from Gruyere Prospect Metallurgical test results
14/01/2014 Consistent mineralisation in large gold system at Gruyere Drill results
23/12/2013 Thick High Grade Mineralisation Extends Gruyere to 1.6km Drill results
02/12/2013 Continuity of Mineralisation Confirmed at Gruyere Prospect Drill results
18/11/2013 Gruyere Discovery Doubles in Size at Dorothy Hills Trend Drill results
04/11/2013 Assays from Resampling Confirm Discoveries at Dorothy Hills Drill results – Re‐assays
14/10/2013 Breakthrough Gold Discoveries Confirmed at Dorothy Hills Discovery Drill results
17/09/2013 RAB Intersects Second Gold Mineralised Zone at Dorothy Hills Initial anomalism
26/08/2013 RAB Drilling identifies Second Gold Anomaly at Dorothy Hills Initial anomalism
For
per
sona
l use
onl
y
Page 19 of 41
Appendix 3 ‐ Audit and Endorsement of Updated Gruyere Mineral Resource by
Ian Glacken, Optiro Pty Ltd
Justin Osborne, John Donaldson Gold Road Resources Limited Level 2, 26 Colin St West Perth WA 6005
4 April 2016 Our Ref: J_1946_G
Dear Justin and John
REVIEW AND ENDORSEMENT OF GRUYERE APRIL 2016 MINERAL RESOURCE UPDATE Ian Glacken, Principal Consultant and Director at Optiro, has been retained by Gold Road Resources Limited (Gold Road) to review Gold Road’s Mineral Resource update at the Gruyere Project dated April 2016, and generated during the first quarter of 2016. This resource update reflects a significant amount of drilling at Gruyere during 2015, much of it shallow and at close spacings, but also including some deep drill holes which demonstrate the continuity of the Gruyere mineralisation at depth. The previous Mineral Resource update for Gruyere which was reported to the ASX was dated 16 September 2015. Optiro has reviewed the September 2015 resource estimate and the two previous Mineral Resources reported for Gruyere. Optiro has reviewed the updated geological interpretation based upon the most recent drilling and the results of ongoing data quality assurance, including geoscientific data collection and QAQC. The interpretation and the data and assay quality assurance measures all reflect best practice procedures and processes carried out by Gold Road staff and contractors. The April 2016 Mineral Resource update for Gruyere is again evolutionary and highlights the stability and maturity of the geological and mineralisation models. There have been some moderate changes to the interpretation and estimation of dispersed near‐surface mineralisation hosted in the saprolite and saprock zones based upon the significant additional reverse circulation drilling in this zone, resulting in a reduction in the grade and an increase in the mineralisation tonnage in the top 80 m of the deposit. A hard grade boundary between weathered and fresh mineralisation has also been interpreted at the base of a leached horizon. The weathered Mineral Resource, however, reflects approximately 0.5% of the Gruyere total. The additional drilling into the fresh, porphyry‐hosted mineralisation has confirmed the remarkable grade consistency and persistence of this ore zone, where the grade has not changed significantly since the first phase of drilling. In line with Pre‐feasibility Studies completed by Gold Road the resource cut‐off grade for reporting has been reduced from 0.7 g/t gold to 0.5 g/t, and this has resulted in a tonnage increase. The recoverable resource estimation technique first applied in the September 2015 update has been retained and refined for the April 2016 reporting, but with the drop in cut‐off grade there is a decreasing tonnage and ounces margin between the whole block estimate (assuming no mining selectivity) and the recoverable estimate (assuming some selectivity as per the planned mining approach). This is testament to the thickness and uniformity of the fresh mineralisation and the relative paucity of higher and lower grade zones. Some higher‐grade shoots are thought to exist but these have not yet been modelled and may add little value to the overall resource estimate. The additional drilling has allowed an increase in the proportion of the orebody which can be classified as Measured under the guidelines of the 2012 JORC Code. These zones are characterised by 25 x 25 m drilling and strong grade continuity. The proportion of Indicated Mineral Resource has also decreased as a function of the additional drilling. Also consistent with best practice, the Mineral Resource has been constrained by an optimal pit shell which is based upon realistic (e.g. Pre‐feasibility level mining cost estimates) and a conservative gold price of A$1700. Optiro is satisfied that the Gruyere Mineral Resource has been generated, estimated and classified in accordance both with the 2012 JORC Code and with commonly‐accepted best practice for gold resource evaluation. Gold Road continues to apply the highest standards to data collection, assay quality assurance, geological interpretation, modelling, validation and reporting and Optiro is happy to endorse the April 2016 estimate.
For
per
sona
l use
onl
y

Page 20 of 41
Ian Glacken is a geologist and geostatistician with over 30 years worldwide mining industry experience who is fully independent of Gold Road. He has worked at, estimated, evaluated or audited hundreds of gold deposits over an 18 year independent consulting career, particularly in the Archaean of Western Australia but also worldwide. Yours sincerely OPTIRO
Ian M Glacken MSc (Geology), MSc (Geostatistics), FAusIMM(CP), FAIG, MIMMM, CEng Director and Principal Consultant
For
per
sona
l use
onl
y

Page 21 of 41
Appendix 4 JORC Code, 2012 Edition – Table 1 Report
Section 1 Sampling Techniques and Data Note: Details for drilling data used in the Gruyere Mineral Resource has previously been reported in ASX Announcements released between 14 October 2013 and 27 January 2016.
These announcements are listed in Appendix 2 of this release. The data for the 25 by 25 m RC program has not been publicly released as it is considered to be operational in
nature. These holes were treated with the same geological protocols as described in Table 1 below.
(Criteria in this section apply to all succeeding sections.) Criteria JORC Code explanation Commentary
Sampling techniques
Nature and quality of sampling (eg cut channels, random chips, or specific specialised industry standard measurement tools appropriate to the minerals under investigation, such as down hole gamma sondes, or handheld XRF instruments, etc). These examples should not be taken as limiting the broad meaning of sampling.
The sampling has been carried out using a combination of Reverse Circulation (RC) and Diamond Drilling (DDH).
RC drill samples are collected through a rig‐mounted cone splitter designed to capture a one metre sample with optimum 3 to 4kg sample weight.
Drill core is logged geologically and marked up for assay at approximate one metre intervals based on geological observation. Drill core is cut in half by a diamond saw and half core samples submitted for assay analysis.
Detailed descriptions of drilling orientation relative to deposit geometries, and full sample nature and quality are given below.
Include reference to measures taken to ensure sample representation and the appropriate calibration of any measurement tools or systems used.
Sampling was carried out under Gold Road’s protocols and QAQC procedures as per industry best practice. See further details below.
Aspects of the determination of mineralisation that are Material to the Public Report. In cases where ‘industry standard’ work has been done this would be relatively simple (eg ‘reverse circulation drilling was used to obtain 1 m samples from which 3 kg was pulverised to produce a 30 g charge for fire assay’). In other cases more explanation may be required, such as where there is coarse gold that has inherent sampling problems. Unusual commodities or mineralisation types (eg submarine nodules) may warrant disclosure of detailed information.
RC holes were drilled with a 5.25 inch face‐sampling bit, 1 m samples were collected through a cyclone and cone splitter to form a 2‐4 kg sample. All holes with reported assays from RC drilling are from the original 1 m samples collected from the splitter except for 1% of RC samples, which were four metre composite samples collected through logged waste zones.
The 4 m composite samples were created by spear sampling of the total 1 m samples collected in large plastic bag from the drilling rig and were deposited into separate numbered calico bags for sample despatch. No assays collected by four metre composite sampling were used in the Resource estimation.
Diamond drilling was completed using an HQ or NQ drill bit for all holes. Core is cut in half for sampling, with a half core sample sent for assay at measured intervals.
Both RC and diamond samples were fully pulverised at the laboratory to ‐75um, to produce a 50g charge for Fire Assay with an AAS finish up until May 2014 and ICPES finish post this date.
Drilling techniques Drill type (eg core, reverse circulation, open‐hole hammer, rotary air blast, auger, Bangka, sonic, etc) and details (eg core diameter, triple or standard tube, depth of diamond tails, face‐sampling bit or other type, whether core is oriented and if so, by what method, etc).
RC drilling rigs, owned and operated by Raglan Drilling, were used to collect the RC samples. The face‐sampling RC bit has a diameter of 5.25 inches (13.3 cm).
Diamond drilling rigs operated by Terra Drilling Pty Ltd collected the diamond core as NQ or HQ size. The majority of diamond holes used RC pre‐collars to drill through barren hanging‐wall zones to specified depth, followed by diamond coring at NQ size from the end of the pre‐collar to the end of hole. This ensured diamond core recovery through the mineralised zones within the Gruyere Porphyry.
Core is oriented using downhole Reflex surveying tools, with orientation marks provided after each drill run.
For
per
sona
l use
onl
y

Page 22 of 41
Criteria JORC Code explanation Commentary
Drill sample recovery
Method of recording and assessing core and chip sample recoveries and results assessed. The majority of RC samples were dry. Ground water egress occurred in some holes at variable depths between 100 and 400 m. Drill operators ensured that water was lifted from the face of the hole at each rod change to ensure that water did not interfere with drilling and that all samples were collected dry. When water was not able to be isolated from the sample stream the drill hole was stopped and drilling was completed with a diamond tail.
RC recoveries were visually estimated, and recoveries were recorded in the log as a percentage. Recovery of the samples was good, generally estimated to be close to 100%, except for some sample loss at the top of the hole.
All diamond core collected is dry. Drill operators measure core recoveries for every drill run completed using a 3 m core barrel. The core recovered is physically measured by tape measure and the length recovered is recorded for every 3 m “run”. Core recovery is calculated as a percentage recovery. Close to 100% recoveries were achieved for the majority of diamond drilling completed at Gruyere.
Measures taken to maximise sample recovery and ensure representative nature of the samples.
RC face‐sampling bits and dust suppression were used to minimise sample loss. Drilling air pressure lifted the water column above the bottom of the hole to ensure dry sampling. RC samples were collected through a cyclone and rotary cone splitter. The rejects were deposited in a large plastic bag and retained for potential future use. The sample required for assay is collected directly into a calico sample bag at a designed 3 ‐ 4 kg sample mass which is optimal for whole‐of‐sample pulverisation at the assay laboratory.
Diamond drilling results in uncontaminated fresh core samples which are cleaned at the drill site to remove drilling fluids and cuttings to present clean core for logging and sampling.
Whether a relationship exists between sample recovery and grade and whether sample bias may have occurred due to preferential loss/gain of fine/coarse material.
All RC samples were dry with the exception of a few samples (<5%) that were reported as slightly damp to the end of the hole. Apart from the tops of the holes while drilling through the sand dune cover, there is no evidence of excessive loss of material and at this stage no information is available regarding possible bias due to sample loss.
There is no significant loss of material reported in any of the Diamond core.
Logging Whether core and chip samples have been geologically and geotechnically logged to a level of detail to support appropriate Mineral Resource estimation, mining studies and metallurgical studies.
All chips and drill core were geologically logged by Gold Road geologists, using the Gold Road logging scheme. This provides data to a level of detail adequate to support Mineral Resource Estimation activities.
Approximately 30% of holes have been surveyed using downhole optical (OTV) and/or acoustic (ATV) televiewer tools which provide additional information suitable for geotechnical and specific geological studies.
A full set (49,425 to 50,950 mN) of 25 m spaced manually interpreted cross‐sections were geo‐referenced and used to guide digital construction of material type wireframes. A weathering profile guide was developed as part of the process in order to document the features and provide a guide for further logging and open pit mapping.
Nine specific geotechnical diamond holes were drilled to support the PFS and a further 12 drilled to support the FS. The holes were designed and logged in geotechnical detail by Dempers and Seymour Pty Ltd Geotechnical Mining Consultants. Collaboration between the geological and geotechnical groups has resulted in refinement of the geological interpretation, particularly the understanding of significant faults and shear zones.
Metallurgical composite samples selected over the life of the project have been based on the detailed logging information, gold grades and geological interpretation. F
or p
erso
nal u
se o
nly

Page 23 of 41
Criteria JORC Code explanation Commentary
Whether logging is qualitative or quantitative in nature. Core (or costean, channel, etc) photography.
Logging of RC chips records lithology, mineralogy, mineralisation, weathering, colour and other features of the samples. All samples are wet‐sieved and stored in a chip tray.
Logging of drill core records lithology, mineralogy, mineralisation, weathering, colour and other features of the samples, along with structural information from oriented drill core. All samples are stored in core trays.
All core is photographed in the trays, with individual photographs taken of each tray both dry, and wet; all photos are uploaded to and stored in the Gold Road server database.
The total length and percentage of the relevant intersections logged All RC and diamond holes were logged in full.
Sub‐sampling techniques and sample preparation
If core, whether cut or sawn and whether quarter, half or all core taken. Core samples were cut in half using an automated Corewise diamond saw. Half core samples were collected for assay, and the remaining half core samples are stored in the core trays.
If non‐core, whether riffled, tube sampled, rotary split, etc and whether sampled wet or dry.
One metre RC drill samples are collected via a rotary cone‐splitter, installed directly below a rig mounted cyclone, and an average 2‐3 kg sample is collected in an un‐numbered calico bag, and positioned on top of the plastic bag. >95% of samples were collected dry (dry to slightly damp).
Four‐metre composite samples were created by spear sampling of the total one metre samples collected in large plastic bag from the drilling rig and deposited into separate numbered calico bags for sample despatch. A number of RC holes utilised 4 m composite samples for waste intervals. If composite samples returned anomalous gold values, the intervals were resampled as one metre samples by collecting the sample produced from the rotary cone‐splitter. No 4 m sample assays were used in this Mineral Resource Estimate.
For all sample types, the nature, quality and appropriateness of the sample preparation technique.
Samples were prepared at the Intertek Laboratory in Kalgoorlie. Samples were dried, and the whole sample (both RC and DDH) was pulverised to 80% passing 75um, and a sub‐sample of approx. 200g was retained. A nominal 50g was used for the analysis. The procedure is better than industry standard for this type of sample as most labs split the 2‐3 kg prior to pulverising.
Quality control procedures adopted for all sub‐sampling stages to maximise representation of samples.
A duplicate RC field sample is taken from the cone splitter at the same time as the primary sample a rate of approximately 1 in 40 samples.
A twinned half core sample is taken at a frequency of 1 in 40 samples, with one half representing the primary result and the second half representing a twinned result.
At the laboratory, regular laboratory‐generated repeats and check samples are assayed, along with laboratory insertion of its own standards and blanks.
Measures taken to ensure that the sampling is representative of the in situ material collected, including for instance results for field duplicate/second‐half sampling.
Duplicate samples were collected at a frequency of 1 in 40 for all drill holes. RC duplicate samples are collected directly from the rig‐mounted rotary cone splitter. Core duplicate samples utilise the second half of core after cutting.
Whether sample sizes are appropriate to the grain size of the material being sampled. Sample sizes are considered appropriate to give an indication of mineralisation given the particle size and the preference to keep the sample weight below a targeted 3kg mass which is the optimal weight to ensure the requisite grind size in the LM5 sample mills used by Intertek in sample preparation.
For
per
sona
l use
onl
y

Page 24 of 41
Criteria JORC Code explanation Commentary
Quality of assay data and laboratory tests
The nature, quality and appropriateness of the assaying and laboratory procedures used and whether the technique is considered partial or total.
Samples were analysed at the Intertek Laboratory in Perth. The analytical methods used for RC and diamond drilling methods for raw (not composited) samples in a 10km square region surrounding the deposit were as follows:
Fire Assay with either AAS or ICPES finish for gold is considered to be appropriate for the Gruyere material and mineralisation. The method gives a near total digestion of the material intercepted in diamond core drilling. ICPES provides improved quality compared to AAS and all fire assay protocols for Gold Road samples were changed to this finish during May 2014.
For geophysical tools, spectrometers, handheld XRF instruments, etc, the parameters used in determining the analysis including instrument make and model, reading times, calibrations factors applied and their derivation, etc.
Calibration of the hand‐held XRF tools is applied at start‐up. XRF results are only used for indicative assessment of lithogeochemistry and alteration to aid logging and subsequent interpretation.
Downhole survey of rock property information for selected holes reported has been completed. ABIMS is the contractor which compiled this work. This involved downhole surveying using a variety of tools with real time data capture and validation. The tools were calibrated on a regular basis. This data was used in conjunction with other data in the determination of specific gravity (SG) data for the Resource Model.
Nature of quality control procedures adopted (eg standards, blanks, duplicates, external laboratory checks) and whether acceptable levels of accuracy (ie lack of bias) and precision have been established.
The Gold Road protocol for RC programs is for Field Standards (Certified Reference Materials) and Blanks to be inserted at a rate of 3 Standards and 3 Blanks per 100 samples. RC Field Duplicates and DDH Field Twins are generally inserted at a rate of approximately 1 in 40. Samples are processed at Intertek Laboratories, where regular assay Repeats, Laboratory Standards, Checks and Blanks are inserted and analysed in addition to the blind Gold Road QAQC samples.
For the reported resource the relevant assays and QAQC numbers are as follows:
Azimuth (Gruyere Grid) DDH RC Total
50 gram Fire Assay with AAS finish 6,295 13,888 20,183
50 gram Fire Assay with ICPES finish 17,206 20,337 37,543
Total 23,501 34,225 57,726
Total Sample Submission 58,137
Field Blanks 1,536
Field Standards 1,526
Filed Duplicates 1,148
Laboratory Blanks 1,259 including 98 Acid Blanks
Laboratory Checks 1,855
Laboratory Standards 1,868
Umpire Checks ‐ Minanalytical 236 including 5 Laboratory Blanks and 10 Laboratory Standards
Umpire Checks ‐ ALS Laboratories 62 including 4 Laboratory Blanks and 6 Laboratory Standards
Assay and QAQC Numbers
April 2016
Number Comment
For
per
sona
l use
onl
y

Page 25 of 41
Criteria JORC Code explanation Commentary
Results of the Field and Laboratory QAQC assays were checked on assay receipt using QAQCR software. All assays passed QAQC protocols, showing acceptable levels of contamination or sample bias, including diamond half core v. half core Field Twins. QAQC Audits for each major drill program and associated resource update have been completed and reported by Mr David Tullberg (Grassroots Data Services Pty Ltd) and by Dr Paul Sauter (in‐house consultant Sauter Geological Services Pty Ltd).
Verification of sampling and assaying
The verification of significant intersections by either independent or alternative company personnel.
Significant results were compiled by the Database Manager and reported for release by the Exploration Manager/Executive Director. Data was routinely checked by the Senior Exploration and Project Geologist, Principal Resource Geologist or Consulting Geologists during drilling programs. All results, except for the 25 by 25 m RC data, which is considered operational, have been reported in ASX announcements listed in Appendix 2.
The use of twinned holes. Three twin RC holes were completed and data analysed in the reported resource, with their collars being less than 5 metres distant from the parent collar.
14GYRC0026A (twin pair with hole 13GYRC0026)
14GYRC0033A (twin pair with hole 14GYRC0033)
14GYRC0060A (twin pair with hole 13GYRC0060)
Two twin RC vs DDH sub‐parallel holes were completed and data analysed in the reported resource, with their collars being less than 10 metres distant from the parent collar.
13GYDD0003 (twin pair with hole 13GYRC0027)
13GYDD0002 (twin pair with hole 13GYRC0049)
One diamond pair (14GYDD0012A and 14GYDD0012B) provide a twin data set over a length of 120 m at a spacing of less than less than 4 m apart. This twinned data provided accurate data for validating the nugget effect at Gruyere.
As part of the Maiden Mineral Resource reported in August 2014 a detailed drill program was completed which included a number of holes on an approximate 12.5 by 12.5 m to 25 by 25 m drill spacing. The data derived from this drilling and the recent 25 by 25 m drilling was used to confirm short scale mineralisation continuity and refine statistical and geostatistical relationships in the data which are useful in resource estimation.
Documentation of primary data, data entry procedures, data verification, data storage (physical and electronic) protocols.
All field logging is carried out on Toughbooks using LogChief data capture software. Logging data is submitted electronically to the Database Geologist in the Perth office. Assay files are received electronically from the Laboratory. All data is stored in a Datashed/SQL database system, and maintained by the Gold Road Database Manager.
Discuss any adjustment to assay data. No assay data was adjusted. The laboratory’s primary Au field is the one used for plotting and resource purposes. No averaging is employed.
Location of data points
Accuracy and quality of surveys used to locate drill holes (collar and down‐hole surveys), trenches, mine workings and other locations used in Mineral Resource estimation.
The drill hole locations were initially picked up by handheld GPS, with an accuracy of 5m in northing and easting. All holes were later picked using DGPS to a level of accuracy of 1 cm in elevation and position.
For angled drill holes, the drill rig mast is set up using a clinometer, and rigs aligned by surveyed positions and/or compass.
Drillers use an electronic single‐shot camera to take dip and azimuth readings inside the stainless steel rods, at 50 m intervals, prior to August 2014, and 30 m interval, post August 2014. Downhole directional surveying using north‐seeking gyroscopic tool was completed on site and live (down drill rod string) or after the rod string had been removed from the hole. Most diamond drill holes were surveyed live whereas most RC holes were surveyed upon exiting the hole.
For
per
sona
l use
onl
y

Page 26 of 41
Criteria JORC Code explanation Commentary
Specification of the grid system used. A local grid (Gruyere Grid) was established by contract surveying group Land Surveys. The purpose of the local grid is to have an accurate and practical co‐ordinate system along strike of the deposit. A high density survey control network and an accurate transformation between Gruyere Grid and MGA94‐51 has been established. All ongoing studies, geological and resource activities are now conducted in Gruyere Grid.
Quality and adequacy of topographic control. An Aerial Lidar and Imagery Survey was completed January 2016 by Trans Wonderland Holdings as part of the ongoing FS covering 2,558 km2 over the project area. One metre contours from this survey were used to construct a new topography surface to constrain the resource model. The survey showed good agreement with the existing DGPS drill hole collar data.
All drill holes used in the resource grade estimate have a final collars survey by DGPS which are has a 1cm elevation accuracy.
Data spacing and distribution
Data spacing for reporting of Exploration Results. Drill spacing is at an approximate 50 m section spacing and 40 ‐ 80 m on section over the top 200 vertical metres of the deposit; the spacing is at a 100 m sections at 50 ‐ 100 m spacing from 150 ‐ 600 vertical metres.
Approximately 75 % of the pit strike length has been drilled to 25 by 25 m spaced holes to a depth of 70 ‐ 100 m below surface.
Drill spacing in relation to Resource Classification is discussed further in Section 3 below.
Whether the data spacing and distribution is sufficient to establish the degree of geological and grade continuity appropriate for the Mineral Resource and Ore Reserve estimation procedure(s) and classifications applied.
Spacing of the reported drill holes is sufficient to demonstrate the geological and grade continuity of the deposit, and is appropriate for resource estimation procedures. Detailed description of the relationship between drill spacing and Resource classification is provided in Section 3 below.
Whether sample compositing has been applied. A total of 246 RC samples (out of a total 22,072 RC samples) featured compositing over waste intervals. This is the equivalent of <1% of all RC sample collected. None of these composited samples have been used in the Resource Estimate.
No compositing has been employed in the diamond drilling.
No sample compositing has been used during reporting – all reported intersections represent full length weighted average grades across the intersection length.
Orientation of data in relation to geological structure
Whether the orientation of sampling achieves unbiased sampling of possible structures and the extent to which this is known, considering the deposit type.
Drill sections are oriented west to east (270° to 090° Gruyere Grid) with the majority of holes oriented approximately perpendicular to dip and strike at ‐60° to 270°, 14 holes in this orientation are shallow to dip and four are steep to dip. A small component of drilling has been drilled in a northward orientation, five of these are deep diamond drill holes drilled along the strike of the deposit (‐60 towards 010°) to specifically test along strike continuity. Twenty‐six holes are drilled to the northeast and east, and six are drilled to the south. The table below details the drilling orientation by drill type.
Azimuth (Gruyere Grid) Dip DDH RC Total Comment
250 to 290 ‐40 to ‐50 7 7 14 Perpendicular to strike and shal low to dip
250 to 290 ‐51 to ‐75 69 291 360 Perpendicular to strike and dip
250 to 290 ‐76 to ‐85 2 2 4 Perpendicular to strike and steep to dip
291 to 020 ‐55 to ‐70 11 11 Along strike / down dip ‐ includes 1 wedge
021 to 100 ‐60 to ‐80 12 14 26 To northeast and east
101 to 249 ‐60 to ‐70 2 4 6 To south
na ‐90 2 2 Water bores
Total 103 320 423
For
per
sona
l use
onl
y

Page 27 of 41
Criteria JORC Code explanation Commentary
If the relationship between the drilling orientation and the orientation of key mineralised structures is considered to have introduced a sampling bias, this should be assessed and reported if material.
Detailed structural logging of diamond drill core identified important quartz veins sets with an approximate shallow dip to the east. Drilling angled at either ‐60 to the east or west does not introduce any directional bias given the current understanding of the structural orientations and the dip and strike of mineralisation.
Sample security The measures taken to ensure sample security. For all RC drilling and diamond drilling pre‐numbered calico sample bags were collected in plastic bags (five calico bags per single plastic bag), sealed, and transported by company transport to the Intertek laboratory in Kalgoorlie. Prepared pulps were then despatched by Intertek to its laboratory in Perth for assaying.
Audits or reviews The results of any audits or reviews of sampling techniques and data. Sampling and assaying techniques are industry‐standard. Internal and Consultant reviews of QAQC have been completed and documented.
Company laboratory audits have been complete at the Intertek Laboratory in Perth.
No independent laboratory or sample audits have been completed.
For
per
sona
l use
onl
y

Page 28 of 41
Section 2 Reporting of Exploration Results (Criteria listed in the preceding section also apply to this section.) Criteria JORC Code explanation Commentary
Mineral tenement and land tenure status
Type, reference name/number, location and ownership including agreements or material issues with third parties such as joint ventures, partnerships, overriding royalties, native title interests, historical sites, wilderness or national park and environmental settings.
The RC and diamond drilling occurred within tenement E38/2362, which is fully owned by Gold Road. The tenement is located on the Yamarna Pastoral Lease, which is owned and managed by Gold Road.
Tenement E38/2362 is located inside the Yilka Native Title Claim, WC2008/005, registered on 6 August 2009. The 2004 “Yamarna Project Agreement” between Gold Road and the Cosmo Newberry Aboriginal Corporation governs the exploration activities respectively inside the Pastoral Lease.
As part of the ongoing FS Yilka and Gold Road reached an in‐principle native title mining agreement in December 2015 and are working to sign the final agreement within Q2 2016 as a precursor to grant of the lodged mining lease application.
The security of the tenure held at the time of reporting along with any known impediments to obtaining a licence to operate in the area.
The tenement is in good standing with the WA DMP.
Exploration done by other parties
Acknowledgment and appraisal of exploration by other parties. No previous exploration has been completed on this prospect by other parties.
Geology Deposit type, geological setting and style of mineralisation. The Gruyere Deposit comprises a narrow to wide porphyry intrusive dyke (Gruyere Porphyry – a Quartz Monzonite) which is between 35 and 190 m in width and which strikes over a current known length of 2,200 m. The Gruyere Porphyry dips steeply (65‐80 degrees) to the east. A sequence of intermediate to mafic volcaniclastic rocks defines the stratigraphy to the west of the intrusive and intermediate to mafic volcanics and a tholeiitic basalt unit occur to the east.
Mineralisation is confined ubiquitously to the Gruyere Porphyry and is associated with pervasive overprinting albite‐sericite‐chlorite‐pyrite (±pyrhhotite±arsenopyrite) alteration which has obliterated the primary texture of the rock. Minor fine quartz‐carbonate veining occurs throughout. Pyrite is the primary sulphide mineral and some visible gold has been observed in logged diamond drill core.
The Gruyere Deposit is situated at the north end of the regional camp‐scale South Dorothy Hills Target identified by Gold Road during its regional targeting campaign completed in early 2013. The Gruyere Deposit comprises coincident structural and geochemical targets within a major regional‐scale structural corridor associated with the Dorothy Hills Shear Zone. This zone occurs within the Dorothy Hills Greenstone Belt at Yamarna in the eastern part of the Archaean Yilgarn Craton. The Dorothy Hills Greenstone is the most easterly known occurrence of outcropping to sub‐cropping greenstone in the Yilgarn province of Western Australia.
Drill hole Information
A summary of all information material to the understanding of the exploration results including a tabulation of the following information for all Material drill holes:
easting and northing of the drill hole collar
elevation or RL (Reduced Level – elevation above sea level in metres) of the drill hole collar
dip and azimuth of the hole
down hole length and interception depth
hole length. If the exclusion of this information is justified on the basis that the information is not Material and this exclusion does not detract from the understanding of the report, the Competent Person should clearly explain why this is the case.
Appendix 2 outlines previous general ASX announcements that contain reported drill hole information for all relevant RC and Diamond holes included in the reported resource estimation. The 25 by 25 m RC data has not been reported in detail as it is considered operational.
For
per
sona
l use
onl
y

Page 29 of 41
Criteria JORC Code explanation Commentary
Data aggregation methods
In reporting Exploration Results, weighting averaging techniques, maximum and/or minimum grade truncations (eg cutting of high grades) and cut‐off grades are usually Material and should be stated.
All drill assay results (except for the previously mentioned 25 by 25 m RC holes) used in this estimation of this resource have been published in previous releases; refer to Appendix 2 for a list of previous releases.
Where aggregate intercepts incorporate short lengths of high grade results and longer lengths of low grade results, the procedure used for such aggregation should be stated and some typical examples of such aggregations should be shown in detail.
All drill assay results (except for the previously mentioned 25 by 25 m RC holes) used in this estimation of this resource have been published in previous releases; refer to Appendix 2 for a list of previous releases.
The assumptions used for any reporting of metal equivalent values should be clearly stated.
No metal equivalent values are used.
Relationship between mineralisation widths and intercept lengths
These relationships are particularly important in the reporting of Exploration Results. If the geometry of the mineralisation with respect to the drill hole angle is known, its nature should be reported. If it is not known and only the down hole lengths are reported, there should be a clear statement to this effect (eg ‘down hole length, true width not known’).
Mineralisation is hosted within a steep east‐dipping, N‐S striking porphyry. The porphyry is mineralised almost ubiquitously at greater than 0.3 g/t Au and is characterised by pervasive sub‐vertical shear fabrics and sericite‐chlorite‐biotite‐albite alteration with accessory sulphides dominated by pyrite‐pyrrhotite‐arsenopyrite. Higher grade zones occur in alteration packages characterised by albite‐pyrrhotite‐arsenopyrite alteration and quartz and quartz‐carbonate veining. These vein packages dip at approximately ‐450 to the SSE, with strike extents of over 100 m.
The general drill direction of 600 to 2700 is approximately perpendicular to the main alteration packages and is a suitable drilling direction to avoid directional biases.
Diagrams Appropriate maps and sections (with scales) and tabulations of intercepts should be included for any significant discovery being reported. These should include, but not be limited to a plan view of drill hole collar locations and appropriate sectional views.
Refer to Figures and Tables in the body of the release.
Balanced reporting
Where comprehensive reporting of all Exploration Results is not practicable, representative reporting of both low and high grades and/or widths should be practiced to avoid misleading reporting of Exploration Results.
All drill assay results (except for the previously mentioned 25 by 25 m RC holes) used in this estimation of this resource have been published in previous releases; refer to Appendix 2 for a list of previous releases.
Other substantive exploration data
Other exploration data, if meaningful and material, should be reported including (but not limited to): geological observations; geophysical survey results; geochemical survey results; bulk samples – size and method of treatment; metallurgical test results; bulk density, groundwater, geotechnical and rock characteristics; potential deleterious or contaminating substances.
Drill hole location data are plotted in Figures in the body text.
Further work The nature and scale of planned further work (eg tests for lateral extensions or depth extensions or large‐scale step‐out drilling). Diagrams clearly highlighting the areas of possible extensions, including the main geological interpretations and future drilling areas, provided this information is not commercially sensitive.
Possible extensions at depth and to the south at depth will be tested in a strategic manner.
For
per
sona
l use
onl
y

Page 30 of 41
Section 3 Estimation and Reporting of Mineral Resources (Criteria listed in section 1, and where relevant in section 2, also apply to this section.)
Criteria JORC Code explanation Commentary
Database integrity Measures taken to ensure that data has not been corrupted by, for example, transcription or keying errors, between its initial collection and its use for Mineral Resource estimation purposes.
Geological metadata is stored centrally in a relational SQL database with a DataShed front end. Gold Road employs a Database Manager who is responsible for the integrity and efficient use of the system. Only the Database Manager or their Data Entry Clerk has permission to modify the data.
Sampling and geological logging data is collected in the field using LogChief software and uploaded digitally. The software utilises lookup tables, fixed formatting and validation routines to ensure data integrity prior to upload to the central database.
Sampling data is sent to, and received from, the assay laboratory in digital format.
Drill hole collars are picked up by differential GPS (DGPS) and delivered to the database in digital format.
Down hole surveys are delivered to the database in digital format.
The Mineral Resource estimate only uses Gold Road RC and DDH assay data. There is no historical data.
Data validation procedures used. DataShed software has validation procedures that include constraints, library tables, triggers and stored procedures. Data that does not pass validation tests must be corrected before upload.
The LogChief software utilises lookup tables, fixed formatting and validation routines to ensure data integrity prior to upload to the central database. Geological logging data is checked visually in three dimensions against the existing data and geological interpretation.
Assay data must pass laboratory QAQC before database upload. Gold Road utilises QAQR software to further analyse QAQC data, and batches which do not meet pass criteria are requested to be re‐assayed. Sample grades are checked visually in three dimensions against the logged geology and geological interpretation.
Drill hole collar pickups are checked against planned and/or actual collar locations.
A hierarchical system is used to identify the most reliable down hole survey data. Drill hole traces are checked visually in three dimensions. The project geologist and resource geologist are responsible for interpreting the down hole surveys to produce accurate drill hole traces.
Site visits Comment on any site visits undertaken by the Competent Person and the outcome of those visits. If no site visits have been undertaken indicate why this is the case.
Justin Osborne is one of the Competent Persons and is Gold Road’s Executive Director. He conducts regular site visits and is responsible for all aspects of the project.
John Donaldson is the second Competent Person and is Gold Road’s Principal Resource Geologist. He conducts regular specific site visits to focus on understanding the geology as it is revealed in the drilling data. Communication with the site geologists is key to ensuring the latest geological interpretations are incorporated into the resource models.
Both Competent Persons contribute to the continuous improvement of sampling and logging practices and procedures.
For
per
sona
l use
onl
y

Page 31 of 41
Criteria JORC Code explanation Commentary
Geological
interpretation
Confidence in (or conversely, the uncertainty of) the geological interpretation of the mineral deposit.
The predominance of diamond drilling at Gruyere has allowed a robust geological interpretation to be developed, tested and refined over time. Early establishment of lithology and alteration coding and detailed structural logging has given insight into geological and grade trends that have been confirmed with geostatistical analysis, (including variography).
Other sources of data (see next commentary) have also added confidence to the geological interpretation.
The type and thickness of host lithology and main hangingwall mafic dyke is predictable. Other non‐mineralised mafic and intermediate dykes are less predictable.
The footwall and hangingwall lithologies are less well known due to the focus of drilling on mineralised units. However, the hangingwall lithologies are understood better as holes are collared on this side of the deposit. Results from the EIS hole (ASX announcement dated 8 September 2015) have improved the understanding of hangingwall lithologies and this will improve with further study.
Continued drilling has shown that the approximate tenor and thickness of mineralisation is also predictable, but to a lesser degree than the geology.
Results from the 25 by 25 m RC grade control drilling data have confirmed the geological interpretation and mineralisation model.
As the deposit has good grade and geological continuity, which has been confirmed by grade control drilling, the Competent Persons regard the confidence in the geological interpretation as high.
Nature of the data used and of any assumptions made. All available data has been used to help build the geological interpretation. This includes geological logging data (lithology and structure), gold assay data (RC and DDH), portable XRF multi‐element data (Niton and laboratory), geophysics (airborne magnetics and gravity), down hole Televiewer data (optical images and structural measurements, specific gravity, resistivity and natural gamma) and mineral mapping and multi‐element data from research conducted in partnership with the CSIRO.
An assumption regarding some gold remobilisation has been made at the more deeply weathered northern end of the deposit where a small flat lying gold dispersion blanket has been interpreted near the saprolite / saprock boundary. This is believed to represent dispersion of gold due to weathering processes. Justification for this interpretation lies in the lack of visual control to the mineralisation and its position in the weathering profile.
The effect, if any, of alternative interpretations on Mineral Resource estimation. A model constrained only by lithology (Gruyere Porphyry) was run to compare against the implicitly (and lithologically) constrained at 0.3 g/t model (actual model). Results showed that at 0 g/t cut‐off the estimate of ounces was within 2%, and, as expected the lithologically constrained model had higher tonnage at lower grade. At 0.5 g/t, grade is 10% less and ounces are 7% less, and at 1.0 g/t grade is 1% less and ounces are 19% less in the lithologically constrained model.
Moreover, in previous updates, one other potential mineralised trend, keeping all other constraints constant, was been modelled and showed little effect on the global estimate of volume.
The use of geology in guiding and controlling Mineral Resource estimation. Regionally the deposit is hosted in an Archaean basin to the East of the crustal scale Yamarna Shear Zone. The Gruyere deposit is located on an inflection of the NW (MGA) striking Dorothy Hills Shear Zone which transects the basin. The Dorothy Hills Shear Zone is the first order control into which the host Gruyere Porphyry has intruded.
The bulk of the mineralisation has been constrained to the host intrusive below the base of Quaternary and Permian cover.
Several NNE dipping cross‐cutting arcuate and linear faults have been interpreted from airborne magnetics, the distribution of lithology and diamond core intersections of faults. The Alpenhorn Fault and to a lesser degree the Northern Fault have been used to constrain the distribution of mineralisation.
For
per
sona
l use
onl
y

Page 32 of 41
Criteria JORC Code explanation Commentary
Mineralisation within the intrusive host has been implicitly modelled to the mineralisation trends discussed below at a constraining 0.3 g/t cut‐off. The cut‐off was established using two lines of reasoning:
1. All of the assay data internal to the host rock was plotted on a log probability plot; a value of 0.3 g/t was recognised as an inflection point subdividing the non‐mineralised and mineralised populations. This is further supported through a reduction in the CV in the unconstrained case from 1.0 to 0.9 in the constrained case i.e. a reduction in stationarity supporting the domaining.
2. 0.3 g/t corresponds to the approximate grade cut‐off between barren to very weakly mineralised hematite‐magnetite alteration and weak to strongly mineralised albite‐sericite‐carbonate ± pyrite, pyrrohotite, arsenopyrite alteration.
Three mineralisation Domains have been modelled; Primary, Weathered and the minor Dispersion Blanket.
1. The Primary Domain corresponds to mineralisation hosted in fresh, transitional and saprock Gruyere Porphyry. The mineralisation trend is along strike and steeply down dip. The trend was established using observations of alteration, sulphide and gold grade distribution, together with the following structural observations from diamond core:
The along strike component corresponds to the main foliation within the intrusive host.
The steep down dip component corresponds to a strong down‐dip lineation parallel to the axes of tight
to isoclinal folds of the pre‐existing foliation within the intrusive host.
The strike and dip components for the Primary Domain were readily confirmed in the variography. 2. A secondary Domain corresponds to mineralisation hosted in deeply weathered (saprolite) Gruyere
Porphyry. The mineralisation trend is flat lying, reflecting the weathering processes. The trend was established using observations of gold grade distribution and the position relative to the weathering profile. The strike and dip components for the Weathered Domain were readily confirmed in the variography.
3. A minor third Domain corresponds to a flat lying, 4 – 5 m thick, gold dispersion blanket interpreted near the saprolite boundary and hosted within hangingwall and footwall lithologies.
The factors affecting continuity both of grade and geology. Apart from the controls discussed previously, one narrow (1 to 5 m wide), steeply dipping non‐mineralised internal mafic dyke has been modelled as barren within the intrusive host. Other narrow (generally less than 1 m wide) mafic and intermediate intrusives / dykes occur but have very short scale continuity and insignificant to the scale of mineralisation.
Dimensions The extent and variability of the Mineral Resource expressed as length (along strike or otherwise), plan width, and depth below surface to the upper and lower limits of the Mineral Resource.
Length along strike: 1,800 m
Horizontal Width: 7 to 190 m with an average of 90 m.
The vertical depth of Mineral Resource from surface to the upper limit is 2 m and to the lower limit is 600 m.
The Mineral Resource has been constrained by an optimised Whittle shell that considers all available mineralisation in the geological model. The optimisation utilises realistic mining, geotechnical and processing parameters from the latest information available from the ongoing FS. The gold price used was A$1,700/oz Au. Only Measured, Indicated and Inferred categories within this shell have been reported as Mineral Resource. Mineralisation in the geology model outside the shell has not been reported. Approximately 39,000 oz of unclassified* mineralisation falls within the shell and is not reported.
*Low confidence mineralisation within the geological model that does not satisfy the criteria for Mineral Resource has been flagged as unclassified.
For
per
sona
l use
onl
y

Page 33 of 41
Criteria JORC Code explanation Commentary
The nature and appropriateness of the estimation technique(s) applied and key assumptions, including treatment of extreme grade values, domaining, interpolation parameters and maximum distance of extrapolation from data points. If a computer assisted estimation method was chosen include a description of computer software and parameters used.
Software used:
Datashed – frontend to SQL database
Mapinfo – geophysics and regional geology
Stereonet – compilation and interpretation of diamond structural data.
Core Profiler – compilation of downhole photographs in core trays for geo‐referencing in 3D software.
Leapfrog Geo – Drill hole validation, material type, lithology, alteration and faulting wireframes, domaining and mineralisation wireframes, geophysics and regional geology
Snowden Supervisor ‐ geostatistics, variography, declustering, kriging neighbourhood analysis (KNA), validation
Datamine Studio RM – Drill hole validation, cross‐section, plan and long‐section plotting, block modelling, geostatistics, quantitative kriging neighbourhood analysis (QKNA), OK estimation (for validation and input to LUC), block model validation, classification, and reporting.
Datamine Studio RM Uniform Conditioning Module – LUC grade estimation. The module is an interface to the code in Isatis software for change of support, information effect calculation, uniform conditioning and grade localisation. Isatis is the most highly regarded geostatistical software in the industry and is used by many of the top gold mining companies worldwide.
Localised Uniform Conditioning:
LUC was selected as at technique to estimate the Indicated and Inferred areas of this resource update as the method provides estimates of Selective Mining Units (SMU) from widely spaced data. The LUC model is globally accurate but the estimate of the grade tonnage curve is not over smoothed (as in conventional OK) resulting in less tonnes at higher grade above a given cut‐off (ie. an estimate of the grade control grade tonnage curve).
The improved resolution of LUC adds value to economic evaluation at higher cut‐offs (e.g. 1.0 g/t): however, at lower cut‐offs (e.g. 0.5 g/t) used for reporting there are no significant differences between the direct block (OK) estimate and the LUC estimate.
In models prior to September 2015 grades were estimated using an OK methodology into large parent blocks resulting in a globally accurate but smoothed grade tonnage curve (more tonnes at lower grade above cut‐off).
Block model and estimation parameters:
Treatment of extreme grade values – Top‐cuts (all samples included method) were applied to 2m composites selected within mineralisation wireframes. The top‐cut level was determined through the analysis of histograms, log histograms, log probability plots and spatial analysis.
Primary ‐ one sample was cut using a 30 g/t top‐cut resulting in a 0.1% reduction in mean grade. Weathered ‐ 3 samples were cut using a 10 g/t top‐cut resulting in a 1.0% reduction in mean grade. Dispersion Blanket ‐ no samples were top‐cut.
Estimation technique for Measured – OK – at this data spacing (25 by 25 m grade control) OK is the appropriate technique, where LUC is appropriate for broader spaced drilling. The data is sufficiently dense for a correct direct block estimate.
Estimation for technique Indicated and Inferred ‐ LUC ‐ with an OK estimate (25 m X by 50 m Y by 10 m Z panels) required as input.
For
per
sona
l use
onl
y

Page 34 of 41
Criteria JORC Code explanation Commentary
KNA was undertaken to optimise the search neighbourhood used for the estimation and to test the parent block size. The search ellipse and selected samples by block were viewed in three dimensions to verify the parameters.
Model rotation – none required – local Gruyere Grid used.
Parent block size for Measured estimation of gold grades by OK ‐ 5 m X by 12.5 m Y by 5 m Z (parent cell estimation with full subset of points).
LUC inputs for Indicated and Inferred estimation of gold grades (note that 6 estimation scenarios were tested and analysed before deciding on the final input parameters);
12.5 m X by 25 m Y by 5 m Z declustering of input data in Supervisor (the declustering weight is inversely proportional to the number of data points in each cell). Note that change in grade through declustering with respect to the use of the cell size optimiser is minimal.
Discretisation 3 X by 5 Y by 2 Z
Information Effect planned sample spacing 25 m X by 25 m Y by 1 m Z, and 9 X by 9 Y by 5 Z planned number of samples
40 SMUs (5 m X by 12.5 m Y by 5 m Z) per panel (25 m X by 50 m Y by 10 m Z)
70 cut‐offs at 0.1 g/t intervals
7 iso‐frequencies
Smallest sub‐cell – 1 m X by 12.5 m Y by 1 m Z (a small X dimension was required to fill internal mafic dyke and a small Z dimension was required to fill to material type boundaries).
Panel discretisation ‐ 3 X by 5 Y by 2 Z (using the number of points method)
Measured Search ellipse – aligned to mineralisation trend, dimensions;
Fresh ‐ 35 m X by 60 m Y by 15 m Z.
Weathered – 50 m X by 80 m Y by 15 m Z.
Dispersion Blanket ‐ 50 m X by 80 m Y by 15 m Z.
Indicated and Inferred Search ellipse – aligned to mineralisation trend, dimensions;
Fresh ‐ 200 m X by 350 m Y by 60 m Z (the longest range in variogram is 350 m).
Weathered ‐ 50 m X by 80 m Y by 15 m Z (the longest range in variogram is 80 m).
Dispersion Blanket ‐ 50 m X by 80 m Y by 15 m Z.
Measured ‐ number of samples:
Fresh – maximum per drill hole = 4, first search 16 min / 36 max, second search 16 min / 36 max and a volume factor of 2, third search 8 min / 36 max with a volume factor of 2
Weathered– maximum per drill hole = 5, first search 30 min / 60 max, second search 30 min / 60 max and a volume factor of 2, third search 10 min / 60 max with a volume factor of 2
Dispersion Blanket – maximum per drill hole = 5, first search 30 min / 60 max, second search 30 min / 60 max and a volume factor of 2, third search 6 min / 60 max with a volume factor of 2
Indicated and Inferred ‐ number of samples:
Fresh – maximum per drill hole = 7, first search 30 min / 60 max, second search 15 min / 60 max and a volume factor of 1, third search 5 min / 60 max with a volume factor of 3
For
per
sona
l use
onl
y

Page 35 of 41
Criteria JORC Code explanation Commentary
Weathered – maximum per drill hole = 5, first search 30 min / 60 max, second search 30 min / 60 max and a volume factor of 2, third search 1 min / 60 max with a volume factor of 3
Dispersion Blanket – maximum per drill hole = 5, first search 20 min / 60 max, second search 10 min / 60 max and a volume factor of 2, third search 2 min / 60 max with a volume factor of 3
Maximum distance of extrapolation from data points – 50 m from sample data to Inferred boundary
Domain boundary conditions – Hard boundaries are applied at all domain boundaries.
The availability of check estimates, previous estimates and/or mine production records and whether the Mineral Resource estimate takes appropriate account of such data.
Several internal models and three public models were produced prior to the publication of this Mineral Resource. These were used to plan drilling programs, manage performance and expectation and test geological interpretation on an ongoing basis during and after the various drilling campaigns. Analysis shows that this model has performed well globally and locally against the original internal and publically released models.
In particular, and locally at a 0.5 g/t cut‐off, in the Measured (grade control defined) portion of this model (13.9 Mt at 1.18 g/t for 526 koz) the variance has been minimal +4% for tonnes, ‐4 % for grade and +1% for ounces in comparison to the same volume in the previous model (Indicated).
There is no previous production.
The assumptions made regarding recovery of by‐products. There are no economic by‐products.
Estimation of deleterious elements or other non‐grade variables of economic significance (eg sulphur for acid mine drainage characterisation).
No deleterious elements of significance have been determined from metallurgical test work and mineralogical investigations. Waste rock characterisation work has been completed and all waste types and tailings are non‐acid forming and have limited metal leachate potential.
In the case of block model interpolation, the block size in relation to the average sample spacing and the search employed.
For the Measured (OK estimate).
The parent block size of 5 m X by 12.5 m Y is approximately:
50% of the maximum drill spacing of 25 m X by 25 m Y in Measured areas
For the Indicated and Inferred (OK estimate as input to LUC)
The parent block size of 25 m X by 50 m Y is approximately:
25% of the minimum drill spacing of 50 m X by 100 m Y in Indicated areas
12.5% of the maximum drill spacing of 100 m X by 100 m Y in Inferred areas
Any assumptions behind modelling of selective mining units. The selective mining unit (SMU) of 5 m X by 12.5 m Y by 5 m Z was chosen as it gives 40 SMU’s per 25 m X by 50 m Y by 10 m Z parent cell (a minimum of around 24 SMU’s are required for adequate grade / tonnage definition) and corresponds well with mining equipment and mining flitch sizes selected in the PFS. A separate fleet sizing study will be completed during the FS.
Any assumptions about correlation between variables. No correlation between variables was analysed or made.
Description of how the geological interpretation was used to control the resource estimates.
The geological interpretation was used at all stages to control the estimation. If geostatistics, variography and/or visual checks of the model were difficult to interpret then the geological interpretation was questioned and refined.
Discussion of basis for using or not using grade cutting or capping. Top‐cuts were used in the estimate as this is the most appropriate way to control outliers when estimating block grades from assay data. F
or p
erso
nal u
se o
nly
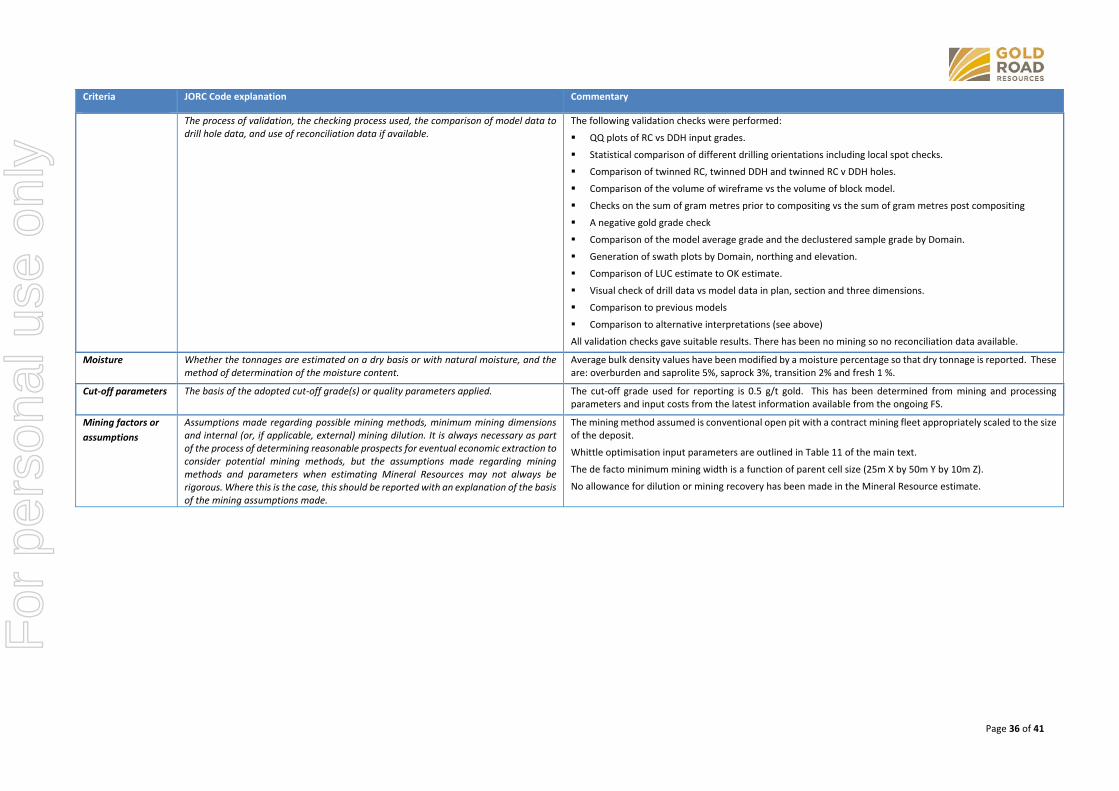
Page 36 of 41
Criteria JORC Code explanation Commentary
The process of validation, the checking process used, the comparison of model data to drill hole data, and use of reconciliation data if available.
The following validation checks were performed:
QQ plots of RC vs DDH input grades.
Statistical comparison of different drilling orientations including local spot checks.
Comparison of twinned RC, twinned DDH and twinned RC v DDH holes.
Comparison of the volume of wireframe vs the volume of block model.
Checks on the sum of gram metres prior to compositing vs the sum of gram metres post compositing
A negative gold grade check
Comparison of the model average grade and the declustered sample grade by Domain.
Generation of swath plots by Domain, northing and elevation.
Comparison of LUC estimate to OK estimate.
Visual check of drill data vs model data in plan, section and three dimensions.
Comparison to previous models
Comparison to alternative interpretations (see above)
All validation checks gave suitable results. There has been no mining so no reconciliation data available.
Moisture Whether the tonnages are estimated on a dry basis or with natural moisture, and the method of determination of the moisture content.
Average bulk density values have been modified by a moisture percentage so that dry tonnage is reported. These are: overburden and saprolite 5%, saprock 3%, transition 2% and fresh 1 %.
Cut‐off parameters The basis of the adopted cut‐off grade(s) or quality parameters applied. The cut‐off grade used for reporting is 0.5 g/t gold. This has been determined from mining and processing parameters and input costs from the latest information available from the ongoing FS.
Mining factors or
assumptions
Assumptions made regarding possible mining methods, minimum mining dimensions and internal (or, if applicable, external) mining dilution. It is always necessary as part of the process of determining reasonable prospects for eventual economic extraction to consider potential mining methods, but the assumptions made regarding mining methods and parameters when estimating Mineral Resources may not always be rigorous. Where this is the case, this should be reported with an explanation of the basis of the mining assumptions made.
The mining method assumed is conventional open pit with a contract mining fleet appropriately scaled to the size of the deposit.
Whittle optimisation input parameters are outlined in Table 11 of the main text.
The de facto minimum mining width is a function of parent cell size (25m X by 50m Y by 10m Z).
No allowance for dilution or mining recovery has been made in the Mineral Resource estimate.
For
per
sona
l use
onl
y

Page 37 of 41
Criteria JORC Code explanation Commentary
Metallurgical
factors or
assumptions
The basis for assumptions or predictions regarding metallurgical amenability. It is always necessary as part of the process of determining reasonable prospects for eventual economic extraction to consider potential metallurgical methods, but the assumptions regarding metallurgical treatment processes and parameters made when reporting Mineral Resources may not always be rigorous. Where this is the case, this should be reported with an explanation of the basis of the metallurgical assumptions made.
A single stage primary crush, Semi Autogenous Grinding and Ball Milling with Pebble Crushing (SABC) comminution circuit followed by a conventional gravity and carbon in leach (CIL) process is proposed. This process is considered appropriate for the Gruyere ore, which has been classified as free‐milling.
The proposed metallurgical process is commonly used in the Australian and international gold mining industry and is considered to be well‐tested technology.
Metallurgical recovery is applied to the resource model by material type and grind size (106µm, 125µm and 150µm) according to test work values for weathered material and grade recovery curves for fresh rock. 106µm was selected for input to optimisation. No recovery factors are applied to the Mineral Resource numbers themselves.
Significant comminution, extraction, and materials handling testing has been carried out on over 4,500 kg of half‐core diamond drilling core samples (NQ core diameter = 47.6mm). The testing has been carried out on saprolite (oxide), saprock, transitional and fresh ore types which were selected to represent different grade ranges along the strike length of the deposit and to a depth of around 410 m. For the fresh rock samples, 62 composites representing four major mineralised zones (South, Central, North and High Grade North) were subjected to gold extractive test work by gravity separation and direct cyanidation of gravity tails. In total, 183 individual gravity‐leach tests were completed at various grind size P80 ranging from 106 µm to 150 µm. Gravity gold recoveries are estimated at 35%.
Estimated plant gold recovery ranges from 87% to 96% depending on head grade, plant throughput, grind size and ore type and are summarised in the table below.
No deleterious elements of significance have been determined from metallurgical test work and mineralogical investigations.
Environmental
factors or
assumptions
Assumptions made regarding possible waste and process residue disposal options. It is always necessary as part of the process of determining reasonable prospects for eventual economic extraction to consider the potential environmental impacts of the mining and processing operation. While at this stage the determination of potential environmental impacts, particularly for a greenfields project, may not always be well advanced, the status of early consideration of these potential environmental impacts should be reported. Where these aspects have not been considered this should be reported with an explanation of the environmental assumptions made.
Surface waste dumps and infrastructure (e.g. tailings dam) will be used to store waste material from open pit mining.
Conventional storage facilities will be used for the process plant tailings.
Test work has been completed for potential acid mine drainage material types. Results show that all material types are non‐acid forming and are unlikely to require any special treatment.
Baseline environmental studies of flora, vegetation, vertebrate fauna, short‐range endemic invertebrates and subterranean fauna have commenced and are due for completion within the timeframe of the FS schedule.
106 µm 125 µm 150 µm Comments
Saprolite (oxide) 94% 93% 92%
Saprock 94% 93% 92%
Transition 93% 92% 91%
Fresh 2.6130 x ln head grade (g/t)
+ 92.199 %
3.1818 x ln of head grade (g/t)
+ 90.362 %
3.3997 x ln of head grade (g/t)
+ 88.929 %capped at 96%
Material Type
Metallurgical Recovery at P80
For
per
sona
l use
onl
y

Page 38 of 41
Criteria JORC Code explanation Commentary
Bulk density Whether assumed or determined. If assumed, the basis for the assumptions. If determined, the method used, whether wet or dry, the frequency of the measurements, the nature, size and representativeness of the samples.
Bulk density has been determined using 2 main methods and cross checked with data from recent metallurgical test work:
1. RC drilling – downhole rock property surveys completed by ABIMS Pty Ltd which provide a density measurement every 0.1 m downhole.
2. DDH drilling – weight in air / weight in water – measurements every 1 m in weathered every 10 m in fresh rock, using approximate 0.1 m core lengths.
The physical measurements derived from the air/water method were compared to the down hole tool measurements and metallurgical test work. Good correlation was observed between methods for saprolite, saprock and transitional. The down‐hole tool values for fresh rock did not match the other two methods and so was set aside pending review by the provider.
The bulk density for bulk material must have been measured by methods that adequately account for void spaces (vugs, porosity, etc), moisture and differences between rock and alteration zones within the deposit.
Vacuum sealed bags were used where required to account for void spaces in the core.
Bulk density has been applied by lithology and weathering type.
Discuss assumptions for bulk density estimates used in the evaluation process of the different materials.
Data was coded by method, lithology (including mineralisation and cover) and weathering type. The three methods were compared and found to be in agreement except for the down hole tools values for fresh rock. Averages were derived both by lithology and weathering type. Assumptions for moisture percentages were made and accounted for in the final value used for bulk density.
Classification The basis for the classification of the Mineral Resources into varying confidence categories.
The Mineral Resource has been constrained within an optimised Whittle pit shell. Blocks in the geological model within that shell have been classified as Measured, Indicated or Inferred. Several factors have been used in combination to aid the classification;
Drill hole spacing:
Level of geological continuity.
Level of grade continuity.
Consideration of estimation quality parameters derived from the OK process.
Whether appropriate account has been taken of all relevant factors (ie relative confidence in tonnage/grade estimations, reliability of input data, confidence in continuity of geology and metal values, quality, quantity and distribution of the data).
All relevant factors have been taken into account in the classification of the Mineral Resource.
Whether the result appropriately reflects the Competent Person’s view of the deposit. The Mineral Resource estimate appropriately reflects the Competent Person’s view of the deposit.
Domain Criteria Measured Indicated Inferred Unclassified
Target Spacing 25 m X by 25 m Y 50 m X by 100 m Y 100 m X by 100 m Y
100 m X by 100 m Y"Potential" beyond Inferred to
l imits of geological model.
Footwall contact of along strike
hole 14GYDD0061
10 to 15 m along strike 25 m along strike 50 ‐ 100 m along strike
Closet 5 m Rl from bottom of
hole
Minimal down dip ‐ except North
end 30 m from dril ling. Dril l ing
needs to define full width of
intrusive host.
Minimal down dip ‐ except North
end 50 m from Indicated
boundary
Target Spacing 12.5 to 25 m X by 25 m Y 50 m X by 100 m Y
Actual Spacing12.5 m X by 12.5 m Y to
25 m X by 25 m Y
25 m X to 50 m E by 100 m Y with
extra holes on 50 m Y
Dispersion
BlanketActual Spacing 25 to 50 m X by 25 to 100 m Y
"Potential" beyond Inferred to
l imits of geological model.
Actual Spacing
Boundary
Extension
Weathered
Primary
12.5 m X by 12.5 m Y to
25 m X by 25 m Y
25 m X to 65 m X by 100 m Y with
extra holes on 50 m Y
For
per
sona
l use
onl
y

Page 39 of 41
Criteria JORC Code explanation Commentary
Audits or reviews The results of any audits or reviews of Mineral Resource estimates. Ian Glacken (Director ‐ Geology at Optiro consultants) was engaged to externally review the technical aspects of this update, and the three previous Mineral Resource estimates. A formal review was undertaken and suggestions for improvement were sought and applied where appropriate.
An endorsement letter/summary report of the review has been completed for this update and the three previous Mineral Resource estimates. Optiro is satisfied that the Mineral Resource estimate has been reported and classified according to the guidelines set out in the JORC Code (2012) and in line with good to best industry practice.
An external database audit was not undertaken for this update due to the operational nature of the drilling. Lisa Bascombe of Optiro conducted audits for the three previous Mineral Resource estimates.
Internal geological peer review by the Executive Director, Exploration manager and/or geological team, and handover meetings with the development and operational teams were held and documented at appropriate times. An informal internal peer review, as part of a board briefing, was conducted with the Non‐executive Directors on the Gold Road board, who are also geologists, for the previous Mineral Resource estimate.
A QAQC report was completed by Dr Paul Sauter (internal consultant – Sauter Geological Services Pty Ltd) for data collected for this update to the resource. Results are acceptable and an improvement on previous results. Recommendations include further umpire lab testing and changing the blanks to a more appropriate material.
A QAQC report was completed by Mr Dave Tullberg (Grassroots Data Services Pty Ltd) for data collected for the maiden resource. A QAQC report was completed by Dr Paul Sauter (internal consultant – Sauter Geological Services Pty Ltd) for data collected for the previous two updates to the resource. This included analysis of umpire lab test‐work.
Discussion of
relative accuracy/
confidence
Where appropriate a statement of the relative accuracy and confidence level in the Mineral Resource estimate using an approach or procedure deemed appropriate by the Competent Person. For example, the application of statistical or geostatistical procedures to quantify the relative accuracy of the resource within stated confidence limits, or, if such an approach is not deemed appropriate, a qualitative discussion of the factors that could affect the relative accuracy and confidence of the estimate.
Variances to the tonnage, grade and metal of the Mineral Resource estimate are expected with further definition drilling. It is the opinion of the Competent Persons that these variances will not significantly affect economic extraction of the deposit.
The mean grade of raw assay data in the mineralised domains compare extremely well upon the collection of additional data;
Previous tests to determine the performance of the Inferred category as it has been upgraded with drilling to Indicated and Measured have been made. The results showed that a robust estimate of Inferred can be made as acceptable variances of tonnage, grade and/or metal were calculated from the original Inferred model in comparison to the same area in the Indicated or Measured model.
Model Release
Number of
Mineralised
Samples (>0.3
g/t)
Mean g/t
April 2016 32,293 1.245
September 2015 24,156 1.305
May 2015 22,490 1.268
August 2014 15,320 1.266
February 2014* 4,240 1.230
*in house modelFor
per
sona
l use
onl
y

Page 40 of 41
Criteria JORC Code explanation Commentary
Performance of the Indicated category has been assessed in this update compared to previous estimates. At a 0.5 g/t cut‐off, the Measured (grade control defined) portion of this model (13.9 Mt at 1.18 g/t for 526 koz) has performed well against the same volume in the previous model (Indicated). The variance is minimal at +4% for tonnes, ‐4 % for grade and +1% for ounces.
The model performance was also assessed visually. As new drilling data came in it was compared to the existing model; in the majority of cases the existing model matched the tenor and thickness of the new assay data.
The statement should specify whether it relates to global or local estimates, and, if local, state the relevant tonnages, which should be relevant to technical and economic evaluation. Documentation should include assumptions made and the procedures used.
Confidence in the Mineral Resource estimate is such that the Measured portions of the model will provide adequate accuracy for ore block design, monthly mill reconciliation and short to medium term scheduling.
For the Indicated and Inferred portions it will provide adequate accuracy for global resource evaluation and for more detailed evaluation at a large scale. Bench evaluations show that tonnages greater than 5 million may be mined over a 20 m vertical height. This is twice the parent cell vertical height of 10 m, so an unbiased estimate at that scale is expected. For Indicated this equates to annual and quarterly production windows and to an annual production window for Inferred.
Relative accuracy is expected to decrease at depth as smaller tonnages are mined as the pit width decreases.
These statements of relative accuracy and confidence of the estimate should be compared with production data, where available.
No previous mining.
For
per
sona
l use
onl
y

Page 41 of 41
Appendix 5 – Gruyere Weathering Profile Guide
For
per
sona
l use
onl
y