GRUPO SURA (BVC: GRUPOSURA PFGRUPSURA) POSTED REVENUES OF … · grupo sura (bvc: gruposura –...
15
Investor Relations– [email protected] – (574) 435 59 41 1 | Page Q2 2013 GRUPO SURA (BVC: GRUPOSURA – PFGRUPSURA) POSTED REVENUES OF COP 397,393 MILLION FOR THE FIRST HALF OF THIS YEAR FOR AN ANNUAL GROWTH OF 10%. YTD revenues of COP 397,393 million (USD 206.0 million), representing an annual growth of 10% along with quarterly revenues of COP 80,510 million (USD 41.7 million). Net profits on a YTD level reached COP 349,430 million (USD 181.1 million), which was 6.0% higher than for the same period last year, with COP 62,171 million (USD 32.2 million) of this figure corresponding to the second quarter of this year. Assets totaled COP 20.7 billion (USD 10.7 billion), showing a drop of 6.4% for the quarter due mainly to price fluctuations of listed companies forming part of its portfolio. Shareholders´ equity came to COP 19.7 billion (USD 10.2 billion) for an intrinsic value of COP 34,235 per share. GRUPO SURA maintained its net debt ratio at 2.6%, thereby reaffirming its ongoing sound financial position. July 25 2013 - Grupo de Inversiones Suramericana – GRUPO SURA reported its results for Q2 2013, the most salient of which is as follows: During the first half of 2013, GRUPO SURA obtained net profits of COP 349,430 million (USD 181.1 million), representing a moderate annual increase of 6%. Revenues for this last quarter came to COP 80,510 million (USD 41.7 million), showing declines of 74.6% QoQ and 60.7% YoY. This lower figure was due to two main reasons: firstly, a softer operating performance on the part of our subsidiaries given the situation with the global markets, to which the Latin American markets were not immune; and secondly to the accounting and exchange effects in Sura Asset Management which have no effect on cash flow. On the other hand, Company assets came to COP 20.7 billion (USD 10.7 billion) which were 6.4% lower than for the previous quarter and 4.79% than December 2012. As for the Company´s liabilities, these fell by 15.0% for the quarter, producing a debt ratio of 2.6%, thereby reaffirming our sound financial position, which was again ratified by Fitch Ratings this year, maintaining our BBB- rating along with a stable outlook.
Transcript of GRUPO SURA (BVC: GRUPOSURA PFGRUPSURA) POSTED REVENUES OF … · grupo sura (bvc: gruposura –...

Investor Relations– [email protected] – (574) 435 59 41
1 | P a g e
Q2 2013
GRUPO SURA (BVC: GRUPOSURA – PFGRUPSURA) POSTED REVENUES OF COP 397,393 MILLION FOR THE FIRST HALF OF THIS YEAR FOR AN ANNUAL GROWTH OF
10%.
YTD revenues of COP 397,393 million (USD 206.0 million), representing an annual growth of
10% along with quarterly revenues of COP 80,510 million (USD 41.7 million).
Net profits on a YTD level reached COP 349,430 million (USD 181.1 million), which was 6.0% higher than for the same period last year, with COP 62,171 million (USD 32.2 million) of this figure corresponding to the second quarter of this year.
Assets totaled COP 20.7 billion (USD 10.7 billion), showing a drop of 6.4% for the quarter due mainly to price fluctuations of listed companies forming part of its portfolio. Shareholders´ equity came to COP 19.7 billion (USD 10.2 billion) for an intrinsic value of COP 34,235 per share.
GRUPO SURA maintained its net debt ratio at 2.6%, thereby reaffirming its ongoing sound financial position.
July 25 2013 - Grupo de Inversiones Suramericana – GRUPO SURA reported its results for Q2 2013, the most salient of which is as follows: During the first half of 2013, GRUPO SURA obtained net profits of COP 349,430 million (USD 181.1 million), representing a moderate annual increase of 6%. Revenues for this last quarter came to COP 80,510 million (USD 41.7 million), showing declines of 74.6% QoQ and 60.7% YoY. This lower figure was due to two main reasons: firstly, a softer operating performance on the part of our subsidiaries given the situation with the global markets, to which the Latin American markets were not immune; and secondly to the accounting and exchange effects in Sura Asset Management which have no effect on cash flow. On the other hand, Company assets came to COP 20.7 billion (USD 10.7 billion) which were 6.4% lower than for the previous quarter and 4.79% than December 2012. As for the Company´s liabilities, these fell by 15.0% for the quarter, producing a debt ratio of 2.6%, thereby reaffirming our sound financial position, which was again ratified by Fitch Ratings this year, maintaining our BBB- rating along with a stable outlook.

Investor Relations– [email protected] – (574) 435 59 41
2 | P a g e
Q2 2013
Financial results
2Q 13 4Q 12 1Q 13 2Q13/4Q12 2Q13/1Q13
ASSETS
Current Assets 14,497 88,033 17,216 -83.5% -15.8%
Permanent investments 9,283,094 9,102,546 9,238,420 2.0% 0.5%
Valuations 11,033,714 12,372,807 12,379,080 -10.8% -10.9%
Other assets 320,672 116,792 424,999 174.6% -24.5%
TOTAL ASSETS 20,651,977 21,680,178 22,059,715 -4.7% -6.4%
LIABILITIES - - - 0.0% 0.0%
Liabilities - Short Term 703,621 638,318 871,288 10.2% -19.2%
Liabilities - Long-Term 250,000 250,000 250,000 0.0% 0.0%
TOTAL LIABILITIES 953,621 888,318 1,121,288 7.4% -15.0%- - -
EQUITY 19,698,355 20,791,860 20,938,427 -5.3% -5.9%
Balance Sheet
(COP million)
Quarter Change %
Variación %
2Q 13 2Q 12 1Q 13 2Q13/2Q12 2Q13/1Q13 2Q 13 2Q 12 2Q13/2Q12
Dividends and interest 85,787 79,691 84,960 7.6% 1.0% 170,747 146,552 16.5%
Profits via equity method, net -5,288 83,671 131,341 126,053 151,245 -16.7%
Proceeds from sales of investments 0 40,844 99,436 -100.0% -100.0% 99,436 63,418 56.8%
Others 11 518 1,146 -97.8% -99.0% 1,157 523 121.1%
Operating revenue 80,510 204,724 316,883 -60.7% -74.6% 397,393 361,738 9.9%
Personnel expense 3,807 2,047 1,917 86.0% 98.6% 5,723 4,314 32.7%
Operating expense 2,951 48,686 4,362 -93.9% -32.3% 7,312 84,648 -91.4%
Fees and commissions 2,113 -1,079 1,048 101.6% 3,161 13,117 -75.9%
Other expense 53 34 47 58.5% 13.2% 100 63 59.8%
Operating expense 8,924 49,687 7,373 -82.0% 21.0% 16,297 102,141 -84.0%
Operating earnings 71,587 155,036 309,510 -53.8% -76.9% 381,096 259,598 46.8%
Non-Operating Expense: 6,620 -6,305 18,617 -64.4% 25,237 -82,744
Profits before tax 64,967 161,342 290,893 -59.7% -77.7% 355,859 342,341 3.9%
Provision for tax -2,795 -9,790 -3,634 -71.4% -23.1% -6,429 -12,556 -48.8%
NET PROFITS 62,171 151,552 287,259 -59.0% -78.4% 349,430 329,785 6.0%
AccumulatedINCOME STATEMENT
(COP million)
Quarter Change %
KEY INDICATORS
Company* 2Q 13 2Q 12 1Q 13 4Q 12
Operating margin 88.9% 75.7% 97.7% 94.2%
Net margin 77.2% 74.0% 90.7% 72.5%
Operating expense ratio 11.1% 24.3% 2.3% 5.9%
Debt ratio 2.6% 6.2% 2.4% 3.3%
Liabilities to assets ratio 4.6% 8.3% 5.1% 4.1%
ROAA 2.7% 2.6% 3.0% 2.5%0 0 0 0
Net earnings per share 108.05 263.40 499.26 151.24
Intrinsic Value 34,236 31,368 36,391 36,136
Ordinary share 37,400 30,900 39,000 38,000
Preferred share 37,940 32,500 39,200 39,000
P/BV per ordinary share 1.09 0.99 1.07 1.05
P/BV per preferred share 1.11 1.04 1.08 1.08
Yield - ordinary share 0.9% 1.0% 0.9% 0.8%
Yield - preferred share 2.6% 3.0% 2.5% 2.5%
Outstanding ordinary shares 469,037,260 469,037,260 469,037,260 469,037,260
Outstanding preferred shares 106,334,963 106,334,963 106,334,963 106,334,963
Total outstanding stock 575,372,223 575,372,223 575,372,223 575,372,223
Market Capitalization (COP millions) 21,576,342 17,949,138 22,460,784 21,970,479
Exchange rate 1,929.00 1,784.60 1,832.20 1,768.23 0 0 0 0
Ordinary dividend 339 308 339 308
Preferred dividend 975 975 975 975
Quarter

Investor Relations– [email protected] – (574) 435 59 41
3 | P a g e
Q2 2013
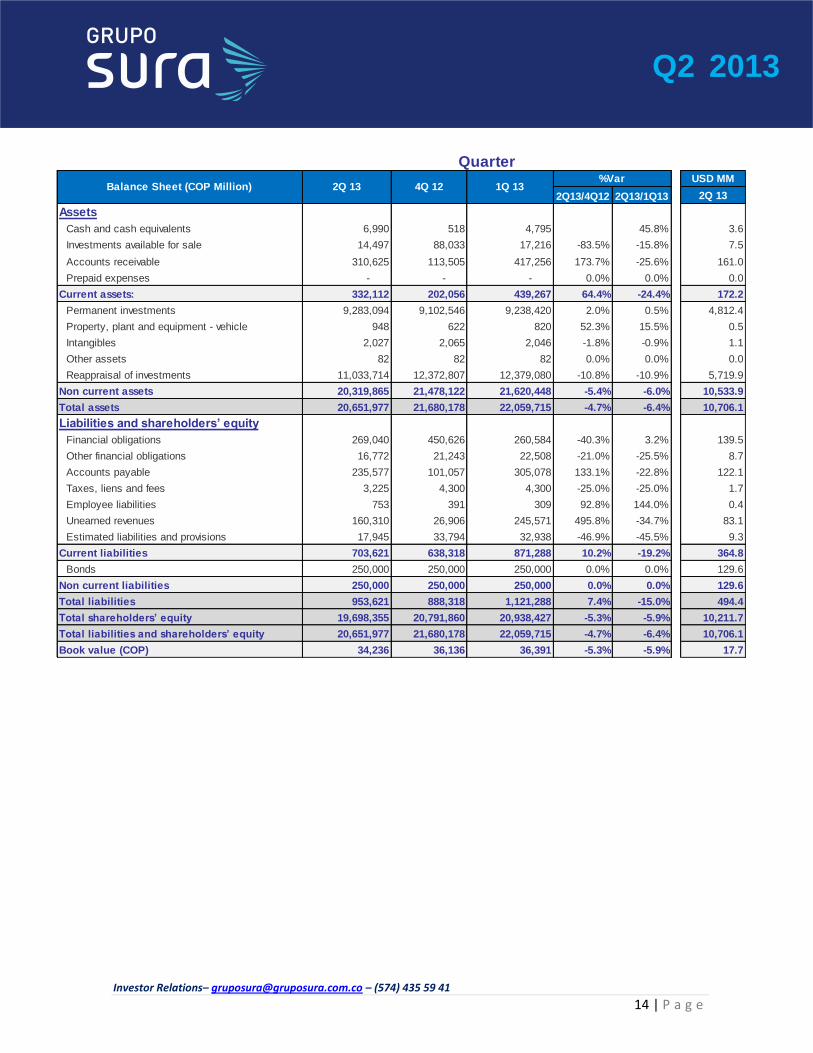
BALANCE SHEET At June 30, 2013, GRUPO SURA posted assets worth COP 20.7 billion (USD 10.7 billion), showing declines of 6.4% QoQ and 4.7% compared to year-end 2012. This was mainly due to price fluctuations on the Colombian stock market, to which the listed companies belonging to Grupo Sura´s portfolio were not immune, producing a decline of 9%, which was in keeping with the drops recorded by the local IGBC and COLCAP Indices. Current assets dropped by 24.4% QoQ, due to collected dividends on investments made in non-subsidiary companies. As far as current liabilities are concerned, the Company posted a drop of 19.2% for the quarter, as a result of having paid out the first dividend installment due this year, as declared by the shareholders at their Annual General Meeting held back in March of this year, and these shall gradually decrease in keeping with the declared dividend distribution schedule.. It is important to note a drop of 15.0% in the Company’s total liabilities, as part of the debt reduction strategy put into place after purchasing the assets that today make up Sura Asset Management. Non-current liabilities contain bonds totaling COP 250,000 million (USD 129.6 million) issued in 2009 for terms of 10, 20 and 40 years. Consequently, GRUPO SURA obtained a debt ratio of 2.6% and a total debt to asset ratio of 4.6%. Shareholders´ Equity ended this second quarter at COP 19.7 billion (USD 10.2 billion) showing declines of 5.9% QoQ and 5.3% on a YTD basis. As previously mentioned, this account was also affected by fluctuating share prices for all those listed companies that form part of Grupo Sura´s portfolio. GRUPO SURA´s intrinsic share price came to COP 34,235.9 (USD 17.7). INCOME STATEMENT Revenues: The Company posted COP 349,430 million (USD 181.1 million) in YTD profits, which is 6.0% more than for the same period last year. Net profits for the quarter came to COP 62,171 million (USD 32.2 million) showing declines of 78.4% QoQ and 59.0% YoY. This was mainly due to dividend income obtained from the Company’s investments totaling COP 85,321 million (USD 44.2 million) and representing increases of 1.0% QoQ and 7.7% YoY, producing a total of COP 169,805 million (USD 88.0 million) for the first half of this year. Here, GRUPO SURA´s subsidiaries provided COP 126,053 million via the equity method. Suramericana contributed with COP 24,237 million (USD 12.6 million) for the quarter, producing a YTD total of COP 72,224 million (USD37.4 million). At the same time, and proportional to GRUPO SURA’s stake in the Company, Sura Asset Management contributed another COP 47,497 million (USD 29.5 million) in operating revenues offset by a drop in its equity as a result of the prevailing market conditions affecting its investments, for a net total of COP 4,869 million (USD xx million) for the quarter. Finally and taking into account revenues from other subsidiaries, as recorded using the equity method, the final net figure obtained by GRUPO SURA for this second quarter came to less than COP 5,288 million (USD 2.7 million), as shown in the following table, for a total of COP 126,053 million (USD XXX million) for the first half of this year.

Investor Relations– [email protected] – (574) 435 59 41
4 | P a g e
Q2 2013
Equity Method for the Quarter
2Q 13 1Q 13 2Q 12 1Q13/4Q12 1Q13/1Q12
Suramericana 24,237 47,987 73,493 -49.5% -67.0%
Sura Asset Management 47,497 87,727 27,190 -45.9% 74.7%
Equity effect Sura AM (42,628)
Exchange losses and other (34,394) (4,373) (17,012) 686.5% 102.2%
TOTAL (5,288) 131,341 83,671 -104.0% -106.3%
Quarter Change %Equity Method
On the other hand, proceeds from the sale of investments for the first half of this year reached COP 99,436 million (USD 51.5 million) due to having sold a 7.51% stake in AFP Protección during the previous quarter. Operating expense These increased by 21% QoQ and dropped by 82.0% on a YoY basis, largely due to having amortized in 2012 the entire amount of deferred charges on the acquisition of the assets that make up Sura Asset Management today, as well as consultancy and investment banking fees paid out on this same transaction. It is worth noting that the Company´s total operating expense/revenues ratio came to 4.1%, which was higher than the 2.3% reported for the previous quarter due to a lower growth in revenues. Non-Operating Income and Expense: Financial expense and commissions, the main item in this account, came to COP 8,603 million, which was 57.2% lower than for the same period last year, producing a total of COP 27,547 for the first half of this year which in turn was 39.7% lower than for the same period last year. Finally, net profits for the first half of this year came to COP 349,430 million (USD 181.1 million), which was 6.0% more than for the same period last year. The results posted for this past second quarter were affected by the drop in the amounts recorded via the equity method, as previously explained. Earnings per share reached COP 607 (USD 0.315) which were COP 34 (USD 0.2) higher for the same period last year. Highlights The following are just some of the more important events driving the performance of GRUPO SURA and its subsidiaries during the second quarter of 2013 Sura Asset Management On June 29, the Company completed one of the more important stages of its structural streamlining initiative, began a while back, namely relocating the ownership stakes belonging to the Company’s entire body of shareholders here in Colombia. Corredora de Bolsa SURA S.A has now been entered by the Chilean Superintendency of Securities and Insurance (Superintendencia de Valores y Seguros) in Chile´s Stock Broker Registry (Registro de Intermediarios de Valores). The setting up of this new firm is in keeping with Sura´s strategy in Chile, which is mainly focused on acquiring leadership over the personal savings market, where it already participates in the pension, life insurance and

Investor Relations– [email protected] – (574) 435 59 41
5 | P a g e
Q2 2013
investment fund segments. This new brokerage firm shall now be extending the portfolio of products offered to its clients and providing them with a more efficient handling of their investments. Fitch Ratings ratifies its investment grade for GRUPO SURA This ratings agency has again ratified its international investment grade for GRUPO SURA (BBB-). As a result of the analysis conducted beforehand, Fitch Ratings concluded that GRUPO SURA’s finances reflect the Company’s credit quality, diversified investment portfolio, sound market position and the mid-term prospects for all those economic sectors in which the Company participates through its investments. Fitch Ratings also underscored GRUPO SURA´s historically low leverage ratios, its M&A-based growth strategy as well as the financing of such with an adequate combination of both debt and its own funds. Dividend installments paid out in April 2013. From April 1 to 15, the Company paid out dividends on its preferred shares, these corresponding to the first quarter (January to March) of 2013. It also paid out dividends on its ordinary shares from April 2 to 16. This was in keeping with that decided by the Company´s shareholders at their Annual Meeting held on March 21, 2013, at which they approved an annual dividend of COP 339 on the Company’s ordinary shares, payable in four quarterly installments in advance of COP 84.75 each. In the case of the Company’s preferred shares, annual dividends came to COP 975, payable in four quarterly installments in arrears of COP 243.75 each, this in keeping with the rules and regulations for their issue and placement.
Additional comments SURAMERICANA - The Best Insurance Company in Latin America. Our insurance and social security sub-holding, SURAMERICANA, was ranked by the prestigious journal, Reactions, published by the Euromoney Group as the best insurance company in Latin America in two main categories: “The Best Insurance Company in Latin America ” and “The Best Insurance Company in Colombia”. Also Gonzalo Alberto Pérez, the Company’s Chief Executive Officer was given the “Best CEO of the Year in Latin America" award within the insurance sector. These awards underscore SURA´s excellent work, in conjunction with its employees, in its different insurance businesses in Colombia, El Salvador, Panama and the Dominican Republic. GRUPO SURA at Colombia Inside Out. This institutional event was staged in New York and London so that 22 of the companies listed on the Colombian stock exchange could provide international investors with a closer look at the opportunities to be had on the local stock market. GRUPO SURA continues to affirm its leadership position on the Latin American pension market while remaining an expert player within the region´s insurance and investment sectors. It is also widely recognized as one of the more important issuers on the Colombian market through which it intends to acquire a greater exposure to other parts of the region offering a high-growth potential. GRUPO SURA, leading the newly introduced COLEQTY Index. The Colombian Stock Exchange (BVC) recently published the final baskets of stocks for its new COLEQTY and COLSC Indexes, for the second quarter of 2013, with the former calculated on April 30 for the period May 2 to July 31 2013. Here the Grupo Sura share came in top with a weighting of 9,681%, trailed by ECOPETROL,

Investor Relations– [email protected] – (574) 435 59 41
6 | P a g e
Q2 2013
INVERARGOS and NUTRESA with weightings of 9,392%, 7,485% 7,081% respectively. The COLEQTY is a new stock market index weighted by the market capitalization of each stock.
SURAMERICANA
Consolidated revenues obtained from the different companies belonging to Suramericana S.A., our insurance and social security holding, came to COP 2.8 billion (USD 1.44 billion) for a total growth of 11% both at home and abroad. Subsidiary Revenues
Life Insurance 891,253 772,785 15.3%
Property and Casualty 640,019 625,715 2.3%
EPS SURA 512,810 463,456 10.6%
Workers Compensation 315,632 275,844 14.4%
Insurance and social security 2,359,714 2,137,799 10.4%
Asesuisa 96,568 85,954 12.3%
SURA Republica Dominicana 70,640 66,580 6.1%
SURA Panamá 43,789 40,412 8.4%
Insurance outside Colombia 210,996 192,946 9.4%
Other subsidiaries 212,900 182,500 16.7%
Total subsidiaries 2,783,611 2,513,245 10.8%
Revenues per Subsidiary Q2 13 Q2 12 % Var YoY
With regard to its individual results for Q2 2013, the Suramericana Holding posted revenues totaling COP 114,737 million (USD 59.5 million) showing a decline of 24% compared to the same period last year, effect that is explained by the return of fixed income investments in the insurance companies due to the global market situation. The bulk of this figure, that is to say COP 114,712 million (USD 59.5 million), consisted of revenues obtained from its subsidiaries via the equity method Expense on a YTD level came to COP 9,354 million (USD 4.8 million) due mainly to personnel and administrative expense. Company profits reached COP 89,025 million (USD 46.2 million), showing a drop of 38%. Assets rose by 9% ending the quarter at COP 2.03 billion (USD 1.05 billion), with investments representing COP 1.92 billion (USD 997.2 million) of this figure. On the other hand, liabilities for Q2 2013 came to COP 119,591 million (USD 62.0 million) Shareholders Equity rose by 19% YoY ending up for Q2 2013 at COP 1.91 billion (USD 992. 4 million), this increase is explained by the capitalization that was done in order to acquire Asesuisa in October 2012.

Investor Relations– [email protected] – (574) 435 59 41
7 | P a g e
Q2 2013
For this past quarter the holding´s life insurance company, Seguros de Vida, obtained an increase of 15.3% in premiums, with those of its property and casualty insurance company, Seguros Generales, rising by 2.3%. This was mainly due to certain businesses relating to specific projects corresponding to the first half of 2012. Seguros Generales Suramericana The holding´s property and casualty insurance company, Seguros Generales Suramericana, obtained premiums totaling COP 640,019 million (USD 331.8 million), which was 2.3% more compared to the same period last year, while retained premiums rose by 8.7% for a total of COP 448,602 million (USD 229.4 million). This was in keeping with the overall trend on the Colombian property and casualty insurance market, with Fasecolda (the Colombian Federation of Colombian Insurance Companies) reporting average growths of 3% and 7% respectively for total and retained premiums. Car insurance was the Company’s most popular solution, showing a growth of 2.2% given current market conditions and the prevailing low growth in the country´s vehicle fleet. On the other hand, mandatory road insurance (SOAT) obtained premiums during this past quarter of COP 114,386 million (USD 59.3 million) for a growth of 23.8%. Premiums and claims per branch of insurance
Automobile 262,023 2.2% 250,815 2.1% 66.4% 67.8%
SOAT 114,386 23.8% 101,454 29.3% 49.5% 38.9%
Transport 20,393 -18.9% 18,210 -3.4% 25.0% 23.0%
Fire 124,380 7.3% 17,810 21.1% 22.0% 35.7%
Third party liabilities 28,051 25.8% 16,673 25.3% 21.4% 13.6%
Other 90,785 -20.1% 43,640 4.7% 41.0% 29.4%
Total 640,019 2.3% 448,602 8.7% 55.0% 53.5%
% Retained
Claims Ratio
2Q 12
% Var YoY
% Retained
Claims Ratio
2Q 13
% Var YoY
Retained
Premiums
2Q 13
Premiums and Claims
(COP Millon)
Premiums
2Q 13
Retained claims reached COP 246,549 million (USD 127.8 million), based on which the Company’s technical result rose by 5.5% to COP 82,621 million (USD 42.8 million) for a technical margin of 12.91%. The Company posted an incurred retained claims rate for Q2 2013 of 55.0%, along with a combined ratio of 102.5%. At June 30, 2013, the Company’s investments came to COP 22,311 million (USD 11.6 million), showing a decline of 23.7%, which was mainly due to market conditions during this past quarter, particularly in June with the hike in interest rates on fixed-income securities. Thus the Company posted net profits of COP 7,728 million (USD 4.0 million).
Seguros de Vida Suramericana The Suramericana life insurance company, Seguros de Vida Suramericana, posted YTD revenues of COP 891,253 million (USD 462.0 million), which were 15.3% higher than for the same period last year, going above the corresponding budgeted figure as well an average market growth of 13%, as reported by Fasecolda (the Colombian Federation of Colombian Insurance Companies). It is worthwhile noting the 23.3% growth obtained by this Company for this past quarter, with premiums totaling COP 149,757 million (USD 77.6

Investor Relations– [email protected] – (574) 435 59 41
8 | P a g e
Q2 2013
million). The Company´s incurred claims rate came to 65.2% with its technical result rising by 31.2% for a total of COP 57,004 million (USD 29.6 million). Premiums and claims per branch of insurance
Health 253,613 19.4% 253,613 19.4% 64.2% 68.5%
Individual life 194,089 1.9% 171,409 1.0% 43.7% 31.6%
Group life 149,757 23.3% 147,529 23.6% 36.6% 33.8%
Other life 44,025 28.9% 40,506 29.9% 70.6% 70.7%
Subtotal Life 641,484 14.9% 613,057 15.1% 52.2% 49.1%
Disability and Survivorship 219,901 48.6% 219,901 48.6% 95.0% 107.0%
Annuities 29,868 -54.9% 29,868 -54.9% 112.2% 55.4%
Total 891,253 15.3% 862,825 15.5% 65.2% 61.1%
Premiums and Claims
(COP Millon)
Premiums
2Q 13% Var YoY
Retained
Premiums
2Q 13
% Var YoY
% Retained
Claims Ratio
2Q 13
% Retained
Claims Ratio
2Q 12
This life insurance company posted investments totaling COP 75,230 million (USD 39.0 million), showing a decline of 37.0% compared to the same period last year, given the situation on the local fixed-income market over the last few months. Consequently, at the end of Q2 2013, the Company posted profits of COP 34,836 million (USD 18.1 million).
ARL SURA The Group´s Workers Compensation Firm, ARP SURA, obtained COP 315,632 million (USD 163.6 million), in revenues for Q1 2013, which were 14.4% higher than those obtained for the same period last year. The Company´s technical result came to COP 73,538 million (USD 38.1 million), for a YoY increase of 29.2%, with its claims rate running at 52.9%. It is worthwhile noting the 20% YoY growth in the Company’s client base which now numbers 54.510 companies with almost two million insured workers. Proceeds from investments came to COP 25,552 million (USD 13.2 million) for Q2 2013, with net profits falling by 5.8% to COP 57,302 million (USD 29.7 million). EPS SURA EPS SURA, Suramericana´s obligatory and complementary healthcare insurance subsidiary, increased its obligatory healthcare revenues by 11%, for a total of COP 492,180 million (USD 255.1 million), while claims for this same line came to COP 453,125 million (USD 234.9 million), showing a similar increase for a claims rate of 92% so far this year. The Company´s financial result came to COP 15,983 million (USD 8.3 million), with net profits, including pre-paid healthcare, reaching COP 9,420 million (USD 4.9 million). Here it is worthwhile noting that administrative expense represented just 8% of total revenues.

Investor Relations– [email protected] – (574) 435 59 41
9 | P a g e
Q2 2013
SURA ASSET MANAGEMENT
With regard to Sura Asset Management, the No. 1 Pension Fund Management firm in Latin America
and an expert player in the region´s savings and investment sectors, the following are the main
achievements for the first half of this year:
SURA Asset Management continues to grow and expand its pension business within Latin America. In Peru, through its subsidiary AFP Integra, the Company acquired a 50% stake in BBVA AFP Horizonte, for a total of USD 514 million. With this, AFP Integra has effectively taken over the lead on the Peruvian pension market with a share of more than 40% in terms of AUM.
It has also been extending its value-added range of products geared to addressing the entire client life cycle, that is to say, both the accumulation as well as decumulation stages. Here:
o A contract of sale was signed in Mexico with Grupo Valores Monterrey for the purchase of Primero Seguros Vida S.A., a firm specialized in selling life insurance.
o In Chile a fund distribution agreement was signed with Black Rock, giving SURA exclusive distribution rights.
o In Colombia the merger between AFP Protección and AFP ING was successfully completed. Protección also signed a life insurance distribution agreement with Suramericana for El Salvador and Colombia, thereby extending its value-added range of products for its clients.
o In Uruguay, the investment fund management firm - AFISA SURA – was launched. o In El Salvador a new insurance brokerage firm, SUAM Corredora de Seguros S.A., was set
up for the purpose of distributing life insurance.
So far this year, the Company has been streamlining its different businesses in each country with a view to making its corporate structure clearer and more straightforward. Each country shall be grouping together its local pension, insurance, savings and investment companies in one single vehicle called SURA Asset Management plus the name of the country. As part of this process, the Company relocated its co-investors from Sura Asset Management España S.L. in Spain to Sura Asset Management S.A. in Colombia.
The Company also prepaid its debt in Chile in the amount of USD 85 million, so as to centralize its debt and obtain better rates, thereby avoiding any subordination of such and achieving savings of more than USD 20 million so far this year (USD 2 million due to better rates and USD 18 million in greater tax efficiencies).
As far as the proforma consolidated financial figures are concerned, Sura Asset Management
reported after-tax profits of USD 109.4 million, this affected by non-recurring expense corresponding
to rebranding, the transition period and the amortization of intangibles amongst other factors. It is
important to note that these results do not include those of AFP Protección in Colombia nor since
AFP Crecer en El Salvador since Sura Asset Management España S.L. does not consolidate the results
of these companies.

Investor Relations– [email protected] – (574) 435 59 41
10 | P a g e
Q2 2013
Operating revenues came to USD 856.4 million. This gratifying level of performance was mainly due
to higher commission income, issued premiums and returns on investment. Net commission income
increased given a higher salary base in Latin America which has risen on average by 10.6%.
EBITDA on the part of its subsidiaries came to USD 179.1 million, of which Chile accounted for 38.2%,
Mexico 36.6%, Peru 22.2%, and finally Uruguay with 3.0%.

Investor Relations– [email protected] – (574) 435 59 41
11 | P a g e
Q2 2013
Chile 68,449
México 65,473
Perú 39,752
Uruguay 5,393
Sura Asset Management 179,068
EBITDA
On the other hand, administrative expense totaled USD 663.4 million, showing a controlled increase
largely due to implementation lags and expense control initiatives. Net returns on investments were
negative, given prevailing conditions, especially on the Latin American markets, which are duly
reflected in the returns obtained from the legal pension reserve.
Assets under management, including those of AFP Protección and AFP Crecer, came to USD 103.4
billion, these belonging to a total of 15.9 million clients in Latin American, broken down as follows:
Chile with USD 36.0 billion in AUM and 2.0 million clients
México with USD 24.1 billion in AUM and 6.1 million clients
Peru with USD 10.6 billion in AUM and 1.4 million clients (excluding figures corresponding to the 50% stake acquired in Horizonte)
Colombia with USD 27.6 billion in AUM and 4.8 million clients
Uruguay with USD 1.9 billion in AUM and 295 thousand clients El Salvador with USD 3.3 billion in AUM and 1.3 million clients

Investor Relations– [email protected] – (574) 435 59 41
12 | P a g e
Q2 2013
Assets Under Management reached USD 103.4 billion showing a 9.9% increase YoY (USD 94.1
billion), and an 8.1% drop QoQ (USD 112.5 billion). This was mainly due to the exchange rate effect
on the different portfolios as well as global market conditions.
Obligatory Pension Fund membership rose by 1.5% YoY for a total of 14.6 million at June 30, 2013.
AFP PROTECCIÓN S.A. It is important to note that at the end of Q2 2013, the Pension Fund Management firm, Administradora de Fondos de Pensiones y Cesantías PROTECCIÓN, had already merged with ING Colombia. Operating revenues came to COP 215,732 million (USD 111.8 million) in Colombia and COP 48,201 million (USD 25.0 million) in El Salvador Net profits reached COP 27,783 million (USD 14.4 million), for a growth of 19%, mainly due to the synergies obtained by merging some of the Company´s processes, a good level of product performance of its products and having optimized operating expense directly relating to its products. As in the case of other companies belonging to Grupo Sura´s portfolio, Proteccion was also affected by the situation on the capital markets having sustained a loss of COP 17,600 (USD 10.2 million) on its investments. The Company´s assets under management came to COP 53.0 billion (USD 46 million) for a growth of 11.0% this taking into account the funds managed by both ING and Protección for the same period last year. With this growth PROTECCIÓN secured an overall market share of 37.0% in terms of assets under management, including obligatory and voluntary pensions as well as severance funds. Obligatory pension fund members

Investor Relations– [email protected] – (574) 435 59 41
13 | P a g e
Q2 2013
totaled 3.6 million, with another 1.9 million in voluntary and severance fund members. Here it is worth pointing out the 17.1% growth in voluntary pension fund members compared to just a 8.8% growth in the corresponding market. As for AFP CRECER, assets under management came to USD 3.3 billion, these belonging to 1.3 million clients.
BANCOLOMBIA (Unconsolidated) Bancolombia posted unconsolidated YTD profits of COP 803.196 thousand million (USD 416.4 million), showing an increase of 3.8% compared to the same period last year. Interest income for Q2 2013, from both its loan portfolio as well as leasing operations rose by 15.11% and 367.2% respectively for a total COP 3.07 billion (USD 1.59 billion), for an overall increase of 13.1%. This growth largely offset higher provision and operating expense. It is also worth noting that the Company’s dividends rose by 20.9% to almost COP 400 thousand million (USD 207.4 million). Non-consolidated assets came to COP 83.1 billion (USD 43.1billion), for an increase of 29.7%; while shareholders´ equity increased by 7.8% to COP 11.6 billion (USD 6.0 billion)
Investor Relations– [email protected] – (574) 435 59 41
14 | P a g e
Q2 2013
USD MM
2Q13/4Q12 2Q13/1Q13 2Q 13
Assets
Cash and cash equivalents 6,990 518 4,795 45.8% 3.6
Investments available for sale 14,497 88,033 17,216 -83.5% -15.8% 7.5
Accounts receivable 310,625 113,505 417,256 173.7% -25.6% 161.0
Prepaid expenses - - - 0.0% 0.0% 0.0
Current assets: 332,112 202,056 439,267 64.4% -24.4% 172.2
Permanent investments 9,283,094 9,102,546 9,238,420 2.0% 0.5% 4,812.4
Property, plant and equipment - vehicle 948 622 820 52.3% 15.5% 0.5
Intangibles 2,027 2,065 2,046 -1.8% -0.9% 1.1
Other assets 82 82 82 0.0% 0.0% 0.0
Reappraisal of investments 11,033,714 12,372,807 12,379,080 -10.8% -10.9% 5,719.9
Non current assets 20,319,865 21,478,122 21,620,448 -5.4% -6.0% 10,533.9
Total assets 20,651,977 21,680,178 22,059,715 -4.7% -6.4% 10,706.1
Liabilities and shareholders’ equity
Financial obligations 269,040 450,626 260,584 -40.3% 3.2% 139.5
Other financial obligations 16,772 21,243 22,508 -21.0% -25.5% 8.7
Accounts payable 235,577 101,057 305,078 133.1% -22.8% 122.1
Taxes, liens and fees 3,225 4,300 4,300 -25.0% -25.0% 1.7
Employee liabilities 753 391 309 92.8% 144.0% 0.4
Unearned revenues 160,310 26,906 245,571 495.8% -34.7% 83.1
Estimated liabilities and provisions 17,945 33,794 32,938 -46.9% -45.5% 9.3
Current liabilities 703,621 638,318 871,288 10.2% -19.2% 364.8
Bonds 250,000 250,000 250,000 0.0% 0.0% 129.6
Non current liabilities 250,000 250,000 250,000 0.0% 0.0% 129.6
Total liabilities 953,621 888,318 1,121,288 7.4% -15.0% 494.4
Total shareholders’ equity 19,698,355 20,791,860 20,938,427 -5.3% -5.9% 10,211.7
Total liabilities and shareholders’ equity 20,651,977 21,680,178 22,059,715 -4.7% -6.4% 10,706.1
Book value (COP) 34,236 36,136 36,391 -5.3% -5.9% 17.7
Quarter
Balance Sheet (COP Million) 2Q 13 4Q 12 1Q 13%Var

Investor Relations– [email protected] – (574) 435 59 41
15 | P a g e
Q2 2013
% Var USD MM
2Q13/2Q12 2Q13/1Q13 2Q13/2Q12 2Q 13
Dividends 85,321 79,238 84,484 7.7% 1.0% 169,805 143,961 18.0% 88.0
Interests 466 453 476 2.9% -2.0% 942 2,591 -63.7% 0.5
Earnings from the equity method, net (5,288) 83,671 131,341 126,053 151,245 -16.7% 65.3
Earnings from sale of investments, net - 40,844 99,436 -100.0% -100.0% 99,436 63,418 56.8% 51.5
Appraisals at market prices, net 11 3 1,146 242.4% -99.0% 1,157 9 0.6
Reinbursment provision for investments - 515 - -100.0% 0.0% - 515 -100.0% -
Operating revenues 80,510 204,724 316,883 -60.7% -74.6% 397,393 361,738 9.9% 206.0
Payroll expenses 3,807 2,047 1,917 86.0% 98.6% 5,723 4,314 32.7% 3.0
Fees 2,113 (1,079) 1,048 101.6% 3,161 13,117 -75.9% 1.6
Administrative expenses 2,951 48,686 4,362 -93.9% -32.3% 7,312 84,648 -91.4% 3.8
Depreciation 53 34 47 58.5% 13.2% 100 63 59.8% 0.1
Operating administrative expenses 8,924 49,687 7,373 -82.0% 21.0% 16,297 102,141 -84.0% 8.4#N/A - - - - - -
Operating income 71,587 155,036 309,510 -53.8% -76.9% 381,096 259,598 46.8% 197.6
Adjustment for diff. in foreign-exchange (1,045) (27,261) (536) -96.2% 94.8% (1,581) (124,965) -98.7% (0.8)
Financial expenses - commissions 8,603 20,103 19,144 -57.2% -55.1% 27,747 46,026 -39.7% 14.4
Extraordinay expenses 46 901 20 -94.9% 128.3% 66 1,494 -95.6% 0.0
ADR call option compensation - 0 - -100.0% 0.0% - 5,021 -100.0% -
Other (985) (48) (11) (995) (10,319) -90.4% (0.5)
Non operating expense (income) 6,620 (6,305) 18,617 -64.4% 25,237 (82,744) 13.1
Income before taxes 64,967 161,342 290,893 -59.7% -77.7% 355,859 342,341 3.9% 184.5
Income and complementary taxes provision (2,795) (9,790) (3,634) -71.4% -23.1% (6,429) (12,556) -48.8% (3.3)
Net income 62,171 151,552 287,259 -59.0% -78.4% 349,430 329,785 6.0% 181.1
Accumulated
Income Statements (COP Millions) 2Q 13 2Q 12 1Q 13%Var
2Q 13 2Q 12
Quarter