Growth Without Governance - World Bank
56
wp$ a a2. POLICY RESEARCH WORKING PAPER 2928 Growth Without Governance Daniel Kaufmann Aart Kraay The World Bank World Bank Institute and Development Research Group November 2002 Public Disclosure Authorized Public Disclosure Authorized Public Disclosure Authorized Public Disclosure Authorized
Transcript of Growth Without Governance - World Bank

wp$ a a2.
POLICY RESEARCH WORKING PAPER 2928
Growth Without Governance
Daniel Kaufmann
Aart Kraay
The World Bank
World Bank Institute
and
Development Research Group
November 2002
Pub
lic D
iscl
osur
e A
utho
rized
Pub
lic D
iscl
osur
e A
utho
rized
Pub
lic D
iscl
osur
e A
utho
rized
Pub
lic D
iscl
osur
e A
utho
rized

| POLICY RESEARCH WORKING PAPER 2928
Abstract
It is well known that there is a strong positive correlation Governance." They document this evidence using abetween per capita incomes and the quality of newly updated set of worldwide governance-indicatorsgovernance across countries. Kaufmann and Kraay covering 175 countries for the period 2000-01, and usepropose an empirical strategy that allows separation of the results to interpret the relationship between incomesthis correlation into (1) a strong positive causal effect and governance focusing on the Latin America andrunning from better governance to higher per capita Caribbean region-within a worldwide empiricalincomes, and, perhaps surprisingly at first, (2) a weak context. Finally, the authors speculate about theand even negative causal effect running in the opposite potential importance of elite influence and state capturedirection from per capita incomes to governance. in accounting for the surprising negative effects of per
The first result confirms existing evidence on the capita incomes on governance, present some evidence onimportance of good governance for economic such capture in some Latin American countries, anddevelopment. The second result is new and suggests the suggest priorities for actions to improve governanceabsence of a "virtuous circle" in which higher incomes when such pernicious elite influence shapes publiclead to further improvements in governance. This policy.motivates the authors' choice of title, "Growth Without
This paper-a joint product of the World Bank Institute and the Development Research Group-is part of a larger effortin the Bank to generate and analyze worldwide governance indicators, assessing the manifestations and consequences ofgovernance. The full governance indicators dataset is available interactively at http://www.worldbank.org/wbi/governance/govdata2001.htm. Copies of this paper are available free from the World Bank, 1818 H Street NW, Washington, DC 20433.Please contact Kevin Morgan, room J3-273, telephone 202-473-7798, fax 202-676-9874, email [email protected]. Policy Research Working Papers are also posted on the Web at http://econ.worldbank.org. Theauthors may be contacted at [email protected] or [email protected]. November 2002. (50 pages)
The Policy Research Working Paper Senes disseminates the findings of work in progress to encourage the exchange of ideas aboutdevelopmient issues. An objective of the series is to get the findings out quickly, even if the presentations are less than fully polished. The
papers carry the names of the authors and should be cited accordingly. The findings, interpretations, and conclusions expressed in thispaper are entirely those of the authors. They do not necessarily represent the view of the World Bank, its Executive Directors, or thecountries they represent.
Produced by the Research Advisory Staff

Growth without Governance
Daniel Kaufmann
Aart Kraay
This paper is forthcoming in Economia (Fall issue 2002). We would like to thank thepaper discussants in the Economia panel held at Harvard University, Eduardo Lora andLant Pritchett, as well as Antonio Estache, Joel Hellman, Daniel Lederman, GuillermoPerry, Maurice Schiff, Roberto Steiner, and Jaume Ventura for helpful comments, andMassimo Mastrzi and Erin Farnand for assistance.


Per capita income and the quality of governance are strongly positively correlated across
countries. We propose an empirical strategy that allows us to separate this correlation into two
components: a strong positive causal effect running from better governance to higher per capita income
and a weak and even negative causal effect running in the opposite direction from per capita income to
governance. The first result confirms existing evidence on the importance of good governance for
economic development. The second result is new and suggests the absence of virtuous circles, in which
higher incomes lead to further improvements in governance. This motivates our choice of title, "Growth
without Governance." We document this evidence using a newly updated set of worldwide governance
indicators covering 175 countries for the period 2000-01, and we use the results to interpret the
relationship between incomes and governance in the Latin America and the Caribbean region. Finally, we
speculate as to the potential importance of elite influence and state capture in accounting for the
surprising negative effects of per capita income on governance, present evidence on such capture in some
Latin American countries, and suggest priorities for actions to improve governance when such pernicious
elite influence shapes public policy.
The starting point of the paper is the strong positive correlation between various measures of
governance and per capita income. Figure I plots the relationship between governance (on the vertical
axis) and log per capita income (on the horizontal axis) in a large sample of countries, for six different
dimensions of governance (see Annex 3 for all figures). Per capita incomes are measured in 1995, in 1985
U.S. dollars adjusted for differences in purchasing power; the governance indicators refer to the period
2000-01. Since initial incomes in the distant past are not very different across countries, the current
dispersion in per capita incomes on the vertical axis reflects differences in growth across countries in the
very long run. Figure I can thus also be interpreted as illustrating the relationship between growth in the
very long run and current institutional quality.
Interestingly, the countries in the Latin American and Caribbean region display striking
differences in performance on different measures of institutional quality relative to their per capita
incomes. In terms of the institutions of political accountability, countries in Latin America and the
Caribbean fare well relative to their per capita incomes, in the sense that a strong majority of countries in
the region lie above the simple ordinary least squares (OLS) regression line of the voice and
accountability measure on per capita income. In contrast, most countries in the region fare surprisingly
poorly on three other dimensions of governance (namely, government effectiveness, rule of law, and
control of corruption). Finally, for the last two dimensions of governance that we consider (political
stability and regulatory quality), countries in Latin America and the Caribbean are fairly evenly
distributed above and below the OLS regression line. Table 1 summarizes these patterns by indicating the
proportion of the twenty-six countries in the region for which we have data that fall above and below the
2

regression line. The last column also reports the p value associated with the null hypothesis of a sign test
that countries in Latin America and the Caribbean are evenly distributed above and below the regression
line for the entire sample. For the first four indicators we mention, the noted patterns are strongly
statistically significant at conventional levels, with Latin America and the Caribbean faring well in the
first indicator (political accountability), but poorly in the following three (government effectiveness, rule
of law and control of corruption).
Table 1. Governance and Per Capita Incomes in Latin America and the CaribbeanaPosition relative to OLS regression line
Measure of institutional quality Below Above P value
Voice and accountability 8 18 0.05Political stability 11 15 0.43Government effectiveness 19 7 0.02Regulatory quality 10 16 0.24Rule of law 20 6 0.01Control of corruption 20 6 0.01Overall govermance 16 10 0.24a The first two columns summarize the location of countries in Latin America and the Caribbean relative tothe regression line in a simple OLS regression of the indicated measure of governance on log per capitaGDP at purchasing power parity (PPP) in 1995. The final column reports the p value associated with a signtest of the hypothesis that the proportions of countries in Latin America and the Caribbean falling above andbelow the regression line are equal.
This paper provides an interpretation of the strong positive correlation between governance and
per capita income shown in figure 1. The following section describes how we constructed the governance
indicators for 2000-01 used in figure I as part of an ongoing project to measure governance worldwide,
drawing on a wide variety of sources of data on perceptions of governance and a consistent aggregation
methodology. In addition to allowing us to construct a set of governance indicators covering a very large
sample of countries, our methodology allows the construction of measures of the precision of these
governance indicators. As we have found in previous work, the standard errors associated with estimates
of governance are large relative to the units in which governance is measured, suggesting that simple
country rankings can be misleading and underscoring the need for caution in making precise comparisons
of the quality of governance across countries using this type of data.
The next section turns to an interpretation of the positive correlations between per capita income
and governance presented in figure 1. This correlation can, in principle, reflect some combination of (a)
causal effects running from better governance to higher per capita income, (b) reverse causation or
feedback from higher per capita income to better governance, and (c) omitted variables which improve
both governance and per capita income. A recent body of literature identifies large causal effects running
from governance to per capita income, using deep historical determinants of institutional quality as
3

instruments. Our contribution is to provide evidence on the feedback from incomes to governance, which
is important for a variety of reasons. First, it sheds light on the often-heard argument that good
governance is a luxury that only rich countries can afford. More practically, because aid is increasingly
allocated based on the quality of governance, understanding the effects of income on governance is
important for determining whether poor countries should receive special treatment in such allocation
rules. Finally, understanding the extent of feedback from per capita income to governance is crucial for
interpreting the governance performance of countries in Latin America and the Caribbean documented in
figure 1.
Despite its importance, this channel of reverse causation has not been subject to much empirical
scrutiny, at least partly because the required convincing instruments for per capita income in a cross
section of countries are very scarce. Our identification strategy, however, relies not on success in the
search for such elusive instruments, but on the use of nonsample information. In particular, we show that
the information on the precision or accuracy of our governance indicators and some judicious
assumptions regarding the extent of measurement error in per capita income and the importance of
omitted variables are sufficient to identify the causal effects running from per capita income to
governance.
Based on this empirical strategy, our rather surprising finding in this section is a lack of evidence
on a positive effect of incomes on the quality of governance. Using our estimates of the (substantial)
imprecision of the governance indicators, we find that the data are consistent with a strong negative
feedback from per capita income to governance. The assumptions required to negate such results are
unrealistic: the only way that it would be possible to identify positive feedback from per capita income to
governance is to assume that either measurement error in governance is implausibly large or important
omitted variables are driving per capita income and governance in opposite directions. This fnding of
negative feedback from incomes to governance implies that without other interventions, higher incomes
do not guarantee improved governance.
The empirical framework we use to identify the causal effects running from governance to
income and vice versa is designed to capture effects in the very long run. As a result, our finding of
negative feedback cannot be interpreted as implying that rapid growth over relatively short periods such
as a decade should be associated with declines in governance. Nor can it be interpreted as implying that
other shocks that are associated with temporarily higher growth should be associated with a deterioration
in governance. Similarly, factors that are good for growth in the long run will not be negatively correlated
with institutional quality, since most such variables are likely to have substantial direct positive effects on
governance that outweigh any negative feedback effects through income. Finally, the finding of negative
feedback from incomes to governance does not imply a negative unconditional correlation between these
4

two variables, since this correlation is dominated by the strong positive effects of governance on per
capita income.
What, then, should we make of this finding of negative feedback? We underscore two
implications. The first is rather obvious: negative feedback implies that improvements in institutional
quality or governance are unlikely to occur merely as a consequence of economic development. It is
important not to exaggerate the conventional wisdom that as countries become richer, higher incomes
lead to demands for better institutional quality. The second follows from the first: in the absence of
positive feedback, we should not expect to see virtuous circles from higher incomes to better institutions,
which in turn support higher incomes in the very long run. This is, perhaps, not too surprising. It is not
hard to think of a variety of reasons why entrenched elites in a country benefit from the status quo of
misgovernance and can successfully resist demands for change even as incomes rise over very long
periods of time. In the last section of the paper, we use recent evidence gathered through detailed
governance diagnostic surveys at the country level to cast light on a mechanism through which influential
elites can resist demands for improvement in govemance-namely, the phenomenon of state capture. We
then discuss the implications of this state capture hypothesis for strategies to improve governance.
MEASURING GOVERNANCE
This section summarizes our earlier work, in which we organize a large set of indicators of
perceptions of govemance into six clusters corresponding to six basic dimensions of governance.' We
then describe the data sources and explain our methodology for combining the many indicators within
each cluster into six aggregate governance indicators.
Governance Clusters
We construct six aggregate governance indicators, motivated by a broad definition of governance
as the traditions and institutions by which authority is exercised in a country. This includes the process by
which govemments are selected, monitored, and replaced; the capacity of the goverrnent to effectively
formulate and implement sound policies; and the respect of citizens and the state for the institutions that
govern economic and social interactions among them. This classification of indicators into clusters
corresponding to this definition of governance is not intended to be definitive. Rather, it reflects our own
1. Kaufmann, Kraay, and Zoido-Lobat6n (1999a, 1999b, 2002).
5

views of what constitutes a useful and interesting organization of the data that is consistent with
prevailing notions of governance.
The first two governance clusters are intended to capture the first part of our definition of
governance: the process by which those in authority are selected and replaced. We refer to the first of
these as voice and accountability; it includes a number of indicators measuring various aspects of the
political process, civil liberties, and political rights. These indicators measure the extent to which citizens
of a country are able to participate in the selection of governments. This category also encompasses
indicators measuring the independence of the media, which serves an important role in monitoring those
in authority and holding them accountable for their actions. The second governance cluster is labeled
political stability. This index combines several indicators that measure perceptions of the likelihood that
the government in power will be destabilized or overthrown by possibly unconstitutional or violent
means, including terrorism. This index captures the idea that the quality of governance in a country is
compromised by the likelihood of wrenching changes in government, which not only has a direct effect
on the continuity of policies, but also undermines the ability of all citizens to peacefully select and replace
those in power.
The next two clusters summarize various indicators of the government's ability to formulate and
implement sound policies. In government effectiveness, we combine perceptions of the quality of public
service provision, the quality of the bureaucracy, the competence of civil servants, the independence of
the civil service from political pressures, and the credibility of the government's commitment to policies.
The main focus of this index is on the inputs required for the government to be able to produce and
implement good policies and deliver public goods. The second cluster, which we call regulatory quality,
is more focused on the policies themselves. It includes measures of the incidence of market-unfriendly
policies such as price controls or inadequate bank supervision, as well as perceptions of the burdens
imposed by excessive regulation in areas such as foreign trade and business development.
The last two clusters summarize in broad terms the respect of citizens and the state for the
institutions that govern their interactions. In rule of law, we include several indicators that measure the
extent to which agents have confidence in and abide by the rules of society. These include perceptions of
the incidence of both violent and nonviolent crime, the effectiveness and predictability of the judiciary,
and the enforceability of contracts. Together, these indicators measure a society's success in developing
an environment in which fair and predictable rules form the basis for economic and social interactions.
The final cluster, control of corruption, measures perceptions of corruption, conventionally defined as the
exercise of public power for private gain. Despite this straightforward focus, the particular aspect of
corruption measured by the various sources differs somewhat, ranging from the frequency of having to
make additional payments to get things done, to the effects of corruption on the business environment, to
6

measuring grand corruption in the political arena or in the tendency of elites to engage in state capture.
The presence of corruption is often a manifestation of a lack of respect on the part of both the corrupter
(typically a private citizen or firm) and the corrupted (typically a public official) for the rules that govern
their interactions. It thus represents a failure of governance according to our definition.
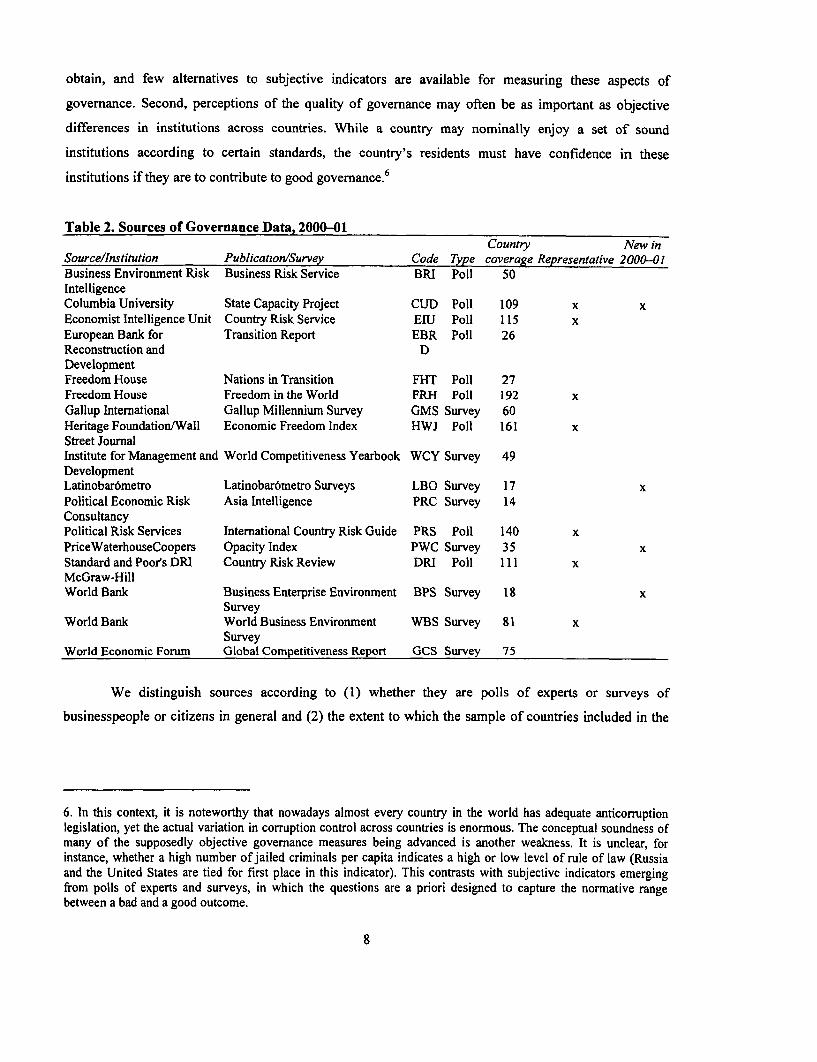
Sources of Governance Data
This section describes the set of governance measures used to construct our six composite
governance indicators for 2000-01. We rely on 194 different measures drawn from seventeen different
sources of subjective governance data constructed by fifteen different organizations, as listed in table 2.
These sources include international organizations, political and business risk rating agencies, think tanks,
and nongovernmental organizations.2 Four of these sources are included in the 2000-01 index for the first
time, and the remaining are updates of sources included in the 1997-98 indicators.3 In this section, we
provide an overview of some of the key features of these sources. A previous paper presents a detailed
description of each of the sources.4
We focus on a set of indicators that measures subjective perceptions regarding the quality of
governance across countries. We do not attempt to compile or present the wide array of available
quantitative and descriptive data on cross-country differences in political and social institutions.5 While
these are certainly important determinants of the cross-country differences in the quality of governance,
our focus centers on measuring the reporting of various stakeholders-residents of a country,
entrepreneurs, foreign investors, and civil society at large-regarding the quality of governance in a
country. This kind of data is inherently subjective, but it is useful for at least two reasons. First, for many
issues such as the prevalence of corruption, objective data are almost by definition extremely difficult to
2. For access to the full data set of governance indicators, background papers, and detailed explanations on itssources, visit www.worldbank.org/wbi/governance/govdata2001.htm.3. Two of the sources we consider updates of existing sources are, in fact, new surveys that include questions similarto those in their previous incarnations. These are the World Bank's World Business Environment Survey, which is afollow-up to the 1997 World Development Report Survey, and the Gallup Millennium Survey, which we treat as afollow-up to the Gallup 50th Anniversary Survey included in our previous paper. Sources also overlap somewhat. Aportion of the World Bank's Business and Enterprise Environment Survey (BPS, seewww.worldbank.org/wbi/governance/beepsinteractive.htm) was used in the World Business Environment Survey;we refer to the former as a distinct source only when we use questions that appear only in that survey. Also, in 1997we used data from the Global Competitiveness Survey for Africa as a separate source. In 2000, with the exception ofthe questions on state capture for transition economies, its questionnaire coincided with that of the World BusinessEnvironment Survey, so we include it in the latter source. Finally, one source we used in 1997-98 is no longerpublished (Central European Economic Review), such that we are unable to update this source.4. Kaufmann, Kraay, and Zoido-Lobat6n (2002, appendix 1).5. See for example Beck and others (2001) for a compilation of objective indicators of political systems acrosscountries.
7
obtain, and few alternatives to subjective indicators are available for measuring these aspects of
governance. Second, perceptions of the quality of governance may often be as important as objective
differences in institutions across countries. While a country may nominally enjoy a set of sound
institutions according to certain standards, the country's residents must have confidence in these
institutions if they are to contribute to good governance. 6
Table 2. Sources of Governance Data, 2000-01Country New in
Source/Institution Publication/Survey Code Type coverage Representative 2000-01Business Environment Risk Business Risk Service BRI Poll 50IntelligenceColumbia University State Capacity Project CUD Poll 109 x xEconomist Intelligence Unit Country Risk Service EIU Poll 115 xEuropean Bank for Transition Report EBR Poll 26Reconstruction and DDevelopmentFreedom House Nations in Transition FHT Poll 27Freedom House Freedom in the World FRH Poll 192 xGallup International Gallup Millennium Survey GMS Survey 60Heritage Foundation/Wall Economic Freedom Index HWJ Poll 161 xStreet JournalInstitute for Management and World Competitiveness Yearbook WCY Survey 49DevelopmentLatinobar6metro Latinobar6metro Surveys LBO Survey 17 xPolitical Economic Risk Asia Intelligence PRC Survey 14ConsultancyPolitical Risk Services International Country Risk Guide PRS Poll 140 xPriceWaterhouseCoopers Opacity Index PWC Survey 35 xStandard and Poor's DRI Country Risk Review DRI Poll 111 xMcGraw-HillWorld Bank Business Enterprise Environment BPS Survey 18 x
SurveyWorld Bank World Business Environment WBS Survey 81 x
SurveyWorld Economic Forum Global Competitiveness Report GCS Survey 75
We distinguish sources according to (I) whether they are polls of experts or surveys of
businesspeople or citizens in general and (2) the extent to which the sample of countries included in the
6. In this context, it is noteworthy that nowadays almost every country in the world has adequate anticorruptionlegislation, yet the actual variation in corruption control across countries is enormous. The conceptual soundness ofmany of the supposedly objective governance measures being advanced is another weakness. It is unclear, forinstance, whether a high number of jailed criminals per capita indicates a high or low level of rule of law (Russiaand the United States are tied for first place in this indicator). This contrasts with subjective indicators emergingfrom polls of experts and surveys, in which the questions are a priori designed to capture the normative rangebetween a bad and a good outcome.
8

sources is representative of the world as a whole. 7 These two types of sources of governance data have
their advantages and disadvantages. The main advantage of polls of experts is that they are explicitly
designed for cross-country comparability, and considerable effort is placed in the benchmarking process
that ensures this. The difficulties with such measures are also clear, however. They are typically based on
the opinions of only a few experts per country, and the quality of the country ratings depends to a great
extent on the knowledge of experts regarding the countries they are assessing. The ratings are particularly
prone to two types of feedback: countries with good economic outcomes may be more likely to receive
favorable ratings, and country rankings by other organizations are frequently included as an input into the
rating process of each organization. Country ratings may also be affected by the political or ideological
agenda of the organization producing the ratings. Despite these difficulties, there are at least two reasons
to think that, on average, such sources provide valuable information on governance. First, the indicators
produced by such organizations generally correlate strongly with measures based on surveys of residents
and entrepreneurs. Second, the fact that commercial rating organizations are consistently able to sell their
assessments to commercial subscribers for considerable fees suggests that these sources are producing
useful information.
The main advantage of surveys is that they reflect the opinions of a larger number of respondents
who are more closely connected with the countries they are assessing. Nevertheless, they suffer from two
disadvantages. First, survey questions can be interpreted in context- or culture-specific ways. For
example, a response regarding the prevalence of "improper practices" is colored by country-specific
perceptions of what is improper. This will hinder the cross-country comparability of responses to
otherwise identical questions. Second, cross-country surveys relating to governance are very costly to
design and implement, and as a result they typically cover a much smaller set of countries than polls of
experts.
Sources of governance data also vary with respect to the sample of countries they cover. A
number of sources cover a very large sample of developed and developing countries, while in others the
sample of countries is very narrowly focused. Furthermore, many of the poorest and smallest countries in
the world are not covered by commercially oriented polls because they are relatively unattractive to
foreign investors. Since there is a strong positive association across countries between governance and per
capita income, this difference between sources makes it difficult to compare indicators from sources that
7. In the 1997-98 version of the governance database, our sources consisted of eight polls of experts and sevensurveys, and five of our sources were classified as representative. In the 2000-01 version, we have added two newsurveys-namely, the World Bank's Business Environment and Enterprise Performance Survey of firms intransition economies (BEEPS) and Latinobar6metro (LBO), a private survey conducted in seventeen LatinAmerican countries-and two new polls of experts-the Columbia University State Capacity Study (CUD),covering 109 countries worldwide, and the PriceWaterhouseCoopers Opacity Index, covering thirty-five countries.
9

cover sets of countries with very different income levels. Similarly, regional differences in governance
may hamper comparisons across sources. For example, it is not clear how to compare a governance rating
based only on transition economies with one based on a broad set of countries. As discussed in a previous
paper, the methodology we use to construct aggregate govemance indicators takes these differences in
country coverage into account, as the data from individual sources are transformed into common units for
aggregation across sources.8 This results in a set of aggregate governance indicators covering a very large
cross section of countries, ranging from 159 to 173 depending on the measure of governance.
Aggregation Methodology
Implicit in our organization of the data is the view that within each cluster, the indicators measure
a similar underlying basic concept of governance. Combining these related indicators into an aggregate
governance indicator for each cluster offers considerable benefits. First, the aggregate indicators span a
much larger set of countries than any individual source, permitting comparisons of governance across a
broader set of countries than would be possible using any single source. Second, aggregate indicators can
provide more precise measures of governance than individual indicators. Third, it is possible to construct
quantitative measures of the precision of both the aggregate governance estimates for each country and
their components. This allows formal testing of hypotheses regarding cross-country differences in
governance. We also use the information on the precision of the governance indicators to help identify the
effects of income on governance.
For each cluster, we combine the component indicators into an aggregate governance indicator
using the same methodology with which we calculated our first set of indicators.9 We use an extension of
the standard unobserved components model, which expresses the observed data in each cluster as a linear
function of the unobserved common component of governance, plus a disturbance term capturing
perception errors and sampling variation in each indicator.10 In particular, we assume that we can write
the observed score of countryj on indicator k, yj, k), as a linear function of unobserved governance, g(f),
and a disturbance term, E(j, k), as follows:
(1) {j,k)=a(k)+ (k} [g()+ E(j,k)k
where a(k) and 0(k) are unknown parameters that map unobserved governance, g(j), into the observed
data, y(j, k). As a choice of units, we assume that g(Q) is a random variable with mean zero and variance
8. Kaufmann, Kraay, and Zoido-Lobat6n (1999a).9. This methodology is documented in detail in Kaufinann, Kraay, and Zoido-Lobat6n (1999a).10. Unobserved components models were pioneered in economics by Goldberger (1972); the closely relatedhierarchical and empirical Bayes models in statistics were developed by Efron and Morris (1971, 1972).
10

one. We further assume that the error term has zero mean and a variance that is the same across countries,
but differs across indicators, that is, E[( j,k)2]= c.(k).
The disturbance term, &(/, k), captures two sources of uncertainty in the relationship between true
governance and the observed indicators. First, the particular aspect of governance covered by indicator k
is imperfectly measured in each country, reflecting either perception errors on the part of experts (in the
case of polls of experts) or sampling variation (in the case of surveys of citizens or entrepreneurs).
Second, the relationship between the particular concept measured by indicator k and the corresponding
broader aspect of governance may be imperfect. For example, even if the particular aspect of graft
covered by some indicator k (such as the prevalence of improper practices) is perfectly measured, it may
be a noisy indicator of graft if countries exhibit differences in the perceived nature of improper practices.
Both of these sources of uncertainty are reflected in the indicator-specific variance of the error term,
a 2(k).
Given estimates of the model's parameters, a(k), 3(k), and a(k), we can compute estimates of
governance for each country, as well as measures of the precision of these estimates. Formally, the
estimate of governance for a country produced by the unobserved components model is the mean of the
distribution of unobserved governance conditional on the K(j) observed data points for that country. This
conditional mean is the following weighted average of appropriately rescaled scores of each of the
component indicators:
y (i,k -_a (k)(2) E>(J) y(ij4)...y[ijK(i)} w(k) ()
where the weights applied to each source k, w(k)= )2 are inversely proportional to theK() 2
h=t
variance of the error term of that source. We also report the standard deviation of this conditional
distribution as an indicator of the confidence we can have in this estimate, which is
(3) SD tQ) l(ij,1)...,y[i,K(j)]= '1+ ta(k)j
This standard deviation is declining in the number of individual indicators in which a particular country
appears, and it is increasing in the variance of the disturbance term on each of these indicators.
The assumptions of the unobserved components model ensure that the distribution of governance
in each country is normal, conditional on the data for that country. Therefore, these conditional means and
standard deviations for each country have a natural interpretation. For example, a useful interpretation of
11

the reported estimates and standard deviations for each country is to note that there is a 90 percent
probability that the "true" level of governance in a country is in an interval of plus or minus 1.64 times
the reported standard deviation centered on the point estimate itself. We refer to such a range as a 90
percent confidence interval around the estimate of governance for a country."H
Implementing this approach requires estimates of all the unknown survey-specific parameters,
a(k), 0(k), and cy (k). We do this in a two-stage procedure. First, we assume that governance and the error
terms in equation I are jointly normally distributed, and we apply maximum likelihood methods using
only the representative sources to retrieve the parameters of interest for each governance cluster. This is
nothing more than a standard application of the unobserved components model. We cannot, however,
include our many nonrepresentative sources in the first stage of the estimation procedure, because the
distribution of unobserved governance in the subset of countries covered by these surveys is unlikely to
be the same as that for the world as a whole, causing the maximum likelihood procedure to break down.
Instead, in the second stage we use the initial governance estimates obtained from the representative
sources as an observable proxy for governance. We obtain the parameters of interest for the
nonrepresentative sources by regressing these indicators on observable governance, that is, by directly
estimating equation 1.12 We then use all the estimated parameters of the unobserved components model to
construct a final set of governance estimates.
Our choice of units for governance ensures that the estimates of governance have a mean of zero
and a standard deviation of one.'3 Since we adopt the same choice of units for governance in each period,
the indicators are not informative about a worldwide average trend in governance, although they are
informative about how countries' relative positions change over time. The aggregate indicators are
oriented such that higher values correspond to better governance outcomes. Appendix 2 reports the point
estimates of governance, the estimated standard errors, and the number of sources by country for each of
six governance indicators in 2000-01. For reference, the corresponding information for the 1997-98
indicators is reported, as well, in the same table.
As emphasized in our previous work, we find that the six dimensions of governance are not very
precisely measured, in the sense that the measured standard deviations are large relative to the units in
11. This is a slight abuse of terminology, since these are not confidence intervals in the usual frequentist sense of astochastically varying interval centered around a fixed unknown parameter. Rather, we treat governance as a randomvariable, and the 90 percent confidence interval is simply the fifth and ninety-fifth percentiles of the conditionaldistribution of governance given the observed data.12. To get consistent estimates of the parameters of the nonrepresentative sources, we need to adjust for attenuationbias caused by the fact that our observable proxy for governance is a noisy indicator of true governance. Fortunately,we can use the information on the standard errors associated with the governance estimates obtained in the firststage to do this.
12

which governance is measured. Figure 2 illustrates this point using the rule of law indicator. We list
countries in ascending order according to their point estimates of govemance on the horizontal axis, and
on the vertical axis we plot the governance estimate and the associated 90 percent confidence interval
described above. The size of the confidence intervals varies across countries, as different countries appear
in different numbers of sources with different variances. The resulting confidence intervals are large
relative to the units in which governance is measured. To emphasize this point, the horizontal lines in
figure 2 delineate the quartiles of the distribution of governance estimates. While the differences between
countries in the bottom and top quartiles are significant, relatively few countries have 90 percent
confidence intervals that lie entirely within a given quartile.
It is clear from the figure that many of the small differences in governance estimates across
countries are not likely to be statistically significant. For many applications, therefore, it is more useful to
focus on the range of possible governance values for each country (as summarized in the 90 percent
confidence intervals shown in figure 2) rather than merely observing the point estimates. The differences
in governance are clearly significant between two countries that lie at opposite ends of the governance
scale and whose 90 percent confidence intervals do not overlap. One should be much more circumspect
about the significance of estimated differences in governance between two countries that lie closer
together and whose 90 percent confidence intervals overlap (which can also be seen in figure 2). The
same is true for changes over time in the governance indicator. To illustrate this, figure 2 also plots the
1997-98 estimate for each country (as a solid dot). For most countries, the 90 percent confidence interval
around the 2000-01 score also encompasses the governance estimate for 1997-98. This emphasizes that
many (though not all) of the changes over time in our governance indicators over this very short term are
unlikely to be statistically significant at conventional levels.14
In a recent paper, we provide a more detailed analysis of the sources of the changes over time in
our governance indicators." Mechanically, changes over time in the governance indicators are due to a
combination of three factors: changes in governance perceptions as reported by the individual underlying
sources; changes in the weights that the aggregation procedure assigns to the individual underlying
sources; and changes in the set of underlying sources used to construct the aggregate governance
indicators. For four of our six indicators, we find that changes in the country ratings of underlying sources
account for more than three-quarters of the variance in changes over time in observed governance.
However, for the rule of law and control of corruption indicators, we find that roughly half of the variance
13. Since the estimates of governance are normally distributed, this implies that the vast majority of observationswill fall between -2.5 and 2.5.14. Kaufmann, Kraay, and Zoido-Lobat6n (2002) discusses in more detail the interpretation of changes over time inthe governance estimates.15. Kaufmnann, Kraay, and Zoido-Lobat6n (2002).
13

of changes over time stems from changes in weights assigned by the aggregation procedure, as well as
from changes over time in the available sources for individual countries. This points to a further reason
for caution in interpreting changes over time in these governance indicators.
CAUSATION FROM GOVERNANCE TO INCOME AND FROM INCOME TO GOVERNANCE
In this section, we present an empirical framework that allows us to identify causal effects
running in both directions between governance and per capita income. A rapidly growing literature
identifies the causation from better governance to higher per capita income. Our contribution here is to
propose a strategy of using nonsample information to identify causation in the opposite direction, from
per capita income to governance. When we implement this strategy, we find no evidence of positive
feedback from higher per capita income to better governance outcomes, unless we make rather
implausible assumptions on this nonsample information.
Identifying Causal Effects
Several papers identify the causal effects running from better governance to higher per capita
income in the very long run, using instrumental variables (IV) regressions on a cross section of
countries.16 Underlying all these papers is the following empirical model:
(4) y, = ac + P g, + ej,
(5) g,= i+y y,+ 6 x,+u,,
(6) y; = y, + w, and
(7) g; = g., + u, .
Equation 4 says that log per capita income, y, depends on govemance, g, and other factors outside
this very parsimonious specification, e. Under the assumptions that initial incomes in the distant past are
not too different across countries and that governance does not change too much over time (so that current
observed levels of governance are a reasonable proxy for their "initial" values), equation 4 can be
interpreted as capturing the effects of governance on growth in the very long run.
Equation 5 says that governance depends on incomes, some other observed variable, x, and other
factors outside the model, v. The dependence of governance on incomes could be interpreted as reflecting
a demand for better formal institutions in richer and more complex environments. Institutional quality
16. Hall and Jones (1999); Kaufmann, Kraay, and Zoido-Lobat6n (1999b); Acemoglu, Johnson, and Robinson(2001); Easterly and Levine (2002).
14

also depends on a variety of other factors included in x; as discussed below, cross-country variation in
such variables allows identification of the effects of governance on incomes in equation 4. Finally,
equations 6 and 7 simply state that observed income, y*, and observed governance, g*, are noisy
measures of actual income and governance, with measurement error w and u, respectively.
To complete the description of the model, we assume that the disturbances have zero mean and
variances o2, i = e, v, u, w. We also assume that measurement error is classical in the sense that w and u
are uncorrelated with e, v, and x. We also assume that the omitted variables in equation 5 are uncorrelated
with x, but they may be correlated with the omitted variables in equation 4, that is, E[e.v]=p.ae.av. This
captures the possibility that there may be other variables outside the simple model that affect both
governance and per capita income. Finally, we assume that the error term in equation 4 is uncorrelated
with x, which allows us to use x as an instrument to estimate equation 4.
Existing papers focus primarily on finding the magnitude of the effect of governance on per
capita income, that is, ,B. This can be done by estimating equation 4 by instrumental variables, using x as
an instrument. The search for good instruments has led many researchers in the direction of deep
historical determinants of institutions. For example, Acemoglu, Johnson, and Robinson use settler
mortality in the eighteenth and nineteenth centuries as instruments, arguing that colonial powers had weak
incentives to establish the institutions of good governance in colonies where a permanent European
presence was unlikely to take root.17 This is essentially a nuanced interpretation of the simple instruments
for colonial origin proposed by Hall and Jones." Another strand of the literature emphasizes the
importance of natural resource endowments in determining the development of good institutions, and
Easterly and Levine provide a recent cross-country empirical implementation of this view.' 9
In view of the popularity of such historically motivated instruments, we often use the shorthand
of referring to x as "history." These papers go to considerable lengths to justify the assumption that x is a
valid instrument in the sense that it is strongly correlated with governance and is uncorrelated with the
error term in equation 4. We do not repeat their arguments here, but simply proceed under the assumption
that this is a reasonable instrumentation strategy. We refer the reader to these other papers for detai'-.
Our contribution in this section is to focus on equation 5, which tells us about the feedback from
higher incomes to better governance, y. This is obviously relevant for policy. For example, when
allocating aid, should multilaterals give poor countries a misgovernance discount, based, in part, on the
quality of their institutions? Does development itself bring about improvements in governance without
direct interventions to help build institutions? More crudely, is good governance a luxury that only richer
17. Acemoglu, Johnson, and Robinson (2001).18. Hall and Jones (1999).
15

countries can afford? Finally, identifying y is useful because it allows us to understand the relative
importance of history versus income in determining observed levels of governance today.
In principle, one can estimate equation 5 given a suitable instrument, that is, a variable that
belongs in equation 4 but not in equation 5. This is hard to do in practice, however, since it is difficult to
identify very convincing instruments for income, that is, variables that are correlated with income but
have no effects on governance other than through their effects on income. Many of the likely deep
determinants of long-run cross-country income differences, such as favorable geographical location, good
natural resource endowments, temperate climates, or colonial history, plausibly exert a direct effect on
institutional quality as well, disqualifying such variables as instruments in this application.
Instead of searching for instruments for income, we adopt the other (but less commonly used)
textbook solution to the problem of identification: namely, the use of nonsample information. To identify
the effects of income on governance, that is, y in equation 5, we need to come up with three pieces of
nonsample information-the variance of measurement error in incomes and governance (a2 and 52),
and the correlation between the error terms in equations 4 and 5, p. As we discuss below, our assumptions
about measurement error in per capita income will not matter much for the results. This means that we
only need to come up with two additional pieces of information in order to identify the model in
equations 4 through 7. Our strategy is to use our estimates of the standard errors associated with the
governance indicators to pin down the measurement error in governance, and then to consider a range of
plausible values for the correlation between the error terms in the two structural equations. With these two
nonsample pieces of information in hand, we have a system of equations linking the parameters of the
model with the observed sample moments in the data, which we can solve for the remaining parameters of
interest.20 We provide details of the identification procedure in Appendix 1.
To develop some intuitions for the role of our assumptions about these two key parameters, we
note that all the papers mentioned above find that the instrumented estimates of the effects of governance
on per capita income in equation 4 are larger than the OLS estimates of the same equation. With some
manipulation of equations 4 through 7, one can show that this implies that
(8) y +p- I 'l < -( -Y O) (S(8 e
19. Engerman and Sokoloff(1997, in this volume), Easterly and Levine (2002).20. Both Hall and Jones (1999) and Acemoglu, Johnson, and Robinson (2001) use the difference between their OLSand IV estimates to make inferences about the importance of measurement error in govemance. Since we have directestimates of this measurement error, we can go one step further and use this information to estimate the feedbackfrom per capita income to governance.
16

Suppose that there is no measurement error in governance, that is, c,. = 0, so that the right-hand
side of equations 8 is zero. Then the only way there can be positive feedback from incomes to
governance, that is, y > 0, is if there are omitted variables in equations 4 and 5 that move income and
governance in opposite directions, that is, p < 0.
In the absence of such variables, the only other way that there can be positive feedback from
incomes to governance is if there is substantial measurement error in governance, a,, > 0. In this case, the
IV estimates are larger than the OLS estimates simply because they are eliminating the usual attenuation
bias caused by measurement error in the dependent variable. 2 ' The key question is whether there is
enough measurement error in the data to allow for the possibility of positive feedback from per capita
income to governance, that is, y > 0. We investigate this question in the remainder of this section.
Results
To implement this exercise, we begin by estimating equation 4. We measure per capita income
using real per capita gross domestic product (GDP) from the Summers and Heston Penn World Tables,
version 5.6, which we extend into the 1990s using constant local currency growth rates. We measure
governance using the rule of law index discussed in the previous section. We focus on this particular
dimension of governance for two reasons. First, it corresponds most closely to the concept of protection
of property rights that has been widely used in this literature. Second, as discussed in the introduction,
this is one of the dimensions of governance for which simple OLS regressions suggest that countries in
Latin America appear to do relatively poorly given their per capita incomes. Since rule of law is highly
correlated with both corruption and government effectiveness, we can view this one dimension of
governance as representative of the broader areas in which the quality of governance appears relatively
poor in Latin America and the Caribbean.
Our preferred instrument for governance is the settler mortality measure introduced by
Acemoglu, Johnson, and Robinson. 22 While it is only available for sixty-eight countries, empirically it is
strongly correlated with both tropical location (as measured by distance from the equator) and colonial
origins (as measured by the fractions of the population speaking English or a major European language).
To expand the size of the sample, we use these last three variables to impute the missing values of settler
mortality for all of the countries for which we have data on per capita income and governance. This
results in a sample of 153 countries for which we have data on y, g, and x. We do, however, obtain similar
21. Throughout, we assume that the stability condition, y* -3 < 1, holds.22. Acemoglu, Johnson, and Robinson (2001).
17

results if we restrict attention to the smaller sample of sixty-eight countries for which the original settler
mortality instrument is available, or if we use the linguistic origins variables directly as instruments, as do
Hall and Jones.23
Table 3 reports the OLS and IV estimates of equation 4, together with the corresponding first-
stage regression of governance on the instrument. Consistent with the existing literature discussed above,
we find a strong causal effect running from governance to per capita income. The estimated coefficient of
1.37 implies that a one-standard-deviation improvement in the governance measure raises per capita
income nearly fourfold in the very long run. We also find the same phenomenon in the literature, in which
the instrumented estimate of the coefficient on per capita income is substantially larger than the OLS
estimate of 0.999.24
Table 3. Regression Results on Determinants of Income per CapitaaRegressors OLS IV First-stageIntercept 7.867 7.845 2.445
(0.051) (0.058) (0.284)Governance (Rule of Law) 0.999 1.370
(0.055) (0.095)Imputed settler mortality -0.547
(0.064)Standard deviation (residuals) 0.630 0.820 0.741Summary statisticNo. of observations 153 153 153R' 0.69 0.69 0.37a. This table summarizes the results of estimating Equation 4 by OLS and IV (columns I and 2) and the correspondingfirst-stage regression (column 3) The dependent variable in the OLS and IV estimations is In(per capita GDP); in the first-stage regression it is governance. Standard errors are in parentheses
Although this paper focuses on the rule of law indicator, the pattern of substantially larger IV
estimates relative to their OLS counterparts consistently holds across all six governance indicators. Table
4 reports the OLS and IV estimates of the slope coefficient in equation 4, using the five other measures of
governance and the same settler mortality variable as an instrument. Since we do not have distinct
instruments for each of the six dimensions of governance, we cannot interpret the results in tables 3 and 4
as capturing the partial effects of each of these variables. However, to the extent that each of these is a
proxy for some broad notion of governance, these estimates can be interpreted as providing a range of
23. Hall and Jones (1999).24. Interestingly, the bivariate scatterplot of rule of law against log per capita income visually suggests a nonlineareffect of governance on per capita income, with a weaker effect (that is, a lower slope) in poor countries than in richcountries. While this is qualitatively true, we did not find this nonlinearity to be statistically significant. Moreover,given our pattern of IV estimates that are larger than OLS estimates, and given the weaker performance of theinstrument in the first-stage regression for the poorest half of the sample, we also cannot discount the possibility thatthe difference in slopes in the two samples is simply driven by the problem of weak instruments (which would biasthe IV estimates toward the OLS estimates in the poor country sample).
18

estimates of the effect of governance broadly construed on per capita income in the very long run. We
return to this point in more detail below.
Table 4. Regression Results Using Other Dimensions of GovernanceaRegressors OLS IV No. observationsVoice and accountability 0.806 1.495 158
(0.074) (0.151)Political stability 0.951 1.546 146
(0.068) (0.156)Government effectiveness 0.978 1.389 144
(0.058) (0.121)Regulatory quality 0.966 2.242 152
(0.084) (0.301)Control of corruption 0.920 1.412 145
(0.063) (0.139)a. This table summarizes the results of estimating equation 4 by OLS and IV for five other dimensions of governance.For reasons of space, only the estimated slope coefficients and the number of observations are reported. The dependentvariable is ln(per capita GDP). Standard errors are in parentheses.
Figure 3 plots the estimated effects of governance on per capita income (in the top panel) and the
first-stage regression (in the bottom panel), with countries in Latin America and the Caribbean
highlighted and labeled. When considering this causal channel from governance to per capita income, the
striking feature among the Latin American and Caribbean countries is that the majority of them lie above
the instrumented regression line. In fact, we find only six out of twenty-six countries below the regression
line (namely, Chile, Uruguay, Belize, Costa Rica, Guyana, and the Dominican Republic). One
interpretation of this is that most countries in Latin America and the Caribbean have been surprisingly
successful in raising living standards without the benefit of good governance. A less optimistic
interpretation is that the (relatively) high income levels observed in many countries in Latin America and
the Caribbean are inherently fragile because they are unsupported by sound institutions.25
The bottom panel of figure 3 illustrates where countries in Latin America and the Caribbean fall
in the first-stage regression of govemance on history. Countries in the region are clustered surprisingly
tightly around the middle of the distribution of (in some cases imputed) settler mortality. Only four
countries stand out as having particularly inhospitable climates for settlers-Jamaica, Haiti, Panama, and
Nicaragua. Moreover, countries in Latin America and the Caribbean are scattered quite evenly above and
below the first-stage regression line, suggesting that the effect of history on current institutions is not
25. This interpretation is consistent with both anecdotal and more systematic evidence that countries that are hit bylarge adverse shocks suffer disproportionately more if the quality of their institutions is poor. See, for example,Boone and others (2000), who argue that declines in asset prices during the Asian crisis were larger in countries withweak corporate governance. More systematically, Rodrik (1999) shows that countries lacking institutions to managesocial conflict suffered deeper declines in output in response to the oil shocks of the 1970s.
19
significantly different in Latin America and the Caribbean relative to the rest of the world. Taken
together, these two observations suggest that "bad history" alone cannot account for the relatively low
rule of law ratings for countries in Latin America and the Caribbean that we noted in the introduction.26
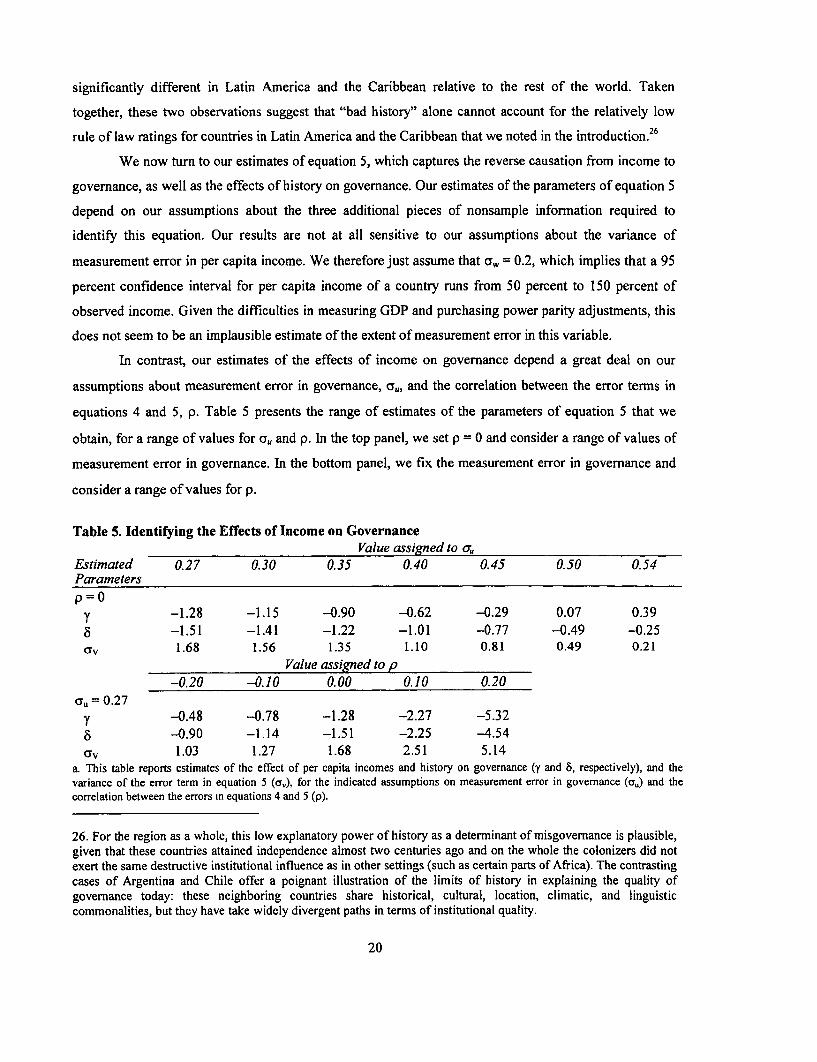
We now turn to our estimates of equation 5, which captures the reverse causation from income to
governance, as well as the effects of history on governance. Our estimates of the parameters of equation 5
depend on our assumptions about the three additional pieces of nonsample information required to
identify this equation. Our results are not at all sensitive to our assumptions about the variance of
measurement error in per capita income. We therefore just assume that cow = 0.2, which implies that a 95
percent confidence interval for per capita income of a country runs from 50 percent to 150 percent of
observed income. Given the difficulties in measuring GDP and purchasing power parity adjustments, this
does not seem to be an implausible estimate of the extent of measurement error in this variable.
In contrast, our estimates of the effects of income on governance depend a great deal on our
assumptions about measurement error in governance, a,,, and the correlation between the error terms in
equations 4 and 5, p. Table 5 presents the range of estimates of the parameters of equation 5 that we
obtain, for a range of values for c,, and p. In the top panel, we set p = 0 and consider a range of values of
measurement error in governance. In the bottom panel, we fix the measurement error in governance and
consider a range of values for p.
Table 5. Identifying the Effects of Income on GovernanceValue assigned to au
Estimated 0.27 0.30 0.35 0.40 0.45 0.50 0.54Parametersp=O
y -1.28 -1.15 -0.90 -0.62 -0.29 0.07 0.395 -1.51 -1.41 -1.22 -1.01 -0.77 -0.49 -0.25cIV 1.68 1.56 1.35 1.10 0.81 0.49 0.21
Value assigned to p-0.20 -0.10 0.00 0.10 0.20
0.27y -0.48 -0.78 -1.28 -2.27 -5.328 -0.90 -1.14 -1.51 -2.25 -4.54aYv 1.03 1.27 1.68 2.51 5.14
a. This table reports estimates of the effect of per capita incomes and history on governance (y and 8, respectively), and thevariance of the error term in equation 5 (aJ), for the indicated assumptions on measurement error in governance (aur) and thecorrelation between the errors in equations 4 and 5 (p).
26. For the region as a whole, this low explanatory power of history as a determinant of misgovernance is plausible,given that these countries attained independence almost two centuries ago and on the whole the colonizers did notexert the same destructive institutional influence as in other settings (such as certain parts of Africa). The contrastingcases of Argentina and Chile offer a poignant illustration of the limits of history in explaining the quality ofgovernance today: these neighboring countries share historical, cultural, location, climatic, and linguisticcommonalities, but they have take widely divergent paths in terms of institutional quality.
20
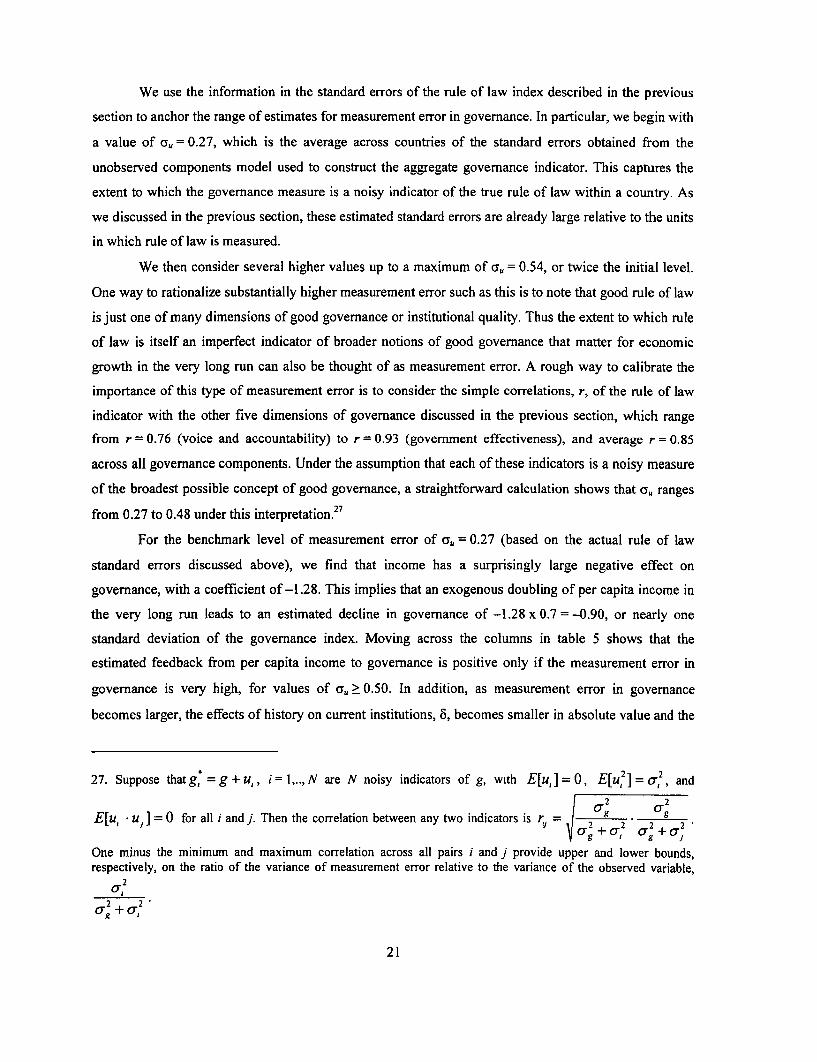
We use the information in the standard errors of the rule of law index described in the previous
section to anchor the range of estimates for measurement error in governance. In particular, we begin with
a value of au = 0.27, which is the average across countries of the standard errors obtained from the
unobserved components model used to construct the aggregate governance indicator. This captures the
extent to which the governance measure is a noisy indicator of the true rule of law within a country. As
we discussed in the previous section, these estimated standard errors are already large relative to the units
in which rule of law is measured.
We then consider several higher values up to a maximum of a, = 0.54, or twice the initial level.
One way to rationalize substantially higher measurement error such as this is to note that good rule of law
is just one of many dimensions of good governance or institutional quality. Thus the extent to which rule
of law is itself an imperfect indicator of broader notions of good governance that matter for economic
growth in the very long run can also be thought of as measurement error. A rough way to calibrate the
importance of this type of measurement error is to consider the simple correlations, r, of the rule of law
indicator with the other five dimensions of governance discussed in the previous section, which range
from r = 0.76 (voice and accountability) to r = 0.93 (government effectiveness), and average r = 0.85
across all governance components. Under the assumption that each of these indicators is a noisy measure
of the broadest possible concept of good governance, a straightforward calculation shows that ca,, ranges
from 0.27 to 0.48 under this interpretation.27
For the benchmark level of measurement error of c,, = 0.27 (based on the actual rule of law
standard errors discussed above), we find that income has a surprisingly large negative effect on
governance, with a coefficient of -1.28. This implies that an exogenous doubling of per capita income in
the very long run leads to an estimated decline in governance of -1.28 x 0.7 = -0.90, or nearly one
standard deviation of the governance index. Moving across the columns in table 5 shows that the
estimated feedback from per capita income to governance is positive only if the measurement error in
governance is very high, for values of c,, > 0.50. In addition, as measurement error in governance
becomes larger, the effects of history on current institutions, o, becomes smaller in absolute value and the
27. Suppose thatg, =g+u,, i=l,..,N are N noisy indicators of g, with E[u,=0, E[u']=a,, and2 2
E[u, * u,] =0 for all i and j. Then the correlation between any two indicators is r, = g 8.0g +0 0 +0
One minus the minimum and maximum correlation across all pairs i and j provide upper and lower bounds,respectively, on the ratio of the variance of measurement error relative to the variance of the observed variable,
a2
2 220-g + 0;
2 1

variance in the error term in equation 5 becomes smaller. The lower panel of table 5 shows the effects of
assumptions regarding the correlation between the error terms in equations 4 and 5. The larger is this
correlation (as it moves from negative to positive values), the smaller (more negative) is the estimated
magnitude of the reverse causation from income to governance, and the larger (in absolute value) are the
effects of history and the variance of the error term.
The main message from table 5 is that measurement error in governance needs to be very large to
admit the possibility of positive feedback from per capita income to governance. We have already pointed
to the basic intuition for this result in the discussion of equation 8 above. In the absence of measurement
error in governance, the substantially larger IV estimates of equation 4 relative to the OLS estimates must
reflect the fact that the instrument is either removing negative feedback from per capita income to
governance or removing the effect of omitted variables that are uncorrelated with the instrument but that
move governance and per capita income in opposite directions.
Table 5 adds to this basic intuition the quantitative observation that for all but very high
assumptions regarding measurement error in governance, the attenuation bias in the OLS estimates is
insufficient to rule out negative feedback from per capita income to governance. In fact, the only way to
get positive feedback from per capita income to governance is to assume either that measurement error in
governance is very large or that there are some omitted variables that move governance and income
strongly in opposite directions-and it is hard to think of plausible candidates for such omitted variables.
Otherwise, this very standard empirical model, together with the data we use, is inconsistent with the
notion that there is positive feedback from per capita income to governance. Rather, the model suggests
that feedback from incomes to governance is, if anything, negative.
The estimates of the other two parameters of equation 5-namely, the effects of history on
governance and the variance of the residual-also have interesting interpretations. Note first that the
direct effects of history on governance in equation 5 are smaller the larger we assume measurement error
in governance to be. The reason for this is as follows. As measurement error in governance becomes
larger, the estimated feedback from per capita income to governance becomes less negative. If this
feedback effect were to become positive and large, better values of the history variable only need to have
small effects in order to trigger a very powerful virtuous circle of better governance leading to higher
incomes leading to better governance. Therefore, the coefficient on the history variable in equation 5
would not need to be very large to match the observed correlation between history and per capita income
today. In contrast, if measurement error in governance is small and feedback from incomes to governance
is negative, then history needs to exert a large direct effect on governance in the absence of such virtuous
circles.
22

Table 5 also shows that if we assume measurement error in governance to be very large, the
variance of the error term in equation 5 becomes small. This is because we choose this parameter to
match the observed fit of the first-stage regression of governance on history. If we assume that there is
very large measurement error in the dependent variable (governance) in equation 5, then the only way we
can match the good fit of the first-stage regression is if the variances of the errors in the two structural
equations are small. Thus, if we assume that measurement error in governance is unrealistically very
large, our estimates of equation 5 indicate that most of the variation in governance is accounted for by
only two variables-income and history. For more reasonable values of measurement error in
governance, income and history play a smaller role in understanding cross-country differences in
governance.
Figure 4 more systematically illustrates the relative importance of income, history, and other
factors in determining institutions for the countries in Latin America and the Caribbean, under the
benchmark assumption that a,, = 0.27. Consider first the importance of history. As already shown in
figure 3, the Latin American and Caribbean countries all fall close to the mean of the world distribution of
the history instrument. The contribution of history to deviations between governance in Latin America
and the Caribbean and the rest of the world is therefore small. In contrast, the effects of income on
institutions in Latin America and the Caribbean are large in absolute value for all countries. Given our
finding of negative feedback, the contribution of income levels to governance tends to be positive in the
poorer countries and negative in the richer countries of the region. Finally, under the realistic benchmark
assumption of the measurement error in governance, we find a substantial unexplained component of
governance in Latin America and the Caribbean, which is roughly evenly dispersed between positive and
negative values.
This means that the fact that countries in Latin America and the Caribbean tend to fall below the
OLS regression line of per capita income on rule of law (as discussed in the introduction) should not
necessarily be interpreted as evidence that governance in the region is surprisingly bad given its income
levels. In fact, once we take into account the negative effect of incomes on governance, as well as the
(small) effects of history, countries in Latin America and the Caribbean do not appear to have
systematically good or bad governance relative to the rest of the world. Only if we assume that
measurement error in governance is very large do we find sufficient evidence of positive feedback from
per capita income to governance to justify the idea that governance in Latin America and the Caribbean is
systematically worse than would be expected given its income levels.
23

Interpreting Negative Feedback from Incomes to Governance
The remainder of this section discusses and interprets the rather surprising finding of negative
feedback from incomes to governance. Our first point is that the negative or zero feedback result is quite
robust, in the sense that the degree of measurement error required to overturn it is very large indeed. For
instance, if cru were equal to its high-end value of 0.54, then the 90 percent confidence intervals for
governance would be twice as large as those shown in figure 2 (based on actual data). These confidence
intervals based on the high-end value are so large as to make the aggregate rule of law indicator virtually
meaningless: they imply that rule of law in Mexico (which ranks near the middle of countries in Latin
America and the Caribbean) is not statistically significantly different from that in either Haiti (the country
with the lowest score in the region) or Chile (the country with the highest score). Since we do think that
the country rankings in the governance indicators are informative, we find this degree of measurement
error to be implausibly high.
Even if we took the broader interpretation of measurement error, in which rule of law itself is
only a proxy for more general notions of institutional quality, we would still be forced to the conclusion
that our rule of law index is virtually uninformative about cross-country differences in broader
conceptions of govemance-a conclusion we find extreme. Finally, if-as is plausible-there are omitted
variables in equations 4 and 5 that drive income and governance in the same direction, then the
measurement errors would have to be even larger than the high-end ones suggested above in order to find
positive feedback from per capita income to governance. All of these factors suggest that the extent of
measurement error required to deliver positive feedback from per capita income to governance is
implausibly large.
Our second point is that our cross-sectional empirical framework of levels of income and
govemance is designed to capture the interactions between these variables in the very long run. This
means that our finding of negative feedback does not have a short-run time-series interpretation along the
lines of "rapid growth in country X over the next five years is likely to worsen governance." Nor does our
finding of negative feedback imply a negative unconditional cross-sectional correlation between incomes
and governance. After all, the observed positive cross-sectional correlation between levels of incomes and
govemance is dominated by the strong causal effects of governance on per capita income in the very long
run. Rather, our finding of negative feedback says that we should only expect to find a negative partial
correlation (controlling for history) between governance and purely exogenous factors associated with
higher income levels in a cross section of countries.
This, however, brings us to our third point: it is difficult to observe direct evidence of this
negative feedback in the form of some variable that is correlated positively with incomes and negatively
24

with governance in a cross section of countries. This is because it is difficult to FIND con-vincing
examples of purely exogenous variables that would affect incomes and growth in the long run but have no
direct effects on institutional quality, such that their correlation with governance would purely reflect the
negative feedback. In fact, were such variables (affecting incomes but not governance) to exist, they
would be natural instruments for directly identifying the effects of per capita income on governance in
equation 5. But again, convincing instruments for income levels in a cross section of countries are scarce,
and this is what motivates our indirect approach to identifying feedback from income to governance. It is
more likely that variables that matter for income levels in the long run (such as favorable geographical
location, political stability, natural resource abundance, and enlightened policymaking) are also positively
correlated with institutional quality through a variety of other mechanisms. As long as these direct effects
are sufficiently large, it will not be possible to observe a negative correlation between these variables and
governance driven by the indirect negative feedback that we have identified. Thus while our negative
feedback result is quite robust, it is also difficult to observe directly in the form of a positive cross-
sectional correlation between some variable and income and a negative correlation between that same
variable and institutional quality.
How, then, should we interpret this finding of negative feedback? First, negative feedback implies
that improvements in institutional quality or governance are unlikely to occur merely as a consequence of
economic development. As countries become richer, higher incomes do not necessarily lead to demands
for better institutional quality, despite conventional wisdom to the contrary. In fact, just the opposite
might occur. As long as the established elites within a country reap private benefits from the status quo of
low-quality institutions, there is little reason to expect that higher incomes will lead to demands for better
governance. The phenomena of crony capitalism in East Asia, of elite influence, cronyism, and regulatory
capture in Latin America, and of state capture in transition economies provide vivid examples of the
conflict between the interests of the elite and the need for better institutional quality.
Second, negative feedback is an indication of the absence of virtuous circles from higher incomes
to better institutions which in turn support higher incomes in the very long run. Consequently, small
interventions to improve institutional quality are unlikely to make much difference in the long run.
Together, these two implications point to the urgency of improving governance in countries where it is
weak. But cross-country analysis such as this provides neither guidance as to how this should be done nor
possible explanations of results such as the negative feedback presented above. In the last section of this
paper, we draw on experience with governance diagnostics within selected countries in Latin America to
address both issues.
25

IMPROVING GOVERNANCE
The first result of this paper-that governance matters significantly for growth in the very long
run-is not new, and it validates earlier such findings. The second result, however, is new. It suggests that
improvements in governance will not occur automatically as the development process unfolds; no
virtuous circle will suddenly begin to operate. These results suggest that interventions to improve
governance are warranted. Unfortunately, however, the cross-country evidence presented thus far is not
very informative for policymakers intent on formulating and implementing specific strategies to improve
governance in their countries.
In the past few years, the World Bank has designed and implemented detailed country diagnostic
surveys that provide insights and help identify specific actions to improve governance. These governance
and anticorruption diagnostics rely on in-depth, country-specific surveys of thousands of public-service
users, firms, and public officials, in order to gather specific information about institutional vulnerabilities
within a country. These separate surveys permit triangulation and consistency checks for the results
across respondent categories, while probing in more detail into a broad array of governance issues within
countries. So far, the surveys have been applied to a score of countries worldwide.28
One of the innovations in these surveys has been their emphasis on unbundling governance and
corruption into more specific dimensions. This has helped to highlight the causes, consequences, and
costs of various forms of misgovernance, and it has shown how institutional quality can vary widely
across institutions within a particular country.29 The results from three recent country governance studies
in Latin America are indicative of the multiple dimensions of corruption worldwide. Figure 5 summarizes
evidence from Colombia, Honduras, and Peru on the prevalence of four distinct dimensions of corruption:
the frequency of bribery in obtaining services, in public procurement, in the budget process, and in
shaping the formation of the policy, legal, and regulatory framework.
This section focuses on the last form of corruption, which we call state capture. State capture is
defined as the undue and illicit influence of the elite in shaping the laws, policies, and regulations of the
state. In its emphasis on the formulation and shaping of state laws and regulations, state capture departs
28. For details on governance diagnostic instruments and country reports, visitwww.worldbank.org/wbilgovernance/tools.htm.29. These in-depth diagnostics, which complement insights from the composite governance indicators presented inearlier sections, can provide specific inputs for action programs at the country level by: i) unbundling governanceand corruption into more detailed and specific dimensions and assessing the relative importance and prevalence ofthe unbundled components; ii) assessing the quality of govemance and performance of the key institutions withinthe country; iii) assessing the costs of various forms of misgovemance (such as through the link to poverty or to thequality and extent of service delivery); iv) identifying the most important factors affecting governance andperformance (such as external versus internal accountability mechanisms, as well as issues of undue influence by theelite and state capture); and v) identifying priorities for action (based on the above items).
26

from the conventional view of corruption, which centers on how bribery is used to influence the
implementation of such laws and regulations. Recent research has identified state capture as a
fundamental governance challenge in many transition economies, and emerging evidence from Latin
America suggests the importance of capture in this region, as well. 30
State Capture
A possible explanation for the negative feedback from per capita income to governance is the
phenomenon of state capture. If the fruits of income growth largely accrue to an elite that benefits from
misgovernance, then any possible positive impact of income growth on governance could be offset by the
effect of the elite's negative influence. The recent in-depth empirical research on transition economies
finds that state capture is pervasive in many of these countries. Yet state capture clearly is not unique to
this region in the past decade. Many other countries have gone through periods of illicit influence by
powerful elites in their past; the influence of the so-called robber barons in the United States at the turn of
the twentieth century is one such illustration. Other research focuses on crony capitalism in the
Philippines under Marcos and on Mexico during the long era of dominance by the Partido Revolucionario
Institucional (PR). 3 ' Such cronyism is often a somewhat subtler form of the coarse manifestations of
capture by oligarchs found in the early years of transition to a market economy in the former Soviet
Union, but nevertheless it is indicative of serious governance failures in the interface between the private
and public sectors. Even the recent spate of scandals associated with lax regulatory and legislative
oversight in the accounting practices by influential firms in the United States suggests yet another variant
of this private-public misgovernance nexus.
The Business Environment and Enterprise Performance Survey (BPS) carried out in 1999 in
twenty-four post-socialist economies provides insights on the phenomenon of state capture.32 This survey
measured state capture by asking firms about the prevalence of illicit private "purchases" of laws,
decrees, and regulations by firms, and about the impact of such purchases by other firms on their own
enterprise. The survey measured not only the conventional types of bureaucratic and administrative
30. For details on recent research on state capture, see Heilman and others (2000); Hellman, Jones, and Kaufinann(2001); www.worldbank.org/wbi/governance/wp-statecapture.htm.31. See Haber (2001).32. The Business Environment and Enterprise Performance Survey (BPS), developed jointly by the World Bank andthe European Bank for Reconstruction and Development (EBRD), is a survey of over 4,000 firms in twenty-fourtransition countries carried out in 1999-2000, examining a wide range of interactions between firms and the state.Based on face-to-face interviews with firm managers and owners, BPS was designed to generate comparativemeasurements inter alia on corruption, state capture, lobbying, rule of law, and the quality of the businessenvironment, which was then related via statistical analysis to specific firm characteristics and firm performance.For details, visit info.worldbank.org/governance/beeps/.
27

corruption related to the implementation of the laws and regulations, but also undue and illegal influence
in shaping such laws and regulations. The results from the BPS survey point to a high prevalence of state
capture in transition economies. In countries such as Moldova, Russia, Ukraine, and Azerbaijan, well over
30 percent of the firms reported that they had been significantly (or very significantly) affected by the
prevalence of state capture in their industry.33
The econometric results based on this large multi-country enterprise survey indicated that captor
firms (which engage in illicit activities to shape the state laws and regulations) do, in fact, derive very
large benefits from such strategies. Captor firms exhibited much higher output and investment growth
than their noncaptor counterparts, controlling for other factors. In contrast, firms that were coerced into
paying bribes for administrative corruption derived little private benefit from these bribes. Yet while the
captor firms benefit in terms of growth from their private purchase of policies, regulations, and law and
order, public provision of rule of law is further undermined by these capture strategies. Indeed, the
statistical evidence suggests that public protection of property rights for the overall enterprise sector was
substantially lower in countries in which capture was prevalent. This evidence suggests a pattern in which
the large private benefits derived from capture provide an insidious built-in incentive for the persistence
of such capture, as the growing economic might of powerful captor firms supports even more capture and34further deteriorations in overall governance.
Do similar patterns apply to Latin American countries? In contrast with the work already
undertaken in transition economies, a comprehensive cross-country empirical investigation of the
phenomenon of state capture has yet to be undertaken in the Latin American region, though it is part of
the upcoming research agenda. At this stage, the empirical evidence is of a select nature; it is mainly
derived from the recent country governance diagnostics in a small number of countries in the region. The
results of these diagnostics suggest that the challenge of state capture is also present in Latin America.
The emerging results from diagnostics in Colombia, Honduras, and Peru point to capture by
influential forces outside the state as a major governance challenge. Further details on the particular forms
of state capture can be found in the responses of public officials and enterprise managers. For example,
figure 6 summarizes results for Colombia and Peru as reported by the public officials survey, with
enterprise managers reporting similar results independently (not shown). Both enterprises and public
officials consistently point to pervasive capture of legal and judiciary institutions. In Peru, survey data
33. The empirical analysis of this issue was made possible thanks to the BPS survey design. Yet the notion of statecapture was far from alien for the media and politicians. One notable illustration was the statement by RussianPresident Vladimir Putin in his opening remarks to a roundtable of twenty-one top Russian companies and banks: "Ionly want to draw your attention to the fact that you have yourselves formed this very state, to a large extent throughpolitical and quasi-political structures under your control. So what you should do least of all is blame the mirror"(president.kremlin.ru/text/APPTemplAppearld 10623 .shtml [July 2000])
28

collected in early 2001 indicated that powerful groups outside the public sector had an undue influence in
shaping the policies, laws, and regulations of the state.
This incipient empirical evidence from some countries in Latin America, as well as the empirical
results from other regions, permits us to speculate as to the role of capture in explaining the 'growth-
without-governance 'puzzle. To the extent that state capture is important, higher incomes may be
appropriated by the monopolistic captors or elites. This, in turn, can lead to additional demand for private
purchase of laws and regulations ensuring the continued dominance of the elite. The net effect is to erode
overall governance, particularly the public protection of property rights, the incidence of corruption, and
more broadly, rule of law.
This increasing demand for capture in a situation of economic growth may be further abetted by
the fact that the A la carte supply of laws, regulations, and policies offered by politicians to powerful elites
is less likely to be subject to checks and balances in such an environment. This is due to the widespread
complacency about governance in economies with good performance contributes to relatively lax internal
and external pressures to improve governance. This was the case in Indonesia under Suharto throughout
the 1980s and much of the 1990s, but Indonesia is not alone. Argentina in the 1990s is another extreme
illustration, while Mexico during the previous captured political era of crony capitalism serves as a more
nuanced example.35 Russia during different historical periods are also telling, as well as the recent events
related to major failures in corporate governance and regulatory oversight of very powerful U.S.
companies are also suggestive.
Thus far, the links between state capture and the negative feedback between incomes and
governance that we have documented are of a speculative nature, and they call for further research. As
data become available on the degree of capture by elite interests in a large number of countries in Latin
America and other nontransition regions, it will be possible to put this preliminary hypothesis through
further empirical tests. In particular, it will be possible to empirically investigate the socioeconomic costs
of various dimensions of capture in Latin America, as has already been done among transition36economies.
34. Hellman, Jones, and Kaufmann (2001).35. Haber (2001); Haber, Maurer, and Razo (2001). For a general treatment of the negative implications of cronycapitalism for growth, see Krueger (2001).36. The media in Latin America is increasingly taking up the issue of state capture, as has been the case for yearsnow in the former Soviet states. See, for instance, the editorial entitled "El Estado Capturado" in the leadingColombian newspaper, El Tiempo, 21 February 2002.
29

Implications for Reform
At a general level of strategy design, the empirical analysis of the governance diagnostics provide
important country-specific inputs for action and reform. In many countries, these surveys have
highlighted the variety of forns of corruption and identified institutions afflicted by misgovernance and in
which corruption is particularly pervasive. Given the prominence we ascribe to state capture and related
forms of influence by the elite in providing a plausible explanation of why growth may not translate into
improved governance, then strategies to improve governance and combat corruption ought to specifically
address such undue influence and capture. This implies a strategy that departs from conventional public
sector reform, which typically focuses on the internal management and functioning within government.
The research on state capture for transition economies, as well as analysis of govemance diagnostics in
some Latin American countries, point to the importance of voice and external accountability mechanisms,
of political contestability, and of transparency reforms (including media freedom, disclosure of votes by
parliamentarians, declaration of assets by politicians, and regular monitoring through surveys and report
cards). This necessitates a move towards collective-action modalities, including not only selected
agencies in the executive, but reformists throughout, including the parliament , civil society, and the
private sector. 37
Similar lessons emerge from an earlier governance diagnostic survey carried out in Bolivia,
where over 1,200 public officials working in over one hundred public agencies were interviewed in depth
on diverse dimensions of institutional performance and governance vulnerabilities. Figure 8 shows the
relationship across government agencies in Bolivia between either the reported prevalence of
administrative forms of bribery (as well as state capture manifestations) (the vertical axis) and three
possible reform dimensions (the horizontal axis): (i) transparency (with regard to budgets, personnel
management, and administration); (ii) the existence of citizen feedback mechanisms (which are acted on
by the agency); and (iii) their reported employee satisfaction with regard to pecuniary and nonpecuniary
compensation. Each of these three possible reform dimensions is depicted in one of the panels in figure 8
on the horizontal axis. The first two panels show a clear association between transparency and external
feedback mechanisms, on the one hand, and corruption (including state capture), on the other, controlling
for other factors. In contrast, there is little if any association between the public officials' response on
their perceived satisfaction with their pay and bribery or capture. While the structural relationship
between determinants of corruption and capture and such governance outcomes is likely to vary across
37. While the involvement of nongovernmental organizations and related civil society segments as agents toimprove governance has become more prominent in recent years, the role of the competitive private sector(including associations of traders, exporters, and small and medium-sized enterprises) has been underemphasized.
30

countries (as demonstrated by evidence emerging from different governance diagnostics), this type of
evidence casts doubt on the traditional public sector management approach to anticorruption, which tends
to focus uniformly on issues of pay and internal monitoring and supervision. Rather, these findings point
to the importance of open access to information and effective external monitoring (inter alia through
providing 'voice' to the public service users) as important in reducing corruption, improving governance,
and mitigating state capture.38
In sum, countries in Latin America and the Caribbean urgently need strategies to improve
governance, given concerns about existing quality. Even when growth resumes in these countries, one
should not expect automatic improvements in governance to occur without the implementation of
substantial interventions. The design of governance and institutional reform strategies should rely on
country-specific know-how and governance diagnostic tools to identify specific priorities. And
understanding the political and economic forces shaping policymaking and lawmaking (which vary from
setting to setting) is key to the identification of realistic and country-relevant strategic priorities.
Where state capture prevails, the governance quality of the growth dividend may be very low, if
any. The vulnerability of sustained growth prospects is thus high, necessitating specific strategies to
address such capture. Such strategies would need to consider political reforms, which have been under-
emphasized in the past. But conventional economic reforms may not be sustained without them, even if
they are implemented in the first place. Furthermore, the specific institutional reforms need to depart from
both a narrow focus on traditional public sector management and an excessive focus on legal fiat or on
rules-based measures. Instead, much more emphasis must be placed on promoting mechanisms of
external accountability, voice, participation, and transparency.
38. Kaufmann, Mehrez, and Gurgur (2002) provide a more systematic analysis of these points and present theeconometric results in detail.
31

Appendix 1: Details of Identification Procedure
The reduced form of the system defined by equations 4 and 5 in terms of observables is
(Al) gJ = (1 - y -, *+ y c+ o- xi + y- e + VJ)+ U and(Al) y ,an(A2) y; =(1-y.I3)~'.(a+I3i±+I3.8.xj +e1 + I.V1)+WJ.
Equation 4 in terms of observables is
(A3) y1 =a+,B-g; +e, - -uj +w,.
The model in equations 4 through 7 has ten unknown parameters (a, 3, B, y, O, p, ae, CS , a2
and cy 2 ). In the data, we have seven independent pieces of sample information. These are the estimated
intercepts, slopes and variances of the residuals of the first- and second-stage regressions that deliver the
two-stage least squares estimates of the effects of governance on income in equation 1, as well as the
estimated OLS slope coefficient from a regression of per capita income on governance.
As discussed in the text, we augment this sample information with three assumptions that pin
down the values of cy2 (the variance of the measurement error in govemance), a2 (the variance of the
measurement error in log per capita GDP), and p (the correlation between the error terms in equations 4
and 5). We assume throughout that the stability condition, (I - y * f3 > 0, holds. Note that this places an
upper bound on the amount of feedback from per capita income to governance, that is, y < 1/,.
With these three assumptions in hand, we solve the remaining seven equations, linking the seven
pieces of sample information with the seven remaining parameters, as follows. The intercept and slope
from the second-stage regression give us estimates of a and ,B. From Equation A3, the variance of the
residuals in the second-stage regression isCy2 + p2 _ a2 + U2 , which gives us an estimate of c2 . Note that
the restriction that cae > 0 places an upper bound on our assumptions regarding the variance of
measurement error in per capita income and governance..
Finally, we (numerically) solve the following three equations for 6, y, and cy v
((A4) ,r_= S
2 2 2
A i2 = Y 2e 2-YvP+ae <v +UV 2(AS) 2 Y *(YU and
62 13. 2 + y +. 13 a2 +2(1 +jy 13). p . e (A6) POLS = o2 2 +±y2 .a +U 2 + 2 YPOe +(1-Y.p3) 2 .2
32

where *c, and &2 denote the slope coefficient and estimated variance of the residuals in the first-stage
regression of governance on the instrument, x; i3OLS denotes the slope coefficient from and OLS
regression of log per capita GDP on governance; and CY2 is just the variance of the instrument, x, which
we estimate directly from the data. Finally, with these estimates in hand, we obtain j. from the estimated
intercept in the first-stage regression,
so= 1-e y3
33

Appendix 2: Governance Data'
Voice and accountability Political stability Governnient~ effectiveness
2000-01 1997-98 2000-01 1 99 7-98 2000-01 1997-98Country Est. S.E. N Est. S.E. N Est. S.E. N Est. S.E. N Est. S.E. *N Est. S.E. NAfghanistan '-l.64, 0.39 I -1 62 0.36 I :--2.06 0.49 I - - -1.23. '0,3 I - -
Albania 0 01- .17 ',5. -0.13 0.21 4 -.0.60 0.37. 4 -1.00 0.25 4 -0.89 .0.25 .51 -0 65 0 29 4Algeria >1? 0.41 .31 0.25 3 -IJ-.7 0.28: ,4A -2.42 0 30 3 4O.81[ 0.24z -109 0 32 3Angola :..1.26;..0424 4. -1 00 0.25 3 219 .8 .> -. 8 .8 44~l 2 -13 024 5Argentina 0.5T, 60:23 7-- 0 49 0 25 4 0:55 0212 9" 0.51 0 26 5 o.18 iO8 10 0.26 02-15 6Armenia f~~~~~-022 017. '~~~~~5.- j -018 021 4 ~~~~~~~~'-Q.84 0.41 4 -0.45 025 4 1031 0-,4.4. 041 47 5 -0655 0.29 40:2Australia !O-170 044>5._S 1.63 0 25 4 A1.26- .0.23 7 11.18 0.26 5 4158 0.19- 7 1.46 0 25 6Austria 134.- U4. 5 1 45 0.25 5 1.27 0.23- 7 .8 02 5 20 T. 1.22 0.23 7Azerbaijan 0-070 6v 0 16' 6 -0.81 0.19 5 20O.70 .027 5 -0.36 0.23 5 I-0.95 On f 6' -0.83 0.24 5Bahamas -15 08 2 11 0.92 0.68, 1 0 37 0404 03 1 .7 0.77 I
Bahrain -096 024 ~~- 4 -. 04 0 25 3 -00~02 ~ -0.08 0.30 0.2 02 44 0.24 0.32 3Bangladesh 420.: 0.24w -i5 -0.01 0.25 3 - .57 0.27, 5: -0.40 0.30 3 -0 54' .'.0!23 ..:5 -0.56 0.32 3Barbados 4j27 0,639 I, 1.49 0.36 I 1 r 5-',, -0.78 0.21 4 4_~~K99 02Belarus 104 0 f7~~dA--_`5K -078 02S4., 43 -0.37 0.25 4 05-0.66 0.29 4Belgium Ii 24 02.4 ~~~5 1.41 0.25 4 8 .3 7 0.82 0.26 5 - 02 : 20' 0.88 0.25 6
Belize L 10J ~~~~03 9 2' 1.23 0.36 I 0.32. 0.90" 1 - .80.701 J - -I
Benin 04 30 069 0.35 2 .-0.2 0.'63 I1 -0.94 0.66 I 0. 12 0.52 I -0.07 0.56 IBhutan 12 0.39-. I -1.25 0.36 I j Bolivia LO 2 04 0.39 0.25 4 --.OS6I~ 4 -0 14 0.28 4 ~ 0 -0.22 ~6 -0.22 0.26 5Bosnia-Herzegovina 2O9 0I'4 1-.0 0.23 2 W601' 40.4 2; -1.16 0.39 I V--.0.92. .0... 11 0.4 Botswana 0~ 2~~ I 0 78 0 25 3 .-0.71 0.27- .5 0.74 0.8 4 7VO.8 3 .0.23 5 1 0.22 0.26 4
Brazil r.,Q 53 024 6~~~~~. 0.58 0 25 5 04-., D. 22' 8 -0 32 0.5 6 V-0.27_ r0..18 9' -07.22 02Brunei K03 0.20 -0.92 0.29 2 O.W6 Q.65- 1 1 32 0 41 I 1 8 053 t 0 01 0.77 1Bulgaria ..O" 016 -.7I~ 0.47 0.19 5 .9.37-, 0.6 710.43 0.23 5 .p0`6 019 SI-0.81 0.24 5Burkina Faso -.0 07 3- -0.21 0.29 2 4,-054, 0.51I 2 I-0.52 0.36 2- 0.02.. 0. 40-, -0.06 0.32 3Burundi 1l3 036- :2 -1.29 0.36 I -. 4- 054 2 - 1~4 0:37- -z-Cambodia '-0 039., 2. -0.91 0.36 I -03 00. 1 3:- -90- 4034 *070 i - -
Cameroon L :0~2 0.24 W5.-*. -0 70 0.25 4 -0.13- -029 5- -0.72 0 27 5 .-40 0'O25' -5Z I-0.64 0.24 5Canada W 7AO.23 .7-7 1.39 0.25 5 1l24 -02. . .03 0.25 6 1' 71 0,19 9 1 72 0.23 7Cape Verde .O , -02'0. 039 I 0.99 0.36 I Central Aftican 903 I
Republic -09]05 .-- 0 75 0 51 IChad 0r08 .039 -0.85 0.3 5 2 - -74 0.66 I -0.71 0.56 1Chile ~ -O6 0.06 .5[8"7 0.22 -9- 0.45 0 26 5 :.3 0:1 0.1.7 02 China .-- 1l:04;6 12 2 .9..2 8 04 .6 5 [ 14 - 018 9- 0.02 0.25 6Colombia 01.- 23., --.-7 -*. -0.15 0.25 5 L-.3 .022- r9 12 .2 L3. 0.1 ___~ -0.06 0.23 7
34

Comoros .- 03~ j0.06 0.36 1 *.,- - :- -. )- - -
Congo, Democratic 1k? 4 2 -13 .V-.7 04 Rep. of the (Zaire) I, Y70- 027 '3 J-.7 029 2 3.-1.970.8.02.983.
Congo, Rep.of the A 138 0.2 3 fl -0.77 0.29 3 -136 0.51 -2 -1.83 0.37 2 -1.58 0:40.' *2 j -0.58 0.39 3Costa Rica I37 "9241 `54 1.35 0.25 4 L.08' 0.26' 6 0.91 0.27 5 0.74'. 0.21 6 0.55 0.29 4Ivory Coast IL19i 02~5 4A -0.57 0.25 4 '-0.95 0.29 41-01 0.27 5 y 0 8 .~ 4 -. 8 02 Croatia 04 1 6 02 .9 4 01 .9 5 0.41 0.24 4 :010 0.2 6 0.15 0.26 4Cuba 4 0.11493 0.25 .3 -1.46 0.25 3 0.07' .`O ,2_8 4 01 03 h-0.22. 024 4~ -0.50 0.32 3Cyprus .28, 1025 3 I 1.11 0.25 3 .04 .~ 3 0.38 0.30 3 0.1.026 3 104 .2 3Czech Republic ' 1.04- 0.16 7 i 1.20 0.19 6 0.74 0.23 -- 8 0.81 0.22 7 0.58 0.18 10 0.59 0.21 8Denmark 616 .3 .3 .5 4 .. 4 .23 "A" 1.29 0.26 5 Ul-62'"0.19 8 .7 0.25 6Djibouti 10.44 0.39. 1 -0.60 0.36 1 Ž ~- - - P , '2::'
Dominican Republic 6 :42 0. .'0.242 24 '5 I -0.08 0.2 3 04 0.8 -J 0.2 0.34 2 0.4 .2 &' -0.83 0.37 2Ecuador -0.14. 0.24 54 0.27 0 25 4 2,0. 80-, 0.25 7 -0.47 0.26 5 -0.94- 0.20 , 8 .,-0.56 0.27 5
Egypt -0.65 0.~24 06 0.25 3 ~0.21 0.24 ,,7~ -0.07 0.25 6 x,0.27,.'~,. 1~l 8 -0.14 0.22 6El Salvador 0.21 0.24 5 -0.10 0.25 3 10.62 0.30 5 02 03 145 0.23 5r 02 0.37 2
Equatorial Guinea -1.30- i0.39 1 -1.39 0.36 in1 i- 'r-'
Eritrea -104~ 0.36 2 -0.59 0.36 1I~03 6 01 .6 02 Esthopia -. 4 .9 02 0.85 07 IO -0.50 0.96 0.0.79 0.23 [o0.8 0.1 9W .6 02 Esthonia 0:40.85 .-2 -086 0.19 2f0.73 0.24 >0.55 0.14 0.36 2 -. 01 0.7 3 -0.15 0.32 3Fiji .0.05 0.36 2 0.01 0.35 2 [ 039 0.3 00-.6 ,8 . I 0.63 0.56 1Finland 1.69 0.23 6 1.63 0.25 4 4.61 O.3-'&s" 1.51 0.26 5 t17 0 19 81 1.63 0.25 6France E1l 0.23 -. 7 1.15 0.25 5 4.04 ._~0.22 '9 0.65 0.25 6 J :124 -~0.19.>- 1.28 0.23 7Gabon -04.40" 0.2'4` -~41 -0.31 0.25 344'0.28' -',4`' .56 0.34 2 4A5,- 4 "- -1.13 0.37 2Gambia ..40.73 04a2` 0.97 0.29 2 0.49 0.65 uA] 0 56 0.41 .?'4l' 0.531 jA~ ~ 0.16 0.77 Georgia -0D,07 19 5 -0.25 0.23 3 -1.00 .0.41 4~-0.76 0.31 3 -.0.72 0.277"' -0.51 0.30 3
Germany 1.~~~42 02:7, 1.46 0.25 5 1.21 :0.22 -9 1.32 0.25 6 1.67 0.9is j 141 .2 7Ghana 0.02 0O.24 5.J -0.43 0.25 4 1-0.11 0.29 ,f5.,-.0 .2 6-.0 '25`-.: ~' 029 02 Greece 12 .24 '44 10 025 4 0.79. 024 6 0.21 0.26 5 .0.5 9.20 74 0.56 0.25 6Guatemala -0:33 .0.24 1-S1 -0.56 0.25 3 -0.77' 0.30 '5-- -0.75 0.32 3 -.. 63- .022, 6 -0.23 0.37 2Guinea ' -. 98 0.28 £2]-0.87 0.29 3 -0.99 0.65, 1 1.03 0.7 2 [.1 05 ,I; -0.03 0.51 2Guinea-Bissau 4087 0.27 -~3 -0.45 0.29 3 -1.21 0.51 -1.20 0.37 2 -1.48 0.40 2I -0.33 0.51 2Guyana -0.94 -~0.27 >4' 1.01 0.29 2 O4.70 'O 51 2- -0.20 0.41 1 .0.02 0.40 .4 0.01 0.77 1Haiti -0.80 0.27 4 ' 071 0.29 2 '.38, 0.49 3 17 .1 1 11.2 .7 -3-. -. 3 07 Honduras -0:04 .024 006 0.25 3 0.-25 ,0.30 ' -" 0.33 0.32 3 -O 8,- iO.23 --5 -0.41 0.37 2Hong Kong- -0.33~ 0,24 ,-A'j 0.01 0.25 6 f4113 0.25 6'0.92 0.27 5 1:10 ;-0.21 i~rl 1.25 0.25 6Hungay J, 0.16 1 1.22 0.19 6 1 0, ' .22 " 1.25 0.22y 7 O60,4O~7~- 1 .6-.2Iceland IJ.53. 0.27. 4. t5177-029 0.40 4 1.25 0.37 2 ~-'.3, 0' O3~, '4 1.50 0.41 3India 0.66 0.24- 6., 0.36 0.25 6 [ -0 0 .022 8 -0.04 0.25 6 -0. 17, 0J0..26 0.23 7Indonesia ',04 .4 61 -. 3 02 ~ i6 0.22 8 1.29 0.26 5 ; -0.50 0."O18 19".0.53 0.25 6Iran -0,36 0.24 -4j -0.56 0.25 3 L0.02 02, 0.13 0.28 4 L-1.2t '- 0.22 .5 -0.34 0.29 4
35

Iraq -19"Y4 VJ 1.75 0.25 3 f?46 A C2-2.24 0.30 3 KI4 O4. 4i 1.88 0 32 3Ireland 1.53 0.2556'1.24 .43 j25' -J7 09 7j 1.36 0.23 7Israel KQ.2'V 5 12 1.06 0.25 4 '0-'4.- '0:241:' 6., -0.46 0.28 4 .0.7 020'7)O 0.69 0.27 5Italy .IQ 023 7 1.28 0.25 5 :98' '02 . 1.16 0.25 6 0'6S.11 018' 'io 0.77 0123 7
Jamaica 0.18 0~~~ ~~~25 3 0.75 0.25 4 V0 5 O 033. "~3 I -0.34 0.32 3 -030 06-6 .3 -0.48 0 33 3
Japan 13 '03 6 1.14 0.28 4 Li1 20 .023 8 1.15 0.29 4 0-93 '-0-19- '9 0.84 0.31 5Jordan 00 24 4 0.15 0.2 4 KO13 07 -5, -00 .7 5 0'P42 0.22- 5 0.63 0.26 5
Kazakhstan 'i_-080 0 16' 7 -0.69 0.19 5 109' 02 T 0122 0122 6 '-0-6! 0F 9 -0.82 0123 6Kenya -08 04 5 07 .5 4 -083 027 5;. -1.10 0.27 5 -06 0 09 .2 6Korea, North -4 2 08 9I 1.79 0.29 2 I09 51 2 0.37 0.41 1 1,- -92 .9 -05 06--' 040 2 -0.30 0.77 1Korea, South '0.9'8' 03 -6 i 0.91 0.25 6 [' 50" 02') '8 - 0.16 0.25 6 '044'O 19: -9" 0.41 0.23 7Kuwait %016081 '025 4 .3. 006 :4.9'06 03 .1303Kyrgyz, Republic -0 2"'~%6 -OV 0.3 0.31 -O..%6 ' 0 2.3j. -0.06 0.32 3
Laos ~~~~~~~~~~~~~~~~105~~~~~~L 0O3 6 ,2 -1.05 0.36 1 O000 63" i V0 9 5 Latvia 016. t'"'O 16 0.75 0.19 5 1-Oo 50 0918 ,,. .106 023 5 0'62 0I 6 0.07 0124 5Lebanon '3'-0.40 0.25 3 j -05:" 02 8 4 -0.25 0.30 3 -4002. -0.24 4.. 0.17 0.32 3
Lesotho ~~~~~~-0 5 039'- -0.15 0.36 1 [pr- --0.82 0.61 1 r.-0.46 0.33 2Liberia "'1 04 0.27-~ 3' -0.89 0.29 2 -0Q65 0! 2 -. 5 .4 1 -094 0:40 2 -. 2 07 Libya I 5 ' 3 i5025 3 I 1.35 0 25 3 1,.-0:38i 0.29 3. -1.17 0.30 3 Ij -1 -'O!6' 3 -1.32 0.32 3
Lithuania 100 016 7 ~~~0.88 0.19 5 I0.29'. ,0;26 7- 0.35 0.23 5 [026' 019 9 0.1 0.24 5Luxembourg 14, 07 4 1.49 0.29 3 148 043 3 ;'i 1.40 0.37 2 hi86: 041I 3 1.67 0.41 3
Macedonia (former . -1Yugoslav Rep. of) '003- 0:18' 4A 0.09 0.21 4 j1.145, 0.37: 9,,' -0.40 0.31 3 [J.063 0 '8: _3 -0.58 0127 3
Madagascar 0.28 '-O 27 4 O1 031 0.29 3 §','-:O34 .0-49', 3 .' -0.79 0.37 2 '-035 -0.37 :"3- -0129 0.39 3Malawi '3 03 - .4 02 -0 14,. 0.24,, 5 4 0.06 0125 4 00 3 00 09 4 -07 06 4" -0.62 0124 5Malaysia '013-' -023, -7 K00 .2 3-1 -r0O22 .5 02 6 ,053-019 91" 0.71I 0123 7Maldives -01 ~~9 1 -0.91 0.36 1 ' - -
Mali A032, 027-- -3 0.42 0.29 3 L-onU. 051 2 -1 -0.29 0.37 2 1 14 040 2 00 05Malta l4N~Q8 2 1.41 0.29 2 -,I05"e ',0.65 1.32 0.41 1 073 V03 ' .3 07 Mauritania -0906 -0.97 0.36 1 r07 06 -166 ~2' 1-. Mauritius I2 02 3ir 1.1 02 3 '1I2'032 3 1.14 0.39 3 [.076 09'-6 3 0.17 0.27 3Mexico 0 2'2' 7]-0.11 0.25 5 K'06 2' 9 ' -0.35 0.25 6 '0.28 .'~0 IS 0Oi0.8 01'Moldova "-.-'O' 16 6 " 0.11 0.19 5 T9 0127' r-, -0120 0123 5 j:1 0'0.21 6)1. -0.46 0124 5Mongolia !-O 7 -0.27. 3 0.63 0.21 3 &O?72> O'5i 2'" 0.37 0.41 1 09 00 2] 0.02 0.39 2Morocco .Z023 05 -0.24 0.25 4 I'0140.29' 3~ 0.9 01 01 26p? -3-< 0127 0.22 6Mozambique L.d207~..3 *'-0.17 0.29 3 160".201%D001' ' 2 -0.53 0.34 3 h049<0 40-'~ -272 -0.33 0.29 4Myanmar ~ _ I 93,'t,:0A4 -4 1.75 0.25 3 L '-0 018O, ' 4.28i -0.97 0.30 3 F .25', "0"24'~ ,4 -1.46 0.32 3Namibia pO.3 2 ~'r .024Xj75j 0.47 0125 3 v~52763W 44 , 071 03'3OO 026 4J 0.04 0.26 4Nepal '. -006 -_D 036Sr- '1 0.05 0.36 1 -t0.26h-.6 - - l0I4, O052- -"J!- -
Netherlands r 11 23 6 1.64 0.25 4 rhAA O2r18< 1.48 0.26 5`I8*1Oi9 1 8 2.03 0.25 6New Zealand Ip*i924fLj 1.47 0.25 4 I 'l21 02..~J 1.42 0.28 4 £ '.i IZ.jJ 1.57 0.27 5
36

Nicaragua 5-r6 04-5 00 .5 3 F .1 03 A -0.32 0.32 3 '-.3 02 :1 -0.55 0.37 2Niger [OIl" 0.27 3~ -0.74 0129 2 -061 0.5St 2, -0.76 0.41 1 ;04) ~ f-1.39 0.77 1Nigeria '-044' 0.23 -6' -1.23 0.25 4 -1.3(6 0.26 7 -10 0.27 5 -. 0 1INorway 1.58 024 5 1 1.67 0.25 4 132 6.23 ~~~~~~~~~~~~~~~~~~~~~~~~~~~~~~~~~~~~~~~~~~~~~~~~~~~~~~~~~~~~~~~~~~~~~~~~~~~~~~~~~~~~~~~~7 1.41 ~~~~~~~~~~~~~~~~~ s V=.l.0Q' 0:21 7 I -1.32 0.22 6~~~~~~~~~~~~~~~~~~~~~~~~~~~~~~~~~~~~~~~~~~~~~~~~~~~~~~~~~1.57 132 02
-.5 1.67 0.25 4 1:3 62141 0.26 5 I13 0.0 7 1.67 0.25 6Oman rO 025- 3~~ -0.57 0.25 3 -1.00 - 0.28 4 0.91 03 3 0.5 0.24 41 0.90 0.32 3Pakistan 143 024 5 I-0.44 0.25 3 ..- 0.39. ; 026 -0.65 0.26 5 i.-O48 0.22. 6. -0.74 0.26 5Panama 0O77 9.4 r. 0.66 0.25 3 '0.57' 4 0.15 0.30 3 1rO..14-, .0.21 6 -0.28 0.32 3Papua New Guinea -0.03 0.4 J 01 .5 3 -0:48 02 4 -o0A0 0.34 2 IZO.67 -Q.24 4.,' -0.69 0.37 2Paraguay I 90 2 ¼ 042 0.25 4 .- 0.87 0.32 4 I-0.57 0.32 3 -1.120 -0.26 4 -I -1.10 0.33 3Peru 015 -0,23' "6 -0.69 0.25 4 -0r.23 '024 R1-0.53 0125 6 - 0.35-' b1 9 9 0.7 0124 6Philippines 0-0 2230.23 7 1 0.63 0.25 5 .021. '622 9 0.27 0.26 5 0-03 ~Q19 9j 0.13 0.25 6Poland 1 Q1 16 S 1.12 0.19 6 -0.69 -0.22 9j08 02 7 1 .27' 0.17- .' 0.67 0121 8Portugal -4 2 1.48 0.25 5 :1.41 '0.23 7 1.39 0.25 6 Q9.91 0.20 7~ 1.15 0.23 7Puerto Rico - - - 483 0.49 I 0.76 0.53 1 I1.38, 0.43- --- 1.26 0.52 1Qatar I14 05 3I 0.8 0.25 3 1.40. 0.28 -4 - 1.38 0.30 3 0.82 0.24 4, 048 0.32 3Romania :0. 50 -016 "7 02 .9 4 -00-.6 7 0 0.0.4 4 -. 54 0. 19. 9'I -0.57 0.26 4Russia 203 .0.16. '8' -0.19 0.19 6 -. .41 0.22 " -0.69 0122 7 -0.57 0.17 1.1 -0.59 0121 8Rwanda -11.42036 21.-- 1.17 0.36 1 -1. 160.63- - - Vt>- I Sao Tome and . 2 03 .4 - - - V0'' '..
Principe O 20 . 039. 1 36 ---
Saudi Arabia 1.07 024 4 ~-1.10 0.25 3 '031i 0.25 0.24 0.28 4 .0 022 5 -0.35 0.29 4Senegal Q.12*-2 5- -0.29 0.25 4 4,68 0.31 '< -0.87 0.32 3 .0.16 0.26 4 0.05 0.29 4Sierra Leone i -,-I,35 .2 0.27 -1.62 0.2 2 [1.26 951 2 j -1.52 0.41 1 -1.60o 0.40 2. 0.01 0.77 1Singapore I.O.UI -0.24 6 0.13 0125 6 £.44 v0.3 8 13 2 :.6 0.19 2.08 0.23 7Slovak Republic 0.99 O: 16 7. .2 01 -27 06 .3 63 ,9
Slovenia 7.07 01 7 1.03 0.19 4 0.7 024 7 1.09 012 0.70 0.19 0.57 0.26 4Solomon Islands 1'0.16 0O.39 I1 1. 17 0.36 1 - '- - - - -Somalia . - 1 ~~~~~~~~~~~~-1.69 0129 2 15S-14 .71 0.41 0 4A 170 07
South Africa r 117 0,23 7 ~~~~~~0.99 0.25 L 0.07' . 9J -0.53 0124 7 -02 '0.8A10 -0.01 0.21 8Spain 11 02If -7 1.36 012 5 [ L0l 0 012 0.58 0125 6 14$ 09 60 0123 7Sri Lanka -023 024 4 -0.16 015 3 -1A3 ~~~0.27 ' ")-1.63 0.30 3 -0 44 0.22 -0.61 0.32
Sudan A153 -0.24, 4- i 1.50 0125 3 --2:01 .2628 4. -1.73 0.34 2 '..L134 0.24- 4. 1 L70 0.37 2Suriname -063 0.28 2 0.28 0.29 2 O0:12 0.65 11-0.20 OI 1 01 .3 II-.5 07 Swaziland --0-93 0.39 1 -0.78 0.36 'V -- I-1.69 0.61 1 * -0.47 0.33 2Sweden 165 03 7 1.60 0125 4f 13; .22 9 1.41 0126 5 &1519Y0 ' -91 1.57 0.25 6Switzerland 1.73 0.23 6 1.68 0.25 5 4.1 O.2 8 1.69 0.25 6 i.9t -0.1 9 8 1.99 0.23 7Syria 149 02 3 13 01 3 -,Z $2 4 0.8 0.30 3 U 0Ž4, 4 -1.18 0.32 3Taiwan 0.83 0.23 6 0.71 0125 5 fbl 2 - . 0.94 0.26 5 0.91 019 9 j 1.29 0.25 6Tajikistan 210.69 '0. 19 '3 1-1.13 0123 2 f.~7 04- 2' -1.86 0.33 2 -13 .8 §< -1A42 0.34 2Tanzania -0.07 - 0.24 5 :-0.28 0.25 4 0i4 9,27. ~~ 0.57 0.27 5 j-4.43O.'- C23 ' 5<-I -0.49 0.22 6Thailand 0.31 0.2)4 6 I 0.22 0.25 6 OI2E 0.213' 8 0.25 0.25 6 LA) 10.19, - r : 0.01 0.23 7
37

Togo i-I 0 02-'2 -1.05 0.29 3 -06 .5 l, -. 1 03 3 5 - i -0.37 0.51 2Trinidad and.
Tobago ,0.61I .0.25 4 -] 0.95 0.25 3 4 ~70.32 0.34 2 0.062 02.5 4 0.52 0.37 2Tunisia -0.61- 0.25 4 -0.59 0.25 3 i0.02' 4127T S$ 0.66 0.28 4 1 0 023 S} 0.63 0.24 5Turkey ~~~~-0~~55 ~0.23. -7 -0.88 0.25 5 -. 5 ( 9 -0.94 0.25 6 -0, 1 01-.41 0.23 7Turkmienistan 1-1.42 . 019 2 1-1.45 0.23 2 j-Oi ,04 .0 .3 2 [ 3 0.32 -1.25 0.34 2Uganda -''~.79:- 0.24 5 ,-0.52 0.25 4 A.`3I §0.D2 7 -0.98 0.27 I-0.32 0623 5 -0.25 0.22 6Ukraine -0.31 0.16 -6 -0.05 0.19 5 Q05- 125 7 -0.24 0.22 7 ,.-0.75 09 -0.89 0.21 7United Arab I
Emirates -0:51 .0.25- ~~~3 -0.54 0.25 3 .09 ~0.29 3 0.82 0.30 3 v,0-- .2 ,3 0.4 .3 United KinGdo 1.6-. 7 1.51 0.25 5 . .0 02 .2 0.25 6 1.7 0.18 10 19 02 United States 1.24 -. 0:24. 6- 1.52 0.25 6 1.18 .23 '8 1.10 0.25 6 0.19 9 1.37 0.23 7Uruguay 1.08. 0.24 5 0.77 0.25 3 I.05 -. .2k 03 03 3 0.61 0.1 7 0.62 0.32 3Uzbekistan .1-A A 0.1I8. 5 . -1.28 0.21 4 "1~ .0.29' ;4 -0.33 0.27 4 . 0.22 5j-1.30 0.25 4Venezuela .-0.34 :,0.24 5 I 0.15 0.25 5 ~-0.33' 0.23.- -0.25 0.25 6 i-0.81 0.19 .4 -0.85 0.23 7Vietmam -Il.29' 0.24 4 -1.45 0.25 4 0.44 0.24.~•~ 0.65 0.26 5 i-0.30 0.20 6 03 .6 5West Bank 0.0 .0 I -. 3 08 -. 9 09 A .1 06 1 _ 0.37 0.70 1 -0.09 0.56 1WestemnSamoa ~ .
Yugoslavia, Federal LfrLO7 ,~~~~~~~~~O.3 1 3 2 v6277 0,037Yemen -0.63 40,2I -. 41 0.25 3 -- 1.47 0.34 2 .2 3 -. 67.3Yugoslavia, Federal~ I -
Republic of -0.09 0.17. 4' -0.71 0.19 4 1 -0.48 0.34 2 -1 42 0.26 3 1,-0.97- 0.25 3. -0.95 0.29 3Zambia -0.17 O.,24 5 I -0.05 0.25 4 -0:42 O0:27 5 10.00 0.27 5 l-0.75 01.23 S -0.40 0.22 6Zimbabwe -0O.90 20O.25 4 -0.67 0.25 4 -1.25 .0.28. 5. -0.54 0 27 5 -.1.03 0.22 5 J -1.13 0 22 6a. Est. refers to the point estimate of governance, S.E. refers to the standard error, and N refers to the number of sources in which the country appears. Governance indicators are oriented so thathigher values correspond to better outcomes, on a scale from -2.5 to 2.5. T'hese ratings are based on subjective assessments from a variety of source, are subject to substantial margins of effor asindicated, and in no way reflect the official views of the World Bank, its Executive Directors, or the countries they represent. These ratings are based on subjective assessments from a variety ofsources and are subject to substantial margins of error as indicated.
38

Appendix 3: Figures
Figure 1. Governance and per Capita Incomes in Latin America and the Caribbeana
Voice and Accountability2
y=05336x-4 1189R
2=043
05~~~~~~~~~~~~~~~~~~~~~~~~~~~~~~~~~,0
0~~~~~~~~~~~~~~~~~~~* 55 6 * 4~~~~5 *7 ~~~ ~ECU* 85 *9 95* 10
1 ^ * * ~~~~~~~~~~~~GUY * .| BLZM URt *0 JAM a PAN
U~~~~~~~~~~~~~~~~~~~~~~~~~~~~~~~~~~~~~~~~~~DMU
0
ij O 5 - *aC 85 0 5
0~~~~~~~~~~~~~~~~~~
(9 -1 s e s.* a s 1
-15 | . 0
-2
-2 5
In(Real Per Capita GDP at PPP, 1996)
Political Stability2 y =0 6089x -4 8066
R= 0 5792
15 -
1 * CRIU UR? * f
0 5 * * *MB
S; o o~~~~~~~~~~~~~~~~ NIPHNO . .rr05~~~~~~~~~~~
i 45 55 6 PR 5 9 9 5 10-0 *
U~ ~ ~ ~~~~~~~~~~~~C-10
CD~ ~~~~~~~~~~~~~~~~ O-1 5
-2 0
.3
In(Real Per Capita GDP at PPP, 1996)
Source: Authors' calculations as descnbed in text.a. The govemance ratings on the vertical axis are based on subjective assessments from a variety of sources andare subject to margins of error and in no way reflect the official view of the World Bank, its Executive Directors,of the countries they represent.
39

Figure 1. Governance and per Capita Incomes in Latin America and the Caribbeana(continued)
Government Effectiveness25
y 0 6815x -5 3762 02 R
2 = 0 6666 * .
15 *
1 " CHL
205'U~ ~ ~ ~ ~ ~~L
0
CD 9 6 6 9 5 10
0 P
* PRY
-15 Q
-2
-25
-3
In(Real Per Capita GDP at PPP, 1996)
Regulatory Quality3
2 y =0 4846x -3 7531R=0 4677
1 * O* w**U# o
0~~~~~~~~~~4
_ ! i 5 5 6. _5 wy ~~~~n 8 . 5 * EN 9 5 10
E *U * . * * SUR
a9 * * * HTIE2 -1
-2
-4-
In(Real Per Capita GDP at PPP, 1996)
Source: Authors' calculations as described in text.a. The governance ratings on the vertical axis are based on subjective assessments from a variety of sources andare subject to margins of error.
40

Figure 1. Governance and per Capita Incomes in Latin America and the Caribbeana(continued)
Rule of Law25
y 0 0685x -5 36682 R
20 6889
e4 *+
15
ZD o, | ^ * * | # ~~* .c| .4*i
> 4 5 f v BOL # 56 * * + MEX4 -1 S * **
I *E~~~oT*TO4
-2 G
oR = 0 596 *
16 6 8 9 9 5 10
'5~~ **6+
E *t * *i JF CRI /MEX
u* a,ECOL E VEN
-15 °S %IT*
-15
-2
-2 5
In(Real Per Capita GDP at PPP, 1996)
Control of Corruption2 5
41~~~~~~~
2 y0 6482x -5106
R' 0 5963
* CHL 4
1 4 4 U~~~~~~~~~~~~CRI
o
C 4~~~~~~~~~~~~~~NbBOiGM 4 VEN
0~~~~~~~~~~~~~10
-1 5
-2
In(Real Per Capita GDP at PPP, 1996)
Source Authors' calculations as described in text.a. The governance ratings on the vertical axis are based on subjective assessments from a variety of sources andare subject to margins of error.
4 1
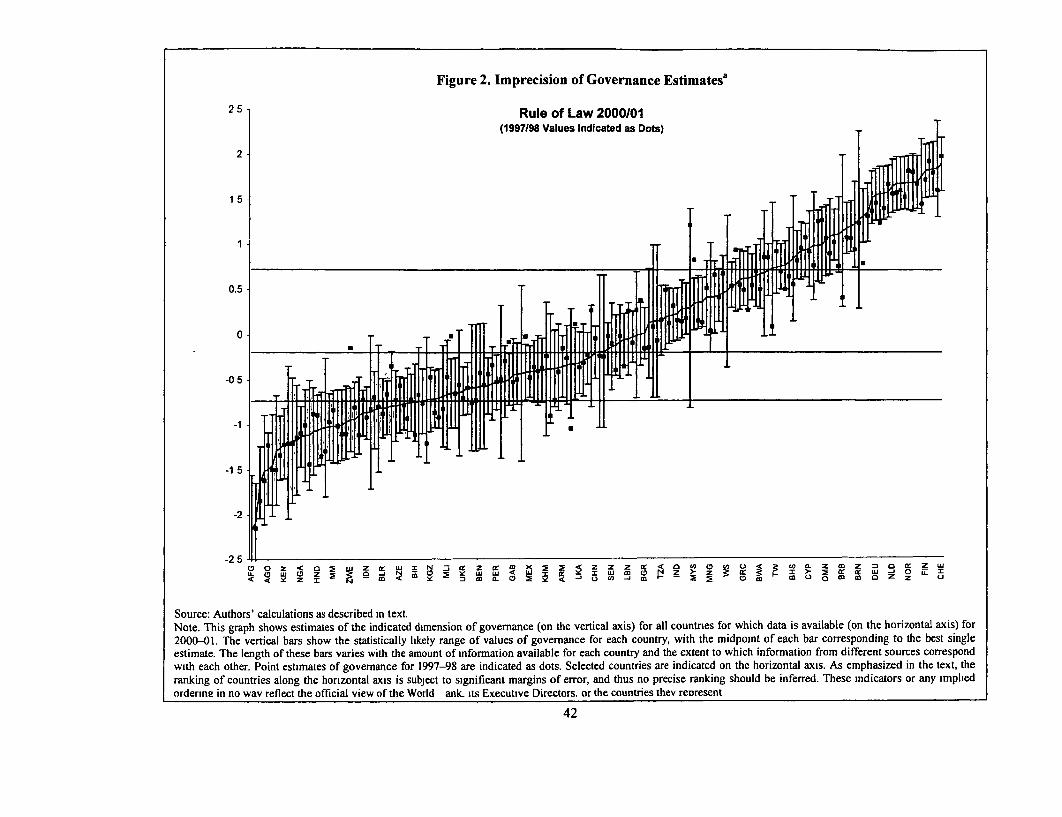
Figure 2. Imprecision of Governance Estimatesa
2 5 Rule of Law 2000/01(1997198 Values Indicated as Dots)
2 -
1 5
0.5-
-0 5
-1 5-
-25-
-25 z Nf OZ 2 2 2 CDz l:x a % 0 Fw I> z 2W .0 z a W Y Z I 2 a m 2 m ° 2 Y m ' 3 E W m a Z z Ui
1I > E a a w - oz z 2 N mm0 0 Z U
Source: Authors' calculations as described in text.Note. This graph shows estimates of the indicated dimension of govemance (on the vertical axis) for all countries for which data is available (on the horizontal axis) for2000-01. The vertical bars show the statistically likely range of values of govemance for each country, with the midpoint of each bar corresponding to the best singleestimate. The length of these bars varies with the amount of information available for each country and the extent to which information from different sources correspondwith each other. Point estimates of govemance for 1997-98 are indicated as dots. Selected countries are indicated on the horizontal axis. As emphasized in the text, theranking of countries along the horizontal axis is subject to significant margins of error, and thus no precise ranking should be inferred. These indicators or any impliedorderine in no wav reflect the official view of the World ank its Executive Directors. or the countries thev re3resent
42

Figure 3. Causal Effects of Governance op Per Capita Incomes'
IV Regression of Per Capita Income on Governance
10. . .
9 ; TTO* /VEN.
a IIEX
(5~ ~ ~ ~ ~ ~ ~~~~~8Cf . *~~~~~~~~~~~ ECU 8'a
Q~~ ~ ~~~~~~~~~ .SL Vw
a.4 / . 65.
6
55
-2 - ; .1 -0 5 0 05 1 15 2
Govemance 2000t10
First-Stage Regression of Governance on 'History'
25
22 ~~ .. .' .
, . * . . y -0 5365x + 2 3335t1S R2 03186
A-os~~~~~~~~~~~P-1 .5co * CUY ~ ~ ~ ~~~~~ CSP
-05 O S. I. PER..
-1 *- ah . .n
-2 -
-2 52 3 4 5 6 7 8
log(Seter Mortality)
Source: Authors' calculations as described in text.a The bold (solid) line in the top panel represent the IV and OLS regression lines, respectively. Thegovernance ratings are based on subjective assessments from a variety of sources and are subject to substantialmargins of error, and in no way reflect the official view of the World Bank, its Executive Directors, or thecountries they represent.
43

Figure 4. Determinants of Governance in Latin America and the Caribbeana
El Income* 'HistoryO Other
-4 -3 -2 -1 0 1 2 3 4
Governance Index
Source: Authors' calculations as described in text.a. The govemnance ratings on the vertical axis are based on subjective assessments from a variety of sources andare subject to substantial margins of error, and in no way reflect the official view of the World Bank, itsExecutive Directors, or the countries they represent
44

Figure 5. Prevalence of Different Forms of Corruption in Colombia, Honduras, and Perua
Bribes for:
Bribes to obtain PublicServices (administrative
corruption)
Public Procurement
Shaping Laws andRegulations (State
Capture)
Divenion/Improper useof Budgetary Public
Resources
5 15 25% of officials reporting frequent/very frequent form of corruption by firns
| Peru * Honduras U Colombia
Source World Bank Institute (2001).a. The graph shows the percent of public officials rating the indicated forms of bribery as being frequent or veryfrequent, based on separate surveys of public officials carried out in 2001 (different months).
45

Figure 6. Extent of State Capture in Colombia and Peru'
Impact of Bribes to:
Parliamentarians to shape laws
Public officials to shape ministeriaUpresidentialdecrees
Regulatory agencies to influence regulatory regime
Judiciary to influence judicial outcomes
Central Bank to influence policies/decisions
| * Colombia [i Peru | 40 60 80 100
% of firms report high impact of type of corruption/capture on business environment
Source. World Bank Institute Governance Diagnostic (2001).
46
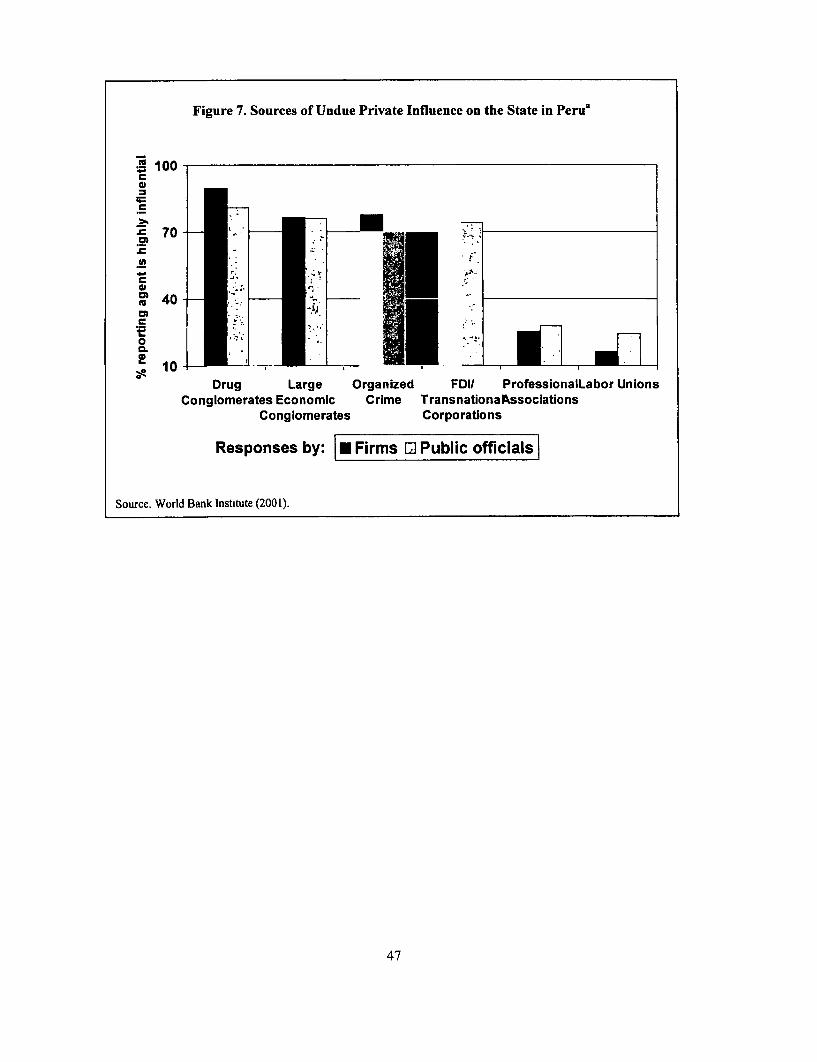
Figure 7. Sources of Undue Private Influence on the State in Perua
1000-
70 -
M
co40
CL
10 - ,Drug Large Organized FDII ProfessionalLabor Unions
Conglomerates Economic Crime TransnationalkssociationsConglomerates Corporations
Responses by: I U Firms Q Public officials
Source. World Bank Institute (2001).
47

Figure 8. Correlation between Bribery and Agency Attributes in Boliviaa
Bribery and Transparency
100high
80
;60
r 0 42
20 I-
0 20 40 60 80 1h0
low Transparency within agencies hig
Bribery and Citizen Voice/Feedback
90 high r a- 0 37
75 -
m *. .,
60-
30
Iow15
low0 20 40 60 80 9 h
Citizen Voice/Feedback mechanisma
Bribery and Pay Satisfaction
80-h.gh * r= -0.08
60 -
40 -~~~~~
20 - * ** .
0low 0 20 40 60 80 100
low Wage level saUsfacfon high
Source. Kaufmann, Mehrez and Gurgur (2002).a. The graph reports the correlation across public agencies between the indicated performance measure (on thevertical axis) and the indicated agency attribute (on the horizontal axis), based on a survey of public officials inBolivia. Transparency refers to the average of six questions relating to the openness of decision making proceduresin each agency Citizen voice or feedback refers to the average of four questions regarding the presence of formalfeedback mechanisms available to users of the institution. Wage level satisfaction refers to the fraction ofrespondents who rated their compensation as satisfactory. Each dot depicts a public agency, averaged across thepublic officials respondents for each institution.
48

References
Acemoglu, Daron, Simon Johnson, and James A. Robinson. 2001. "Colonial Origins of Comparative
Development: An Empirical Investigation." American Economic Review 91(5): 1369-401.
Beck, Thorsten, and others. 2001. "New Tools in Comparative Political Economy: The Database of
Political Institutions." World Bank Economic Review 15(1): 165-76
Easterly, William, and Ross Levine. 2002. "Tropics, Germs and Endowments." Carnegie-Rochester
Conference Series on Public Policy (forthcoming).
Efron, Bradley, and Carl Morris. 1971. "Limiting the Risk of Bayes and Empirical Bayes Estimators, part
I: The Bayes Case." Journal of the American Statistical Association 66(336): 807-15.
1972. "Limiting the Risk of Bayes and Empirical Bayes Estimator, part II: The Empirical Bayes
Case." Journal of the American Statistical Association 67(337): 130-39.
Engerman, Stanley, and Kenneth Sokoloff. 1997. "Factor Endowments, Institutions, and Differential
Paths of Growth among New World Economics: A View from Economic Historians of the United
States." In How Latin America Fell Behind: Essays on the Economic Histories of Brazil and
Mexico, 1800-1914, edited by Stephen Haber. Stanford University Press.
Goldberger, A. 1972. "Maximum Likelihood Estimation of Regressions Containing Unobservable
Independent Variables." International Economic Review 13: 1-15.
Haber, Stephen, ed. 2001. Crony Capitalism in Latin America: Theory and Evidence. Stanford University,
Hoover Institution Press.
Haber, Stephen, Noel Maurer, and Armando Razo. 2001. "The Logic of Crony Capitalism."
Mimeographed. Stanford University
Hall, Robert E., and Charles Jones. 1999. "Why Do Some Countries Produce So Much More Output per
Worker than Others?" Quarterly Journal of Economics 114(1): 83-116.
Hellman, Joel, Geraint Jones, and Daniel Kaufmann. 2001. "Seize the State, Seize the Day: State Capture,
Corruption and Influence in Transition." Policy Research Working Paper 2444. Washington:
World Bank. Forthcoming in the Journal of Comparative Economics (2002)
Hellman, Joel, and others. 2000. "Measuring Governance, Corruption, and State Capture: How Firms and
Bureaucrats Shape the Business Environment in Transition Economies." Policy Research
Working Paper 2312. Washington: World Bank.
Heston, Alan, and Robert Summers. 1991. "The Penn World Table (Mark 5): An Expanded Set of
International Comparisons, 1950-1998." Quarterly Journal of Economics, 106(2): 327-68.
(Version 5.6 released January 1995.)
49

Johnson, Simon, Peter Boone, Alasdair Breech, and Eric Friedman. 2000. "Corporate Governance in the
East Asian Financial Crisis." Journal of Financial Economics 58(1-2): 141-86.
Kaufmann, Daniel, Aart Kraay, and Pablo Zoido-Lobat6n. 1999. "Aggregating Governance Indicators."
Policy Research Department Working Paper 2195. Washington: World Bank.
. 1999. "Governance Matters." Policy Research Working Paper 2196. Washington: World Bank.
. 2002. "Governance Matters II: Updated Indicators for 2000-01." Policy Research Working
Paper 2772. Washington: World Bank.
Kaufmann, Daniel, Gil Mehrez, and Tugrul Gurgur. 2002. "Voice or Public Sector Management? An
Empirical Investigation of the Deterninants of Public Sector Performance Based on a Survey of
Public Officials in Bolivia." World Bank Institute.
Krueger, Anne 0. 2001. "Why Crony Capitalism is Bad for Growth." In Crony Capitalism in Latin
America, edited by Stephen Haber. Stanford University, Hoover Institution Press.
Rodrik, Dani. 1999. "Where Did All the Growth Go? External Shocks, Social Conflict, and Growth
Collapses." Journal of Economic Growth 4(4): 385-412.
World Bank Institute. Various years. "Governance and Anticorruption (GAC) Diagnostics," various
countries. Washington: World Bank.
50


Policy Research Working Paper Series
ContactTitle Author Date for paper
WPS291 0 Boondoggles and Expropriation: Philip Keefer October 2002 P. Sintim-AboagyeRent-Seeking and Policy Distortion Stephen Knack 38526when Property Rights are Insecure
WPS2911 Micro-Level Estimation of Welfare Chris Elbers October 2002 P. SaderJean 0 Lanjouw 33902Peter Lanjouw
WPS2912 Short-Run Pain, Long-Run Gain. Graciela Laura Kaminsky October 2002 E KhineThe Effects of Financial Sergio L. Schmukler 37471Liberalization
WPS2913 Financial Development and Dynamic Inessa Love October 2002 K LabrieInvestment Behavior Evidence from Lea Zicchino 31001Panel Vector Autoregression
WPS2914 The Impact of Cash Budgets on Hinh T. Dinh October 2002 D. SidibePoverty Reduction in Zambia. A Case Abebe Adugna 35074Study of the Conflict between Well- Bernard MyersIntentioned Macroeconomic Policyand Service Delivery to the Poor
WPS2915 Federal Politics and Budget Deficits Stuti Khemani October 2002 H SladovichEvidence from the States of India 37698
WPS2916 Ex-ante Evaluation of Conditional Franiois Bourguignon October 2002 P. SaderCash Transfer Programs: The Case Francisco H G Ferreira 33902of Bolsa Escola Phillippe G Leite
WPS2917 Economic Development, Competition Bernard Hoekman October 2002 R MartinPolicy, and the World Trade Petros C Mavroidis 39065Organization
WPS2918 Reducing Agricultural Tariffs versus Bernard Hoekman October 2002 R MartinDomestic Support What's More Francis Ng 39065Important for Developing Countnes9 Marcelo Olarreaga
WPS2919 Financial Regulatory Harmonization Cally Jordan October 2002 H Issaand the Globalization of Finance Giovanni Majnoni 30154
WPS2920 Social Polarization, Political Philip Keefer October 2002 P Sintim-AboagyeInstitutions, and Country Stephen Knack 37656Creditworthiness
WPS2921 Initial Conditions and Incentives for Bernard Hoekman October 2002 P FlewittArab Economic Integration: Can the Patrick Messerlin 32724European Community's SuccessBe Emulated9
WPS2922 "Does Globalization Hurt the Poor? Pierre-Richard Agenor October 2002 M. Gosiengfiao33363
WPS2923 Does Foreign Direct Investment Beata K Smarzynska October 2002 P FlewittIncrease the Productivity of Domestic 32724Firms? In Search of Spillovers throughBackward Linkages
WPS2924 Financial Development, Property Stijn Claessens November 2002 R VoRights, and Growth Luc Laeven 33722

Policy Research Working Paper Series
ContactTitle Author Date for paper
WPS2925 Crime and Local Inequality in Gabriel Demombynes November 2002 P. SaderSouth Africa Berk Ozler 33902
WPS2926 Distinguishing between Rashmi Shankar November 2002 P. HoltObservationally Equivalent Theories 37707of Crises
WPS2927 Military Expenditure: Threats, Aid, Paul Collier November 2002 A. Kitson-Waltersand Arms Races Anke Hoeffler 33712