Set theory Neha Barve Lecturer Bioinformatics School Of Biotechnology, DAVV, Indore.

Zurich Open Repository andArchiveUniversity of ZurichMain LibraryStrickhofstrasse 39CH-8057 Zurichwww.zora.uzh.ch
Year: 2013
Growth temperature and genome size in bacteria are negatively correlated,suggesting genomic streamlining during thermal adaptation
Sabath, Niv; Ferrada, Evandro; Barve, Aditya; Wagner, Andreas
Abstract: Prokaryotic genomes are small and compact. Either this feature is caused by neutral evolutionor by natural selection favoring small genomes-genome streamlining. Three separate prior lines of evidenceargue against streamlining for most prokaryotes. We find that the same three lines of evidence argue forstreamlining in the genomes of thermophile bacteria. Specifically, with increasing habitat temperatureand decreasing genome size, the proportion of genomic DNA in intergenic regions decreases. Furthermore,with increasing habitat temperature, generation time decreases. Genome-wide selective constraints donot decrease as in the reduced genomes of host-associated species. Reduced habitat variability is not alikely explanation for the smaller genomes of thermophiles. Genome size may be an indirect target ofselection due to its association with cell volume. We use metabolic modeling to demonstrate that knownchanges in cell structure and physiology at high temperature can provide a selective advantage to reducecell volume at high temperatures.
DOI: https://doi.org/10.1093/gbe/evt050
Posted at the Zurich Open Repository and Archive, University of ZurichZORA URL: https://doi.org/10.5167/uzh-88323Journal ArticlePublished Version
Originally published at:Sabath, Niv; Ferrada, Evandro; Barve, Aditya; Wagner, Andreas (2013). Growth temperature andgenome size in bacteria are negatively correlated, suggesting genomic streamlining during thermal adap-tation. Genome Biology and Evolution, 5(5):966-977.DOI: https://doi.org/10.1093/gbe/evt050

Growth Temperature and Genome Size in Bacteria Are
Negatively Correlated, Suggesting Genomic Streamlining
During Thermal Adaptation
Niv Sabath1,*, Evandro Ferrada2, Aditya Barve3,4, and Andreas Wagner2,3,4,*1Department of Immunology, Weizmann Institute of Science, Rehovot, Israel2The Santa Fe Institute, Santa Fe, New Mexico3Institute of Evolutionary Biology and Environmental Studies, University of Zurich, Switzerland4The Swiss Institute of Bioinformatics, Basel, Switzerland
*Corresponding authors: [email protected]; [email protected].
Accepted: March 25, 2013
Abstract
Prokaryotic genomes are small and compact. Either this feature is caused by neutral evolution or by natural selection favoring small
genomes—genome streamlining. Three separate prior lines of evidence argue against streamlining for most prokaryotes. We find
that the same three lines of evidence argue for streamlining in the genomes of thermophile bacteria. Specifically, with increasing
habitat temperatureanddecreasinggenomesize, theproportionofgenomicDNA in intergenic regionsdecreases. Furthermore,with
increasing habitat temperature, generation time decreases. Genome-wide selective constraints do not decrease as in the reduced
genomes of host-associated species. Reduced habitat variability is not a likely explanation for the smaller genomes of thermophiles.
Genomesizemaybean indirect targetof selectiondueto its associationwithcell volume.Weusemetabolicmodeling todemonstrate
that known changes in cell structure and physiology at high temperature can provide a selective advantage to reduce cell volume at
high temperatures.
Key words: streamlining, genome evolution, thermophilic bacteria.
Introduction
Prokaryotic genomes are compact and contain little intergenic
DNA compared with eukaryotes. Their compactness is often
believed to be driven by genome streamlining, that is, by nat-
ural selection favoring a small genome (Doolittle and Sapienza
1980; Orgel and Crick 1980; Dufresne et al. 2005; Giovannoni
et al. 2005; Ranea et al. 2005). Streamlining has sometimes
been used to denote genome reduction caused by random
genetic drift (Lynch 2006), but we refer to it here only if
selection favors a small genome. Such streamlining might
keep cell division times short, and thus ensure fast reproduc-
tion. It might also keep energy consumption for the synthesis
of nucleotide precursors low. Although these arguments for
the importance of streamlining would apply to many
eukaryotes as well, the population genetic conditions for
streamlining are more favorable in prokaryotes. Specifically,
prokaryotes have larger population sizes than eukaryotes. In
larger populations, selection—including selection for small
genome sizes—is more powerful (Hartl and Clark 1997;
Lynch 2007).
Although streamlining is an attractive concept, there are
only few examples of it, all of which involve marine bacteria
(Dufresne et al. 2005; Giovannoni et al. 2005; Yooseph et al.
2010) (all references to bacteria throughout the article refer to
the domain Eubacteria). Giovannoni et al. (2005) showed that
the Pelagibacter ubique genome—the smallest known
genome of a free-living organism at the time—contains the
smallest intergenic regions. Dufresne et al. (2005) showed that
genome reduction in two Prochlorococcus species is associ-
ated with loss of several DNA-repair genes, leading to muta-
tional bias and increased rate of evolution, similar to what is
observed in some endosymbionts and pathogens. Yooseph
et al. (2010) showed that the most abundant picoplankton
species are characterized by small genomes and cells, and
hypothesized that small cells are advantageous for decreasing
predation. Several comparative genomics analyses suggest
GBE
� The Author(s) 2013. Published by Oxford University Press on behalf of the Society for Molecular Biology and Evolution.
This is an Open Access article distributed under the terms of the Creative Commons Attribution Non-Commercial License (http://creativecommons.org/licenses/by-nc/3.0/), which permits
non-commercial re-use, distribution, and reproduction in any medium, provided the original work is properly cited. For commercial re-use, please contact [email protected]
966 Genome Biol. Evol. 5(5):966–977. doi:10.1093/gbe/evt050 Advance Access publication April 5, 2013
at Zentralbibliothek on January 9, 2014
http://gbe.oxfordjournals.org/D
ownloaded from
that examples like these may be the exception rather than the
rule (Mira et al. 2001; Touchon and Rocha 2007; Koonin and
Wolf 2008; Kuo et al. 2009; Vieira-Silva and Rocha 2010).
Specifically, these studies found three lines of evidence that
argue against widespread streamlining in prokaryotes and in
favor of genetic drift as the predominant force behind com-
pact prokaryotic genomes.
First, if streamlining occurred, noncoding regions should
become preferentially reduced in size compared with
protein-coding regions, because at least parts of these regions
are more likely to be dispensable (Mira et al. 2001; Kuo et al.
2009). Their greater dispensability is suggested by patterns of
molecular evolution, such as that more insertions and dele-
tions can be tolerated in intergenic regions (Moran et al.
2009). However, the proportion of noncoding DNA in previ-
ously analyzed prokaryotic genomes is not correlated with
genome size (Mira et al. 2001; Kuo et al. 2009). Second,
generation time (cell division rate), a prime candidate for a
quantity to be subject to selection, shows no relationship
with genome size (Mira et al. 2001; Touchon and Rocha
2007; Vieira-Silva and Rocha 2010). Third, if streamlining
occurred, the strength of selection to remove nonessential
regions should be the highest in small genomes. The strength
of selection can be estimated via the nonsynonymous/synon-
ymous substitution rate ratio (dN/dS) in protein-coding genes.
The smaller this ratio, the slower is the average rate of protein
evolution, and the greater are genome-wide evolutionary con-
straints. In contrast to what would be expected for streamlin-
ing—if selection on protein-coding genes correlates with
selection on genome streamlining—comparative studies
show that larger genomes, not smaller genomes, are under
stronger selective constraints (Koonin and Wolf 2008; Kuo
et al. 2009).
Extant bacterial genomes are the end-products of a
genome size evolution process that is difficult to study in
time, because their extinct ancestors and their genome sizes
are unknown. To date, this process has been studied only for
one group of organisms, obligate parasites and (endo)symbi-
onts, where a strong reduction in genome size has occurred,
and was caused by genetic drift (Mira et al. 2001; Daubin and
Moran 2004; Kuo et al. 2009). The reasons lie in these organ-
isms’ biology. Many of them live in a relatively unvarying
environment provided by their host. The host also provides
metabolites or gene products essential to their life, such that
many genes in their genomes have become superfluous
(Moran and Wernegreen 2000). Moreover, these organisms
also have small population sizes (Mira and Moran 2002),
where selection is weaker than in large populations. Under
these conditions, large genomic regions can be removed
through DNA deletions that are effectively neutral (Mira
et al. 2001; Moran et al. 2009).
Previous genome-wide analyses of prokaryotes evolution-
arily adapted to high temperature have revealed several
genomic footprints of thermophilic adaptation. First, the
G + C content of helical regions in rRNA secondary structures
increases with growth temperature (Galtier and Lobry 1997).
Second, thermophiles tend to contain proteins specifically
required for life at high temperatures (Forterre 2002;
Makarova et al. 2003). Third, the frequency of specific
amino acids and nucleotides correlate with growth tempera-
ture (Zeldovich et al. 2007; Vieira-Silva and Rocha 2010). Here,
we propose an additional genomic signature of thermophilic
adaptation: small genome size. We also show that the three
lines of evidence we discussed earlier speak in favor of stream-
lining for thermophiles. This evidence suggests that small
genome size, or an unknown factor highly correlated with
it, is advantageous in adaptation to higher temperature.
Thus, streamlining may not occur in all prokaryotes, but it
occurs in some.
Materials and Methods
Collecting Species Information
We obtained the genome sequences and annotation of 1,553
prokaryotes from the National Center for Biotechnology
Information (NCBI; ftp://ftp.ncbi.nlm.nih.gov/genomes/geno
meprj/). A classification of growth temperature range
(psychrophilic, mesophilic, thermophilic, and hyperthermo-
philic) exists for 1,283 of these species. Habitat classification
(host-associated, specialized, aquatic, multiple, and terrestrial)
exists for 1,225 species (ftp://ftp.ncbi.nlm.nih.gov/genomes/
genomeprj/). We analyzed those 1,155 species further for
which both a growth temperature range and a habitat classi-
fication is available. A specific (numerical) growth temperature
is available for 518 species (453 bacteria and 65 archaea) and
can be obtained from ftp://ftp.ncbi.nlm.nih.gov/genomes/gen
omeprj/. In cases where this temperature is given in the form
of a range, we used the mean value of this range. A specific
growth temperature and habitat classification is available for
494 species.
Testing for Phylogenetic Dependency
For the phylogenetic analysis, we used data from Vieira-Silva
and Rocha (2010). These data consist of a curated list of
growth-temperature for 214 species as well as the corre-
sponding 16S rRNA multiple sequence alignment and phylo-
genetic tree. We matched the list of species to the NCBI data
and excluded eukaryotes and species with host-associated
habitats. To the remaining 115 species (94 bacteria and 21
archaea), we applied coevol (Lartillot and Poujol 2011), a
Bayesian Markov Chain Monte Carlo sampling software for
comparative analyses, to test for correlation between growth
temperature and genome size. The program takes as an input
a multiple sequence alignment, a matrix of continuous char-
acters, and a phylogenetic tree. It then jointly estimates key
evolutionary parameters (e.g., evolutionary rate, dN/dS ratio)
Growth Temperature and Genome Size in Bacteria GBE
Genome Biol. Evol. 5(5):966–977. doi:10.1093/gbe/evt050 Advance Access publication April 5, 2013 967
at Zentralbibliothek on January 9, 2014
http://gbe.oxfordjournals.org/D
ownloaded from

and the correlations between the characters corrected for
phylogenetic dependencies (Lartillot and Poujol 2011).
Estimation of dN/dS Ratios
We first identified pairs of closely related taxa in the following
way: We identified the 16S rRNA processing (RimM) protein in
88 thermophile and 182 nonthermophile genomes. We
aligned protein sequences of each group using MAFFT
(Katoh et al. 2002) and constructed corresponding phyloge-
netic trees with the neighbor-joining method (Saitou and Nei
1987). We trimmed trees to include only pairs of closely
related species with RimM divergence of 1–15%, resulting
in 9 and 31 phylogenetically independent pairs of thermo-
philes and nonthermophiles, respectively. We used
BlastClust (http://www.ncbi.nlm.nih.gov/IEB/ToolBox/C_DOC/
lxr/source/doc/blast/blastclust.html) to identify 32 clusters of
single-copy orthologous genes that are present in the ge-
nomes of all pairs (species pairs and nucleotide sequences of
all orthologous genes are listed in supplementary file S1,
Supplementary Material online). Further, we excluded species
pairs in which less than 10 of the genes had nucleotide identity
between 75% and 95% (sui for dN/dS analysis), resulting in 8
and 16 pairs of thermophiles and nonthermophiles, respec-
tively. Finally, we estimated dN/dS ratios using Goldman and
Yang’s Maximum-Likelihood method (Goldman and Yang
1994), implemented in the Matlab Bioinformatics toolbox.
An analysis without the exclusion of species pairs and genes
on basis of nucleotide identity resulted in qualitatively similar
results (not shown).
Analysis of Protein Length and Protein Family Size
We used Pfam version 23 (Finn et al. 2010). This Pfam release
contains 13,672 families. We included only families with se-
quences between 50 and 500 amino acids (11,771). We used
the software HMMER (Eddy 1998) to annotate protein fami-
lies in the thermophile and nonthermophile proteomes, em-
ploying the gathering cut-off criterion that minimizes false
positives. In this way, we identified 6,654 single-domain fam-
ilies whose domains are covered over at least 90% by the
hmm model. Of them, 19 families are present in all the studied
genomes (table 3). For each protein family within each
genome, we calculated the average protein length and the
number of proteins per protein family. We then calculated the
average protein length and the average number of proteins
per protein family for the 19 families over all genomes.
Results
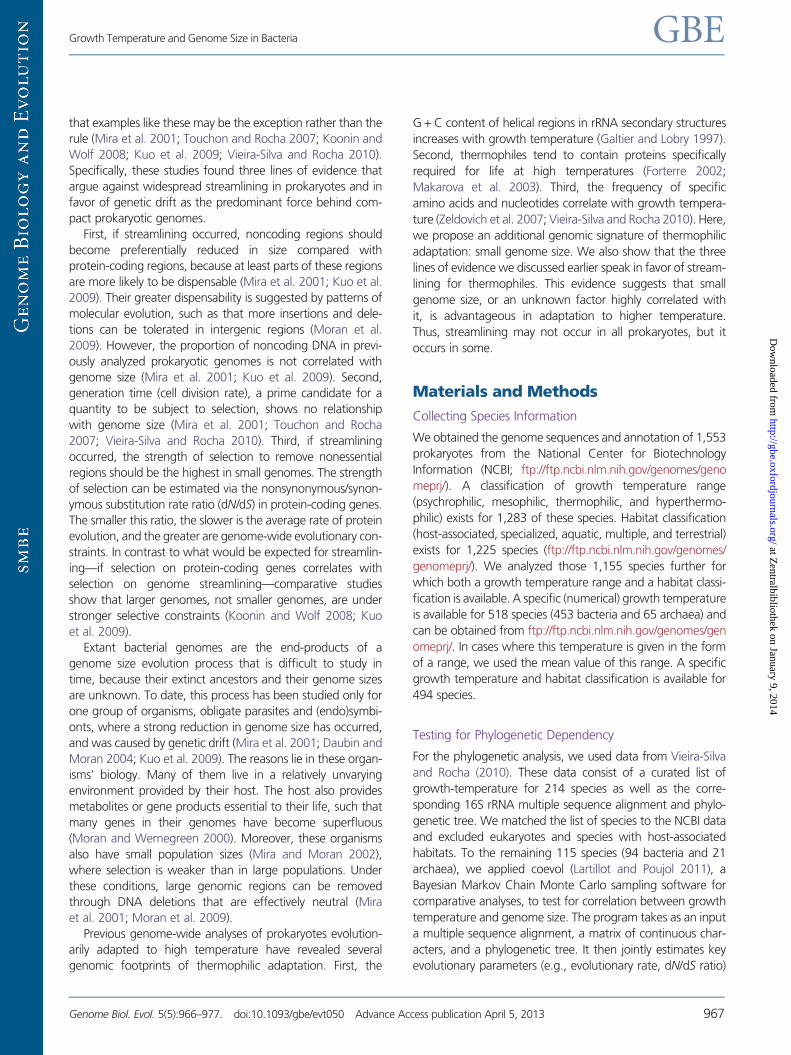
Figure 1a shows the distributions of genome sizes among
prokaryotes with different growth temperature ranges
(psychrophilic, mesophilic, thermophilic, and hyperthermo-
philic). We found that species living in warmer temperatures
tend to have smaller genomes. The differences in genome size
between mesophiles, thermophiles, and hyperthermophiles
are significant (Wilcoxon rank-sum test, P<1.9�10�5 and
P<7.9�10�3 for mesophiles–thermophiles and thermo-
philes–hyperthermophiles, respectively), but not between
psychrophiles and mesophiles (Wilcoxon rank-sum test,
P¼0.082). To the best of our knowledge, no such association
has been described before.
Why are genome size and growth temperature negatively
associated? One possibility is that both are associated with a
third, confounding factor. A prominent candidate is the extent
to which the environment varies. It is easy to see why envi-
ronmental variability could be associated with genome size
(Parter et al. 2007; Rodrigues and Wagner 2009). For exam-
ple, free living organisms in which the availability of different
nutrients varies greatly need to have metabolic enzymes to
metabolize each nutrient. Such organisms would need to have
larger genomes, to accommodate all the genes that encode
these enzymes. In a relevant study of 117 bacterial species,
Parter et al. (2007) have shown that bacteria living in more
variable environments tend to have larger metabolic networks
with more enzymatic reactions. Conversely, organisms that
live in environments with low variability, such as parasites
or symbionts that live in close association with a host organ-
ism—which provides an unchanging environment—tend to
have smaller genomes (Moran and Wernegreen 2000; Mira
et al. 2001). Perhaps, we reasoned, organisms in high
temperature habitats simply experience less environmental
variability.
Data on environmental variability are difficult to come by,
especially if needed for many organisms. We here used a clas-
sification of environments available from the NCBI (Wheeler
et al. 2008) ftp://ftp.ncbi.nlm.nih.gov/genomes/genomeprj/).
We follow the definition of habitat variability from (Parter
et al. 2007) to order habitats according to increasing variability
as host-associated, specialized, aquatic, multiple, and terres-
trial. Using this classification of habitats, we found that the
distributions of genome sizes indeed differ between
habitats (Wilcoxon rank-sum test, P< 0.018, P<0.0005,
P<0.0028, for specialized-aquatic, aquatic-multiple, and
multiple-terrestrial habitats, respectively), with the exception
of host-associated habitats (Wilcoxon rank-sum test,
P¼0.67, for comparison between host-associated and spe-
cialized). Genome size decreases in less variable habitats
(fig. 1b).
We next asked which of the two factors, habitat temper-
ature or variability, affects genome size more strongly? To
answer this question, we performed a two-way analysis of
variance (ANOVA) with growth temperature and habitat as
the independent factors. We found that the effect of growth
temperature is significant (P¼0.0002), whereas there is no
significant effect of habitat, and no significant interaction
(P¼ 0.52, P¼0.60, respectively). In a next analysis, we used
494 species for which data on growth temperature and hab-
itat is available (NCBI), to examine the association between
Sabath et al. GBE
968 Genome Biol. Evol. 5(5):966–977. doi:10.1093/gbe/evt050 Advance Access publication April 5, 2013
at Zentralbibliothek on January 9, 2014
http://gbe.oxfordjournals.org/D
ownloaded from
genome size and temperature within each habitat type (fig. 2a
and table 1). Within each habitat type, temperature is nega-
tively correlated with genome size, the only exception being
host-associated organisms (table 1). The correlations within
habitat types support the ANOVA result and suggest a
direct effect of growth temperature on genome size.
Subsequently, we asked whether the association between
genome size and growth temperature differs between bacte-
ria and archaea. We found that the association is much
stronger in bacteria than in archaea, especially when host-as-
sociated species are excluded (fig. 2b and table 1).
The phylogenetic relationship between species is a poten-
tial source of error in analyses like ours, because the species
share an evolutionary history and are thus not independent
(Felsenstein 2008). We therefore tested whether the associa-
tion between genome size and growth temperature holds
when the phylogenetic dependencies between the species
are controlled for. To this end, we used an approach proposed
by (Lartillot and Poujol 2011) and implemented in the software
coevol to test for correlation between growth temperature
and genome size within bacteria and archaea. The approach
corrects for spurious associations due to shared evolutionary
2 4 6 8 10
20
40
60
80
100
Genome Size (Mbp)
Gro
wth
Tem
pera
ture
(C
)
(a) TerrestrialMultipleAquaticSpecialized
2 4 6 8 10
20
40
60
80
100
Genome Size (Mbp)
Gro
wth
Tem
pera
ture
(C
)
(b) BacteriaArchaea
FIG. 2.—(a) Growth temperature and genome size of species from different habitat types. (b) Growth temperature and genome size of species from
different kingdoms. See table 1 for statistical analysis.
Hyperthermophilic
Thermophilic
Mesophilic
Psychrophilic
Terrestrial
Multiple
Aquatic
Specialized
Host-associated
(a) (b)
***
**
**
***
*
* p < 0.05** p < 0.01
*** p < 0.001
0 2 4 6 8 10 12Genome Size (Mbp)
0 2 4 6 8 10 12Genome Size (Mbp)
FIG. 1.—(a) Distribution of genome sizes among prokaryotes with different growth temperature ranges. The differences in genome size between
mesophiles, thermophiles, and hyperthermophiles are significant (Wilcoxon rank-sum test, P< 1.9�10�5 and P< 7.9� 10�3 for mesophiles–thermophiles
and thermophiles–hyperthermophiles, respectively), but not between psychrophiles and mesophiles (Wilcoxon rank-sum test, P¼ 0.082). (b) Distribution of
genome sizes among different habitats. Habitats are ordered according to environmental variability from unvarying (host-associated) to the most variable
environment (terrestrial). The distributions of genome sizes differ between habitats (Wilcoxon rank-sum test, P< 0.018, P< 0.0005, P< 0.0028, for
specialized-aquatic, aquatic-multiple, and multiple-terrestrial, respectively), with the exception of host-associated habitats (Wilcoxon rank-sum test,
P¼ 0.67, for comparison between host-associated and specialized). The red vertical marks are the medians, the edges of the box are the 25th and 75th
percentiles, the whiskers extend to the most extreme data points not considered outliers (99% of all data if the data are normally distributed) and outliers are
plotted individually as red crosses.
Growth Temperature and Genome Size in Bacteria GBE
Genome Biol. Evol. 5(5):966–977. doi:10.1093/gbe/evt050 Advance Access publication April 5, 2013 969
at Zentralbibliothek on January 9, 2014
http://gbe.oxfordjournals.org/D
ownloaded from

history and accounts for potential uncertainties in the
phylogenetic relationships of species. In this analysis, we
used a 16S rRNA phylogenetic tree delineating the phyloge-
netic relationships among 214 species for which curated
information on growth temperatures is available (Vieira-Silva
and Rocha 2010). We excluded eukaryotes and species with
host-associations from this analysis, which left us with 115
species (94 bacteria and 21 archaea). We found a significant
negative correlation between genome size and temperature in
bacteria (posterior probability of 0.04), but not in archaea
(posterior probability of 0.58). Hence, the correlation between
genome size and temperature in archaea may be due to
shared evolutionary history. We therefore focus in the remain-
der of our analyses solely on bacteria.
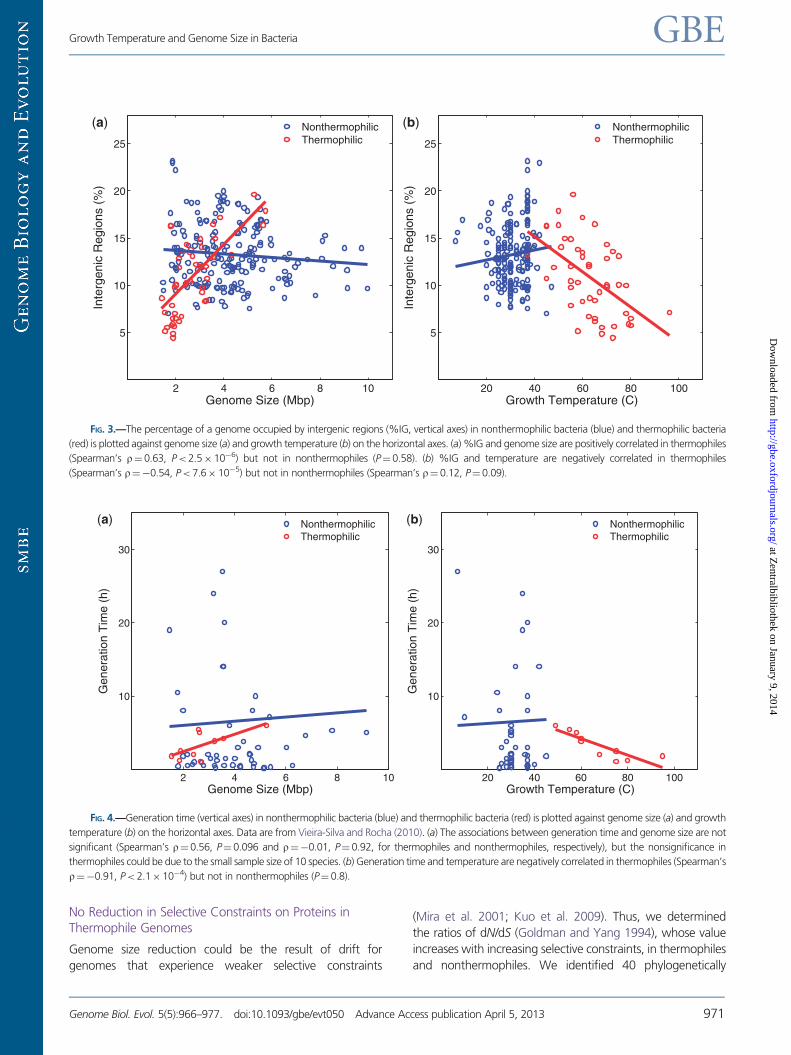
Percentage of Intergenic DNA Correlates with GenomeSize and Growth Temperature
If selection acts to decrease the size of a genome, the size
reduction should preferentially affect the regions of a genome
that are least constrained (Mira et al. 2001; Kuo et al. 2009).
These regions are the intergenic regions (Moran et al. 2009).
Bacterial genomes in general do not meet this criterion, which
is one major earlier line of evidence against streamlining in
bacteria (Mira et al. 2001; Kuo et al. 2009). To ask whether
this criterion is met for our study organisms, we examined the
percentage of a genome’s DNA contained in intergenic
regions (denoted as %IG) separately for thermophilic and
nonthermophilic bacteria. Specifically, we calculated %IG
for thermophilic and hyperthermophilic bacteria together—
we refer to these groups as thermophiles for brevity—and
for nonthermophilic bacteria (mesophiles and psychrophiles).
Table 2 shows that thermophiles have lower %IG than
nonthermophiles, a difference that is statistically significant
(P¼ 0.0003, Wilcoxon rank-sum test). We also note that the
%IG of thermophiles living at the highest temperatures (above
65 �C) is especially low (table 2).
We next compared %IG and genome size (fig. 3a) and
found a strong positive correlation in thermophiles
(Spearman’s r¼0.63, P<2.5�10�6). That is, those ge-
nomes of thermophiles that are small also contain a smaller
percentage of their DNA in noncoding regions. In contrast, we
found no such correlation between %IG and genome size in
nonthermophiles (P¼0.58, fig. 3a). Intriguingly, the percent-
age of intergenic DNA is also negatively correlated with
growth temperature in thermophiles (Spearman’s r¼�0.54,
P<7.6�10�5, fig. 3b). In other words, those thermophiles
growing at higher temperatures are affected to a greater
extent by streamlining. Such an association is absent for meso-
philes (Spearman’s r¼0.12, P¼0.09, fig. 3b), suggesting
that streamlining occurs at the higher growth temperatures
that are characteristic of thermophiles, but not at the lower
growth temperatures characteristic of mesophiles. As ex-
pected, we found similar trends as with %IG when we exam-
ined the gene density (i.e., the number of genes in a genome
divided by genome size) in thermophiles and nonthermophiles
(data not shown).
Generation Time
The compactness of prokaryotic genomes has often been at-
tributed to selection for short generation times (reviewed in
Lynch 2006). However, so far there has been no evidence
supporting this view (Mira et al. 2001; Touchon and Rocha
2007; Vieira-Silva and Rocha 2010). For example, Vieira-Silva
and Rocha (2010) have examined the generation times of 214
prokaryotes and found no correlation with genome size. We
re-analyzed the data from Vieira-Silva and Rocha (2010), ex-
cluding host-associated species, and differentiated between
thermophilic and nonthermophilic bacteria (fig. 4). In agree-
ment with Vieira-Silva and Rocha (2010), we found no signif-
icant correlation between generation time and genome size,
either in thermophiles (r¼0.56, P¼ 0.096) or in nonthermo-
philes (r¼�0.01, P¼0.92, fig. 4a). However, we noted a
conspicuous positive association for thermophiles (fig. 4a),
whose nonsignificance could be due to the small sample
size of 10 species. Highly intriguing is moreover that thermo-
philes that live at higher temperatures also divide significantly
faster (Spearman’s r¼�0.91, P< 2.1� 10�4, fig. 4b), an as-
sociation that is absent for nonthermophiles (P¼0.8). Such an
association is expected if increasing temperature favors
shorter generation times.
Table 1
Statistical Association between Growth Temperature and Genome Size
Number
of Species
Spearman’s o P
Habitat
Host associated 173 �0.14 0.063
Specialized 83 �0.56 3.75�10�8
Aquatic 65 �0.66 2.29�10�9
Multiple 145 �0.45 1.29�10�8
Terrestrial 28 �0.63 3.50�10�4
Kingdom
Bacteria 453 (260) �0.43 (�0.56) 4.86�10�22 (4.06�10�23)
Archaea 65 (61) �0.36 (�0.36) 0.0034 (0.0048)
All 518 (321) �0.48 (�0.64) 4.46�10�31 (6.78�10�38)
NOTE.—Numbers in parentheses indicate values after excluding host-associatedspecies.
Table 2
Percentage of Intergenic Regions
Number
of Genomes
% Intergenic Regions,
Mean (SD)
Nonthermophiles 192 13.3 (3.2)
Thermophiles 48 10.8 (4.0)
Thermophiles above 65 �C 22 8.8 (3.4)
Sabath et al. GBE
970 Genome Biol. Evol. 5(5):966–977. doi:10.1093/gbe/evt050 Advance Access publication April 5, 2013
at Zentralbibliothek on January 9, 2014
http://gbe.oxfordjournals.org/D
ownloaded from
No Reduction in Selective Constraints on Proteins inThermophile Genomes
Genome size reduction could be the result of drift for
genomes that experience weaker selective constraints
(Mira et al. 2001; Kuo et al. 2009). Thus, we determined
the ratios of dN/dS (Goldman and Yang 1994), whose value
increases with increasing selective constraints, in thermophiles
and nonthermophiles. We identified 40 phylogenetically
2 4 6 8 10
10
20
30
Genome Size (Mbp)
Gen
erat
ion
Tim
e (h
)
(a) NonthermophilicThermophilic
20 40 60 80 100
10
20
30
Growth Temperature (C)
Gen
erat
ion
Tim
e (h
)
(b) NonthermophilicThermophilic
FIG. 4.—Generation time (vertical axes) in nonthermophilic bacteria (blue) and thermophilic bacteria (red) is plotted against genome size (a) and growth
temperature (b) on the horizontal axes. Data are from Vieira-Silva and Rocha (2010). (a) The associations between generation time and genome size are not
significant (Spearman’s r¼ 0.56, P¼ 0.096 and r¼�0.01, P¼ 0.92, for thermophiles and nonthermophiles, respectively), but the nonsignificance in
thermophiles could be due to the small sample size of 10 species. (b) Generation time and temperature are negatively correlated in thermophiles (Spearman’s
r¼�0.91, P< 2.1�10�4) but not in nonthermophiles (P¼ 0.8).
2 4 6 8 10
5
10
15
20
25
Genome Size (Mbp)
Inte
rgen
ic R
egio
ns (
%)
(a) NonthermophilicThermophilic
20 40 60 80 100
5
10
15
20
25
Growth Temperature (C)In
terg
enic
Reg
ions
(%
)
(b) NonthermophilicThermophilic
FIG. 3.—The percentage of a genome occupied by intergenic regions (%IG, vertical axes) in nonthermophilic bacteria (blue) and thermophilic bacteria
(red) is plotted against genome size (a) and growth temperature (b) on the horizontal axes. (a) %IG and genome size are positively correlated in thermophiles
(Spearman’s r¼ 0.63, P<2.5�10�6) but not in nonthermophiles (P¼0.58). (b) %IG and temperature are negatively correlated in thermophiles
(Spearman’s r¼�0.54, P< 7.6� 10�5) but not in nonthermophiles (Spearman’s r¼ 0.12, P¼0.09).
Growth Temperature and Genome Size in Bacteria GBE
Genome Biol. Evol. 5(5):966–977. doi:10.1093/gbe/evt050 Advance Access publication April 5, 2013 971
at Zentralbibliothek on January 9, 2014
http://gbe.oxfordjournals.org/D
ownloaded from

independent pairs of closely related taxa (9 thermophile
pairs and 31 nonthermophile pairs). Within the genome of
these pairs, we identified 32 groups of single-copy
orthologous genes that are present in all genomes. We
excluded species pairs from our analysis in which less than
10 gene pairs had a nucleotide identity between 75% and
95% (suitable for analysis of dN/dS), resulting in 8 and 16
pairs of thermophile and nonthermophile species, respectively.
Comparison between average dN/dS ratios shows lower
dN/dS values in thermophiles (average dN/dS¼0.039
and 0.048 for thermophiles and nonthermophiles, respec-
tively), but the difference is not significant (p¼0.0922,
Wilcoxon rank-sum test). We found no significant correlation
between average dN/dS and genome size, either in thermo-
philes (P¼ 0.58) or in nonthermophiles (P¼ 0.39, fig. 5a).
Similarly, we found no significant correlation between average
dN/dS and temperature, either in thermophiles (P¼0.11) or in
nonthermophiles (P¼0.11, fig. 5b), but future analysis with
larger samples might reveal a negative association in thermo-
philes. A previous study compared 17,957 pairs of ortholo-
gous genes from 22 pairs of closely related species and
reported lower dN/dS values in both bacterial and archaeal
thermophiles compared with mesophiles (Friedman et al.
2004). Although our analysis did not show an equivalent
significant decrease in dN/dS ratios (possibly because
Friedman et al. used different genes from their species
pairs), it shows that selective constraints are not weaker in
thermophiles (as they are in obligate parasites and endosym-
bionts). Thus, genome size reduction is unlikely to be the result
of drift.
Distinct Characteristics of Protein Families inThermophile Genomes
Thermophile genomes contain unique protein families
(Makarova et al. 2003). To further examine the influence of
protein families on size reduction of thermophile genomes,
we compiled a set of 19 single-domain protein families that
are shared by all thermophile and nonthermophile genomes.
For each protein family within each genome, we calculated
the average protein length and the number of proteins per
protein family. We then calculated the average protein length
and the average number of proteins per protein family for
the 19 families of each genome (figs. 6 and 7, and table 3).
In agreement with previous studies (Thompson and
Eisenberg 1999; Chakravarty and Varadarajan 2000), we
found that proteins in thermophile genomes are shorter
than their homologous counterparts in nonthermophile
genomes (P< 6.7�10�7, Wilcoxon rank-sum test). In addi-
tion, protein families in thermophile genomes contain fewer
proteins then protein families in nonthermophile genomes
(P< 8.6� 10�13, Wilcoxon rank-sum test), as expected by
the reduction of gene number in thermophile genomes. All
association presented in figures 6 and 7 (between genome
size and protein length, between genome size and family size,
between temperature and protein length, and between tem-
perature and family size) are significant (P<0.05).
No Selection against Proteins Unable to Adapt toHigh Temperature
Finally, we examined two hypotheses that might explain why
thermophile genomes have small size. The first hypothesis is
2 4 6 8 10
0.05
0.1
Genome Size (Mbp)
dN/d
S(a) Nonthermophilic
Thermophilic
20 40 60 80
0.05
0.1
Growth Temperature (C)
dN/d
S
(b) NonthermophilicThermophilic
FIG. 5.—Average dN/dS ratios (vertical axes) in nonthermophilic bacteria (blue) and thermophilic bacteria (red) are plotted against genome size (a) and
growth temperature (b) of phylogenetically independent species-pairs on the horizontal axes. (a) The associations between dN/dS ratios and genome size are
not significant (P¼ 0.58 and P¼ 0.39, for thermophiles and nonthermophiles, respectively). (b) The associations between dN/dS ratios and temperature are
not significant (P¼ 0.11 and P¼ 0.11, for thermophiles and nonthermophiles, respectively).
Sabath et al. GBE
972 Genome Biol. Evol. 5(5):966–977. doi:10.1093/gbe/evt050 Advance Access publication April 5, 2013
at Zentralbibliothek on January 9, 2014
http://gbe.oxfordjournals.org/D
ownloaded from

that genome size reduction occurs because selection prefer-
entially eliminates genes that encode proteins with low
thermodynamic stability from a genome. This hypothesis is
motivated by the observation that organisms adapted to
high temperature have thermodynamically more stable
proteins (Jaenicke 2000; Kumar and Nussinov 2001). We rea-
soned that some proteins may not be able to evolve higher
stability, and thus would become nonfunctional (or even toxic)
2 4 6 8 10
5
10
15
20
Genome Size (Mbp)
Pro
tein
Fam
ily S
ize
(a) NonthermophilicThermophilic
20 40 60 80 100
5
10
15
20
Growth Temperature (C)
Pro
tein
Fam
ily S
ize
(b) NonthermophilicThermophilic
FIG. 7.—Average protein family size per genome for 19 common protein families (vertical axes) in nonthermophilic bacteria (blue) and thermophilic
bacteria (red) is plotted against genome size (a) and growth temperature (b) on the horizontal axes. (a) The associations between average family size and
genome size are significant (Spearman’s r¼0.88, P<3.3�10�17 and r¼ 0.81, P< 5.5�10�50, for thermophiles and nonthermophiles, respectively). (b)
The associations between average protein length and temperature are significant (Spearman’s r¼�0.55, P< 3.9�10�5 and r¼�0.23, P<8.6�10�4,
for thermophiles and nonthermophiles, respectively).
2 4 6 8 10
300
350
400
Genome Size (Mbp)
Pro
tein
Len
gth
(aa)
(a) NonthermophilicThermophilic
20 40 60 80 100
300
350
400
Growth Temperature (C)
Pro
tein
Len
gth
(aa)
(b) NonthermophilicThermophilic
FIG. 6.—Average protein length across 19 common protein families (vertical axes) in nonthermophilic bacteria (blue) and thermophilic bacteria (red) is
plotted against genome size (a) and growth temperature (b) on the horizontal axes. (a) The associations between average protein length and genome size are
significant (Spearman’s r¼0.34, P< 0.015 and r¼ 0.53, P< 2.7�10�16, for thermophiles and nonthermophiles, respectively). (b) The associations
between average protein length and temperature are significant (Spearman’s r¼�0.32, P< 0.025 and r¼�0.25, P< 2.7� 10�4, for thermophiles
and nonthermophiles, respectively).
Growth Temperature and Genome Size in Bacteria GBE
Genome Biol. Evol. 5(5):966–977. doi:10.1093/gbe/evt050 Advance Access publication April 5, 2013 973
at Zentralbibliothek on January 9, 2014
http://gbe.oxfordjournals.org/D
ownloaded from

at high temperatures. The encoding genes might thus be pref-
erentially eliminated. Unlike previous studies that compared
homologous proteins in mesophiles and thermophiles
(Jaenicke 2000; Kumar and Nussinov 2001), we compared
the thermodynamic stability of proteins that were lost
during thermal adaptation with that of proteins that remained
in the genome (supplementary material, Supplementary
Material online). However, our analysis (supplementary mate-
rial, Supplementary Material online) did not provide any sup-
port for this hypothesis. A second hypothesis, again prompted
by previous observations (Burra et al. 2010), is that selection
may preferentially eliminate genes encoding proteins with dis-
ordered tertiary structures. Again, these data do not support
this hypothesis (supplementary material, Supplementary
Material online). Thus, instead of selection against specific
types of proteins, selection may have operated genome-
wide to reduce the size of thermophilic genomes, indepen-
dently of the stability or disorder of individual gene products.
Discussion
We showed that bacteria that live at higher temperatures tend
to have smaller genomes (figs. 1a and 2). The correlation is
striking: all species that live at temperatures above 60 �C
have genomes smaller than 4 Mb, and all species with
genomes larger than 6 Mb, live in temperatures below 45 �C
(fig. 2). We excluded the possibility that this correlation is the
result of phylogenetic dependencies between species. Our
observations thus suggest that adaptation to high tempera-
ture involves a reduction in genome size.
To find out whether this reduction is caused by random
genetic drift or genome streamlining, that is, natural selection,
we turned to three major lines of evidence that can speak to
either hypothesis (Mira et al. 2001; Touchon and Rocha 2007;
Koonin and Wolf 2008; Kuo et al. 2009; Vieira-Silva and
Rocha 2010).
First, if drift is responsible for genome size reductions, the
fraction of intergenic DNA as a proportion to total genomic
DNA should remain constant with decreasing genome size.
This has been observed in previous studies that did not focus
on thermophiles (Mira et al. 2001; Kuo et al. 2009). In con-
trast, we found that the proportion of intergenic DNA corre-
lates strongly with genome size and growth temperature for
thermophiles: Smaller thermophile genomes have significantly
less intergenic DNA; thermophiles growing at higher growth
temperatures also have less intergenic DNA (fig. 3). Thus, this
line of evidence argues against drift and for streamlining. We
note that previous evidence on the size reduction of
coding DNA is also in line with the streamlining hypothesis.
Specifically, proteins in thermophilic bacteria are shorter than
their orthologs in mesophiles (fig. 6), presumably because
structure-destabilizing loops get lost in the proteins of ther-
mophiles (Thompson and Eisenberg 1999; Chakravarty and
Varadarajan 2000).
The second line of evidence regards generation time, an
important fitness component. If drift is behind genome size
reductions, generation time should be independent of
Table 3
Mean Protein Family Size Per Genome and Protein Length within 19 Common Protein Families
S. No. Family ID Mean Family Size Per Genome Mean Protein Length Description
Thermophiles Nonthermophiles Thermophiles Nonthermophiles
1 PF00005.22 28.4 46.4 295.6 304.0 ABC transporter
2 PF00106.20 7.5 19.6 254.7 262.3 Short chain dehydrogenase
3 PF00155.16 6.1 8.6 385.6 392.8 Aminotransferase class I and II
4 PF00156.22 3.8 4.2 190.2 190.8 Phosphoribosyl transferase domain
5 PF00238.14 1.0 1.0 122.2 122.3 Ribosomal protein L14p/L23e
6 PF00266.14 3.6 4.0 391.8 404.3 Aminotransferase class V
7 PF00275.15 2.4 2.1 426.1 430.6 EPSP synthase
8 PF00416.17 1.0 1.0 123.9 121.6 Ribosomal protein S13/S18
9 PF00696.23 2.7 3.1 281.3 301.7 Amino acid kinase family
10 PF00829.16 1.0 1.0 105.4 111.1 Ribosomal prokaryotic L21 protein
11 PF00831.18 1.0 1.0 69.5 68.5 Ribosomal L29 protein
12 PF01255.14 1.1 1.2 250.0 253.4 Putative undecaprenyl diphosphate synthase
13 PF01327.16 1.2 1.7 172.7 175.9 Polypeptide deformylase
14 PF01709.15 1.0 1.1 248.6 244.8 Transcriptional regulator
15 PF01795.14 1.0 1.0 305.7 321.4 MraW methylase family
16 PF02096.15 1.1 1.2 346.9 431.5 60 kDa inner membrane protein
17 PF06071.8 1.0 1.0 362.3 363.8 Protein of unknown function (DUF933)
18 PF07690.11 7.3 21.7 443.5 446.8 Major facilitator superfamily
19 PF07992.9 4.6 6.1 403.8 410.2 Pyridine nucleotide-disulphide oxidoreductase
Sabath et al. GBE
974 Genome Biol. Evol. 5(5):966–977. doi:10.1093/gbe/evt050 Advance Access publication April 5, 2013
at Zentralbibliothek on January 9, 2014
http://gbe.oxfordjournals.org/D
ownloaded from

genome size. This is indeed generally the case. However,
among thermophiles, we find that organisms with smaller
genomes have shorter generations. The association is not sig-
nificant, possibly because of a small number of species avail-
able for this analysis (fig. 3a). However, because generation
time and temperature are also strongly and significantly
correlated (fig. 3b), a larger sample might reveal a significant
relationship between genome size and generation time.
The third line of evidence relates to selective constraints,
indicated by average dN/dS values over all protein-coding
regions that a genome experiences. If drift is responsible for
genome size reduction, small genomes should experience
weaker constraints than large genomes (Mira et al. 2001;
Kuo et al. 2009). Conversely, if selection is at work, one
would expect to find smaller genomes to be more con-
strained, that is, to show lower average dN/dS ratios.
Previous studies (Koonin and Wolf 2008; Kuo et al. 2009;
Novichkov et al. 2009) have shown that larger genomes are
more constrained. Thermophiles, in contrast, show a different
pattern. A comparison of 17,957 pairs of orthologous genes
from 22 pairs of closely related species revealed that in both
bacteria and archaea thermophiles are more constrained than
mesophiles (Friedman et al. 2004). Using a more restricted set
of orthologous genes, we show that proteins in thermophile
genomes are similarly constrained as their orthologs in
nonthermophile genomes (fig. 5). Thermophiles also have
reduced mutation rates, perhaps in response to the increased
fitness cost of mutations at high temperatures (Mackwan
et al. 2008; Drake 2009). Together, these observations indi-
cate that the small genomes of thermophiles are not the prod-
uct of neutral evolution, as in obligate parasites and
(endo)symbionts (Mira et al. 2001; Daubin and Moran 2004;
Kuo et al. 2009).
Previous studies have argued for genome streamlining with
limited evidence from several species (Dufresne et al. 2005;
Giovannoni et al. 2005). In contrast, we present three lines of
evidence from a large assemblage of bacteria—thermo-
philes—in favor of streamlining. Whether genome size itself
or some other quantity related to it is the direct target of
selection is unknown. We next discuss three candidate targets
and propose a fourth such target. First, selection for fast rep-
lication is an unlikely target, because the energetic cost of
DNA replication is relatively low (below 2% of the entire
energy usage) (Wagner 2005; Lynch 2006). Second, organ-
isms adapted to high temperature have proteins that are ther-
modynamically more stable (Jaenicke 2000; Kumar and
Nussinov 2001). Thus, selection may preferentially eliminate
dispensable low-stability proteins. Third and relatedly,
thermophile proteins are less disordered (Burra et al. 2010).
Hence, selection may preferentially eliminate disordered pro-
teins. However, our analysis (supplementary material,
Supplementary Material online) did not provide any support
for any of these hypotheses.
A fourth potential target is cell size itself. Smaller cells tend
to have smaller genomes in both prokaryotes and unicellular
eukaryotes (Shuter et al. 1983; Lynch 2007), for reasons that
are not fully understood (but see Dill et al. 2011). This corre-
lation suggests that cell and genome size are functionally
related, such that an evolutionary change in one would
induce an evolutionary change in the other. Previous studies
have hypothesized that reduction in cell size could be advan-
tageous, either to optimize surface-to-volume ratio for uptake
of scarce nutrients (Dufresne et al. 2005; Giovannoni et al.
2005; Moya et al. 2009), or to decrease predation by bacter-
ivores or bacteriophages (Yooseph et al. 2010). Similarly, we
speculate that bacteria adapted to high temperature could be
subject to selection favoring smaller cell size, which also
requires smaller genome size—regardless of gene content.
The amount by which natural selection could reduce cell
size would be limited by the ability to minimize genome
size. For example, in P. ubique, the smallest free-living micro-
organism, the genome occupies a substantial fraction (30%)
of the cell volume (Giovannoni et al. 2005). If our hypothesis is
true, small genomes would be a by-product of selection for
small cells.
Although we cannot provide conclusive evidence for this
hypothesis, we investigated what advantages smaller cells
could have at high temperature in addition to those men-
tioned earlier (Dufresne et al. 2005; Giovannoni et al. 2005;
Moya et al. 2009; Yooseph et al. 2010). Growth at high tem-
perature has two important effects on cells. First, it requires
cells to increase the lipid content and change the lipid com-
position of cell membranes (Nordstrom and Laakso 1992).
Part of this change is required to reduce proton leakage at
high temperatures, and thus to maintain the amount of
energy available to cells through proton gradients (Mitchell
1966). Second, high temperature increases the amount cells
need to expend on nongrowth-associated maintenance
(Coultate and Sundaram 1975; Kuhn et al. 1980; McKay
et al. 1982; Pennock and Tempest 1988; Sonnleitner 1983).
In the supplementary material, Supplementary Material
online, we used a genome-scale metabolic model of the ther-
mophile Thermotoga maritima to show that these effects can
reduce biomass synthesis—and thus maximally achievable
generation times—substantially. For example, a mere dou-
bling of nongrowth-associated maintenance requirements—
much higher increases have been reported experimentally
(McKay et al. 1982; Pennock and Tempest 1988)—may
reduce biomass growth by more than 60% (supplementary
fig. S2, Supplementary Material online). Thus, evolutionary
adaptations that lower these effects of high temperature
could have strong fitness benefits. Reduced cell size is one
such adaptation because cell size has a direct impact on
both nongrowth-associated maintenance requirements and
lipid requirements. In support of this idea, the cell size of
planktonic bacteria was shown to decrease with increasing
temperatures in controlled chemostat incubations, as well as
Growth Temperature and Genome Size in Bacteria GBE
Genome Biol. Evol. 5(5):966–977. doi:10.1093/gbe/evt050 Advance Access publication April 5, 2013 975
at Zentralbibliothek on January 9, 2014
http://gbe.oxfordjournals.org/D
ownloaded from

in their natural habitat (Chrzanowski et al. 1988). Improved
energy usage of small cells at high temperature could explain
the experimental observation that bacteria evolved at high
temperature did not have reduced fitness in the original tem-
perature, suggesting that there is not necessarily a tradeoff
between growth at different temperatures (Elena and Lenski
2003).
In sum, our analysis showed that prokaryotic species
adapted to high temperature have small genomes. This asso-
ciation does not appear to be a by-product of lower environ-
mental variability at higher temperature, at least based on
available data. It persists for bacteria when phylogenetic rela-
tionships among species are accounted for. Several lines of
evidence argue that drift alone is not sufficient, and selection
needs to be invoked to explain this correlation. Whether
genome size is a direct or indirect target of selection is
unknown. A candidate direct target is cell size—correlated
with genome size—because metabolic analysis suggests that
large cells may suffer significant fitness costs at high temper-
atures. Future work will show whether this explanation is cor-
rect. Genome size reduction in thermophiles is currently a
unique candidate case of selection for streamlining in bacteria.
Supplementary Material
Supplementary file S1, tables S1–S4, and figures S1 and S2 are
available at Genome Biology and Evolution online (http://
www.gbe.oxfordjournals.org/).
Literature CitedBurra PV, Kalmar L, Tompa P. 2010. Reduction in structural disorder and
functional complexity in the thermal adaptation of prokaryotes. PLoS
One 5:e12069.
Chakravarty S, Varadarajan R. 2000. Elucidation of determinants of protein
stability through genome sequence analysis. FEBS Lett. 470:65–69.
Chrzanowski TH, Crotty RD, Hubbard GJ. 1988. Seasonal variation in cell
volume of epilimnetic bacteria. Microb Ecol. 16:155–163.
Coultate TP, Sundaram TK. 1975. Energetics of Bacillus stearothermophilus
growth: molar growth yield and temperature effects on growth effi-
ciency. J Bacteriol. 121:55–64.
Daubin V, Moran NA. 2004. Comment on “The origins of genome com-
plexity”. Science 306:978; author reply 978.
Dill KA, Ghosh K, Schmit JD. 2011. Physical limits of cells and proteomes.
Proc Natl Acad Sci U S A. 108:17876–17882.
Doolittle WF, Sapienza C. 1980. Selfish genes, the phenotype paradigm
and genome evolution. Nature 284: 601–603.
Drake JW. 2009. Avoiding dangerous missense: thermophiles display
especially low mutation rates. PLoS Genet. 5:e1000520.
Dufresne A, Garczarek L, Partensky F. 2005. Accelerated evolution asso-
ciated with genome reduction in a free-living prokaryote. Genome
Biol. 6:R14.
Eddy SR. 1998. Profile hidden Markov models. Bioinformatics 14:755–763.
Elena SF, Lenski RE. 2003. Evolution experiments with microorganisms: the
dynamics and genetic bases of adaptation. Nat Rev Genet. 4:457–469.
Felsenstein J. 2008. Comparative methods with sampling error and within-
species variation: contrasts revisited and revised. Am Nat. 171:
713–725.
Finn RD, et al. 2010. The Pfam protein families database. Nucleic Acids Res.
38:D211–D222.
Forterre P. 2002. A hot story from comparative genomics: reverse gyrase is
the only hyperthermophile-specific protein. Trends Genet. 18:
236–237.
Friedman R, Drake JW, Hughes AL. 2004. Genome-wide
patterns of nucleotide substitution reveal stringent functional con-
straints on the protein sequences of thermophiles. Genetics 167:
1507–1512.
Galtier N, Lobry JR. 1997. Relationships between genomic G + C content,
RNA secondary structures, and optimal growth temperature in pro-
karyotes. J Mol Evol. 44:632–636.
Giovannoni SJ, et al. 2005. Genome streamlining in a cosmopolitan oce-
anic bacterium. Science 309:1242–1245.
Goldman N, Yang Z. 1994. A codon-based model of nucleotide
substitution for protein-coding DNA sequences. Mol Biol Evol. 11:
725–736.
Hartl DL, Clark AG. 1997. Principles of population genetics. Sunderland
(MA): Sinauer associates.
Jaenicke R. 2000. Stability and stabilization of globular proteins in solution.
J Biotechnol. 79:193–203.
Katoh K, Misawa K, Kuma K, Miyata T. 2002. MAFFT: a novel method for
rapid multiple sequence alignment based on fast Fourier transform.
Nucleic Acids Res. 30:3059–3066.
Koonin EV, Wolf YI. 2008. Genomics of bacteria and archaea: the emerg-
ing dynamic view of the prokaryotic world. Nucleic Acids Res. 36:
6688–6719.
Kuhn HJ, Cometta S, Fiechter A. 1980. Effects of growth temperature on
maximal specific growth rate, yield, maintenance, and death rate in
glucose-limited continuous culture of the thermophilic Bacillus caldo-
tenax. Appl Microbiol Biotechnol. 10:303–315.
Kumar S, Nussinov R. 2001. How do thermophilic proteins deal with heat?
Cell Mol Life Sci. 58:1216–1233.
Kuo CH, Moran NA, Ochman H. 2009. The consequences of genetic drift
for bacterial genome complexity. Genome Res. 19:1450–1454.
Lartillot N, Poujol R. 2011. A phylogenetic model for investigating corre-
lated evolution of substitution rates and continuous phenotypic char-
acters. Mol Biol Evol. 28:729–744.
Lynch M. 2006. Streamlining and simplification of microbial genome ar-
chitecture. Annu Rev Microbiol. 60:327–349.
Lynch M. 2007. The origins of genome architecture. Sunderland (MA):
Sinauer Associates.
Mackwan RR, Carver GT, Kissling GE, Drake JW, Grogan DW. 2008. The
rate and character of spontaneous mutation in Thermus thermophilus.
Genetics 180:17–25.
Makarova KS, Wolf YI, Koonin EV. 2003. Potential genomic determinants
of hyperthermophily. Trends Genet. 19:172–176.
McKay A, Quilter J, Jones CW. 1982. Energy conservation in the extreme
thermophile Thermus thermophilus HB8. Archives Microbiol. 131:
43–50.
Mira A, Moran NA. 2002. Estimating population size and transmission
bottlenecks in maternally transmitted endosymbiotic bacteria.
Microb Ecol. 44:137–143.
Mira A, Ochman H, Moran NA. 2001. Deletional bias and the evolution of
bacterial genomes. Trends Genet. 17: 589–596.
Mitchell P. 1966. Chemiosmotic coupling in oxidative and photosynthetic
phosphorylation. Biochim Biophys Acta. 1807:1507–1538.
Moran NA, McLaughlin HJ, Sorek R. 2009. The dynamics and time scale of
ongoing genomic erosion in symbiotic bacteria. Science 323:379–382.
Moran NA, Wernegreen JJ. 2000. Lifestyle evolution in symbiotic bacteria:
insights from genomics. Trends Ecol Evol. 15: 321–326.
Moya A, et al. 2009. Toward minimal bacterial cells: evolution vs. design.
FEMS Microbiol Rev. 33:225–235.
Nordstrom KM, Laakso SV. 1992. Effect of growth temperature on fatty
acid composition of ten thermus strains. Appl Environ Microbiol. 58:
1656–1660.
Sabath et al. GBE
976 Genome Biol. Evol. 5(5):966–977. doi:10.1093/gbe/evt050 Advance Access publication April 5, 2013
at Zentralbibliothek on January 9, 2014
http://gbe.oxfordjournals.org/D
ownloaded from
Novichkov PS, Wolf YI, Dubchak I, Koonin EV. 2009. Trends in prokaryotic
evolution revealed by comparison of closely related bacterial and ar-
chaeal genomes. J Bacteriol. 191:65–73.
Orgel LE, Crick FH. 1980. Selfish DNA: the ultimate parasite. Nature 284:
604–607.
Parter M, Kashtan N, Alon U. 2007. Environmental variability and modu-
larity of bacterial metabolic networks. BMC Evol Biol. 7:169.
Pennock J, Tempest DW. 1988. Metabolic and energetic aspects of the
growth of Bacillus stearothermophilus in glucose-limited and glucose-
sufficient chemostat culture. Arch Microbiol. 150:452–459.
Ranea JA, Grant A, Thornton JM, Orengo CA. 2005. Microeconomic prin-
ciples explain an optimal genome size in bacteria. Trends Genet. 21:
21–25.
Rodrigues JFM, Wagner A. 2009. Evolutionary plasticity and innovations in
complex metabolic reaction networks. PLoS Comput Biol. 5:
e1000613.
Saitou N, Nei M. 1987. The neighbor-joining method: a new method for
reconstructing phylogenetic trees. Mol Biol Evol. 4:406–425.
Shuter BJ, Thomas JE, Taylor WD, Zimmerman AM. 1983. Phenotypic
correlates of genomic DNA content in unicellular eukaryotes and
other cells. Am Naturalist 122:26–44.
Sonnleitner B. 1983. Biotechnology of thermophilic bacteria—growth,
products, and application. In: Fiechter A, editor. Advances in biochem-
ical engineering/biotechnology. Berlin (Germany): Springer. p. 69–138.
Thompson MJ, Eisenberg D. 1999. Transproteomic evidence of a loop-
deletion mechanism for enhancing protein thermostability. J Mol Biol.
290:595–604.
Touchon M, Rocha EP. 2007. Causes of insertion sequences abundance in
prokaryotic genomes. Mol Biol Evol. 24:969–981.
Vieira-Silva S, Rocha EP. 2010. The systemic imprint of growth and its uses
in ecological (meta)genomics. PLoS Genet. 6:e1000808.
Wagner A. 2005. Energy constraints on the evolution of gene expression.
Mol Biol Evol. 22:1365–1374.
Wheeler DL, et al. 2008. Database resources of the National Center for
Biotechnology Information. Nucleic Acids Res. 36:D13–D21.
Yooseph S, et al. 2010. Genomic and functional adaptation in surface
ocean planktonic prokaryotes. Nature 468:60–66.
Zeldovich KB, Berezovsky IN, Shakhnovich EI. 2007. Protein and DNA se-
quence determinants of thermophilic adaptation. PLoS Comput Biol.
3:e5.
Associate editor: Bill Martin
Growth Temperature and Genome Size in Bacteria GBE
Genome Biol. Evol. 5(5):966–977. doi:10.1093/gbe/evt050 Advance Access publication April 5, 2013 977
at Zentralbibliothek on January 9, 2014
http://gbe.oxfordjournals.org/D
ownloaded from