
Growth of Niobium Dioxide Thin Films and Their Metal-to ...
61
Graduate Theses, Dissertations, and Problem Reports 2017 Growth of Niobium Dioxide Thin Films and Their Metal-to- Growth of Niobium Dioxide Thin Films and Their Metal-to- Insulator Transitions Induced by Electric Field Insulator Transitions Induced by Electric Field Toyanath Joshi Follow this and additional works at: https://researchrepository.wvu.edu/etd Recommended Citation Recommended Citation Joshi, Toyanath, "Growth of Niobium Dioxide Thin Films and Their Metal-to-Insulator Transitions Induced by Electric Field" (2017). Graduate Theses, Dissertations, and Problem Reports. 5910. https://researchrepository.wvu.edu/etd/5910 This Dissertation is protected by copyright and/or related rights. It has been brought to you by the The Research Repository @ WVU with permission from the rights-holder(s). You are free to use this Dissertation in any way that is permitted by the copyright and related rights legislation that applies to your use. For other uses you must obtain permission from the rights-holder(s) directly, unless additional rights are indicated by a Creative Commons license in the record and/ or on the work itself. This Dissertation has been accepted for inclusion in WVU Graduate Theses, Dissertations, and Problem Reports collection by an authorized administrator of The Research Repository @ WVU. For more information, please contact [email protected].
Transcript of Growth of Niobium Dioxide Thin Films and Their Metal-to ...

Graduate Theses, Dissertations, and Problem Reports
2017
Growth of Niobium Dioxide Thin Films and Their Metal-to-Growth of Niobium Dioxide Thin Films and Their Metal-to-
Insulator Transitions Induced by Electric Field Insulator Transitions Induced by Electric Field
Toyanath Joshi
Follow this and additional works at: https://researchrepository.wvu.edu/etd
Recommended Citation Recommended Citation Joshi, Toyanath, "Growth of Niobium Dioxide Thin Films and Their Metal-to-Insulator Transitions Induced by Electric Field" (2017). Graduate Theses, Dissertations, and Problem Reports. 5910. https://researchrepository.wvu.edu/etd/5910
This Dissertation is protected by copyright and/or related rights. It has been brought to you by the The Research Repository @ WVU with permission from the rights-holder(s). You are free to use this Dissertation in any way that is permitted by the copyright and related rights legislation that applies to your use. For other uses you must obtain permission from the rights-holder(s) directly, unless additional rights are indicated by a Creative Commons license in the record and/ or on the work itself. This Dissertation has been accepted for inclusion in WVU Graduate Theses, Dissertations, and Problem Reports collection by an authorized administrator of The Research Repository @ WVU. For more information, please contact [email protected].

Statistical Methods for Detection and Mitigation
of the Effect of Different Types of Cyber-Attacks
and Inconsistencies in Electrical Design
Parameters in a Real World Distribution System
By
Vivek Joshi
Thesis submitted to the
Benjamin M. Statler College of Engineering and Mineral Resources
at West Virginia University
in partial fulfillment of the requirements for the degree of
Master of Science
in
Electrical Engineering
Dr. Jignesh Solanki, Ph.D., Chair
Dr. Sarika Khushalani Solanki, Ph.D.
Dr. Radhey Sharma, Ph.D.
Lane Department of Computer Science and Electrical Engineering
Morgantown, West Virginia
2014
Keywords: Distribution System, Capacitor Control, DG, MLR, System
modelling parameter inconsistencies, Deception Attack, Load Redistribution
Attack, OpenDSS.
Copyright 2014 Vivek Joshi

ABSTRACT
Statistical Methods for Detection and Mitigation of the Effect of Different Types of Cyber-
Attacks and Inconsistencies in Electrical Design Parameters in a Real World Distribution
System
Vivek Joshi
Master of Science in Electrical Engineering
West Virginia University
Advisor: Dr. Jignesh Solanki, Ph.D.
In the present grid real time control systems are the energy management systems and distribution
management systems that utilize measurements from real-time units (RTUs) and Supervisory
Control and Data Acquisition (SCADA). The SCADA systems are designed to operate on
isolated, private networks without even basic security features which are now being migrated to
modern IP-based communications providing near real time information from measuring and
controlling units. To function “brain” (SCADA) properly “heart” (RTUs) should provide
necessary response thereby creating a coupling which makes SCADA systems as targets for
cyber-attacks to cripple either part of the electric transmission grid or fully shut down (create
blackout) the grid. Cyber-security research for a distribution grid is a topic yet to be addressed.
To date firewalls and classic signature-based intrusion detection systems have provided access
control and awareness of suspicious network traffic but typically have not offered any real-time
detection and defense solutions for electric distribution grids.
This thesis work not only addresses the cyber security modeling, detection and prevention but
also addresses model inconsistencies for effectively utilizing and controlling distribution
management systems. Inconsistencies in the electrical design parameters of the distribution
network or cyber-attack conditions may result in failing of the automated operations or
distribution state estimation process which might lead the system to a catastrophic condition or
give erroneous solutions for the probable problems. This research work also develops a robust
and reliable voltage controller based on Multiple Linear Regression (MLR) to maintain the
voltage profile in a smart distribution system under cyber-attacks and model inconsistencies. The
developed cyber-attack detection and mitigation algorithms have been tested on IEEE 13 node
and 600+ node real American electric distribution systems modeled in Electric Power Research
Institute’s (EPRI) OpenDSS software.

iii
ACKNOWLEDGEMENTS
I would like to express my sincere gratitude to my advisor, Dr. Jignesh Solanki, for his
invaluable guidance, support, and encouragement. I thank Dr. Jignesh for believing in me that I
can accomplish this goal with hard work and sincere effort. I thank him for providing me that
confidence which lead to completion of this research work. Next, I would like to thank my
second committee member Dr. Sarika Khushalani Solanki. It was from her that I learned the
difference between mere hard work and hard work with focus and dedication. Both Dr. Sarika
Khushalani Solanki and Dr. Jignesh Solanki have been with me, guiding me throughout my two
years of research. I would also like to thank my other committee member Dr. Radhey Sharma,
whose feedback and reviews helped me improve the quality of this thesis.
I would like to thank my parents for their moral support throughout my graduate studies.
Their love and affection have helped me overcome the toughest of challenges during these two
hard years. Lastly, but in no sense the least, I am thankful to all my friends who made my stay at
the West Virginia University a memorable and valuable experience.

iv
Contents
ABSTRACT ................................................................................................................................................... i
List of Figures .............................................................................................................................................. vi
List of Tables .............................................................................................................................................. vii
Chapter 1: INTRODUCTION ....................................................................................................................... 1
1.1 Background ................................................................................................................................... 1
1.2 Smart Grid ........................................................................................................................................... 1
1.3 Distributed generation ......................................................................................................................... 2
1.3.1 Photovoltaic Systems ................................................................................................................... 3
1.4 Voltage Control ................................................................................................................................... 3
1.4.1 OLTC ........................................................................................................................................... 4
1.4.2 Voltage Regulators ....................................................................................................................... 4
1.4.3 Switched Capacitors ..................................................................................................................... 5
1.5 Cyber Attack in Power System ........................................................................................................... 5
1.6 Problem Statement ........................................................................................................................ 7
1.7 Approach ............................................................................................................................................. 8
1.7.1 Voltage Controller Strategy .................................................................................................. 8
1.7.2 Cyber Attack Detection Algorithm ....................................................................................... 8
1.7.3 Electrical Design Parameters Inconsistency effect on Losses Calculation ........................... 9
1.8 Outline........................................................................................................................................... 9
Chapter 2: LITERATURE REVIEW .......................................................................................................... 11
2.1 Voltage Control in distribution system ............................................................................................. 11
2.2 Cyber Attacks in Power Systems ...................................................................................................... 14
Chapter 3: MATHEMATICAL MODEL AND FORMULATION ............................................................ 19
3.1 Theory of Multiple Linear Regression (MLR) [48] .......................................................................... 19
3.2 Modeling attacks and anomalies ....................................................................................................... 21
3.2.1 Inconsistencies in electrical design parameters .......................................................................... 21

v
3.2.2 Data integrity attack [29] ........................................................................................................... 21
3.2.3 Load redistribution attack .......................................................................................................... 22
3.3 Distributed Cyber Attack Detection Method .................................................................................... 23
3.4 Proposed Voltage Controller Methodology ...................................................................................... 24
Chapter 4: SIMULATION TOOLS AND SOFTWARE ............................................................................ 26
4.1 Open Distribution System Simulator (OpenDSS) ....................................................................... 26
4.1.1 Extensive Range of Solution Modes ................................................................................... 28
4.1.2 COM Interface .................................................................................................................... 29
4.2 Minitab ........................................................................................................................................ 29
Chapter 5: SIMULATION AND RESULTS .............................................................................................. 30
5.1 13-Bus Distribution System .............................................................................................................. 30
5.2 AEP Test Circuit ............................................................................................................................... 32
5.2.1 MLR based Statistical Voltage Controller ................................................................................. 33
5.2.2 MLR based Controller Performance .......................................................................................... 37
5.2.3 Cyber Attack Distributed Detection Method ............................................................................. 40
Chapter 6: CONCLUSION AND FUTURE WORK .................................................................................. 45
6.1 Conclusion ........................................................................................................................................ 45
6.1.1 Voltage Controller Strategy ................................................................................................ 45
6.1.2 Distributed cyber-attack detection technique ...................................................................... 45
6.2 Future Work ................................................................................................................................ 46
References ................................................................................................................................................... 47

vi
List of Figures
Figure 1 Voltage Control in Distribution System ......................................................................................... 4
Figure 2 Power Grid Cyber-Physical Infrastructure [13] .............................................................................. 6
Figure 3 Divided Areas based on Reactive Power Domains [24] ............................................................... 13
Figure 4 Cyber-Attack on Control System [29] .......................................................................................... 15
Figure 5 Deception Attack on State Estimator in a Power Grid [34] .......................................................... 16
Figure 6 SCADA Controlled Voltage Loop in a Transmission System [44] .............................................. 17
Figure 7 Detection of Cyber-Attack with Local Agents for each Area [40] ............................................... 18
Figure 8 A Statistical Reactive Power Model Algorithm ........................................................................... 25
Figure 9 OpenDSS Configuration [46] ....................................................................................................... 28
Figure 10 IEEE 13 Bus Distribution Test Feeder ....................................................................................... 30
Figure 11 Normal Probability Plots for the Regression Models for Buses 652 and 684 ............................ 31
Figure 12 AEP Feeder 1 Network Diagram ................................................................................................ 33
Figure 13 Normal Probability Plots for the Regression Models for Buses 164_west, 146_west, 143_west
and 132_west .............................................................................................................................................. 35
Figure 14 Controller Validations for the Kvar Calculation Models for the Buses 164_west, 146_west,
143_west and 132_west .............................................................................................................................. 36
Figure 15 Losses in Four Maximum Losses giving Lines with Each Type of Line Geometry for 2-
Conductor Type Line .................................................................................................................................. 38
Figure 16 Losses in Four Maximum Losses giving Lines with Each Type of Line Geometry for 4-
Conductor Type Line .................................................................................................................................. 38
Figure 17 Controller Testing for the Voltage Controllers against Inconsistencies in Electrical Design
Parameters, Deception Attack and LR Attack ............................................................................................ 39
Figure 18 Cluster Division for AEP Feeder 1 Network ............................................................................. 41
Figure 19 Normal Probability Plots for the Regression Models of the Local Agents ................................ 42
Figure 20 Decision Table for Deception Attack ......................................................................................... 44
Figure 21 Decision Table for LR Attack .................................................................................................... 44

vii
List of Tables
Table 1. Regression Models for Voltage in p.u. for Buses 652 and 684..................................................... 31
Table 2. Controller Validation for the kVar Calculation Models ............................................................... 32
Table 3. Regression Models for Voltage in p.u. for Buses 164_west, 146_west, 143_west and 132_west 34
Table 4. Statistical Models for Attack Detection. ....................................................................................... 41
Table 5. Total number of buses and the centroid value .............................................................................. 42

1
Chapter 1: INTRODUCTION
1.1 Background
The electric power system consists of three fields- generation, transmission and
distribution; which are constantly evolving to supply the ever increasing demand in a more cost
effective, efficient and reliable manner, both for the utilities and the customers. For this purpose
the electric power grid has become the most complex and highly invested industry undergoing
constant technological renovations. These technological advancements led to the concepts of
SCADA, Energy Management systems (EMS), Distribution System Management (DMS), Smart
Grid and Distribution Automation (DA) in the power grid.
1.2 Smart Grid
The concept of a smart grid started with the formation of Independent System Operator (ISO)
and Regional Transmission Organization (RTO) under the recommendation of Federal Energy
Regulatory Commission (FERC). The ISOs and RTOs are formed to make a smarter electrical
grid keeping in mind the demands of the 21st century. The US Department of Energy (DOE)
defines the overall vision of Smart Grid as the following [1].
1. Intelligent Automation– having sensors to sense overload conditions and rerouting power
and avoiding outage conditions; automatic isolation of faulted areas with minimum
disruption of power.
2. Smooth Integration of Distributed Generation (DG) – integration of any fuel source
including solar and wind as easily and transparently as coal and natural gas; also other
technologies like energy storage.
3. Sophisticated Demand Response Capabilities – supporting real-time communication
between the consumer and utility so consumers can alter their energy consumption based
on individual inclinations, like price and/or environmental concerns.

2
4. Quality-centric – capable of delivering the power which is free of sags, spikes,
disturbances and interruptions.
5. Robust – highly resistant to cyber-attack and natural disasters as it becomes more
decentralized.
There are vast benefits to the country with the commencement of Smart Grid [2]. The chances of
cascading outages and dependency on foreign fuel are reduced. One of the important objectives
of smart grid concept is to allow high penetration of DG and new storage technologies into the
present grid smoothly. DGs are small scale power generation technologies located close to the
load having capabilities of lowering costs, improving reliability and reducing emissions.
1.3 Distributed generation
With the advent of smart grid and advancement of new technologies, the utilities are focused
towards adding DG into their existing infrastructure. The addition of DG does bring along
different technological and environmental benefits to the power grid like locally fulfilling the
consumer demands, reducing power losses and avoiding transmission and distribution system
expansion [3]. Earlier conventional power sources were used for these purposes but in the last
few years, renewable energy has taken their place as a feasible future source of electric energy as
they can eradicate the problems of increasing consumer demand, fluctuating fossil fuel prices
and also solve problems related to environmental issues. The prevalent forms of DG are wind
power, solar photovoltaic, fuel cells and micro-turbines. The DGs that are of electromechanical
type could be directly interfaced whereas other DGs require inverter based systems to connect to
the power grid.
Although there are many advantages of integrating DGs into the grid there are some negative
impacts too. The integration of DGs changes the unidirectional power flow of a traditional radial
distribution network to a two-way power flow because of the addition of generators in the
distribution side [4]. This also affects the traditional relays and protection devices as they
generally do not have directional capabilities. The power quality can also be affected as DG
devices are connected to the power grid by power electronic devices which might cause
distortion of the current and voltage waveforms and induce harmonics [5].
3
1.3.1 Photovoltaic Systems
Solar energy is the world’s most copiously available form of renewable energy source and so
photovoltaic generators are one of the fastest emerging DG technologies, with an estimate annual
growth rate of 25-35% in the power market [1]. The reason for this remarkable growth in spite of
their high installation cost can be given to the advancements in power electronics field, storage
devices, etc. which are highly essential for large scale installation of PV generators at
distribution side. Moreover PV generators are vigorously being endorsed in order to alleviate
environmental issues such as the greenhouse effect and air pollution and also they help in
relieving thermal overloads and reducing losses in distribution systems [6-7]. Another advantage
is that solar technology is very flexible and can be easily changed to provide the required power
for different loads. The energy produced by the PV system reduces the apparent load whereas the
surplus energy flows into the grid. But one drawback that these solar generators cause when they
installed near to the load side owing to their intermittent nature even after so much effort has
been done to get an accurate estimate of the daily solar generation curve is that they disturb the
voltage profile of the distribution system.
1.4 Voltage Control
The simplest voltage control methods in a distribution system use local measurements for
maintaining the voltage profile and data transfer between the distribution nodes is not required.
On the contrary, there are methods that require data transfer between the distribution nodes and
they determine their control actions based on the information of the entire distribution network.
These methods are known as coordinated voltage control methods. A variety of coordinated or
centralized voltage controls methods have been developed in distribution systems with different
levels of effectiveness, complexity, communications requirements, and cost effectiveness.
Centralized Distribution Management System (DMS) control and also coordination of
distribution network components such as OLTC, voltage regulators, DGs and switched capacitor
control are some of the examples of coordinated voltage management for distribution systems.
Figure 1 show the different elements employed in a distribution system for the purpose of
controlling the voltage.

4
Figure 1 Voltage Control in Distribution System
1.4.1 OLTC
A tap changer is a device for regulation of the output voltage to required levels fitted to power
transformers. This is typically achieved by altering the ratios of the transformers on the system
by varying the number of turns in one winding of the suitable transformer/s. Tap changers offer
flexible control to keep the voltage supply within the limits. Tap changers can be either on load
or off load. On load tap changers transfer current from one voltage tap to the next without
interrupting the supply. Tap changers can be adjusted to fit the application requirements.
1.4.2 Voltage Regulators
A voltage regulator is a device used to automatically maintain a constant voltage level in electric
power distribution system. It may be installed at a substation or along distribution lines so that all
customers receive steady voltage without worrying about how much power is drawn from the
line. Generally voltage regulators have capability of raising or lowering the voltage by 10%.

5
1.4.3 Switched Capacitors
The main use of shunt capacitor banks (SCB) is to provide capacitive reactive compensation or
power factor correction. The reason for increased use of SCBs is their inexpensiveness, easy and
quick installation and easy deployment almost anywhere in the network. Other valuable effects
of its installation on the distribution system are: improvement of the voltage at the load,
improved voltage regulation, reduction of losses and cost savings due to delay of investments in
transmission system.
1.5 Cyber Attack in Power System
The numerous technological advancements and increasing demand for reliable energy have
stimulated the development of a smart grid. The smart grid is supposed to expand the present
capabilities of the power grid’s generation, transmission and distribution systems to support the
requirements of distributed generation, renewable energy resources, electric vehicles and
demand-side management of power.
The present distribution system will see the advent of advanced technologies such as phasor
measurement units (PMU), wide area measurement systems, substation automation, and
advanced metering infrastructures (AMI) to realize these objectives. But their introduction to the
distribution side also presents an increased reliance on cyber resources which may be susceptible
to attack conditions. Moreover, power grid in the past decade has encountered numerous cyber
related attacks which have elevated the interrogation regarding the security susceptibilities and
its large scale impact on the critical power grid infrastructure [8-12]. The cyber-physical
infrastructure of a power grid in shown in figure 2.

6
Figure 2 Power Grid Cyber-Physical Infrastructure [13]
The different types of attacks that can affect the normal operation of a power distribution system
as described in [14] are:-
1) Denial of Cooperative Operation (DoS): In this attack, the communication channels are
jammed by flooding them with junk packets which can result in loss of important data and might
affect the automated control operations.
2) Desynchronization attacks: In this attack, the control algorithms of automated operation which
are time dependent are attacked.
3) Data Injection Attacks: In this attack, false operational data such as status or control
information are send that can significantly affect the operations of a power grid. This type of
attack requires thorough knowledge of the communication protocol.
7
1.6 Problem Statement
The primary objective of this thesis is to develop a robust and reliable voltage controller based
on multiple linear regressions to maintain the voltage profile in a distribution system with
distributed generators (DG) connected to it. Regression is based on least squares method making
use of data acquired from exact simulations of the distribution network. The independent
variables selected for this study are active power output of DG, total load and var injection at the
capacitor bank as independent variables whereas the dependent variable is per unit voltage at the
violating buses. The proposed controller is validated on IEEE 13 bus distribution system and
American Electric Power System feeder modeled in OpenDSS.
This thesis also models two different types of attack, namely data integrity attack on the voltage
control loop and load redistribution attack and also inconsistencies in electrical design parameter
in a power distribution network. A regression based distributed detection algorithm having local
detection agents is developed for detection of cyber-attack in a distribution system with DG
connected to it. An algorithm is proposed to select a certain number of buses in the system to be
declared as elected buses and linear regression based local agents are developed from the elected
buses. The cyber-attacks and detection technique are developed in AEP feeder modeled in
OpenDSS.
This thesis also validates the effectiveness of the proposed voltage controller strategy against
data integrity attack on voltage control loop, load redistribution attack and inconsistencies in
electrical design parameter in a power distribution network which are modeled in AEP
Distribution feeder.
The effect of inconsistency in electrical design parameter in calculation of the line losses for
overhead lines in AEP Feeder without any DG is presented. The parameter considered for
modeling this inconsistency is line reactance which is modeled in OpenDSS.
A few assumptions made in this thesis work are listed below,
• Voltage regulators are turned off in both IEEE 13 bus distribution system and AEP feeder
for all the proposed strategies.

8
• Data sets for the independent variables and dependent variables for the regression are
taken from the exact simulation of the distribution system in OpenDSS.
1.7 Approach
The sections to follow will develop voltage controller model, cyber-attacks and distributed
cyber- attack detection technique. The key aspects of this research are highlighted in subsections
below.
1.7.1 Voltage Controller Strategy
Integration of DG to a distribution system and the changing load conditions impact voltage
profile in a distribution system. So their affect should be taken into account while developing a
strategy for voltage regulation in a distribution system.
• Exact models of the distribution systems are modeled in OpenDSS for the analysis.
• Multiple linear regression is done in Minitab with per unit voltage at violating buses as
dependent variables and active power output of DG, total load and var injection form the
capacitor bank as independent variables.
• Data sets for the dependent and independent variables are generated from OpenDSS
using random network and loading conditions.
• Optimum var settings for capacitor banks are calculated in Matlab using the regression
models of per unit voltage of violating buses.
1.7.2 Cyber Attack Detection Algorithm
An agent based detection technique for cyber-attacks is developed based on linear regression.
This technique can be effectively used until the topology of the distribution system changes and
can detect different types of attacks, namely data integrity attack on voltage control loop and
load redistribution attack.
• Exact models of the distribution systems are modeled in OpenDSS for the analysis.
• Cyber-attacks are modeled in OpenDSS in the exact model itself.

9
• A distributed algorithm using local agents based on linear regression is developed for the
detection of the cyber-attacks. The linear regression analyses in done in Minitab software.
• The detection technique is tested for different cases of cyber-attacks in AEP feeder.
1.7.3 Electrical Design Parameters Inconsistency effect on Losses Calculation
The effect of inconsistency in electrical design parameter in calculation of the line losses for
overhead lines in AEP Feeder without any DG is presented. The parameter considered for
modeling this inconsistency is line reactance which is modeled in OpenDSS.
• The AEP feeder 1 is studied thoroughly and all the different conductor type lines are
identified.
• The different types of geometries used for all the different types of lines are identified in
the AEP feeder 1.
• Losses for a few maximum losses giving lines of a 2 conductor type line and 4 conductor
type line are calculated with all the identified geometries for those types of lines including their
original geometry.
• The effect of different types of geometries on different types of lines is analyzed.
1.8 Outline
The outline of the remaining chapters is given in this section.
Chapter 2 is a comprehensive literature review on voltage control in distribution system using
voltage regulators, OLTC, capacitor banks, DGs or a combination of any of these. A literature
review on the different cyber-attacks in power system is also discussed in details.
Chapter 3 is about mathematical formulation of multiple linear regression technique, modeling of
the inconsistencies in the electric design parameters, data integrity attack on voltage control loop
and load redistribution attack in a distribution system. The voltage controller strategy and cyber-
attack detection technique is also formulated.
Chapter 4 gives a comprehensive description of the software packages used in this study. The
advantages presented by the software to the pertinent applications are also discussed.

10
Chapter 5 presents the test systems, simulations for voltage control strategy and associated
regression models and the cyber-attack detection technique and the associated regression models.
The effect of the cyber-attacks on voltage control in a distribution system is also presented.
Finally, chapter 6 lists conclusion of this study and provides scope for future work.

11
Chapter 2: LITERATURE REVIEW
This chapter reviews the literature for voltage control using capacitor banks, OLTC,
voltage regulators and DG. Also deception attack and load distribution attack in power systems.
2.1 Voltage Control in distribution system
Different strategies exist in the present distribution system which can be used by DMS or DA to
counter the voltage instability like regulator control using different tap settings, capacitor control
supplying/ absorbing Kvar to/from the distribution system, etc. Capacitor control is usually done
to achieve the following goals: reduce losses due to reactive load current, reduce kVA demand,
decrease customer energy consumption, improve voltage profile, and increase revenue.
A lot of research has been done on the use of capacitor control, both in offline and online mode
to maintain the voltage profile in a distribution system. Reference [15] discussed about the
traditional capacitor bank control strategies which mainly employed timers, voltage controls, and
voltage with time bias; their advantages and drawbacks. Also some improved capacitor control
technologies like Fisher Pierce Current Control, Beckwith Electric Co. Inc., RTE Combinational
Capacitor Control and lastly proposed an exhaustive search methodology for determining the
optimum set points for the capacitor bank switching.
A control strategy for the control of both voltage and reactive power at distribution substation
and feeder level using an optimization method involving minimizing the sum of weighted
squares of the set points values for all the variables that need to be controlled is proposed in [16].
The variables chosen to be controlled for this study are voltage, reactive power and feeder losses.
Reference [17] provides the optimum placement, replacement and control of capacitors in
distribution systems using a two stage algorithm; one stage being Genetic Algorithm to find
neighbourhoods of high quality solutions and the second stage is for improving the solution
given by first stage. Reference [19] proposes solutions for the problems of optimal location, type,
and size of the capacitors in a radial distribution system taking voltage constraints and load
variations in the optimization problem. The problem is formulated as a mixed integer linear
programming problem.

12
Reference [22] presents the problem formulation, solution methodology and mathematical
validation of a novel capacitor placement and their real time control schemes in an unbalanced
distribution system. The problem is divided into two subproblems, first the capacitor placement
and second the real time control. The approach of quadratic integer programming is used which
yielded the optimum number, location and size of capacitor to be installed in the system. The
numerical studies for this are presented in [23].
The maintenance of voltage profile at every customer’s meter within the ANSI standards using
step up voltage regulators is shown in [18]. The regulators are considered as tap-changing
autotransformers. Reference [20] provides control of the local regulating devices in a distribution
substations and feeders taking dynamically changing system conditions into account instead of
the local measurements.
The problem of minimizing the real power losses and enhancing the voltage profile in a
distribution system is solved using a reconfiguration methodology built on a new adaptive
imperialist competitive algorithm in [21].
Distributed capacitor control methodologies to regulate voltage profile in a distribution system
are performed in [24-25] in which the whole network is divided into different control zones
based on reactive power area of each governable shunt capacitor and finding the optimal setting
point for each zone. The figure 3 shows how the areas are divided based on reactive power
domains.
Reference [26] provides an optimal vol/var control strategy with solid state transformers (SST)
for var compensation and voltage regulators for voltage regulation where the final objective is to
minimize total system power loss while maintaining the voltage profile within the permissible
limits in a distribution system. Distributed generation is taken into account while making an
optimal capacitor control algorithm for getting the optimum set point in [27]. Different types of
DGs are considered with their different mathematical models for this study.

13
Figure 3 Divided Areas based on Reactive Power Domains [24]
Both offline and online modes have some disadvantages. In offline mode, the control switches
the capacitor bank according to some predefined time which may or may not relate with actual
loading conditions because it has no feedback mechanism to monitor system conditions, so at
low loading conditions the vars may be supplied and vice versa. The online mode requires
continuous monitoring of either the power factor of the total current supplied to the distribution
system or some other quantity by some microprocessor-based relays due to the continuous
change in loading conditions and intermittent DG penetration, if it is present, which can become
expensive for getting really accurate measurements. Also, the computation becomes complex as
the whole system has to be solved each time the var injections need to be calculated. Moreover,
if there is any inconsistency present in the electrical design parameters of the distribution system
while calculating the required var injections, or under cyber- attack conditions the capacitor
control will become impractical.

14
2.2 Cyber Attacks in Power Systems
With the rapidly increasing penetration of distributed generations (DG), the need for demand
side management, and control of industrial and residential loads through demand response has
led to the emergence of Distribution Management Systems (DMS) by electric utilities for better
analysing and controlling the distribution systems. DMS rely heavily on the cutting edge
communication technologies, advanced sensors, and other automated systems to achieve real-
time adjustment to changing loads, generation, and fiasco conditions of the distribution
system. Improving the reliability and quality of service, maintaining acceptable frequency
and voltage levels in the distribution system usually without the operator intervention are the
main functions of these systems.
However, these advanced systems also craft new vulnerabilities in power infrastructures.
Different types of attacks have been researched in the past for the smart grid’s automated control
systems, wide area measurement and supervisory control and data acquisition systems. For
instance, in references [28-29] deception attacks and denial of service (DOS) attacks against a
networked control system are defined. Deception attacks refer to the possibility of compromising
the integrity of control packets or measurements, and they are cast by altering the behavior of
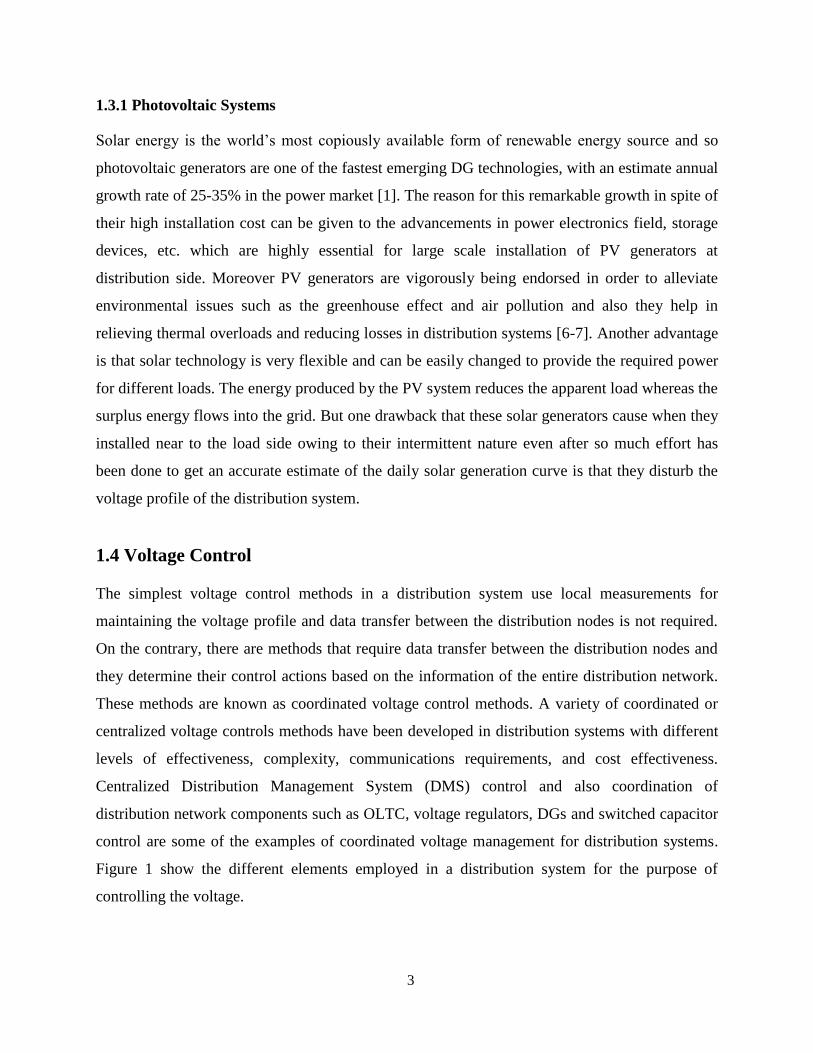
sensors and actuators. Figure 4 shows the various points at where a cyber-attack can be done in a
control system where A1 and A3 are the data integrity attacks, A5 is an attack on the physical
system and A2 and A4 are attacks on the communication links connecting the physical system
with the controller.
15
Figure 4 Cyber-Attack on Control System [29]
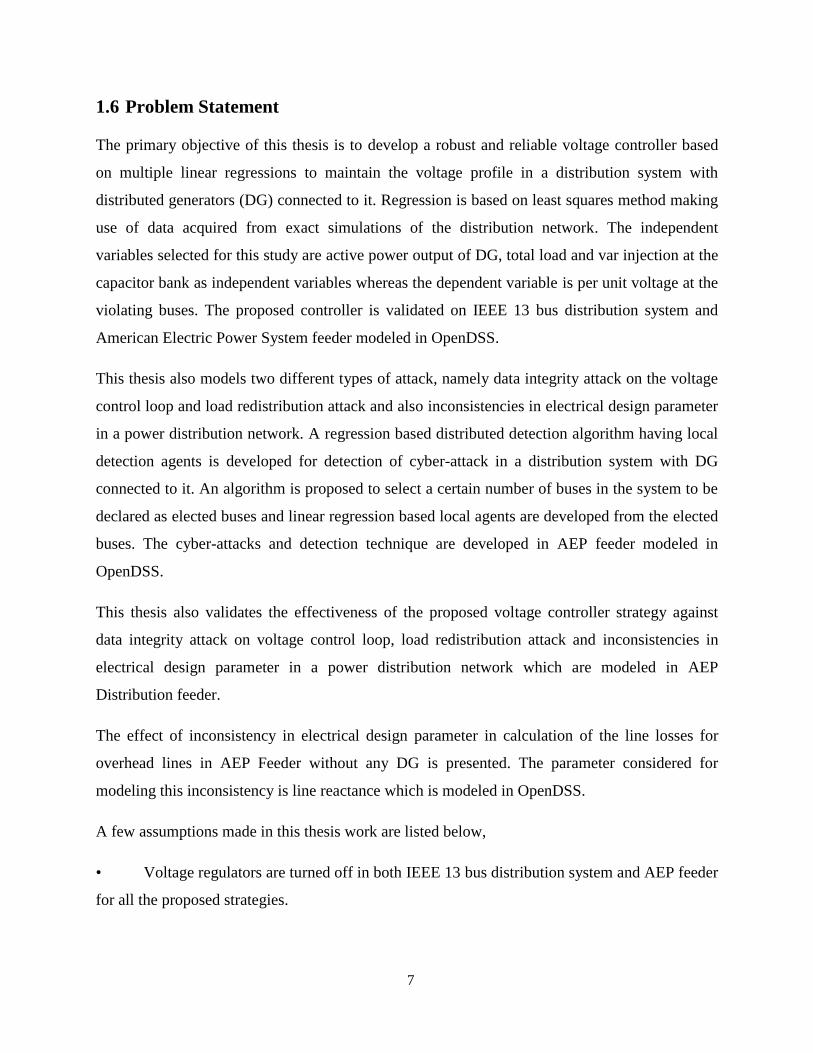
Similarly, specific deception attacks in the context of static estimators through SCADA systems,
known as false data injection attacks (FDIA) are described in [30-34].In FDIA an adversary aims
to hack the readings of multiple sensors to mislead smart grid’s decision making process.
Reference [30] shows modeling of a FDIA with incomplete knowledge of the power grid
parameter and real time attributes such circuit breaker positions, tap positions of the voltage
regulators, etc. It was proved that even if the attacker does not have access to full network
information the attack can still bypass the bad data detection techniques of the state estimator.
Also it has been shown in [32] that if the attacker knows the complete network conditions, the
FDIA cannot be detected by the bad data detecting techniques used by the present state
estimation systems. Reference [31] proposes a novel analytical method for doing the
vulnerability analysis of state estimation when it is under FDIA on the SCADA system of an
electric grid. Reference [34] also presents a deception attack on the state estimator through
SCADA with a perturbed or outdated model of the electric grid. Both linear and non-linear state
estimators are considered in this study. It was shown the more the accurate information the
attacker possesses the greater the threat of a deception attack becomes. Figure 5 shows a
schematic diagram of deception attack on state estimator in a power grid.
16
Figure 5 Deception Attack on State Estimator in a Power Grid [34]
Another subclass of the FDIA is load redistribution (LR) attack which has been recently studied
in [35-37]. Reference [35] models a LR attack which is an attack on the smart meters of a smart
grid changing the load at different buses in the system but maintaining the total load as it is. The
effect of this attack on security constrained economic dispatch (SCED) has been discussed. Also
it was proved that these LR attacks can bypass the bad detection schemes in if the network
conditions are known.
Reference [36] shows that an LR attack can be modeled which can bypass the bad data detection
techniques presently available even under incomplete network information. Quantitative analysis
of the damage that LR attacks can do to the power system operations and security is discussed in
[37] and the prevention measures are also provided.
The effects of data integrity cyber-attacks on the SCADA controlled voltage control loop of a
transmission system is shown in [44]. The voltage control provided by FACT devices is
targeted. The paper also explains by sensitivity analysis technique which device to attack to
affect which bus. Figure 6 explains the schematic of a SCADA controlled voltage loop in a
transmission system. Similarly the effect of cyber-attack on automatic generation control loop is
presented in [43].

17
Figure 6 SCADA Controlled Voltage Loop in a Transmission System [44]
With numerous diverse imminent cyber threats to the automated control systems and state
estimators of smart grids, the defensive mechanisms also have to build. Intuitively, there are two
approaches to protecting control applications of power grid. The first is to design robust control
algorithms that can detect or tolerate malicious data modification. The second is to protect the
sensor measurements and other data from being manipulated.
A lot of literature is available on the detection of cyber-attacks on state estimators through
SCADA systems [38-40]. Reference [38] proses a method of cyber-attack detection taking the
information from both the active power measurements and the reactive power measurements. It
was observed that this strategy pin pointed the exact transmission lines attacked. In [39] authors
propose a strategy of protecting a selected set of sensor measurements for detecting the attack by
verifying somehow those set of measurements. Reference [40] describes s fully distributed
procedure for the detection of cyber-physical attacks in power networks. In this study, the
network is divided into different areas as shown in figure 7 and then each area is monitored and
controlled by a local control center. A detection filter is designed based on sparse residual filter
in descriptor form.

18
Figure 7 Detection of Cyber-Attack with Local Agents for each Area [40]
References [41-42] propose physically protecting a certain number of the PMU out of the total
which is a tough task. Reference [41] using graph algorithms provides with the minimum
number of PMUs that need to be physically protected in order neutralize a cyber-attack. In [42]
the problem of selecting the small subsets of measurements that can be made immune to make
the whole system immune from data injection attack is solved. Since this problem becomes
really complex because of the large size of the electrical grid, a fast greedy algorithm is used for
placing secured PMUs.

19
Chapter 3: MATHEMATICAL MODEL AND
FORMULATION
3.1 Theory of Multiple Linear Regression (MLR) [48]
Multiple linear regression (MLR) is a method used to model the linear relationship between a
dependent variable and one or more predictor (independent) variables. The dependent variable
can be load, voltage per unit, transmission loss function, etc., and the independent variables are
the variables affecting these dependent variables in any way. The regression model expresses the
value of a dependent variable as a linear function of one or more predictor variables and an error
term.
𝑌 = 𝑏0 + 𝑏1𝑋1 +⋯+ 𝑏𝑘𝑋𝑘 + 𝑒 (1)
Where, 𝑌 is the dependent variable, 𝑋1, 𝑋2,…., 𝑋𝑘 are the predictor variables, 𝑏1, 𝑏2,…., 𝑏𝑘 are
regression parameters with respect to 𝑋1, 𝑋2,…., 𝑋𝑘, and 𝑒 is the error term.
Let each of the 𝑘 predictor variables, 𝑋1, 𝑋2,…., 𝑋𝑘, have 𝑛 levels. The system of 𝑛 equations can
be represented in matrix notation as follows:
Y = Xb + e (2)
Where
𝐘 =
(
𝑌1𝑌2………𝑌𝑛)
𝐗 =
(
1 𝑋11 𝑋12 … 𝑋1𝑘1 𝑋21 𝑋22 … 𝑋2𝑘
……
1 𝑋𝑛1 𝑋𝑛2 … 𝑋𝑛𝑘 )
𝐛 =
(
𝑏0𝑏1………𝑏𝑘)
𝐞 =
(
𝑒1𝑒2………𝑒𝑛)
The matrix 𝐗 contains information about the levels of the predictor variables at which the
observations are obtained. The vector 𝐛 contains all the regression coefficients. The difference
between the actual value of 𝑌 and the predicted value �̂� would, on average, tend toward 0, so it

20
can be assumed that the error term in equation (2) has an average value of 0. The error term can
therefore be omitted in calculating parameters.
The estimates of b are then obtained to get the regression model by using the least squares
method such that the sum-of-squares of differences of observed and predicted values is
minimized. The estimated b obtained is
�̂� = (𝑋′𝑋)−1𝑋′𝑌 (3)
The multiple linear regression model also referred as fitted model can now be estimated as:
�̂� = �̂�0 + �̂�1𝑋1 +⋯+ �̂�𝑘𝑋𝑘 (4)
Or in matrix notation: �̂� = 𝑋�̂� (5)
The observations, 𝑌𝑖, may be different from the fitted values �̂�𝑖 obtained from this model. The
difference between these two values is the residual, �̂�𝑖. The vector of residuals, �̂�, is obtained as:
�̂� = 𝑌 − �̂� (6)
The regression equation is estimated such that the total sum-of-squares can be partitioned into
components due to regression and residuals:
𝑆𝑆𝑇 = 𝑆𝑆𝑅 + 𝑆𝑆𝐸 (7)
Where
𝑆𝑆𝐸 = ∑ (𝑌𝑖 − �̂�𝑖𝑛𝑖=1 )2 sum of squares, error
𝑆𝑆𝑇 = ∑ (𝑌𝑖 − �̅�𝑛𝑖=1 )2 sum of squares, total
𝑆𝑆𝑅 = ∑ (�̂�𝑖𝑛𝑖=1 − �̅�)2 sum of squares, regression
�̅� : average value of 𝑌𝑖
The explanatory power of the regression is explained by its 𝑅2 value, calculated from the sums-
of-squares terms as

21
𝑅2 = 𝑆𝑆𝑅
𝑆𝑆𝑇= 1 −
𝑆𝑆𝐸
𝑆𝑆𝑇 ϵ [0,1] (8)
The residual mean square (MSE) is the sample estimate of the variance of the regression
residuals.
𝑀𝑆𝐸 = 𝑆𝑆𝐸
𝑛−𝑘−1 (9)
The 𝑅2 value and 𝑀𝑆𝐸 value are the two goodness of fit of measurements which explains how
well the predictor variables explain the dependent variable. The closer the 𝑅2 value is to 1 and
the smaller the 𝑀𝑆𝐸 value, the better the estimated regression function fits the data.
3.2 Modeling attacks and anomalies
There are two attacks considered here the data integrity and LR attack as well as inconsistencies
in electrical design parameters. This section models both the attacks and parameter
inconsistencies.
3.2.1 Inconsistencies in electrical design parameters
A distribution system model has many parameters which define it completely like line resistance
(R), line reactance (X), line geometry, conductor type, regulators type, etc. Any incorrect or
uninformed parameter will lead to model errors and hence risk of operation of the entire system.
Here inconsistencies are modeled as statistical variations with probabilities such as for example a
variation δX in a distribution line L with reactance X.
3.2.2 Data integrity attack [29]
This attack often requires detailed knowledge of the communication protocols to send false or
malicious status or control signals. [44] presents a data integrity attack on control signals of
voltage control of FACTs devices and substation controllers. Similar attack on a voltage control
loop of a distribution system is considered where the attacker gained information of a few critical
capacitors.
22
If u(t) is the actual signal from the control center and [umin (t), umax (t)] is the range of possible
control signals. Let us define “Min attack” as an attack where u(t) = umin (t) for t ∈ τa the
duration of attack and a “Max attack” as an attack where u(t) = umax (t). Such a min-max attack
is unobservable as presented in [29] and its effect is more profound in the region near the impact.
3.2.3 Load redistribution attack
This attack is a subclass of false data injection attack where the load changes by L + △ L at some
buses and L - △ L at other buses while the total load remains unchanged. It is assumed here that
only load bus power injection measurements and line power flow measurements can be attacked
and that physically protecting all the meters is not feasible. Also it has been proved theoretically
in [35] that LR attacks cannot be detected by any of the existing techniques for bad data
detection in a state estimator. However, since short-term load forecasting provides an
approximate estimation of the load, an attack that results in larger △ L may be detected so for an
undetectable attack, τ < 0.5 L and ∑𝐿 +△ 𝐿= L where τ is the load multiplier. So in our work,
we suppose that the attack magnitude for a load measurement does not exceed τ = 50% of its true
load value.
The essential conditions for creating undetectable load redistribution (LR) attacks are proposed
in [35]. For an undetectable load redistribution attack the total loading in the system should
remain the same i.e. ∑ 𝐿 +△ 𝐿= L. It is also essential that the change in load at each node should
remain within an acceptable limit which can be maintained by keeping τ < 0.5 L where τ is a
load multiplier.
23
3.3 Distributed Cyber Attack Detection Method
Consider a power system with a set of buses 𝜆, a set of buses L ⊂ 𝜆 with known demand, a set of
buses S ⊂ 𝜆 with solar generating units and a bus C ⊂ 𝜆 with a capacitor unit. Let the voltage of
a bus j 𝜖 J a set of {1, 2,…, 𝜆} buses, be given by 𝑉𝑝𝑢𝑗 where each element is a k-dimensional
real vector from k network conditions. A k-means clustering as in eq. (10) is employed where ⊂
𝑉𝑝𝑢µ𝑖 = 1
ℎ∗𝑘∑ (𝑉𝑝𝑢𝑎𝑖𝑘𝑖=1 + 𝑉𝑝𝑢𝑏𝑖 +⋯+ 𝑉𝑝𝑢ℎ𝑖) (10)
Cluster set S = { 𝑆1, 𝑆2,….., 𝑆𝑡} are assigned to datapoints where 𝑆𝑖 is the set of observations {
𝑉𝑝𝑢𝑎, 𝑉𝑝𝑢𝑏,….., 𝑉𝑝𝑢ℎ} and h ⊂ 𝜆.
An agent 𝐴𝑗 from a cluster 𝑆𝑗 is
min𝑖 ∑ |(𝑉𝑝𝑢𝑗 − 𝑉𝑝𝑢µ𝑖)|𝑘𝑖=1 ⩝ 𝑗 = 𝑎, 𝑏, … , ℎ (11)
From a highly correlated set of agents 𝐴𝑖 and 𝐴𝑗 an agent pair is created where 𝐴𝑗 𝜖 𝑆𝑗 ∩ 𝐴𝑖 𝜖 𝑆𝑖
= ϕ and 𝑆𝑖 𝑎𝑛𝑑 𝑆𝑗 ⊂ S. Consider the behavior of agent 𝐴𝑖 on 𝑉𝑝𝑢𝑗 as a regressive model given
by eq. (12).
𝑉𝑝𝑢𝑚(𝑘) = 𝑏0 + 𝑏1𝑉𝑝𝑢𝑛(𝑘) + 𝑒1(𝑘) (12)
The calculation of the coefficients 𝑏𝑖 result in eq. (13)
�̂�𝑝𝑢𝑚 = �̂�0 + �̂�1𝑉𝑝𝑢𝑛 (13)
Similarly, the statistical relationships between all the selected agent pairs are declared as shown
in figure 3. A distribution network under cyber-attack with the bus voltages of the elected pair is
compared to corresponding bus voltages in (13) obtained from the same network. If the variation
exceeds a certain limit, the agent declares a cyber-attack event. A consensus of at least two agent
pairs results in a final decision of cyber-attack event.

24
3.4 Proposed Voltage Controller Methodology
Consider a power system with a set of buses 𝜆, a set of buses L ⊂ 𝜆 with known demand, a set of
buses S ⊂ 𝜆 with solar generating units and a bus C ⊂ 𝜆 with a capacitor unit. Let total
combined real power demand at buses 𝐿 be 𝑑, the real power generated at bus 𝑆 be p, the total
kVars injected by the capacitor at bus 𝐶 be Kvar, and the voltage per unit at a bus 𝑗 from set 𝜆 is
𝑉𝑝𝑢𝑗. The variables of total loading of the system, the real power output of the DG connected
and the reactive power of the capacitor having a correlation with node voltage j are chosen as
predictor variables. The dependent variable is the voltage in p.u. (Vpu) at any bus j violating
voltage limits.
A statistical model of dependent variable, with defined predictor variables is given by eq. (14).
𝑉𝑝𝑢𝑗(𝑘) = 𝑏0 + 𝑏1𝑑(𝑘) + 𝑏2𝑝(𝑘) + 𝑏3𝐾𝑣𝑎𝑟(𝑘) + 𝑒(𝑘) (14)
A calculation of coefficients of 𝑏𝑖 yields eq. (15) for Vpu of a bus j which is further used for
voltage control.
�̂�𝑝𝑢𝑗 = �̂�0 + �̂�1 𝑑 + �̂�2𝑝 + �̂�3𝐾𝑣𝑎𝑟 (15)
Similarly, statistical models are developed for all the buses prone to voltage violations in the
distribution system. Once the statistical models are obtained from Minitab software for the
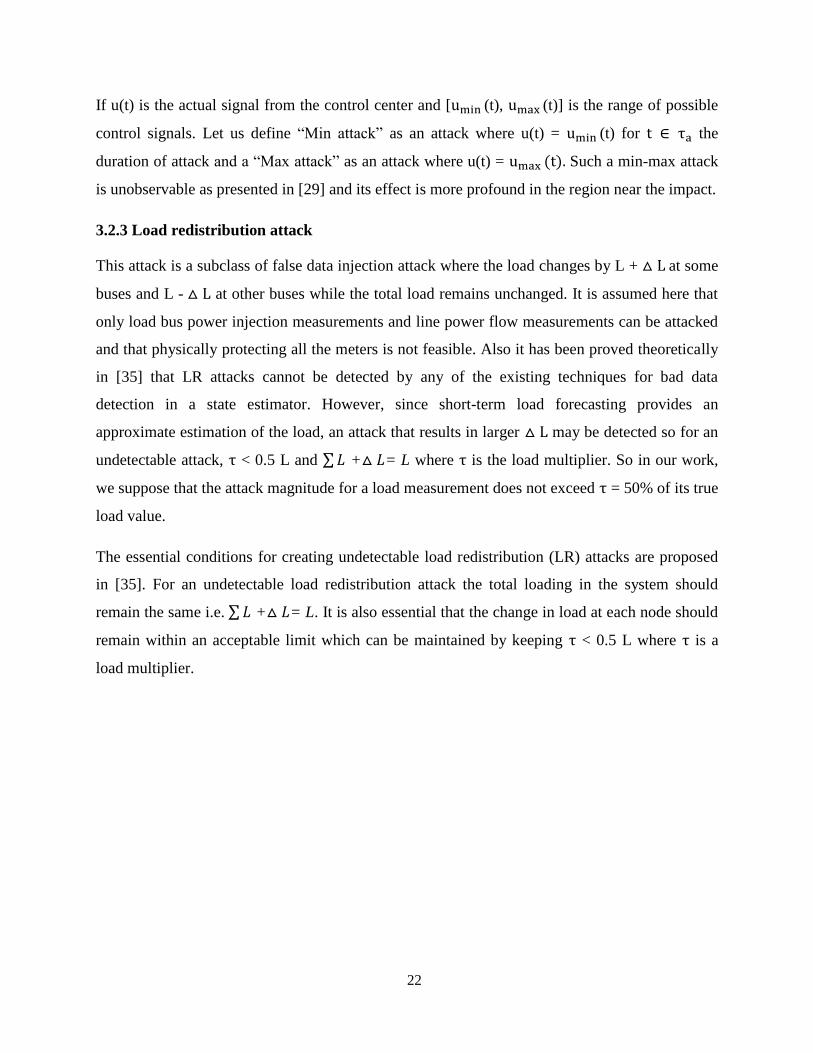
chosen distribution system, statistical reactive power model algorithm for calculation of kVars
required to bring the voltage of the violated buses within the permissible limits is developed in
Matlab. The inputs for the Kvar calculation model are the statistical models from eq. (15) and the
required voltage at the violated bus and the output is the estimated kVars required to correct the
voltage violations in that bus as shown in figure 8.
The estimated kVars obtained from this algorithm is not affected by data injection attacks till the
network topology changes as the statistical models from eq. (15) are obtained from validated
data sets of the dependent and predictor variables.
25
Figure 8 A Statistical Reactive Power Model Algorithm
26
Chapter 4: SIMULATION TOOLS AND SOFTWARE
This chapter briefly describes various software packages used in this thesis for modeling
the electric distribution system, to make the voltage controller models and study their effects
under different abnormal conditions and cyber-attack detection models.
Out of the various commercially available simulation tools for modeling utility distribution
systems we chose OpenDSS for doing distribution power flow in this thesis. The other software
tools were CYMDIST, Milsoft, Windmil, etc. The voltage controller models are developed in
MATLAB with the distribution network of OpenDSS being interfaced with it through COM
Interface.
The multiple linear regressions among the chosen dependent and independent variables for
developing the voltage controller models and cyber-attack detection models are made in Minitab
software. Other software used for doing regression analysis is STATA, data analysis package of
MS Excel, etc. but we chose Minitab for its excellent representation of the results. The tools used
in this research work are described with their abilities and their detailed importance in the
following sections.
4.1 Open Distribution System Simulator (OpenDSS)
The Open Distribution System Simulator (OpenDSS or simply DSS) is an all-inclusive electrical
system simulation tool for electric utility distribution systems. OpenDSS is open source software
developed by the Electric Power Research Institute [45]. It can be used to steady state analysis,
integration of distributed generation and time series power flow. It has also developed various
test cases for all IEEE benchmark test feeders starting from IEEE 4 node to IEEE 8500 node test
feeders. It provides two implementations; first one is a standalone executable platform and the
other one is through COM server DLL, which can be used to drive OpenDSS from a myriad of
other platforms. The executable version makes use of basic direct script codes through which
user can develop circuits and solve them. The COM interface enables the user to drive OpenDSS
externally from any third party analysis programs like MATLAB, VBA, C#, Pyhton etc. and

27
execute custom solution modes and features of the simulator. The DSS is designed in such a way
so that it can to be effortlessly altered to meet future needs.
The OpenDSS program can be used for the following applications [45]:
• Distribution Planning and Analysis
• General Multi-phase AC Circuit Analysis
• Analysis of Distributed Generation Interconnections
• Annual Load and Generation Simulations
• Risk-based Distribution Planning Studies
• Neutral-to-earth Voltage Simulations
• Solar PV System Simulation
• Wind Plant Simulations
• Storage Modeling
• Distribution Feeder Simulation with AMI Data
• Distribution State Estimation
• EV Impacts Simulations
• Analysis of Unusual Transformer Configurations
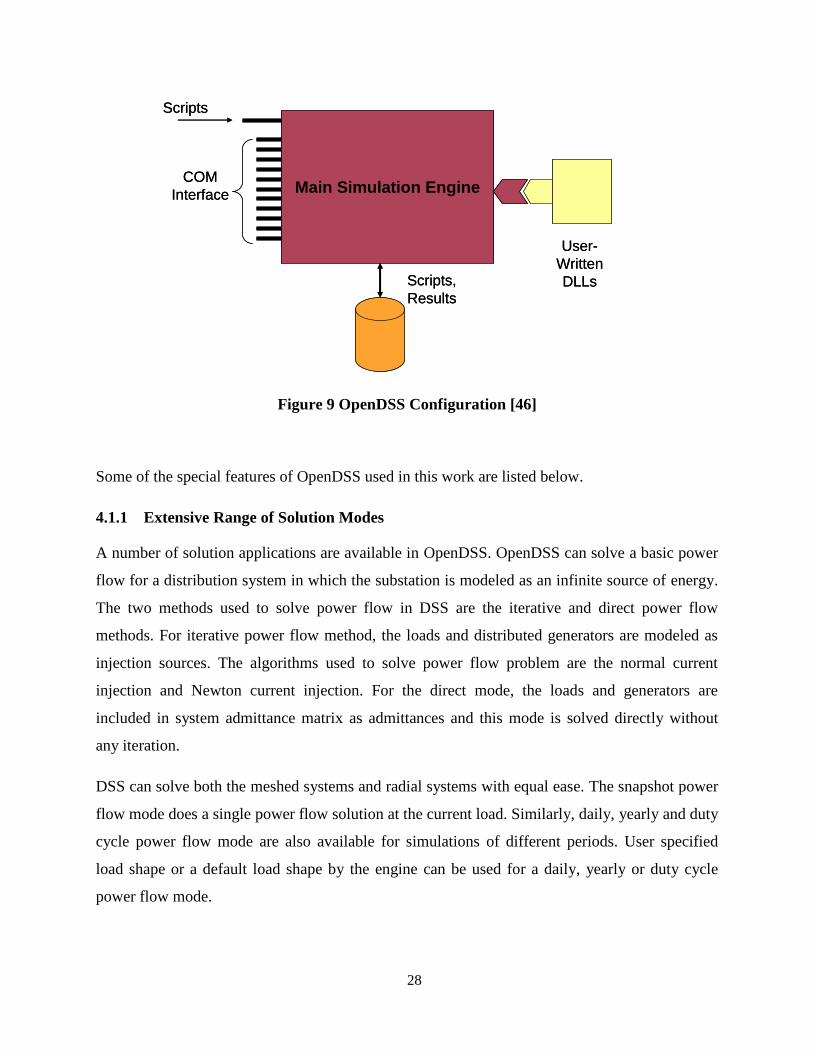
OpenDSS configuration is shown in figure 9 [46] which show the three different ways by which
the DSS engine can be initiated.
• OpenDSS scripts – Using direct scripting codes to define the circuit and solve it.
• COM interface – Driving it externally from any third party analysis program.
• User Written DLL – Writing suitable DLL which can be linked with the engine.
28
Figure 9 OpenDSS Configuration [46]
Some of the special features of OpenDSS used in this work are listed below.
4.1.1 Extensive Range of Solution Modes
A number of solution applications are available in OpenDSS. OpenDSS can solve a basic power
flow for a distribution system in which the substation is modeled as an infinite source of energy.
The two methods used to solve power flow in DSS are the iterative and direct power flow
methods. For iterative power flow method, the loads and distributed generators are modeled as
injection sources. The algorithms used to solve power flow problem are the normal current
injection and Newton current injection. For the direct mode, the loads and generators are
included in system admittance matrix as admittances and this mode is solved directly without
any iteration.
DSS can solve both the meshed systems and radial systems with equal ease. The snapshot power
flow mode does a single power flow solution at the current load. Similarly, daily, yearly and duty
cycle power flow mode are also available for simulations of different periods. User specified
load shape or a default load shape by the engine can be used for a daily, yearly or duty cycle
power flow mode.
Main Simulation EngineCOM
Interface
Scripts
Scripts,
Results
User-
Written
DLLs
Main Simulation EngineCOM
Interface
Scripts
Scripts,
Results
User-
Written
DLLs

29
After solving the power flows, losses, voltages, currents and other data are accessible for the
feeder system. The losses in terms of kW or kVar losses for each time instant for all the zones
and loads are provided by the energy meters. A three phase unbalanced distribution power flow
for the AEP feeder is performed using OpenDSS in this thesis. Also a PV unit and a capacitor
bank are connected for the calculation of voltage controller in OpenDSS and the power flows are
calculated.
4.1.2 COM Interface
The most useful feature of OpenDSS is the COM interface which allows user to execute custom
solutions modes from an external platform and drive the DSS simulator from that platform and
perform various analyses that cannot be done using the direct script codes. The third party
programs are MS Office tool through VBA, MATLAB, Python, C# etc. Also through COM
interface user can do solve loops like for, if, if then else etc. which are not available in the direct
scripts in DSS. Most of the results of the DSS engine can also be retrieved through the COM
interface.
This Interface is used to drive the OpenDSS through MATLAB and calculate the required kVars
from the capacitor bank for different network conditions and line losses for different geometries
in the distribution networks for the study in our thesis.
4.2 Minitab
Minitab is a statistics package developed at the Pennsylvania State University by researchers
Barbara F. Ryan, Thomas A. Ryan, Jr., and Brian L. Joiner in 1972. It can be used to do various
types of regression analysis like linear regression, non-linear regression, and orthogonal
regression. It is also used for doing time series plots, developing ANOVA tables, correlation
analysis, cascading of graphs and various other functions.
Minitab is used in our thesis to do the regression analysis for the voltage controller models and
the cyber-attack detection models. It is also used to present the results in a more accurate way.

30
Chapter 5: SIMULATION AND RESULTS
This chapter discusses all the results of this research by introducing the test systems used
and the algorithms simulated on these test systems. Also, the behavior of the test systems are
studied through voltage and loss analysis results. Interpretations are drawn from these resultant
plots to back the proposed ideas and goals of this thesis work.
5.1 13-Bus Distribution System
A 13-bus distribution system, shown in figure 10, is used to illustrate the proposed voltage
controller based on MLR technique. System parameters include:
• total load of 3466 kW and 2102 kvar
• two 600-kvar capacitor banks (bus 675 and bus 611)
Figure 10 IEEE 13 Bus Distribution Test Feeder
The regulator controls are turned off to enhance the effects the capacitor control, and a 3-phase
solar generating unit is added at bus 632. Power flow is run on the system for different loading
and DG power output. Voltages of two buses, bus 652 and bus 684 violated the permissible
limits. A 2-phase capacitor is added at bus 684 which is a logical choice as the bus 684 violated
the voltage limits. Regression models are developed, taking the voltage in p.u.at each bus as the
dependent variable in each model. A data set of 36 observations is generated with the OpenDSS
for some randomly selected values of predictor variables and the correspondingly obtained

31
dependent variable. The models are regressed and the coefficient of determination 𝑅2, and the
mean squared error 𝑀𝑆𝐸 are calculated.
Table 1 show the regression models obtained for bus 652 and 684 and their corresponding 𝑅2
and MSE values. It can be seen that R2 values are close to one and MSE values are close to zero
for all the models showing a good fit and proving that the predictor variables are able to explain
almost 100 % variations in the dependent variable. Moreover, the normal probability plot of the
residual for the regression models shown in figure 11 also shows that most of the red points are
clustered around blue line indicating that the error terms are approximately normal indicating the
goodness of fit of all the models.
Table 1. Regression Models for Voltage in p.u. for Buses 652 and 684
Bus 𝐑𝐞𝐠𝐫𝐞𝐬𝐬𝐢𝐨𝐧 Model 𝑹𝟐 𝑴𝑺𝑬
652 1.014169 – 0.09631*𝑑 +5.62e-06*𝑝 + 6.77e-05*𝐾𝑣𝑎𝑟 0.9957 2.79e-05
684 1.014493 – 0.09142*𝑑 +5.54e-06*𝑝 + 6.8e-05*𝐾𝑣𝑎𝑟 0.9977 2.74e-06
0.0040.0030.0020.0010.000-0.001-0.002-0.003-0.004
99
90
50
10
1
Residual
Pe
rce
nt
0.0040.0030.0020.0010.000-0.001-0.002-0.003-0.004
99
90
50
10
1
Residual
Pe
rce
nt
Vpu at node 652
Vpu at node 684
Figure 11 Normal Probability Plots for the Regression Models for Buses 652 and 684

32
The Kvars calculation models (Model 2) developed in Matlab from the statistical reactive power
model algorithm are validated for some random values of loading and real power output of the
PV unit as shown in table 2. The Kvars calculated from Model 2 are compared with the Kvars
obtained from a conventional capacitor controller (Model 1) in OpenDSS to bring the voltage in
pu at the violating buses to 0.95 pu. It is observed that the Kvars values from both the models are
really close.
Table 2. Controller Validation for the kVar Calculation Models
Load
PV output
(kW)
𝐕𝐩𝐮
Required
kVars (652) kVars (684)
Model 1 Model 2 Model 1 Model 2
1.205 0 0.95 788 766.4 691 671.6
1.401 8 0.95 1055 1044.6 942 934.4
1.058 520 0.95 539 514.1 456 431.6
1.208 480 0.95 752 730.8 655 636.5
1.352 120 0.95 978 965.5 870 859.4
0.975 0 0.95 468 439.2 391 362.4
Simulation results on a real-world, large-scale distribution system is presented next. The
accuracy of the proposed voltage controller based on MLR technique is demonstrated, its
robustness with inconsistencies in electrical design parameters and cyber-attack conditions is
also shown. The accuracy of the proposed distributed cyber-attack detection technique is also
validated for both the cyber-attacks. Specifically, this section will present the following:
5.2 AEP Test Circuit
In previous research work co-authors [47] have modeled AEP system and studied impact of PV
penetration. The AEP feeder I, shown in figure 12, is radial 395 buses system and is fed by a
12.47 KV medium voltage substation modeled as a voltage source behind impedance. The
distribution system includes two main circuits with laterals and distributed loads. The aggregated
loads represent a mixture of residential and industrial loads and the total load on the system is

33
2.27 MVA (2.042 MW and 1.00 MVAR) and the active power losses represent 1.52 % of the
total system load. The load buses in this system are modeled as PQ loads. Three voltage
regulators (two 3-phases and one single phase) employed in this feeder are turned off. A 3-phase
solar power generating unit is added at bus 43_west and a 1-phase capacitor is added at bus
131_west.3.
Figure 12 AEP Feeder 1 Network Diagram
5.2.1 MLR based Statistical Voltage Controller
A an unbalanced three-phase power flow (UTDPF) is performed to obtain voltage profile of the
distribution system. The active power generation of the renewable generators in the system is
increased according to their daily generation curve and a power flow solution is again performed
to obtain the voltages of the buses. Starting from the substation the sections where the voltage is
most frequently violated for different network conditions are identified. These sections also form
a logical choice for location of capacitors. With variations in active power generation, four buses
34
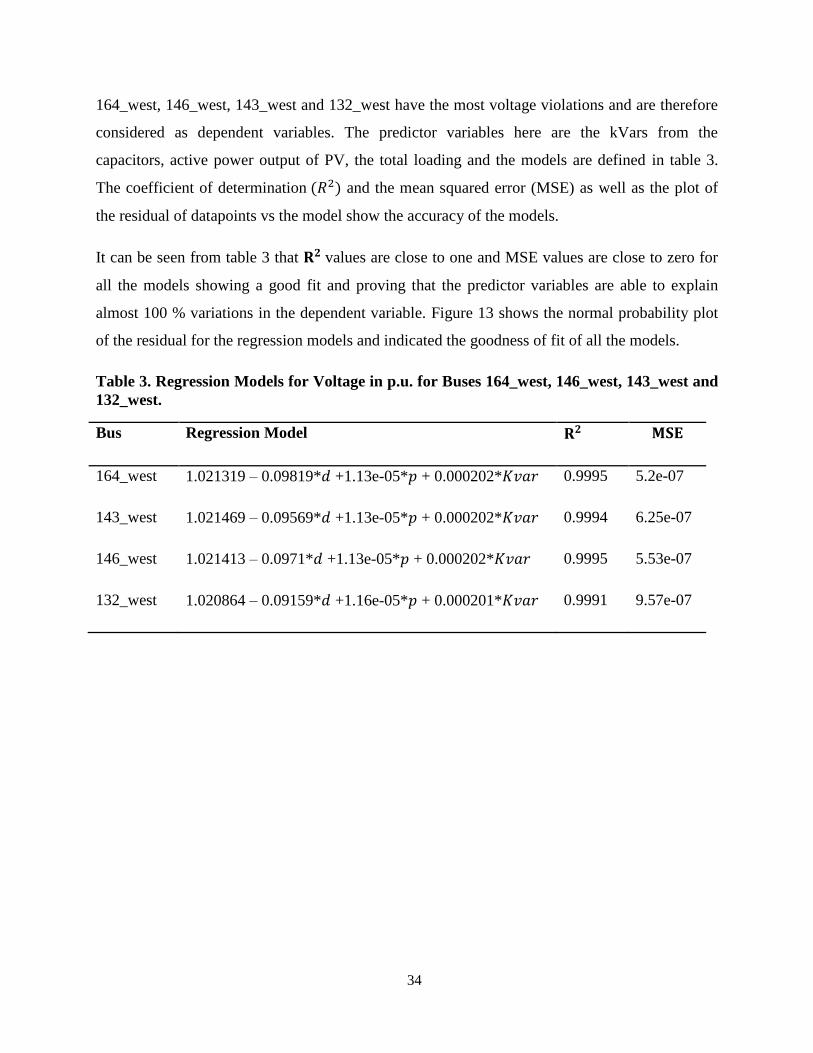
164_west, 146_west, 143_west and 132_west have the most voltage violations and are therefore
considered as dependent variables. The predictor variables here are the kVars from the
capacitors, active power output of PV, the total loading and the models are defined in table 3.
The coefficient of determination (𝑅2) and the mean squared error (MSE) as well as the plot of
the residual of datapoints vs the model show the accuracy of the models.
It can be seen from table 3 that 𝐑𝟐 values are close to one and MSE values are close to zero for
all the models showing a good fit and proving that the predictor variables are able to explain
almost 100 % variations in the dependent variable. Figure 13 shows the normal probability plot
of the residual for the regression models and indicated the goodness of fit of all the models.
Table 3. Regression Models for Voltage in p.u. for Buses 164_west, 146_west, 143_west and
132_west.
Bus Regression Model 𝐑𝟐 𝐌𝐒𝐄
164_west 1.021319 – 0.09819*𝑑 +1.13e-05*𝑝 + 0.000202*𝐾𝑣𝑎𝑟 0.9995 5.2e-07
143_west 1.021469 – 0.09569*𝑑 +1.13e-05*𝑝 + 0.000202*𝐾𝑣𝑎𝑟 0.9994 6.25e-07
146_west 1.021413 – 0.0971*𝑑 +1.13e-05*𝑝 + 0.000202*𝐾𝑣𝑎𝑟 0.9995 5.53e-07
132_west 1.020864 – 0.09159*𝑑 +1.16e-05*𝑝 + 0.000201*𝐾𝑣𝑎𝑟 0.9991 9.57e-07

35
0.0020.0010.000-0.001-0.002
99
90
50
10
1
Residual
Pe
rce
nt
0.0020.0010.000-0.001-0.002
99
90
50
10
1
Residual
Pe
rce
nt
0.0020.0010.000-0.001-0.002
99
90
50
10
1
Residual
Pe
rce
nt
0.0040.0020.000-0.002
99
90
50
10
1
Residual
Pe
rce
nt
Vpu at node 164_WEST Vpu at node 143_WEST
Vpu at node 146_WEST Vpu at node 132_WEST
Figure 13 Normal Probability Plots for the Regression Models for Buses 164_west,
146_west, 143_west and 132_west
The reactive power outputs from the regressive model (Model 2) for a typical 24 hour load curve
with a peak load of 1.42 KW are shown in figure 14. These reactive power requirements are
compared with those obtained from a traditional capacitor control achieved in OpenDSS (Model
1) and as seen in figure 14.

36
Figure 14 Controller validation for the Kvar calculation models for buses 164_west,
146_west, 143_west and 132_west
Model 1 Model 2 Model 1 Model 2 Model 1 Model 2 Model 1 Model 2
1 85% 0% 234.5 232.7 219 217 227.5 225.7 198.5 196.5
2 85% 0% 234.5 232.7 219 217 227.5 225.7 198.5 196.5
3 85% 0% 237 235.1 221 219.4 230 228.1 201 198.8
4 86% 0% 244.5 242.4 228.5 226.5 237.5 235.3 208 205.6
5 99% 1% 332.5 327.6 314 309.5 324.5 319.6 290.5 285.5
6 100% 5% 341 335.5 322 317.2 332.5 327.4 298 292.8
7 95% 15% 302.5 299.1 280.5 281.6 295 291.3 262 258.3
8 95% 40% 289.5 286.3 271.5 269 281.5 278.6 249 245.6
9 91% 52% 261 259 244 242.2 253.5 251.5 222 219.5
10 85% 60% 215.5 214 199.5 198.3 208.5 207 179 177.1
11 79% 65% 175 173.4 160 158.7 168.5 166.9 141 138.9
12 79% 68% 174 172.4 159 157.7 167.5 165.9 140 137.9
13 75% 65% 140 139.4 126.5 125.6 134 133.2 108.5 107
14 63% 61% 66.5 62.5 54.5 50.6 61 57.2 39.5 35.1
15 56% 48% 20.5 14.8 10.5 4.3 16 10.1 0 0
16 55% 35% 20 14.3 10 4 15.5 9.7 0 0
17 49% 10% 0 0 0 0 0 0 0 0
18 56% 1% 38 33 27.5 22.5 33.5 28.3 14 9.3
19 56% 0% 38.5 33.4 28 22.8 34 28.6 14.5 9.7
20 69% 0% 123 120.9 110 108.1 117.5 115.1 94 91.7
21 54% 0% 26.5 21.2 16.5 11 22 16.6 3.5 0
22 80% 0% 199.5 197.7 184.5 182.9 192.5 191.1 165.5 163.7
23 88% 0% 260 257.5 243.5 241.2 252.5 250.2 222 219.8
24 96% 0% 311 307 293 289.5 303 299.3 270 266.2
Kvar (164_WEST) Kvar (143_WEST) Kvar (146_WEST) Kvar (132_WEST)Hours Load PV Power Output

37
5.2.2 MLR based Controller Performance
In this section, the MLR controller is tested for model consistencies and cyber-attacks. Controller
performance under model inconsistency in line of increase in reactance from 1.79 pu to 3.79 pu
is considered. Also deception attack is simulated by manipulating the reactive power injection
control signal of the capacitor at 131_west from 150 kVar to 300 kVar (50%). An LR attack is
simulated by manipulating the load value at 644_7231501-1 from 75 kW to 150 kW and
decreasing the load value at 382_7231503-1 from 22.5 kW to 147.5 kW. It should be noted that
these events are not simulated simultaneously.
Line Geometry (an example to show the effect of inconsistency of electrical design parameters)
AEP feeder 1 has both overhead lines and underground cables giving away the line losses, but
the considerable amount of the losses are given by the overhead lines. Overhead lines have 3
different types of lines having different types of geometries, 2 conductor type, 3 conductor type
and 4 conductor type. The 2 conductor type and 4 conductor types, having 17 and 14 different
types of line geometries present respectively, are the maximum losses giving lines. For this
work, a unity load is taken and no DG is added to the system.
Figure 15 and 16 show the losses on four separate, maximum losses giving lines of a 2 conductor
type line and 4 conductor type lines, respectively. The bars with white dots are the lines losses
with their original line geometry whereas the remaining of the bars for that line is when other
line geometries are used to calculate the losses in those lines. It is observed that line losses are
dissimilar for different line geometries used for a same line and this type of inconsistency of an
electrical design parameter can result in a catastrophe if we use the results of these for solving
some problem related to a distribution system.

38
Figure 15 Losses in Four Maximum Losses giving Lines with Each Type of Line Geometry
for 2-Conductor Type Line
Figure 16 Losses in Four Maximum Losses giving Lines with Each Type of Line Geometry
for 4-Conductor Type Line
0
500
1000
1500
2000
2500
3000
3500
4000Lo
sse
s (W
atts
)
124_WEST
108_WESTSECONDPART
108_WESTFIRSTPART
101_WEST
0
2000
4000
6000
8000
10000
12000
14000
16000
Loss
es
(Wat
ts)
57_WEST
56_WEST
41_WEST
40_WESTFIRSTPART

39
Figure 17 Controller Testing for the Voltage Controllers against Electrical Design
Parameter Inconsistencies, Deception Attack and LR Attack
The predictor variables are plotted as shown in figure 17 for a 24 hour period under conventional
capacitor control (Model 1), MLR base voltage controller (Model 2), conventional capacitor
control with inconsistency in reactance (Model 3), conventional capacitor control with deception
attack (Model 4), and conventional capacitor control with LR attack (Model 5) for a 24 hour
period with the load and solar generation output curve as given in figure 14. It is observed that
voltage in pu calculated from conventional voltage control with inconsistency, deception attack
and LR attack have a high deviation from the controller without any abnormality. Moreover, it
can be seen that Model 1 and Model 2 maintain the voltage in pu within the permissible range
whereas in Model 3, Model 4 and Model 5, the controllers fail to maintain the voltage in pu
within the permissible limits for certain hours in a 24 hours period during which the system
operations might get disturbed.

40
5.2.3 Cyber Attack Distributed Detection Method
Unbalanced three-phase distribution power flow solutions are obtained for AEP distribution
system under 25 different network conditions. Data sets of voltage in pu for all the buses in the
system are calculated using OpenDSS. As discussed in section 3.3 four clusters sets are formed
as shown in figure 18 and six agent pairs are identified. These data sets are divided into different
clusters using the k-means clustering method done in Matlab. Only four clusters are made as
with increase in number of clusters the separation between them decreases and decreasing the
number of clusters results in fewer agents. It can be observed from the silhouette plot in the
figure 18, that most points in the first, third and fourth cluster have a large silhouette value,
greater than 0.8, indicating that these clusters are somewhat separated from neighboring clusters.
However, the second cluster contains many points with low silhouette values with negative
values also, indicating that this cluster is not well separated.
Models based on MLR obtained for the agent pairs are defined in table 4. The coefficient of
correlation is greater than 0.98 and MSE close to zero show good fit and also the agent pairs
belong to different cluster sets. Figure 19 shows the normal probability plot of the residual for
the statistical models for attack detection and indicate the goodness of fit of all the models.
The total number of buses, the centroid value and the two elected buses based on the lowest sum
of absolute values are shown in table 5 for each cluster. Total six elected pairs are identified from
the whole network. Linear regression analysis is done on the elected pairs in Minitab software to
get six local agents.
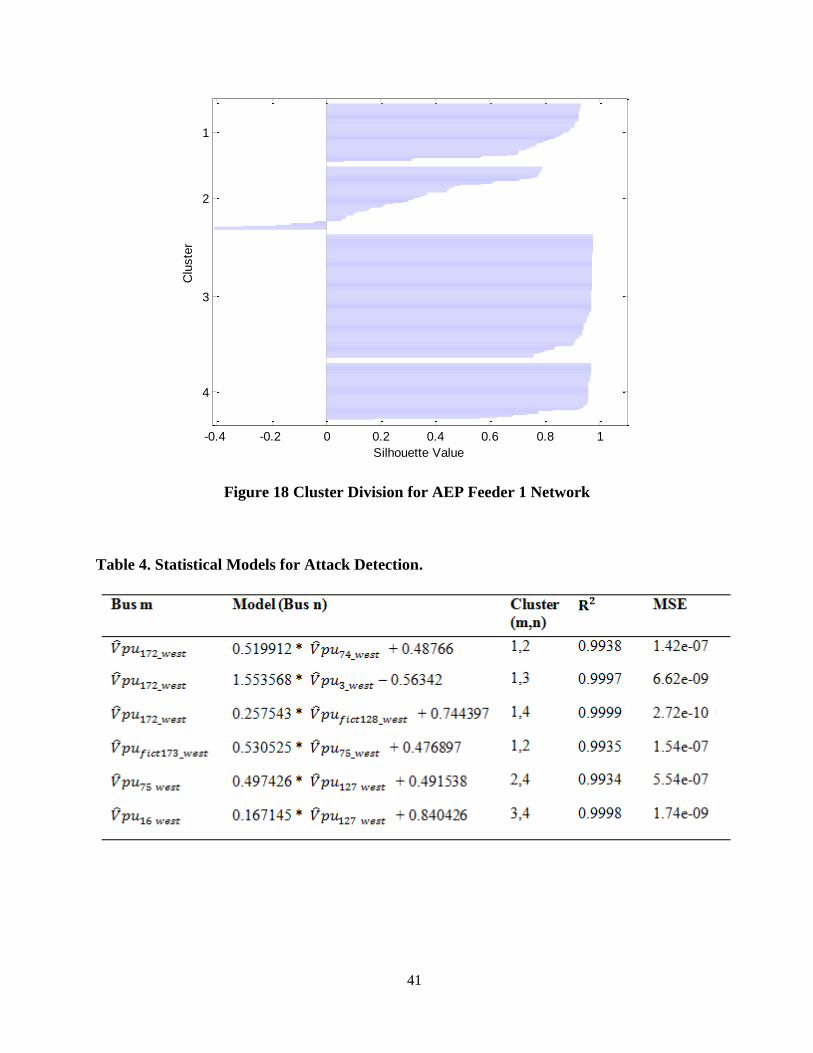
41
Figure 18 Cluster Division for AEP Feeder 1 Network
Table 4. Statistical Models for Attack Detection.
-0.4 -0.2 0 0.2 0.4 0.6 0.8 1
1
2
3
4
Silhouette Value
Clu
ste
r
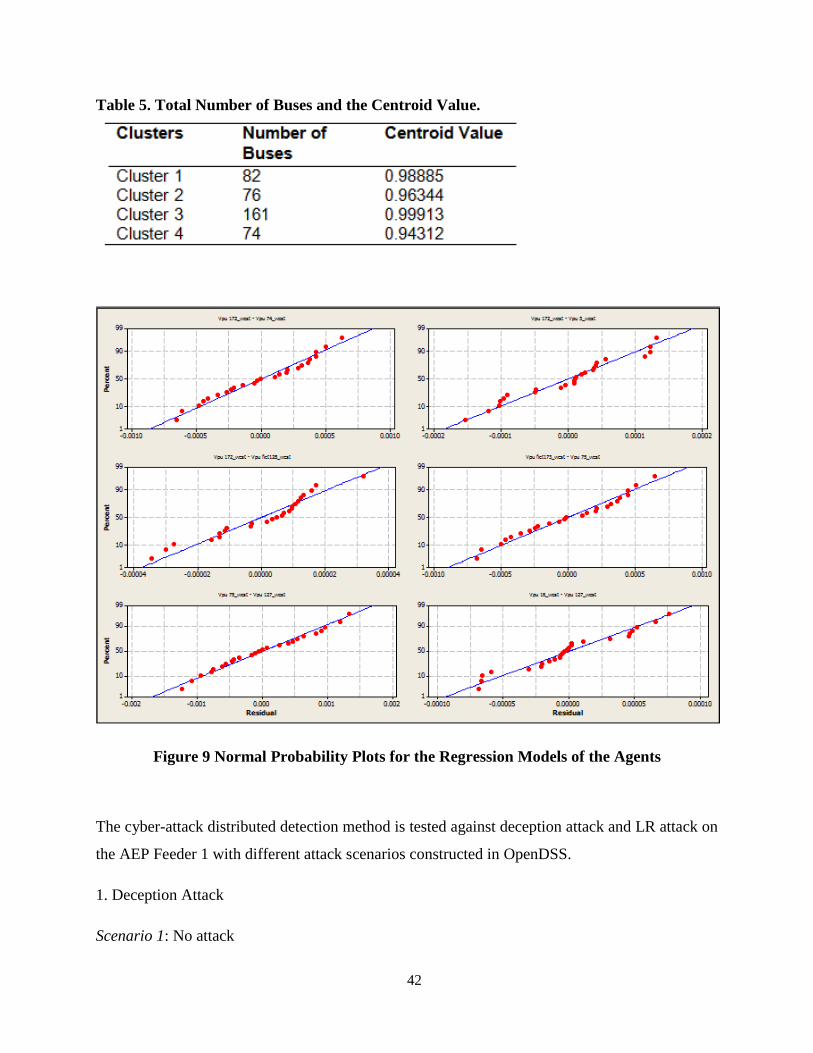
42
Table 5. Total Number of Buses and the Centroid Value.
Figure 9 Normal Probability Plots for the Regression Models of the Agents
The cyber-attack distributed detection method is tested against deception attack and LR attack on
the AEP Feeder 1 with different attack scenarios constructed in OpenDSS.
1. Deception Attack
Scenario 1: No attack

43
Scenario 2: Increase in var injection of capacitor at 131_west from 150 kVar to 300 kVar (50%)
Scenario 3: Decrease in var injection of capacitor at 131_west from 150 kVar to 75 kVar (50%)
Scenario 4: Increase in var injection of capacitor at 131_west from 150 kVar to 180 kVar (20%)
2. Load Redistribution Attack
Scenario 1: No attack
Scenario 2: Increase in load 644_7231501-1 from 75 kW to150 kW and decrease in load
382_7231503-1 from 222.5 kW to 147.5 kW
Scenario 3: Increase in load 25_7231504-1 from 160 kW to 270 kW and decrease in load
382_7231503-1from 222.5 kW to 112.5 kW
Scenario 4: Decrease in load 331_7231503-1 from 115 kW to 60 kW and increase in load
322_7231503-1 from 75 kW to130 kW
Figure 20 and figure 21 show the local decision by each agent and the final decision for the
scenarios presented above for deception attack and load redistribution attack respectively. Here,
the green blocks indicate “no cyber-attack” decision whereas red blocks indicate “cyber-attack”
decision provided by the agents. It is observed that the proposed detection method provide
accurate decision for all the scenarios for both the attacks. It is inferred that for the deception
attack case, most of the agents detect the attack as the effect of the change in the var injection by
the capacitor causes significant effect on the per unit voltages in the system. Whereas for the LR
attack case, comparatively fewer agents detect the attack, as the individual loads that are
modified by the attack has insignificant value when compared to the total load of the system in
AEP Feeder 1.

44
Figure 20 Decision Table for Deception Attack
Figure 21 Decision Table for LR Attack

45
Chapter 6: CONCLUSION AND FUTURE WORK
6.1 Conclusion
In this thesis, a novel multiple linear regression based method to control the bus voltages
in a distribution system with renewable sources is proposed. A statistical distributed detection
technique based on local decision making agents is proposed and validated. These proposed
methods are demonstrated on a real world distribution system feeder, AEP system Feeder 1
modelled in OpenDSS whereas the regression modellings are done in Minitab software. The
conclusions drawn from both these works have been presented in this section.
6.1.1 Voltage Controller Strategy
In this thesis, a robust and reliable voltage controller based on multiple linear regressions to
maintain the voltage profile in a distribution system with distributed generators (DG) connected
to it is developed. The proposed controller is validated on IEEE 13 bus distribution system and
American Electric Power System feeder modeled in OpenDSS.
The results showed that the developed strategy for voltage control involve exact network
simulations initially, but once the models are designed no further calculations are required unless
the network topology changes. Also the effectiveness of the proposed method is shown in the
presence of inconsistencies in electrical design parameters, data integrity attacks and LR attacks
which make them a viable alternative to the conventional capacitor controller.
6.1.2 Distributed cyber-attack detection technique
A regression based distributed detection algorithm having local detection agents is developed for
detection of cyber-attack in a distribution system with DG connected to it. An algorithm is
developed to select a certain number of buses in the system to be declared as elected buses pairs
and linear regression based local agents are developed from the elected pairs of buses. The
cyber-attacks and detection technique are developed and validated in AEP feeder modeled in
OpenDSS.

46
The results showed that the developed technique for cyber-attack detection involve exact
network simulations initially, but once the methods are designed no further calculations are
required unless the network topology changes. The elected buses for developing the agents being
distributed sparsely along the feeder and having really high correlation among them detected all
the attack scenarios with accurate precision.
6.2 Future Work
Voltage control and cyber-attack detection techniques in the present smart grid depend on the
real time data communication and validation of the variables affecting them respectively in a
distribution system. Also the frequently changing topology of the distribution system should be
accurately modeled and in a quick span of time for a better and accurate assessment.
For our study, the variations of the tap settings of the voltage regulators can be included in the
regression analysis when forming the statistical models for voltage control and attack detection.
Also if there is some provision of updating these models after some specified interval of time or
after some change in the topology in the distribution system is detected then these statistical
models can be applied to the real world. The number of chosen buses can be increased to
increase the total agents in the distribution system for further increasing the accuracy for
detection of cyber-attack.

47
References
1. “Smart Grid: An Introduction”, Program Concept paper, U.S. Department of Energy,
2001.
2. Rabinowitz M., “Power Systems of the Future”, IEEE Power Engineering Review, 2000.
3. Chen C., Zhu Y., Xu Y., “Distributed generation and Demand Side Management”,
Proceedings of the 2010 China International Conference on Electricity Distribution, 13-
16 Sept. 2010, pp. 1-5.
4. Guan F. H., Zhao D. M., Zhang X., Shan B.T., Liu Z., “Research on distributed
generation technologies and its impacts on power system”, Proceedings of the
International Conference on Sustainable Power Generation and Supply, 6-7 Apr. 2009,
pp. 1-6.
5. Driesen J., Belmans R., “Distributed generation: challenges and possible solutions”,
Proceedings of the IEEE Power Engineering Society General Meeting, 2006, pp. 1-8.
6. Chowdhury B. H., Sawab A.W., “Evaluating the value of distributed photovoltaic
generations in radial distribution systems” IEEE Transactions on Energy Conversion, vol.
11, no. 3, Sept. 1996.
7. Fitzer J., Dillon W. E., “Impact of Residential Photovoltaic Power Systems on the
Distribution Feeder,” IEEE Power Engineering Society Winter Meeting, 1986.
8. McMillan R., “Siemens: Stuxnet worm hit industrial systems,” COMPUTERWorld, 14
Sept. 2010.
9. Cherry S., Langner R., “How Stuxnet Is Rewriting the Cyberterrorism Playbook”, IEEE
Spectrum, 13 Oct. 2010.
10. U.S.-Canada Power System Outage Task Force, “Final Report on the August 14, 2003
Blackout in the United States and Canada: Causes and Recommendations”, April 2004.
Online: https://reports.energy.gov/BlackoutFinal-Web.pdf.
11. Annual report 2011, The Repository for Industrial Security Incidents (RISI), Online:
http://www.securityincidents.net/index.php/products/indepth/risi_annual_report/.

48
12. 2011 Report on control system cyber security incidents, online:
http://community.controlglobal.com/content/risi-cyber-incident-report-2011-calendar-
year-out-risicybersecurity-.
13. Sridhar S., Hahn A., Govindarasu M., “Cyber-Physical System Security for the Electric
Power Grid”, Proceedings of the IEEE, vol. 100, no. 1, Jan. 2012, pp. 210-224.
14. Goetz E., Shenoi S., “Critical Infrastructure Protection,” Springer Nov. 2009.
15. Coughlan B.W., Lubkeman D.L., Sutton J., “Improved control of capacitor bank
switching to minimize distribution systems losses”, Proceedings of the 22nd
Annual North
American Power Symposium, 15-16 Oct. 1990, pp. 336-345.
16. Bunch J.B., Miller R.D., Wheeler J.E., “Distribution system integrated voltage and
reactive power control”, IEEE Transactions on Power Apparatus and Systems, vol. PAS-
101, no. 2, Feb. 1982, pp. 284-289.
17. Miu K.N., Hsiao-Dong C., Darling G., “Capacitor placement, replacement and control in
large scale distribution systems by a GA based 2 stage algorithm”, IEEE Transactions on
Power Systems, vol. 12, no. 3, Aug. 1997, pp. 1160-1166.
18. Kersting W.H., “Distribution feeder voltage regulation control”, IEEE Transactions on
Industry Applications, vol. 46, no. 2, Mar.-Apr. 2010, pp. 620-626.
19. Baran M.E., Wu F.F., “Optimal capacitor placement on radial distribution systems”,
IEEE Transactions on Power Delivery, vol. 4, no. 1, Jan. 1989, pp. 725-734.
20. Borozan V., Baran M.E., Novosel D., “Integrated Volt/var control in distribution
systems”, IEEE Power Engineering Society Winter Meeting, 2001, pp. 1485-1490.
21. Mirhoseini S. H., Hosseini S.M., Ghanbari M., Ahamadi M., “A new improved adaptive
imperialist competitive algorithm to solve the reconfiguration problem of distribution
systems for loss reduction and voltage profile improvement”, International Journal of
Electrical Power & Energy Systems, vol. 55, Feb. 2014, pp.128-143.
22. Jin-Cheng W., Hsiao-Dong C., Miu K.N., Darling G., “Capacitor placement and real time
control in large scale unbalanced distribution systems: loss reduction formula, problem
formulation, solution methodology and mathematical justification”, Proceedings of IEEE
Transmission and Distribution Conference, 15-20 Sept. 1996, pp. 236-241.

49
23. Jin-Cheng W., Hsiao-Dong C., Miu K.N., Darling G., “Capacitor placement and real time
control in large-scale unbalanced distribution systems: numerical studies”, IEEE
Transactions on Power Delivery, vol. 12, no. 2, Apr. 1997, pp. 959-964.
24. Klienberg M., Miu K.N., “A study of distributed capacitor control of electric power
distribution systems”, North American Power Symposium, 4-6 Aug.2011, pp. 1-6.
25. Klienberg M., Miu K.N., Segal N., Lehmann H., Figura T.R., “A partitioning method for
distributed capacitor control of electric power distribution systems”, IEEE Transactions
on Power Systems, vol. 29, no. 2, Mar. 2014, pp. 637-644.
26. Shen Z., Wang Z., Baran M.E., “Optimal volt/var control strategy for distribution system
with multiple voltage regulating devices”, IEEE PES Transmission and Distribution
Conference and Exposition, 7-10 May 2012, pp. 1-7.
27. Jen-Hao T., Chia-Yen C., Chi-Fa C., Yi-Hwa L., “Optimal capacitor control for
unbalanced distribution systems with distributed generations”, IEEE International
Conference on Sustainable Energy Technologies, 24-27 Nov. 2008, pp. 755-760.
28. Amin S., Cardenas A., Sastry S., “Safe and secure networked control systems under
denial-of-service attacks,” in Hybrid Systems: Computation and Control, vol. 5469, Apr.
2009, pp. 31–45.
29. Huangc Y.-L., Cárdenasa A. A., Aminb S., Linc Z.-S., Tsaic H.-Y., Sastrya S.,
“Understanding the physical and economic consequences of attacks on control systems,”
International Journal of Critical Infrastructure Protection, vol.2, no. 3, Oct. 2009, pp. 72-
83.
30. Rahman M.A., Mohsenian-Rad H., “False Data Injection Attacks with Incomplete
Information against Smart Power Grids”, IEEE Global Communications Conference, 3-7
Dec. 2012, pp. 3153-3158.
31. Hug G., Giampapa J.A., “Vulnerability Assessment of AC State Estimation With Respect
to False Data Injection Cyber-Attacks”, International Journal of Critical Infrastructure
Protection, vol. 2, no. 3, Oct. 2009, pp. 72-83.
32. Liu Y., Ning P., Reiter M.K., “False data injection attacks against state estimation in
electric power grids,” Proceedings of 16th
ACM conference on Computer and
communication security, Oct. 2010, pp. 21-32.

50
33. Dan G. and Sandberg H., “Stealth attacks and protection schemes for state estimators in
power systems,” Proceedings of 1st IEEE International Conference Smart Grid
Communication, 2010, pp. 214–219.
34. Teixeira A., Amin S., Sandberg H., Johansson K.H., Sastry S.S., “Cyber security analysis
of state estimators in electric power systems,” Proceedings of 49th
IEEE Conference on
Decision Control, 2010, pp.5991–5998.
35. Yuan Y., Li Z., Ren K., “Modeling Load Redistribution Attacks in Power Systems,”
IEEE Transactions on Smart Grid, vol. 2, no. 2, June 2011, pp. 382-390.
36. Liu X. and Li Z., “Local Load Redistribution Attacks in Power Systems With Incomplete
Network Information,” IEEE Transactions on Smart Grid, vol. 5, no. 4, July 2014, pp.
1665-1676.
37. Yuan Y., Li Z., Ren K., “Quantitative Analysis of Load Redistribution Attacks in Power
Systems,” IEEE Transactions on Parallel and Distributed Systems, vol. 23, no. 9, Sept.
2012, pp. 1731-1738.
38. Sou K.C., Sandberg H., Johansson K.H., “Detection and Identification of Data Attacks in
Power System,” American Control Conference, 27-29 June 2012, pp. 3651-3656.
39. Bobba R.B., Rogers K.M., Wang Q., Khurana H., Nahrstedt K., Overbye T.J., “Detecting
False Data Injection Attacks on DC State Estimation”, 1st Workshop on Secure Control
Systems, Apr. 2010.
40. Dorfler F., Pasqualetti F., Bullo F., “Distributed Detection of Cyber-Physical Attacks in
Power Networks: A Waveform Relaxation Approach,” 49th
Annual Allerton Conference
on Communication, Control, and Computing, 28-30 Sept. 2011, pp. 1486-1491.
41. Giani A., Bitary E., Garciay M., McQueenz M., Khargonekarx P., Poolla K., “Smart Grid
Data Integrity Attacks: Characterizations and Countermeasures,” IEEE International
Conference on Smart Grid Communications, 17-20 Oct. 2011, pp. 232-237.
42. Kim T.T., Poor H.V., “Strategic Protection against Data Injection Attacks on Power
Grids,” IEEE Transactions on Smart Grid, vol. 2, no. 2, June 2011, pp. 326-333.
43. Sridhar S., Manimaran G., “Data integrity attacks and their impacts on SCADA control
system,” IEEE Power and Energy Society General Meeting, July 2010, pp. 1 –6.
44. Sridhar S., Manimaran G., “Data integrity attack and its impacts on voltage control loop
in power grid,” IEEE Power and Energy Society General Meeting, July 2011, pp. 1 –6.
51
45. OpenDSS Manual, Electric Power Research Institute, Jul 2010. Available:
http://sourceforge.net/projects/electricdss
46. http://www.smartgrid.epri.com/doc/OpenDSS Level 1 Training.pdf
47. Ramachandran V., Solanki J., Solanki S.K., “Steady state analysis of high penetration PV
on utility distribution feeder,” IEEE PES Transmission and Distribution Conference and
Exposition, May 2012, pp. 1 –6.
48. Yan X., Su X. G., “Linear Regression Analysis: Theory and Computing”.

West Virginia University ElectronicProblem/ProjectlResearch Report
Signature Form
Student Name:
Student lD #:
Degree:
Signed:
Committee:
f;osorIft8
(Committee Member)
illi+t), l+(date)
(date)
w(date)
(Committee Member)
(Commiftee Member)
Document Type:
Document Title:
Student Agreement:
I hereby certify that, if appropriate, I have obtained and attached hereto a written permission statement from the owners ofeach third party copyrighted matter to be included in my thesis, dissertation, project report, or other research material,allowing distribution as specified upon deposit.
I hereby grant to West Virginia Universi$ and ib agents the non-exclusive license to archive and make accessible, underthe conditions selected upon deposit, my above mentioned document in whole or in part in all forms of media, now or hereafterknown. I retain ownership rights as specified in the WVU copyright policy to the copyright of the abovementioneddocument. I also retain the right to use in future works (such as articles or books) all or part of this abovementioneddocument.
Review and Acceptance:
The above mentioned document has been reviewed and accepted by the studenfs advisory committee. The undersignedagree to abide by the statements above, and agree that this Signature Form updates any and all previous SignatureForms subm ifted heretofore.
Non-wVU Email Account Vivelft'rr L) r, 57 @qrys^il'co,
/*^"t"r'"
-
thgDls .problem/ProjecUResearch Report
tohph vl">
ate
]i lt3lzor$

Dr. Sarika Khushalani Solanki, Ph.D


![Nanoscale Thin Films of Niobium Oxide on Platinum Surfaces ...summit.sfu.ca/system/files/iritems1/19055/117-Gates.pdfcorrosion resistance and are thermodynamically stable. [16,21]](https://static.fdocuments.us/doc/165x107/61321499dfd10f4dd73a3763/nanoscale-thin-films-of-niobium-oxide-on-platinum-surfaces-corrosion-resistance.jpg)

