Growth is required for perception of water availability to ... · an important contributing process...
10
Growth is required for perception of water availability to pattern root branches in plants Neil E. Robbins II a,b and José R. Dinneny a,b,1 a Department of Plant Biology, Carnegie Institution for Science, Stanford, CA 94305; and b Department of Biology, Stanford University, Stanford, CA 94305 Edited by Julian I. Schroeder, University of California, San Diego, La Jolla, CA, and approved December 12, 2017 (received for review June 13, 2017) Water availability is a potent regulator of plant development and induces root branching through a process termed hydropattern- ing. Hydropatterning enables roots to position lateral branches toward regions of high water availability, such as wet soil or agar media, while preventing their emergence where water is less available, such as in air. The mechanism by which roots perceive the spatial distribution of water during hydropatterning is un- known. Using primary roots of Zea mays (maize) we reveal that developmental competence for hydropatterning is limited to the growth zone of the root tip. Past work has shown that growth generates gradients in water potential across an organ when asymmetries exist in the distribution of available water. Using mathematical modeling, we predict that substantial growth- sustained water potential gradients are also generated in the hydropatterning competent zone and that such biophysical cues inform the patterning of lateral roots. Using diverse chemical and environmental treatments we experimentally demonstrate that growth is necessary for normal hydropatterning of lateral roots. Transcriptomic characterization of the local response of tissues to a moist surface or air revealed extensive regulation of signaling and physiological pathways, some of which we show are growth- dependent. Our work supports a “sense-by-growth” mechanism gov- erning hydropatterning, by which water availability cues are rendered interpretable through growth-sustained water movement. hydropatterning | osmosensing | plant physiology | plant–water relations | root development W ater deficit strongly limits plant growth and development. While a number of strategies that plants use to cope with this stressor have been identified (1), details of the signaling pathways necessary for perception of water deficit are still poorly defined. In systems such as Saccharomyces cerevisiae traditional genetic approaches have been employed to elucidate water- perception pathways with considerable success (2). While simi- lar approaches have succeeded in identifying candidate osmo- sensory proteins in plants (3–5), concerns regarding redundancy of signaling components and/or lethality associated with genetic knockouts suggest that alternative strategies may be necessary. In addition, many studies have focused primarily on understanding the function of signaling pathways that act at the single-cell level. Responses of plant roots to water availability, such as altered growth dynamics or tissue patterning, occur at the organ scale (1). These processes emerge from the actions of many cells and therefore may rely on the perception of environmental cues across the organ. Thus, an exploration of water perception using an organ-scale process as a model system may provide unique insight different from the scope of single-cell studies. To explore how environmental cues pattern physiological re- sponses at the organ scale we characterized water perception in the context of root hydropatterning, an organ-scale de- velopmental response to variation in external water availability (1, 6). During hydropatterning lateral roots become activated in regions of the primary root directly contacting sources of avail- able water, such as agar media, and fail to be induced where water is less available, such as air (Fig. 1 A–C). This phenome- non has been observed in several plant species and a wide variety of environmental contexts, including field soil (6). To understand how water availability is perceived during hydropatterning we asked whether developmental competence for this environmental response is limited to specific regions along the length of the root. Developmental competence de- scribes the ability of a cell or tissue to perceive and generate a response to a morphogenetic cue (7, 8). A number of mecha- nisms can give rise to competence, including the expression of proteins affecting signal perception, such as receptors and downstream signal-transduction components, or the absence of antagonists. We reasoned that determining the biological pro- cesses associated with developmental competence might provide clues on mechanisms of environmental perception and down- stream signaling events. In the following study we experimentally delineated the site of developmental competence for hydropatterning in Zea mays (maize) primary roots. This zone of competence closely corre- lated with the root growth zone, where cell expansion and water uptake occur. Mathematical modeling of water movement in this region suggested that a substantial growth-sustained difference in tissue water potential was present in the competent zone that distinguished tissues contacting external environments with high or low water availability. We show that tissue water potentials in the competent zone are strongly predictive of future patterns of lateral root emergence. These results implicate organ growth as an important contributing process in water perception in plant root tissues, representing a key advancement in our under- standing of this phenomenon. Significance Plant roots activate lateral branching in response to contact with available water, but the mechanism by which this envi- ronmental signal is perceived is poorly understood. Through a combination of empirical and mathematical-modeling ap- proaches we discovered a central role of tissue growth in this process. Growth causes water uptake, and the biophysical changes that occur during this process are interpreted by the organism to position new lateral branches. This observation is a significant advancement in our understanding of how the environment shapes plant development and demonstrates that perception of water is intimately tied to a core biological function of the root. Author contributions: N.E.R. and J.R.D. designed research; N.E.R. performed research; N.E.R. contributed new reagents/analytic tools; N.E.R. and J.R.D. analyzed data; and N.E.R. and J.R.D. wrote the paper. The authors declare no conflict of interest. This article is a PNAS Direct Submission. This open access article is distributed under Creative Commons Attribution-NonCommercial- NoDerivatives License 4.0 (CC BY-NC-ND). Data deposition: The data reported in this paper have been deposited in the Gene Ex- pression Omnibus (GEO) database, https://www.ncbi.nlm.nih.gov/geo (accession no. GSE92406). 1 To whom correspondence should be addressed. Email: [email protected]. This article contains supporting information online at www.pnas.org/lookup/suppl/doi:10. 1073/pnas.1710709115/-/DCSupplemental. E822–E831 | PNAS | Published online January 9, 2018 www.pnas.org/cgi/doi/10.1073/pnas.1710709115
Transcript of Growth is required for perception of water availability to ... · an important contributing process...

Growth is required for perception of water availabilityto pattern root branches in plantsNeil E. Robbins IIa,b and José R. Dinnenya,b,1
aDepartment of Plant Biology, Carnegie Institution for Science, Stanford, CA 94305; and bDepartment of Biology, Stanford University, Stanford, CA 94305
Edited by Julian I. Schroeder, University of California, San Diego, La Jolla, CA, and approved December 12, 2017 (received for review June 13, 2017)
Water availability is a potent regulator of plant development andinduces root branching through a process termed hydropattern-ing. Hydropatterning enables roots to position lateral branchestoward regions of high water availability, such as wet soil or agarmedia, while preventing their emergence where water is lessavailable, such as in air. The mechanism by which roots perceivethe spatial distribution of water during hydropatterning is un-known. Using primary roots of Zea mays (maize) we reveal thatdevelopmental competence for hydropatterning is limited to thegrowth zone of the root tip. Past work has shown that growthgenerates gradients in water potential across an organ whenasymmetries exist in the distribution of available water. Usingmathematical modeling, we predict that substantial growth-sustained water potential gradients are also generated in thehydropatterning competent zone and that such biophysical cuesinform the patterning of lateral roots. Using diverse chemical andenvironmental treatments we experimentally demonstrate thatgrowth is necessary for normal hydropatterning of lateral roots.Transcriptomic characterization of the local response of tissues to amoist surface or air revealed extensive regulation of signaling andphysiological pathways, some of which we show are growth-dependent. Our work supports a “sense-by-growth” mechanism gov-erning hydropatterning, by which water availability cues are renderedinterpretable through growth-sustained water movement.
hydropatterning | osmosensing | plant physiology | plant–water relations |root development
Water deficit strongly limits plant growth and development.While a number of strategies that plants use to cope with
this stressor have been identified (1), details of the signalingpathways necessary for perception of water deficit are still poorlydefined. In systems such as Saccharomyces cerevisiae traditionalgenetic approaches have been employed to elucidate water-perception pathways with considerable success (2). While simi-lar approaches have succeeded in identifying candidate osmo-sensory proteins in plants (3–5), concerns regarding redundancyof signaling components and/or lethality associated with geneticknockouts suggest that alternative strategies may be necessary. Inaddition, many studies have focused primarily on understandingthe function of signaling pathways that act at the single-cell level.Responses of plant roots to water availability, such as alteredgrowth dynamics or tissue patterning, occur at the organ scale(1). These processes emerge from the actions of many cells andtherefore may rely on the perception of environmental cuesacross the organ. Thus, an exploration of water perception usingan organ-scale process as a model system may provide uniqueinsight different from the scope of single-cell studies.To explore how environmental cues pattern physiological re-
sponses at the organ scale we characterized water perception inthe context of root hydropatterning, an organ-scale de-velopmental response to variation in external water availability(1, 6). During hydropatterning lateral roots become activated inregions of the primary root directly contacting sources of avail-able water, such as agar media, and fail to be induced wherewater is less available, such as air (Fig. 1 A–C). This phenome-
non has been observed in several plant species and a wide varietyof environmental contexts, including field soil (6).To understand how water availability is perceived during
hydropatterning we asked whether developmental competencefor this environmental response is limited to specific regionsalong the length of the root. Developmental competence de-scribes the ability of a cell or tissue to perceive and generate aresponse to a morphogenetic cue (7, 8). A number of mecha-nisms can give rise to competence, including the expression ofproteins affecting signal perception, such as receptors anddownstream signal-transduction components, or the absence ofantagonists. We reasoned that determining the biological pro-cesses associated with developmental competence might provideclues on mechanisms of environmental perception and down-stream signaling events.In the following study we experimentally delineated the site of
developmental competence for hydropatterning in Zea mays(maize) primary roots. This zone of competence closely corre-lated with the root growth zone, where cell expansion and wateruptake occur. Mathematical modeling of water movement in thisregion suggested that a substantial growth-sustained differencein tissue water potential was present in the competent zone thatdistinguished tissues contacting external environments with highor low water availability. We show that tissue water potentials inthe competent zone are strongly predictive of future patterns oflateral root emergence. These results implicate organ growth asan important contributing process in water perception in plantroot tissues, representing a key advancement in our under-standing of this phenomenon.
Significance
Plant roots activate lateral branching in response to contactwith available water, but the mechanism by which this envi-ronmental signal is perceived is poorly understood. Through acombination of empirical and mathematical-modeling ap-proaches we discovered a central role of tissue growth in thisprocess. Growth causes water uptake, and the biophysicalchanges that occur during this process are interpreted by theorganism to position new lateral branches. This observation isa significant advancement in our understanding of how theenvironment shapes plant development and demonstrates thatperception of water is intimately tied to a core biologicalfunction of the root.
Author contributions: N.E.R. and J.R.D. designed research; N.E.R. performed research;N.E.R. contributed new reagents/analytic tools; N.E.R. and J.R.D. analyzed data; andN.E.R. and J.R.D. wrote the paper.
The authors declare no conflict of interest.
This article is a PNAS Direct Submission.
This open access article is distributed under Creative Commons Attribution-NonCommercial-NoDerivatives License 4.0 (CC BY-NC-ND).
Data deposition: The data reported in this paper have been deposited in the Gene Ex-pression Omnibus (GEO) database, https://www.ncbi.nlm.nih.gov/geo (accession no.GSE92406).1To whom correspondence should be addressed. Email: [email protected].
This article contains supporting information online at www.pnas.org/lookup/suppl/doi:10.1073/pnas.1710709115/-/DCSupplemental.
E822–E831 | PNAS | Published online January 9, 2018 www.pnas.org/cgi/doi/10.1073/pnas.1710709115

ResultsThe Competent Zone for Hydropatterning Coincides with the GrowthZone. Hydropatterning of lateral roots is readily studied in plantseedlings grown on the surface of an agar medium where oneside of the root contacts the agar and the other side contacts theair in the headspace of the Petri dish. To determine which re-gions of root tissue are competent to respond to water avail-ability during hydropatterning we applied an agar sheet to apreviously air-exposed side of a primary root and tracked sub-sequent patterns of lateral root development (Fig. S1A). Wepredicted that developmentally competent regions would re-spond to agar application by producing new lateral roots, whileregions which had lost competence would fail to do so. We usedmaize for this assay as it provided experimental advantagescompared with Arabidopsis, a plant species used for much of theprior characterization of hydropatterning (6). Maize has a highdensity of lateral roots relative to the size of the different de-velopmental zones of the primary root (Fig. S1) (∼7–10 lateralroots per cm primary root in maize vs. ∼1–3 in Arabidopsis). Inaddition, its larger diameter (1-mm diameter in maize vs. 0.1 mmin Arabidopsis) facilitates the use of micromanipulation andmicrodissection experimental approaches needed to preciselydefine the spatial domain of competence.Following application of an agar sheet to the root we observed
that lateral roots were induced within a defined region of the
root. Developmental competence was clearly differentiatedalong the length of the root, with a distinct boundary separatingresponsive and unresponsive regions. We refer to tissues in therootward direction of this boundary as the competent zone andthose in the shootward direction as the fixed zone (Fig. 1D). Ourresults placed the competent-zone boundary within publishedranges of the end of the root growth zone (9, 10). To evaluatethis correlation further, we quantified local tissue expansionrates via kinematic growth analysis and found that under ourexperimental conditions the root growth zone was ∼5.34 ±0.15 mm in length (11, 12). There was no significant differencebetween the measured longitudinal position on the root wherehydropatterning competence was lost and where growth ceased(Fig. 1E, P = 0.9, mean difference ± SE = −0.03 ± 0.25 mm),indicating a strong correlation between these two developmentalboundaries in the root tip. Past work in Arabidopsis showed thatoscillating changes in auxin signaling necessary for lateral rootpatterning also occur at the end of the growth zone, consistentwith this region being an important developmental zone acrossflowering plants (13). We did not observe obvious signs of arrestedpre-emergence-stage lateral root primordia on the air side of maizeprimary roots, suggesting that hydropatterning of lateral root de-velopment occurs before lateral root initiation (Fig. 1F).
A
F
B
D E
C
Fig. 1. Developmental competence to respond towater availability is limited to the root tip. (A) Dia-gram of maize seedling grown along agar media.Contact with agar (cyan box) locally activates lateralroot development. (B and C) Unstained transversesection of primary root imaged by bright-field micros-copy (B) and diagram highlighting environmentallyregulated anatomical features (C). Dotted line, bound-ary between air and agar sides. Aer, aerenchyma; Anth,anthocyanin; Hair, root hair; LRP, lateral root primor-dium. (Scale bar, 250 μm.) (D) Air side of primary rootimmediately after application of agar sheet (Left) andfollowing lateral root emergence 3 d later (Right). As-terisks indicate lateral roots that emerged toward theapplied agar. Dashed line, boundary between compe-tent and fixed zones. (Scale bar, 5 mm.) (E) Averagerelative elemental growth rate (REGR) (black, n = 38seedlings) and position of competent/fixed-zone bound-ary (red, n = 47 seedlings). Shaded regions, SEM. Mea-surements are averages of three experimental replicates.(F) Unstained longitudinal section of primary root ∼4 cmfrom root tip imaged by bright-field microscopy. Sectionoriented with root tip pointing to left of image. Notethe presence of lateral root primordia (*) exclusively onthe agar side. (Scale bar, 500 μm.)
Robbins and Dinneny PNAS | Published online January 9, 2018 | E823
PLANTBIOLO
GY
PNASPL
US

A Mathematical Model to Estimate Growth-Sustained Tissue WaterPotentials. The strong correlation between growth and hydro-patterning competence led us to ask whether growth itself wasinvolved in the perception of water availability. In plant cells,growth is driven by cell wall loosening and concomitant wateruptake (1, 14, 15). Although the air- and agar-contacting sides ofa root have differential access to available water in our experi-mental system, there was no obvious sign of differential growthbetween these regions as roots generally grew straight along theagar surface. This indicated that rates of expansion, and there-fore cellular water uptake, were equal between the two sides.Since most available water resides in the agar media, water mustmove across the root diameter to sustain cell expansion in air-exposed tissues. Water movement is driven by differences inwater potential, or the chemical potential energy of water (1, 16,17). Water moves from regions of high potential to low potentialat a rate proportional to the difference in potential between thetwo regions. In order for water to move toward air-exposed tis-sues, we predicted that a substantial growth-sustained waterpotential gradient would occur in the root tip, which might alsoact as a biophysical cue to pattern lateral root development.Growth-sustained water potential gradients have been pro-
posed and empirically measured in the literature (18–21), but arole for them in tissue patterning has not yet been proposed orestablished. We asked to what extent a gradient existed in thecompetent zone, and whether it had any impact on lateral rootpatterning. To address this, we constructed a mathematicalmodel to estimate water potentials of root tissues in our ex-perimental conditions. We favored a computational approachover empirical measurement, as the former allows for morerapid investigation of a variety of environments. It also enablessimulations to be performed, which can assist in identify-ing highly influential parameters that can be then be examinedexperimentally.In the model the root was treated as a right circular cylinder
divided into several segments along its longitudinal axis, witheach segment subdivided into nine compartments (Fig. 2 A andB). The cylinder was assumed to be 1 mm in diameter, andtissue-layer dimensions were set based on dimensions measuredfrom transverse sections of the primary root (e.g., Fig. 1B).Water was assumed to move freely between adjacent compart-ments in both the transverse and longitudinal directions and wasallowed to enter or exit root tissues via external water sources(agar media or air) at various points along the perimeter of thetissue. Water potentials of external agar media were assumed tobe −0.1 MPa, unless empirically measured. Because our tissueculture plates were completely sealed with Parafilm, the waterpotential of air was assumed to be in equilibrium with the sur-rounding agar media. The model can simulate water delivery viathe phloem (22, 23), but because there are no empirical data onthe relative contributions of internal and external water sourcesfor maize primary root growth at the seedling stage we assumedall water uptake was externally derived, unless otherwise noted.The network of root compartments was modeled as a hy-
draulic circuit, with each compartment represented as a node inthe circuit (Fig. 2 C and D). The rate of water uptake for eachcompartment was estimated based on empirical growth-ratemeasurements. Since we assumed all growth occurred in thelongitudinal dimension, growth could be modeled as a change incompartment height, and therefore volume, over time (Fig. 2E).Ninety percent of this volume change was assumed to be at-tributable to water uptake, based on water content values citedfor similar tissues (16). The resistance of water movement be-tween each node is measured by the reciprocal of hydraulicconductivity (1, 16). We used a literature-derived value of 1.15 ×10⁻⁷ m−3·m−2·s−1·MPa−1 for maize root tissue conductivity (24).Although we considered this previously published study to be thebest approximation for our purposes based on the tissue region
of interest and method of measurement, we acknowledge thatconductivity can vary considerably from study to study (25–27).For this reason, we compared model outputs across a range ofconductivity values at a later point in our analysis.Differences in compartment water potentials, analogous to
differences in voltage, were calculated using the followingequation: JV = ΔΨw × Lp × A. In this equation JV is the rate ofwater flow between two compartments (cubic meters per sec-ond), ΔΨw is the water potential difference (megapascals), Lpis hydraulic conductivity (cubic meters per square meter persecond per megapascal), and A is the surface area of theinterface between the compartments (square meters). Sincewater potential is the only unknown value in the above rela-tionship, it can be calculated algebraically using a system oflinear equations derived using Kirchhoff’s circuit laws (28) (Fig.2F). We wrote an algorithm in the R programming language togenerate and solve this system of equations, which is freelyavailable for download in a Github repository (https://github.com/nerobbin/20161214_hydropatterning).As a proof-of-concept test for the ability of this method to
accurately estimate tissue water potential we applied it toGlycinemax hypocotyls, the only growing plant organ for which empiricalmeasurements of cellular water potential at the tissue scale areavailable (19) (Fig. S2). We updated the model to take into ac-count tissue organization and hydraulic parameters unique tothis organ. The accuracy of our model predictions dependedlargely on the value used for tissue hydraulic conductivity, withhighest accuracy obtained at a value within the range of thosepreviously reported (29). Discrepancies between overall profilesof empirical and estimated water potentials hinted at tissue-specific variation in conductivity not taken into account by themodel, which assumes uniform conductivity. The absence ofhigher-resolution measurements of tissue hydraulic conductivity,and the experimental challenges associated with making suchmeasurements, make bulk-tissue values a necessary approxima-tion in our model.We then applied the model to simulate maize roots growing
along an agar medium. Local tissue water potentials were pre-dicted to decrease as local growth rate increased, with the largestdecreases that we predicted being in tissues most distal to theexternal water source, thus generating a differential across thediameter of the root (Fig. 2G). Notably, we found that all tissuesapproached water potential equilibrium after growth ceased,demonstrating the necessity of growth for sustaining potentialgradients. These results suggest that substantial differentials inwater potential exist between air- and agar-contacting tissues inthe competent zone (peak differential in the epidermis = −0.75MPa, cortex = −0.34 MPa).
Modeling Relates Growth and Water Uptake to Lateral Root Patterning.To determine whether tissue water potentials play a role inhydropatterning we first tested whether there was a quantitativerelationship between tissue water potential and lateral rootdevelopment. Tissue growth rates and lateral root distributionswere measured in seedlings grown between two agar sheetscontaining differing concentrations of PEG, which was used toalter external water availability over a wide range of values(Fig. 3 A–C).Measured growth rates and external water availabilities were
then used in our model to estimate tissue water potentials. Wefocused our attention on water potentials of the epidermal layer,as prior research implicated outer tissue layers as important sitesof early hormonal signaling events upstream of water-inducedlateral root initiation (6). We further restricted our analysis topotentials occurring within the competent zone. While our pre-vious experiment delineated the shootward boundary of thecompetent zone, the rootward boundary required further ex-perimentation to determine. The location of this boundary was
E824 | www.pnas.org/cgi/doi/10.1073/pnas.1710709115 Robbins and Dinneny

A
C D
E
F
G
B
Fig. 2. Mathematical modeling of tissue water potentials in the growth zone. (A) A root growing along agar (filled cyan box) is treated as a series of rightcircular cylinders. (B) Each segment is divided into compartments. Water can be taken up externally via agar or air (hollow cyan box) or internally via thephloem (cyan ring). (C and D) The network of root compartments is modeled as a hydraulic circuit. Connections for radial (C) and longitudinal (D) water floware shown. (E) Growth is modeled as a change in cylinder height over time, calculated based on relative elemental growth rate (REGR). A user-specified value(percentage water content) dictates the amount of volume change attributable to water uptake. (F) Example calculation of compartment water potentials(Ψ). Compartment water uptake and surface areas are calculated based on total water uptake and compartment geometry. Hydraulic conductivity (Lp) andmedia water potential (ΨMedia) are user-specified. Intercompartment water flow rates (I, arrows) are determined using a system of equations (“Flows”), andare then used to calculate compartment water potentials in a second system of equations (“Potentials”). (G) Estimated tissue water potentials based on REGRcurve in Fig. 1E.
Robbins and Dinneny PNAS | Published online January 9, 2018 | E825
PLANTBIOLO
GY
PNASPL
US
determined by applying small agar sheets to the air-exposed sideof the primary root. We reasoned that an agar sheet as large asor larger than the competent zone would be inductive for lateralroot development, while a sheet smaller than the competentzone would fail to do so. The minimal inductive sheet sizetherefore provides an approximation for the size of the compe-tent zone and can be used to calculate the position where thezone begins. The smallest sheet capable of inducing lateral rootproduction was 1.54 mm (Fig. S3), suggesting that the competentzone lay between ∼4.0 and 5.5 mm from the root tip at the distalend of the growth zone.Competent-zone water potentials were summed for each epi-
dermal quadrant and plotted against relative lateral root distri-butions (Fig. 3 D–F). We focused on relative distributions oflateral roots in our analysis to avoid any effects of changes inoverall lateral root density that might occur independent of
changes in distribution (Fig. S4). While absolute water potentialdid not show a strong relationship with lateral root patterning,we speculated that normalizing the water potential values mightreveal a clearer relationship. We tested two normalizationmethods: one that converted water potentials to percentages(Fig. 3 G and H) and another that involved mean-centering thewater potential values. Interestingly, both normalization schemesrevealed clear sigmoidal relationships in the data (Fig. 3I andFig. S5). Such normalization is physiologically relevant, sincewater movement depends entirely on relative differences inwater potential rather than absolute values. While our analysis isunable to distinguish which normalization is more biologicallymeaningful, goodness-of-fit statistics best supported the per-centage normalization method. A zero–one inflated beta re-gression model using these values explained 77% of the variance
A
C
D
G H I
E F
B
Fig. 3. Tissue water potential is predictive of lateralroot patterning. (A) Diagram of experimental setup.Primary roots were grown between two agar sheets,with varying concentrations of PEG applied in thetreatment agar. Dotted lines denote division of pri-mary root for lateral root quantification. (B and C)Relative elemental growth rate (REGR) profiles (B),lateral root (LR) distributions (C, Left), and model-estimated competent-zone tissue water potentials(C, Right) under indicated treatment conditions. Air-side data are sums of the two air-exposed quadrantsdepicted in A. Samples grouped based on averagewater potential (Ψw) difference between the twoagar sheets. Error bars denote SE. SEs in B wereomitted for legibility and averaged at ±0.02 h−1 inthe region 0–6 mm from the root tip. Significantlydifferent groups are denoted with different letters(P < 0.05). n = 14–16 seedlings per condition acrosstwo experiments. (D and E) Illustration of methodused to plot tissue water potentials and lateral rootdistributions for regression analysis. Values in eachroot quadrant for a single seedling are shown (D).Media water potentials (megapascals) are shown asnumbers within cyan boxes. Data from each quad-rant are then plotted in a scatter plot as a singlepoint (E). (F) Scatter plot of data from individualseedlings averaged in C plotted using strategy shownin E. Curve and shaded region, mean ± SE of best-fitline for zero–one inflated beta regression model. R2,pseudo-R2 value. (G and H) Repeat of previous ex-ample (D and E) using normalized (percent) waterpotential values. Normalization was done by dividingeach quadrant value by the sum of all quadrants. (I)Unaveraged data from C plotted as shown in H.
E826 | www.pnas.org/cgi/doi/10.1073/pnas.1710709115 Robbins and Dinneny

in the dataset, indicating high predictive power of local waterpotentials for lateral root patterning.Our regression model exhibited systematic biases within cer-
tain ranges of tissue water potential, suggesting inaccuracies inour water potential estimates for some data points. To testwhether this was caused by misparameterization of tissue hydraulicconductivity we refit the model using a range of different values.We observed substantial improvement in model fit (R2 = 0.85–0.91) at conductivities at or below ∼5 × 10⁻⁸ m3·m−2·s−1·MPa−1 (Fig.S6). This observation suggests that tissue conductivity may be lowerthan our assumed reference value (1.15 × 10⁻⁷ m3·m−2·s−1·MPa−1),perhaps due to suborgan variation in conductivity and/or changesresulting from the treatment conditions examined. We noted thatmodel fit plateaued within the above range of conductivity values,suggesting that the fit was unlikely to improve as conductivity wasfurther decreased beyond physiologically relevant values. Althougha deeper understanding of root tissue conductivity in our experi-mental setup would likely improve model fit, our current modelnonetheless explains a substantial portion of the variation in lateralroot distribution. We therefore continued our analysis with theempirically determined conductivity value.Our regression model allowed us to make predictions re-
garding how biophysical properties of the root and its environ-ment might impact hydropatterning. The model predicted thatprimary roots with smaller diameters would have a higher fre-quency of air-side lateral roots, which may explain previous ob-servations of weaker hydropatterning in Arabidopsis comparedwith species like maize or Oryza sativa (rice) (Fig. S7A) (6). In-creasing the contribution of phloem-derived water to overall rootwater uptake had no substantial effect on model predictions (Fig.S7B). Variation in tissue hydraulic conductivity had a large effecton predicted lateral root distribution, but only for conductivity inthe transverse direction (Fig. S7C). Altering conductivity forlongitudinal water flow had a weak effect on model predictions,and there did not appear to be synergistic effects between thetwo conductivity values (Fig. S7 D and E).This analysis was by no means an exhaustive assessment of
all combinations of parameter values. Thus, we have generatedan R Shiny app that allows readers to explore the full parame-ter space using an interactive graphical user interface (https://nrobbins.shinyapps.io/20171008_hydropatterning_app/). Rawdata used for fitting and validation of the regression modelcan also be found in a Github repository (https://github.com/nerobbin/20161214_hydropatterning).
Growth Dynamics Affect Hydropatterning of Lateral Root Development.Given the strong correlation between growth and competence forhydropatterning, we examined the predicted effects of alteringgrowth dynamics on branching pattern using our model (Fig. 4 Aand B). Interestingly, the frequency of lateral root initiation towardair increased as the end of the growth zone was shifted rootwardand away from the competent/fixed-zone boundary. This was morepronounced at lower values of peak elemental growth rate, sug-gesting a synergistic interaction between the two factors. We notethat these simulations were performed assuming constant positionand size of the competent zone, which caused uncoupling of growthfrom competence. Contrastingly, the effect of growth zone positionon lateral root patterning was strongly reduced when the competentzone was configured to track with the growth zone (Fig. 4C). Thisindicated that tight coordination between growth as a signal gen-erator and competence as a signal receiver were likely to be im-portant for hydropatterning.Based on these simulations we hypothesized that the ability of
the root to locally distinguish regions of high and low wateravailability may depend on the overall rate of growth-sustainedwater uptake in the competent zone. To test this hypothesiswe scored lateral root patterning in seedlings exposed to dif-ferent growth inhibitors. Seedlings were treated with sodium
orthovanadate (Na3VO4) and diethylstilbestrol (DES), two inhib-itors of plasma membrane H+-ATPases which partly function toacidify the cell wall and promote wall-loosening expansin activityduring cell elongation (14, 30–32). Interestingly, hydropatterningwas disrupted in treatment conditions that also reduced growth(Fig. 5 A and B and Dataset S1). Comparable results were obtainedusing citric acid, which increases pH-buffering capacity of the ex-ternal medium, as well as low-temperature stress (Fig. 5 A and Band Dataset S1). Empirical observations of lateral root patterningin these different conditions significantly correlated with predic-tions of our regression model, with correlation coefficients between0.65 and 0.97 depending on treatment condition (P < 0.0002; Fig.5C). This variation in correlation is suggestive of treatment-specificeffects on lateral root patterning that are independent of alter-ations to growth dynamics. Nonetheless, these observations providevalidation of the predictive power of the model under a broadrange of conditions and support our hypothesis that growth is re-quired for lateral root hydropatterning.We then sought to identify signaling processes involved in
hydropatterning downstream of growth. We quantified hydro-patterning in a panel of genetically diverse inbred lines from themaize nested association mapping (NAM) population (33).Several lines from this population exhibited poor germination orfailed to produce lateral roots in our conditions and thus couldnot be phenotyped. We identified one inbred, Oh7B, thatshowed a significantly higher frequency of air-side lateral rootemergence compared with our reference inbred, B73 (Fig. 5D).Interestingly, growth dynamics in Oh7B did not significantlydiffer from B73, indicating that growth alone could not explainthe observed difference in hydropatterning (Fig. 5E). This sug-gests that growth is partially uncoupled from lateral root pat-terning in Oh7B, perhaps by genetic variation in downstreamsignaling components necessary for linking these two processes.
A
B C
Fig. 4. Modeling predicts a disruption of hydropatterning when growth isperturbed. (A) Schematic of simulated changes in growth- and competent-zone positions. (Top) A root with standard growth-zone (red) andcompetent-zone (blue) positions. (Bottom Left) Growth zone position variedwhile competent zone remained constant. (Bottom Right) Competent zoneposition tracked with the growth zone. (B and C) Predicted frequency of air-side lateral root initiation with varied growth-zone parameter values.Competent zone was set to remain stationary (B), or track with the positionof the growth zone (C). Start of growth zone was set to 0 mm from the roottip in all simulations. Predictions were generated for primary roots grownbetween two agar sheets.
Robbins and Dinneny PNAS | Published online January 9, 2018 | E827
PLANTBIOLO
GY
PNASPL
US

Comparative genomic studies of B73 and Oh7B may thereforeuncover molecular actors involved in water transport, percep-tion, or signaling.
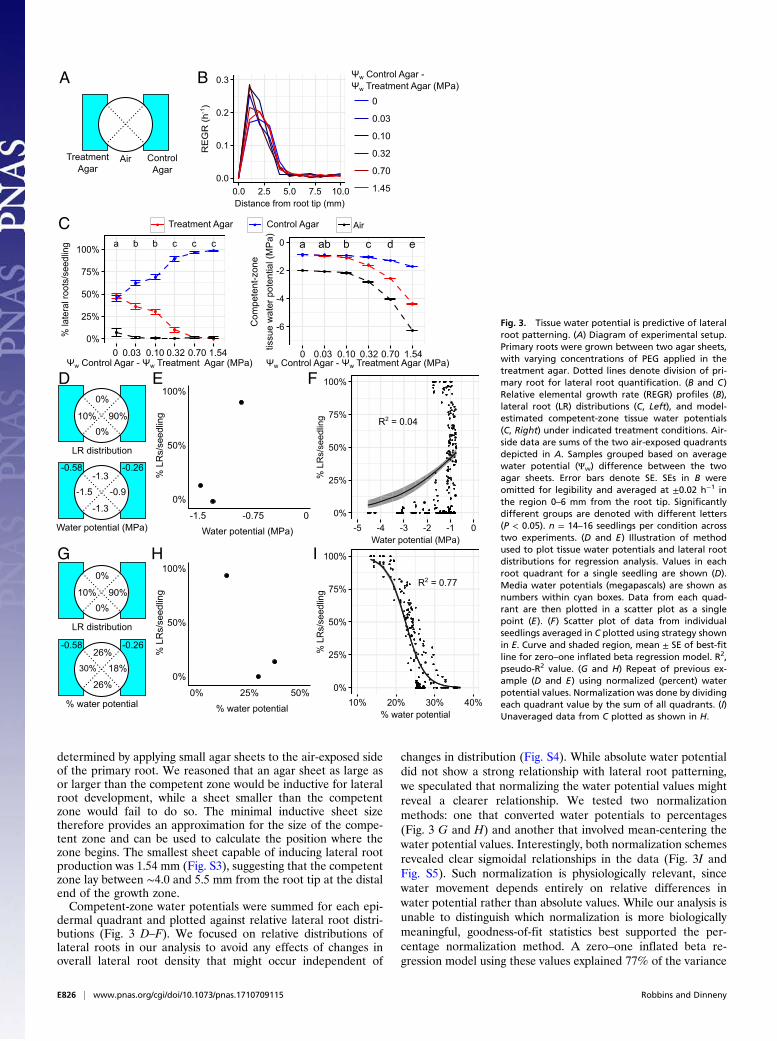
Growth Perturbation Results in Altered Patterns of Gene Expression.To determine the broader downstream impact that growth-sustained water potentials have on cellular signaling and physi-ology we performed transcriptomic profiling of longitudinal do-mains of the root corresponding to the competent and fixedregions and separately profiled tissue in contact with air or agar(Fig. 6A and Dataset S2; and Gene Expression Omnibus data-base accession no. GSE92406). We detected a total of25,835 unique transcripts, 1,559 of which were significantly dif-ferentially expressed between the air- and agar-exposed sides ofthe root. Of these, 1,461 were differentially expressed in the fixedzone, suggesting that the functional divergence of the two sidesoccurred primarily after competence was lost.The side-biased transcriptome included a number of pathways
known to be affected by hydropatterning, including anthocyaninbiosynthesis, root hair development, programmed cell death,lignin accumulation, and signaling associated with the planthormone auxin (6, 34). Several genes up-regulated on the agar sideencoded LATERAL ORGAN BOUNDARIES (LOB) domaintranscription factors, including ROOTLESS CONCERNINGCROWN AND SEMINAL LATERAL ROOTS (RTCS) (35).
RTCS homologs in Arabidopsis and rice are involved in earlystages of lateral root development (36–39), suggesting that thesegenes may serve as markers of this process in maize. Our analysisrevealed other pathways regulated during hydropatterning, in-cluding brassinosteroid and ethylene signaling, and water trans-port. The majority of these side-biased pathways appear in thefixed zone and provide insights on downstream consequences ofwater perception.We also compared the transcriptomes of competent and fixed
tissues on the two sides of the root to determine how gene ex-pression changed during this developmental transition (DatasetS3); 12,055 genes were significantly differentially expressed be-tween the two zones independent of the side of the root queried,suggestive of a large cohort of developmentally regulated genesthat are unresponsive to environmental inputs. Gene Ontology(GO) analysis identified enrichment of genes likely involved inmeristem function in the competent zone (translation, chromatinorganization, DNA replication, and cell cycle control) and genesrelated to Casparian strip formation and other aspects of de-velopmental maturation in the fixed zone (abiotic and bioticstress response, hormone response, and phenylpropanoid me-tabolism) (Dataset S4).A smaller set of genes was found to vary between the two
zones in a side-dependent manner (Dataset S3). GO analysis waslargely unable to identify enrichment of functional categories
A
B
C D
E
Fig. 5. Growth is necessary for lateral root hydro-patterning. (A and B) Air-side lateral root (LR)emergence frequency (A) and relative elementalgrowth rate (REGR) (B) in indicated condition. Pri-mary roots were grown between two agar sheets,with lateral roots quantified in the air gap betweenthe sheets. Chemical treatments were added toboth agar sheets. Significantly different groups aredenoted with different letters (P < 0.05). (C) Ob-served and model-predicted lateral root distributionsfor samples in B. Diagonal line denotes perfect pre-diction by the model. Values in parentheses denotePearson’s correlation coefficient for comparison ofempirical and predicted values. Each coefficient sig-nificantly differed from 0 (P < 0.0002). (D) Air-sidelateral root emergence frequency in indicated inbredline. Seedlings were grown along one agar surface.Asterisk indicates significant difference from B73(P < 0.05). (E) REGR for B73 and Oh7B seedlingsgrown between two agar surfaces. n = 10–16 (A), 7–8(B and C), 5–15 (D), and 8 (E) seedlings per treat-ment level or genotype across two experiments.Additional replicates of lateral root phenotyping un-der Na3VO4 treatment and for Oh7B can be foundin Fig. S8.
E828 | www.pnas.org/cgi/doi/10.1073/pnas.1710709115 Robbins and Dinneny
among these genes, with RNA processing specific to the com-petent zone on the air side being the only major function iden-tified (Dataset S4). Examination of the most highly differentiallyexpressed genes in this set revealed several encoding kinases andcalcium-signaling proteins specific to the fixed zone on thecontact side, suggestive of changes in signaling unique to water-contacting tissues. While these data provide an examination ofthe transcriptional changes that occur in response to local con-tact of tissues with water or air, further analysis is required todetermine which, if any, of these transcriptionally regulatedgenes may be components of the signaling pathway necessary forperception of water availability.To test the role that growth has in determining these gene
expression patterns we used high-throughput RT-qPCR toquantify expression of a panel of side-biased genes in seedlingstreated with Na3VO4 or citric acid (Fig. 6B and Dataset S6). Todetermine if differentially expressed genes were responsive towater availability or mechanical contact we compared roots ex-posed to air and agar with roots grown between agar and a sheetof Parafilm to simulate contact with a non-water-conducting sur-face. A subset of the genes examined were equally induced byParafilm and control media, indicating that mechanical contactalone was likely responsible for their induction by agar (touch-induced). Among the genes that were induced by agar and nottouch alone we identified several that lost their water-biasedexpression under growth inhibition. Within this set were genesin the auxin pathway, as well as members of the PYRABACTINRESISTANCE1/PYR1-LIKE (PYL)/REGULATORY COMPONENTOF ABA RECEPTORS family of receptors for abscisic acid, ahormone broadly involved in responses to water-deficit stress (40).The expression pattern of all water-responsive genes tested wasaffected by growth inhibition. However, this does not preclude thepresence of growth-independent pathways for water perceptionoperating within the root. A more thorough examination of thewater-responsive transcriptome may reveal evidence in support ofthis possibility. Nonetheless, the above observations demonstratethat a portion of the water-responsive transcriptome is sensitive tochanges in growth dynamics, providing evidence of a more generalrole for growth in the response of the root to water availability.
DiscussionTogether, our data support a model in which growth-dependentwater uptake, in conjunction with spatial heterogeneity in localwater availability, generates internal gradients of tissue waterpotential that inform developmental patterning and gene ex-pression (Fig. 7). Thus, growth induces a physical state in whichwater perception can occur. This “sense-by-growth” mechanismillustrates that the perception of water is dependent on a state ofdisequilibrium established by the organism that allows mean-ingful spatial information to be derived from the external envi-ronment. Our work represents a significant advance in ourunderstanding of the processes governing water sensing in plants,as it connects perception of a key environmental resource to acentral physiological function of the organ.This conclusion is based partly on results from mathematical
modeling, which showed that estimates of tissue water potentialare strongly predictive of lateral root patterning. The precisenature of this relationship depends largely on assumed param-eter values, with tissue hydraulic conductivity being the mostinfluential of those examined. Improving the model would requiremore refined measurements of conductivity that take into accountvariation between tissue layers and paths of water movement (41).Advances in water tracking using Raman spectroscopy, which candistinguish between water molecules containing different hydro-gen isotopes with high spatial and temporal resolution, make this apromising tool for such experiments (42–44).While these efforts would improve the model, direct mea-
surement of tissue water potential will best circumvent the issues
A
B
Fig. 6. Growth plays a role in regulation of gene expression by water availability.(A) Expression patterns of side-biased gene categories identified by RNA sequenc-ing (RNA-Seq). Seedlings were grown along a single agar surface and sectionedaccording to diagram (Top). Air/agar FPKM (fragments per kilobase million) ratiowas computed for each gene and averaged by category. Resulting values werethen log-transformed. Number of genes per category are indicated in parentheses.**Values for ATP biosynthesis were outliers (6.34 and 6.77 for competent and fixedzones, respectively) and are plotted as 2.5. (B) Expression patterns of a subset ofgenes identified in A measured by RT-qPCR. Seedlings were grown between agarand indicated low-water availability substrate (Top). Agar was supplemented with1.5 mM Na3VO4 or 20 mM citric acid where indicated. Air/agar relative expressionratio (arbitrary units) was computed for each gene and log-transformed. Paren-theses denote genes identified as statistically significantly regulated (P < 0.05): C,citric acid-sensitive; S, side-biased in air/control agar and Parafilm/control agar; T,touch-sensitive; V, Na3VO4-sensitive. Growth-sensitive and touch-sensitive geneclusters identified based on hierarchical clustering. Data are shown for fixed-zone tissues. n = 3 pools of two seedlings each for each tissue section for both Aand B. Gray box denotes insufficient data to perform calculations.
Robbins and Dinneny PNAS | Published online January 9, 2018 | E829
PLANTBIOLO
GY
PNASPL
US

associated with inaccurate parameterization. However, currenttechnology for accomplishing this, the pressure probe (45), ishighly invasive and would likely be difficult to adapt to theseedling growth conditions used in this study. Optical sensors ofcellular water potential, akin to a macromolecular crowdingsensor developed previously (46), would be a useful alternative.These would be more versatile and less invasive than the currentapproach, and could also open new avenues of research onplant–water relations at the microscale.The physiological mechanism for water perception proposed
here provides clues toward identifying molecular–genetic actors inthis pathway. Key to this pursuit is our identification of thecompetent zone for water responsiveness, located at the end of theroot growth zone. We hypothesize that the molecular machineryfor water perception is likely to be expressed and active within thisregion of tissue. Although our transcriptional analysis did notidentify clear candidates for genes that play this role, it is possiblethat time-course analysis of molecular events immediately fol-lowing water application may be more informative. Our discovery
of altered hydropatterning in the maize inbred Oh7B providesanother potential avenue for genetic studies. Since this inbred isincluded in the NAM population, mapping of genetic loci asso-ciated with this phenotype using quantitative trait locus analysiswill likely be relatively straightforward.In addition, our results provide a framework for under-
standing the role of hydropatterning under water deficit in thefield. Current understanding of root-system architecture positsthe existence of root ideotypes, idealized architectures suited tospecific environmental contexts (47). We speculate that stronghydropatterning would be most suitable in environments thatexperience prolonged water deficit, as stricter placement oflateral roots would limit resource expenditure toward exploringwater-poor regions of soil. Contrastingly, weak hydropatterningmay be useful in fluctuating water conditions, where short-termcosts associated with branching in low-water areas would beoffset by an enhanced ability to capture later influxes of water.Alternatively, weak hydropatterning may allow for the uptakeof resources, such as phosphorus, present in the upper layers ofsoil, which generally dry faster. The weak-hydropatterningphenotype of Oh7B can be leveraged to test these hypothesesin field trials. Once the effects of altered hydropatterning areclarified, targeted modification of root biophysical parameters(e.g., tissue conductivity) could be performed to tune lateralroot patterning to fit a variety of watering regimes. Our mathe-matical model could help guide these efforts by enabling spe-cific modifications to be tested in silico before being carried outin planta.These and other future studies proposed here will be key to
advancing our overall understanding of plant water perceptionand its impact on root-system architecture. Knowledge of thiswill be integral to improving crop water-use efficiency to meetthe demands of a growing world population.
Materials and MethodsPlant materials and methods for plant growth, kinematic growth analysis,competent zone determination, mathematical modeling, lateral rootquantification, and transcriptional analyses can be found in SI Materialsand Methods.
ACKNOWLEDGMENTS. We thank Robert E. Sharp, John S. Boyer, Kenneth A.Shackel, and Wendy K. Silk for inspiration and suggestions on experimentaldesign; Silk and members of the J.R.D. laboratory for critical evaluation ofthe content of the manuscript; and Wei Feng for performing independentreplication of key experiments (Fig. S8). This work was supported by theCarnegie Institution for Science Endowment and the National Science Foun-dation’s Plant Genome Research Program (Grant IOS-PGRP 420-40-45A) (toJ.R.D.). Research reported in this publication was supported by the NationalInstitute of General Medical Sciences of the National Institutes of Healthunder Award T32GM007276. The content is solely the responsibility of theauthors and does not necessarily represent the official views of the NationalInstitutes of Health. This material is based upon work supported by theNational Science Foundation Graduate Research Fellowship under GrantDGE-1147470. Any opinion, findings, and conclusions or recommendationsexpressed in this material are those of the author(s) and do not necessarilyreflect the views of the National Science Foundation.
1. Robbins NE, 2nd, Dinneny JR (2015) The divining root: Moisture-driven responses ofroots at the micro- and macro-scale. J Exp Bot 66:2145–2154.
2. O’Rourke SM, Herskowitz I, O’Shea EK (2002) Yeast go the whole HOG for the hy-perosmotic response. Trends Genet 18:405–412.
3. Yuan F, et al. (2014) OSCA1 mediates osmotic-stress-evoked Ca2+ increases vital forosmosensing in Arabidopsis. Nature 514:367–371.
4. Wilson ME, Basu MR, Bhaskara GB, Verslues PE, Haswell ES (2014) Plastid os-motic stress activates cellular stress responses in Arabidopsis. Plant Physiol 165:119–128.
5. Hamilton ES, et al. (2015) Mechanosensitive channel MSL8 regulates osmotic forcesduring pollen hydration and germination. Science 350:438–441.
6. Bao Y, et al. (2014) Plant roots use a patterning mechanism to position lateral rootbranches toward available water. Proc Natl Acad Sci USA 111:9319–9324.
7. Scott MP (2000) Development: The natural history of genes. Cell 100:27–40.8. Waddington CH (1932) III. Experiments on the development of chick and duck
embryos, cultivated in vitro. Philos Trans R Soc Lond B Biol Sci 221:179–230.
9. Ishikawa H, Evans ML (1995) Specialized zones of development in roots. Plant Physiol109:725–727.
10. Sharp RE, Silk WK, Hsiao TC (1988) Growth of the maize primary root at low waterpotentials: I. Spatial distribution of expansive growth. Plant Physiol 87:50–57.
11. Erickson RO (1976) Modeling of plant growth. Annu Rev Plant Physiol 27:407–434.12. Erickson RO, Silk WK (1980) The kinematics of plant growth. Sci Am 242:134–151.13. Moreno-Risueno MA, et al. (2010) Oscillating gene expression determines compe-
tence for periodic Arabidopsis root branching. Science 329:1306–1311.14. Cosgrove DJ (2005) Growth of the plant cell wall. Nat Rev Mol Cell Biol 6:850–861.15. Ober ES, Sharp RE (2007) Regulation of root growth responses to water deficit.
Advances in Molecular Breeding Towards Salinity and Drought Tolerance, edsJenks MA, Hasegawa PM, Jain SM (Springer, New York), pp 33–53.
16. Kramer PJ, Boyer JS (1995) Water Relations of Plants and Soils (Academic, San Diego).17. Verslues PE, Agarwal M, Katiyar-Agarwal S, Zhu J, Zhu J-K (2006) Methods and con-
cepts in quantifying resistance to drought, salt and freezing, abiotic stresses thataffect plant water status. Plant J 45:523–539.
A B
Fig. 7. A sense-by-growth mechanism for water perception. (A) A primaryroot grows along an air–water interface (white and cyan, respectively) in anetwork of soil particles (brown). Rapid growth (dashed arrow) leads toinduction of a strong internal water potential gradient (red) that drivespatterning of lateral-root branches toward areas of high water availability.(B) A root with slower growth (dashed arrow) induces a weaker water po-tential gradient and positions lateral roots in areas of both high and lowwater availability.
E830 | www.pnas.org/cgi/doi/10.1073/pnas.1710709115 Robbins and Dinneny

18. Molz FJ, Boyer JS (1978) Growth-induced water potentials in plant cells and tissues.Plant Physiol 62:423–429.
19. Nonami H, Boyer JS (1993) Direct demonstration of a growth-induced water potentialgradient. Plant Physiol 102:13–19.
20. Silk WK, Wagner KK (1980) Growth-sustaining water potential distributions in theprimary corn root: A noncompartmented continuummodel. Plant Physiol 66:859–863.
21. Wiegers BS, Cheer AY, Silk WK (2009) Modeling the hydraulics of root growth in threedimensions with phloem water sources. Plant Physiol 150:2092–2103.
22. Boyer JS, Silk WK, Watt M (2010) Path of water for root growth. Funct Plant Biol 37:1105–1116.
23. Hukin D, Doering-Saad C, Thomas CR, Pritchard J (2002) Sensitivity of cell hydraulicconductivity to mercury is coincident with symplasmic isolation and expression ofplasmalemma aquaporin genes in growing maize roots. Planta 215:1047–1056.
24. Steudle E, Oren R, Schulze E-D (1987) Water transport in maize roots: Measurementof hydraulic conductivity, solute permeability, and of reflection coefficients of excisedroots using the root pressure probe. Plant Physiol 84:1220–1232.
25. Ehlert C, Maurel C, Tardieu F, Simonneau T (2009) Aquaporin-mediated reduction inmaize root hydraulic conductivity impacts cell turgor and leaf elongation evenwithout changing transpiration. Plant Physiol 150:1093–1104.
26. Frensch J, Hsiao TC (1995) Rapid response of the yield threshold and turgor regulationduring adjustment of root growth to water stress in Zea mays. Plant Physiol 108:303–312.
27. Melkonian J, Yu LX, Setter TL (2004) Chilling responses of maize (Zea mays L.) seed-lings: Root hydraulic conductance, abscisic acid, and stomatal conductance. J Exp Bot55:1751–1760.
28. Nobel PS (2005) Physicochemical and Environmental Plant Physiology (Elsevier,Burlington, MA).
29. Steudle E, Boyer JS (1985) Hydraulic resistance to radial water flow in growing hy-pocotyl of soybean measured by a new pressure-perfusion technique. Planta 164:189–200.
30. Colombo R, Bonetti A, Cerana R, Lado P (1981) Effect of plasmalemma ATPase in-hibitors, diethylstilbestrol and orthovanadate, on fusicoccin-induced H+ extrusion inmaize roots. Plant Sci Lett 21:305–315.
31. Mesenko MM, Ivanov VB (2005) The effects of H+-ATPase activator and inhibitors oncell growth in the maize root. Russ J Plant Physiol 52:497–503.
32. Morsomme P, Boutry M (2000) The plant plasma membrane H(+)-ATPase: Structure,function and regulation. Biochim Biophys Acta 1465:1–16.
33. McMullen MD, et al. (2009) Genetic properties of the maize nested associationmapping population. Science 325:737–740.
34. Lí�ska D, Martinka M, Kohanová J, Lux A (2016) Asymmetrical development of rootendodermis and exodermis in reaction to abiotic stresses. Ann Bot 118:667–674.
35. Taramino G, et al. (2007) The maize (Zea mays L.) RTCS gene encodes a LOB domainprotein that is a key regulator of embryonic seminal and post-embryonic shoot-borneroot initiation. Plant J 50:649–659.
36. Goh T, Joi S, Mimura T, Fukaki H (2012) The establishment of asymmetry in Arabi-dopsis lateral root founder cells is regulated by LBD16/ASL18 and related LBD/ASLproteins. Development 139:883–893.
37. Inukai Y, et al. (2005) Crown rootless1, which is essential for crown root formation inrice, is a target of an AUXIN RESPONSE FACTOR in auxin signaling. Plant Cell 17:1387–1396.
38. Lee HW, Kim NY, Lee DJ, Kim J (2009) LBD18/ASL20 regulates lateral root formation incombination with LBD16/ASL18 downstream of ARF7 and ARF19 in Arabidopsis. PlantPhysiol 151:1377–1389.
39. Okushima Y, Fukaki H, Onoda M, Theologis A, Tasaka M (2007) ARF7 andARF19 regulate lateral root formation via direct activation of LBD/ASL genes inArabidopsis. Plant Cell 19:118–130.
40. Cutler SR, Rodriguez PL, Finkelstein RR, Abrams SR (2010) Abscisic acid: Emergence ofa core signaling network. Annu Rev Plant Biol 61:651–679.
41. Steudle E, Peterson CA (1998) How does water get through roots? J Exp Bot 49:775–788.
42. Ibata K, Takimoto S, Morisaku T, Miyawaki A, Yasui M (2011) Analysis of aquaporin-mediated diffusional water permeability by coherent anti-stokes Raman scatteringmicroscopy. Biophys J 101:2277–2283.
43. Potma E, de Boeij WP, van Haastert PJ, Wiersma DA (2001) Real-time visualization ofintracellular hydrodynamics in single living cells. Proc Natl Acad Sci USA 98:1577–1582.
44. Yu Y-C, Sohma Y, Takimoto S, Miyauchi T, Yasui M (2013) Direct visualization andquantitative analysis of water diffusion in complex biological tissues using CARS mi-croscopy. Sci Rep 3:2745.
45. Boyer JS (1995)Measuring the Water Status of Plants and Soils (Academic, San Diego).46. Boersma AJ, Zuhorn IS, Poolman B (2015) A sensor for quantification of macromo-
lecular crowding in living cells. Nat Methods 12:227–229.47. Feng W, Lindner H, Robbins NE, 2nd, Dinneny JR (2016) Growing out of stress: The
role of cell- and organ-scale growth control in plant water-stress responses. Plant Cell28:1769–1782.
48. Robbins NE, II, Dinneny J (2016) A method to analyze local and systemic effects ofenvironmental stimuli on root development in plants. Bio Protoc 6.
49. Schindelin J, et al. (2012) Fiji: An open-source platform for biological-image analysis.Nat Methods 9:676–682.
50. Lowe DG (2004) Distinctive image features from scale-invariant keypoints. Int JComput Vis 60:91–110.
51. R Core Team (2016) R: A Language and Environment for Statistical Computing. Ver-sion 3.3.2. Available at https://www.R-project.org/. Accessed January 23, 2017.
52. Wickham H (2011) The split-apply-combine strategy for data analysis. J Stat Softw 40:1–29.
53. Hothorn T, Bretz F, Westfall P (2008) Simultaneous inference in general parametricmodels. Biom J 50:346–363.
54. Pinheiro J, Bates D, DebRoy S, Sarkar D; R Core Team (2016) nlme: Linear and Non-linear Mixed Effects Models. Version 3.1-128. Available at CRAN.R-project.org/package=nlme. Accessed January 23, 2017.
55. Wickham H (2016) tidyr: Easily Tidy Data with “spread()” and “gather()” Functions.Version 0.6.0. Available at https://CRAN.R-project.org/package=tidyr. Accessed January23, 2017.
56. Ishida T, Anno T, Matsukawa S, Nagano T (2000) Hydraulic conductivity and diffusioncoefficient in gels for plant tissue culture. Environ Control Biol 38:165–171.
57. Nobel PS, Cui M (1992) Prediction and measurement of gap water vapor conductancefor roots located concentrically and eccentrically in air gaps. Plant Soil 145:157–166.
58. Rigby RA, Stasinopoulos DM (2005) Generalized additive models for location, scaleand shape. J R Stat Soc Ser C Appl Stat 54:507–554.
59. Chang W, Cheng J, Allaire J, Xie Y, McPherson J (2016) Shiny: Web ApplicationFramework for R. Version 0.14.2. Available at https://CRAN.R-project.org/package=shiny.Accessed January 23, 2017.
60. Wickham H (2009) ggplot2: Elegant Graphics for Data Analysis (Springer, New York).61. Wickham H (2016) scales: Scale Functions for Visualization. Version 0.4.1. Available at
https://CRAN.R-project.org/package=scales. Accessed January 23, 2017.62. Urbanek S, Horner J (2015) Cairo: R Graphics Device Using Cairo Graphics Library
for Creating High-Quality Bitmap (PNG, JPEG, TIFF), Vector (PDF, SVG, PostScript)and Display (X11 and Win32) Output. Version 1.5-9. Available at https://CRAN.R-project.org/package=Cairo. Accessed January 23, 2017.
63. Kahle D, Wickham H (2013) ggmap: Spatial visualization with ggplot2. R J 5:144–161.64. Bivand R, Lewin-Koh N (2016) maptools: Tools for Reading and Handling Spatial
Objects. Version 0.8-39. Available at https://CRAN.R-project.org/package=maptools.Accessed January 23, 2017.
65. Bivand R, Rundel C (2016) rgeos: Interface to Geometry Engine - Open Source (GEOS).Version 0.3-21. Available at https://CRAN.R-project.org/package=rgeos. Accessed January23, 2017.
66. Andrews S (2010) FastQC: A Quality Control Tool for High Throughput Sequence Data.Version 0.10.1. Available at www.bioinformatics.babraham.ac.uk/projects/fastqc. Ac-cessed January 23, 2017.
67. Buffalo V (2014) Scythe–A Bayesian Adapter Trimmer. Version 0.981. Available athttps://github.com/vsbuffalo/scythe. Accessed January 23, 2017.
68. Martin M (2011) Cutadapt removes adapter sequences from high-throughput se-quencing reads. EMBnet J 17:10–12.
69. Joshi NA, Fass JN (2011) Sickle: A Sliding-Window, Adaptive, Quality-Based TrimmingTool for FastQ Files. Version 1.0. Available at https://github.com/najoshi/sickle. AccessedJanuary 23, 2017.
70. Kersey PJ, et al. (2016) Ensembl Genomes 2016: More genomes, more complexity.Nucleic Acids Res 44:D574–D580.
71. Kim D, et al. (2013) TopHat2: Accurate alignment of transcriptomes in the presence ofinsertions, deletions and gene fusions. Genome Biol 14:R36.
72. Trapnell C, et al. (2010) Transcript assembly and quantification by RNA-Seq revealsunannotated transcripts and isoform switching during cell differentiation. NatBiotechnol 28:511–515.
73. Roberts A, Trapnell C, Donaghey J, Rinn JL, Pachter L (2011) Improving RNA-seq ex-pression estimates by correcting for fragment bias. Genome Biol 12:R22.
74. Li H, et al.; 1000 Genome Project Data Processing Subgroup (2009) The sequencealignment/map format and SAMtools. Bioinformatics 25:2078–2079.
75. Anders S, Pyl PT, Huber W (2015) HTSeq–A Python framework to work with high-throughput sequencing data. Bioinformatics 31:166–169.
76. Trapnell C, et al. (2013) Differential analysis of gene regulation at transcript resolu-tion with RNA-seq. Nat Biotechnol 31:46–53.
77. Love MI, Huber W, Anders S (2014) Moderated estimation of fold change and dis-persion for RNA-seq data with DESeq2. Genome Biol 15:550.
78. Reimand J, et al. (2016) g:Profiler–A web server for functional interpretation of genelists (2016 update). Nucleic Acids Res 44:W83–W89.
79. Lawrence CJ, Seigfried TE, Brendel V (2005) The maize genetics and genomics data-base. The community resource for access to diverse maize data. Plant Physiol 138:55–58.
80. Du Z, Zhou X, Ling Y, Zhang Z, Su Z (2010) agriGO: A GO analysis toolkit for theagricultural community. Nucleic Acids Res 38:W64–W70.
81. Saeed AI, et al. (2003) TM4: A free, open-source system for microarray data man-agement and analysis. Biotechniques 34:374–378.
82. Ramakers C, Ruijter JM, Deprez RH, Moorman AFM (2003) Assumption-free analysis ofquantitative real-time polymerase chain reaction (PCR) data. Neurosci Lett 339:62–66.
Robbins and Dinneny PNAS | Published online January 9, 2018 | E831
PLANTBIOLO
GY
PNASPL
US