
Growth and Structure of Workforce in India : An Analysis ... · PDF fileGrowth and Structure...
24
Final Draft Growth and Structure of Workforce in India – Venkatanarayana and Suresh Naik Page 1 Growth and Structure of Workforce in India : An Analysis of Census 2011 Data M. Venkatanarayana Research Officer, S R Sankaran Chair (Rural Labour), National Institute of Rural Development (NIRD), Hyderabad, Mobil No:+91944142216d3 Suresh V. Naik Research Scholar, School of Economics, University of Hyderabad, Hyderabad, Mobile No: +919908339277 Abstract Census 2011 brings new dimension to ongoing debate on the decline in the growth of employment from the last two decade. The census 2011 result gives better picture when compared with NSSO estimation of workforce. It is observed that there is a fast decelerating rate of growth in overall workforce, particularly that of females, between 2001 and 2011. But the work participation rate has not declined, if not increase, as the rate of growth in workforce is not less than that of population. Secondly, incremental workforce especially the male is getting reduced to marginal workers category whereas the high concentration of female in the category of marginal workers is slightly reduced. Occupational distribution of workforce shows that cultivators are declining such decline in agriculture is replaced by increasing agricultural labour. Growth of workforce in non-agriculture is higher than that of agriculture. Growth of female workers engaged in non-agriculture is higher than their male counterparts. JEL Classification: J21, J61, J62, Q1, Q15 Keywords: India, Labour Workforce, Growth of Employment, Work Participation, Occupational Distribution and Workforce in Non-Agriculture
Transcript of Growth and Structure of Workforce in India : An Analysis ... · PDF fileGrowth and Structure...

Final Draft
Growth and Structure of Workforce in India – Venkatanarayana and Suresh Naik Page 1
Growth and Structure of Workforce in India : An Analysis of Census 2011 Data
M. Venkatanarayana Research Officer,
S R Sankaran Chair (Rural Labour), National Institute of Rural Development (NIRD),
Hyderabad, Mobil No:+91944142216d3
Suresh V. Naik Research Scholar, School of Economics,
University of Hyderabad, Hyderabad, Mobile No: +919908339277
Abstract
Census 2011 brings new dimension to ongoing debate on the decline in the growth of
employment from the last two decade. The census 2011 result gives better picture when
compared with NSSO estimation of workforce. It is observed that there is a fast decelerating
rate of growth in overall workforce, particularly that of females, between 2001 and 2011. But
the work participation rate has not declined, if not increase, as the rate of growth in workforce
is not less than that of population. Secondly, incremental workforce especially the male is
getting reduced to marginal workers category whereas the high concentration of female in the
category of marginal workers is slightly reduced. Occupational distribution of workforce
shows that cultivators are declining such decline in agriculture is replaced by increasing
agricultural labour. Growth of workforce in non-agriculture is higher than that of
agriculture. Growth of female workers engaged in non-agriculture is higher than their male
counterparts.
JEL Classification: J21, J61, J62, Q1, Q15
Keywords: India, Labour Workforce, Growth of Employment, Work Participation, Occupational Distribution and Workforce in Non-Agriculture

Final Draft
Growth and Structure of Workforce in India – Venkatanarayana and Suresh Naik Page 2
I Introduction
The major objective of economic reforms is accelerating growth and expanding the
employment opportunities. India in its vision programme the government has
stressed more on employment generation at least two per cent per annum to be
compatible with the nine per cent growth in the economy. Further, it emphasized on
promoting labour intensive and high employment elasticity sectors to achieve the
quantitative employment growth target (Government of India, Ministry of Labour
and Employment, 2011). Again, one of the objectives of the 12th Five Year Plan is
‘more inclusive growth’ (Planning Commission, 2011), which is possible through the
growth of productive employment. Despite of having grand plan design and vision,
the overall employment growth rate is decelerating during the post reform period, in
particular, during the last decade. Realising the vision and plan objective seems to be
doubtful in the context of decelerating employment growth in the recent past.
NSSO’s recent estimations with respect to its employment and unemployment
survey, brings out a virtual stagnation in the employment growth indicating jobless
growth in the Indian economy. These results have raised a concern over the
employment situation among the policy makers, academicians and development
activist (see, Chaudhary, 2011; Rangarajan et. al, 2011; Kannan and Ravindran, 2012;
Papola, 2012).
The present paper is a quick note on an analysis of the trend in growth of workforce
and change in its structure in India during the last three decades using Census data.
It is an attempt to present the changes in workforce particularly in the context of
recent release of Primary Census of Abstract 2011 of Census of India. The analysis is
to bring out changes during last decade (2001-11) and the relative performance over
the previous two decades (1980s and 1990s) for which Census data for workers is
comparable. The present analysis is confined to Census data only; it does not make
any comparison with NSSO based estimates, if not more than passing reference.
Finally, the rural-urban dimension is out of scope for this paper in order to minimize
of complexity of in-depth detailed analysis of workforce by status and gender.
Final Draft
Growth and Structure of Workforce in India – Venkatanarayana and Suresh Naik Page 3
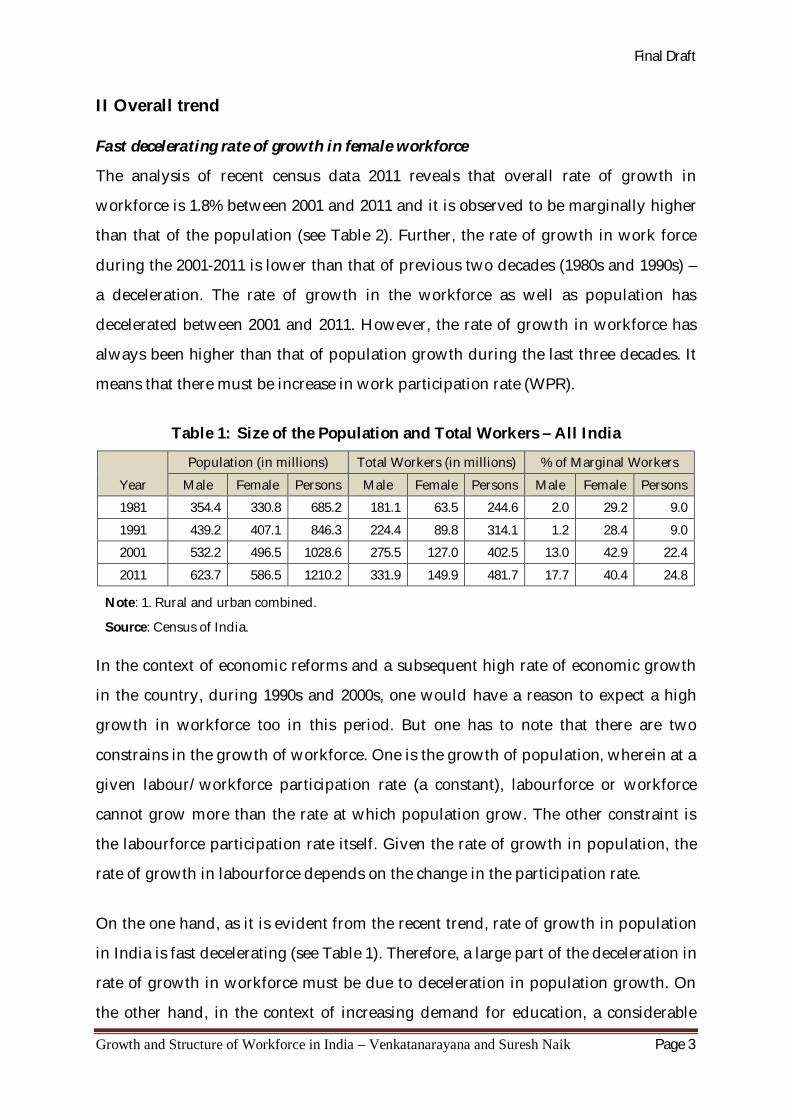
II Overall trend
Fast decelerating rate of growth in female workforce
The analysis of recent census data 2011 reveals that overall rate of growth in
workforce is 1.8% between 2001 and 2011 and it is observed to be marginally higher
than that of the population (see Table 2). Further, the rate of growth in work force
during the 2001-2011 is lower than that of previous two decades (1980s and 1990s) –
a deceleration. The rate of growth in the workforce as well as population has
decelerated between 2001 and 2011. However, the rate of growth in workforce has
always been higher than that of population growth during the last three decades. It
means that there must be increase in work participation rate (WPR).
Table 1: Size of the Population and Total Workers – All India
Year
Population (in millions) Total Workers (in millions) % of Marginal Workers
Male Female Persons Male Female Persons Male Female Persons 1981 354.4 330.8 685.2 181.1 63.5 244.6 2.0 29.2 9.0
1991 439.2 407.1 846.3 224.4 89.8 314.1 1.2 28.4 9.0 2001 532.2 496.5 1028.6 275.5 127.0 402.5 13.0 42.9 22.4
2011 623.7 586.5 1210.2 331.9 149.9 481.7 17.7 40.4 24.8
Note: 1. Rural and urban combined.
Source: Census of India. In the context of economic reforms and a subsequent high rate of economic growth
in the country, during 1990s and 2000s, one would have a reason to expect a high
growth in workforce too in this period. But one has to note that there are two
constrains in the growth of workforce. One is the growth of population, wherein at a
given labour/workforce participation rate (a constant), labourforce or workforce
cannot grow more than the rate at which population grow. The other constraint is
the labourforce participation rate itself. Given the rate of growth in population, the
rate of growth in labourforce depends on the change in the participation rate.
On the one hand, as it is evident from the recent trend, rate of growth in population
in India is fast decelerating (see Table 1). Therefore, a large part of the deceleration in
rate of growth in workforce must be due to deceleration in population growth. On
the other hand, in the context of increasing demand for education, a considerable

Final Draft
Growth and Structure of Workforce in India – Venkatanarayana and Suresh Naik Page 4
proportion of younger age population is either withdrawing from labourforce or
postpone their entry into labourforce in order to attend educational institution and
pursuing higher studies. Research studies based on NSSO data, have already
expounded on this fact (Chaudhary, 2011; Kannan and Ravidran, 2012). Such an
increase in demand for education increases the human capital base of the country
and hence it is considered as a welcome feature (Planning Commission, 2011).
Therefore, given the above mentioned fact, the scope for increase in labourforce
participation rate appears to be limited unless if the participate rate increase among
the adults (25 year and above) and old age (60 + age) population1. But, unlike the
NSSO estimations, the Census data is showing no decline in the work participation
rate (see Table 4). There seems to be increasing participation of adults and old age to
replace the decline in younger ages.
Table 2: Growth of Population and Workforce – All India
Category Person Male Female
1981-91 1991-01 2001-11 1981-91 1991-01 2001-11 1981-91 1991-01 2001-11
Total Population 2.1 2.0 1.6 2.2 1.9 1.6 2.1 2.0 1.7 Total Workers 2.5 2.5 1.8 2.2 2.1 1.9 3.5 3.5 1.7
Main workers 2.5 0.9 1.5 2.2 0.8 1.3 3.6 1.2 2.1
Marginal workers 2.5 12.3 2.8 -2.6 29.5 5.1 3.2 7.9 1.1
Note: 1. Rural and urban combined; 2. Compound Annual Growth Rate (CAGR) in %.
Source: Census of India.
Having said, the gender-wise analysis of Census data shows that the rate of growth
in female workforce and in their population are almost the same rate between 2001
and 2011 (see Table 2). The rate of growth in female workforce during 1980s and
1990s was 1.75 times higher than of its population. Such a relatively high growth of
female workforce over their population was possible with increasing WPR between
1981 and 2001 (see Table 3). In case of males, there has not been much difference in 1 It is possible if those adults who otherwise have not been participated in the labourforce and are incentivized to participate. Here, there is a little scope for increasing participation rate among the adult males wherein it is already saturated. But there is a possibility among adult females whose participation rate is considerably low. Nevertheless their labour market participation depends upon their time spent for household chores and child care, and also the cultural factors particularly in India. Besides, the demand for their labour in the labour market especially in the context of poor educational levels among women plays critical role in labour force participation rate of females.

Final Draft
Growth and Structure of Workforce in India – Venkatanarayana and Suresh Naik Page 5
rate of growth between population and workforce particularly during 1980s. But in
1990s and 2000s the rate of growth in male workforce is marginally higher than that
of its population. In both the cases of males and females, the rate of growth in their
population and workforce is decelerating over a period. However, the deceleration
was faster among the female workforce. Thus, a significant part of the deceleration
in overall workforce could be because of faster deceleration in the female workforce.
Fast growing Marginal Workers Category
Census classifies workers into two categories i.e. main and marginal workers. The
main workers are those who worked for more than six months in a year and the
marginal workers are those who worked for less than six months. The analysis of
Census data shows that during the last two decades (1991-2011) the rate of growth in
marginal workers is higher than that of main workers (see Table 2). The rate of
growth in main workers had decelerated during 1990s when compared with
previous decade (1980s), whereas among marginal workers it accelerated during the
same period. However, it appears that there is revival of growth in main workers
during 2000s but the rate of growth is still less than that of 1980s. On the other hand
there is a deceleration in the rate of growth in marginal workers between 2001 and
2011 but the rate is still higher than that of 1980s and higher than that of main
workers. The analysis shows that marginal workers growing faster than main
workers. Marginal workers have grown to account for one-fourth of the total workforce in
India in 2011 (see Table 1).
The gender-wise analysis of main and marginal workers has shown that the above
pattern is observed particularly for males. In case of females the pattern is little
different. The rate of growth in female marginal workers increased during 1990s
when compared to that of 1980s. Thereafter it decelerated drastically, during 2001-11
to the rate that is less than that of 1980s. Although there is acceleration in growth of
female main workers during 2001-11 it could not compensate the deceleration in
female marginal workers during the same period and hence the deceleration in total
workforce of the female. Between males and females, the rate of growth in female

Final Draft
Growth and Structure of Workforce in India – Venkatanarayana and Suresh Naik Page 6
marginal workers was higher than that of their male counterparts during 1980s.
However, during 1990s and 2000s, the rate of growth in male marginal workers
turns up to be higher than their female counterparts. In case of main workers the rate
of growth in female workforce has been higher than that of male during the last
three decades. The analysis indicates that on the one hand, the rate of growth in
female marginal workers has decelerated fast and, on the other hand, it has
accelerated for the male marginal workers. As a result the percentage of marginal
workers in the total workforce has increased for males since 1991, but for female it
increased during 1991-2001 and thereafter it declined between 2001 and 2011 (see
Table 1). However, the share of female marginal workers, accounting for about 40% of the
total female workforce in 2011, is still considerably higher than that of their male
counterparts.
Improved Main Workers’ Sex Ratio
Sex ratio of population is increasing since 1991 after a down fall between 1981 and
1991 (see Table 3). In the total workforce, the sex ratio has improved between 1981
and 2001, and declined thereafter in recent decade. The sex ratio among main
workers has in fact, continuously been increasing, since 1981 (see Table 3). Thus, the
decline in sex ratio in the total workforce is due to fast decline in sex ratio among the
marginal workers. While the improved sex ratio in main workers reflects the
accelerated rate of growth among female main workers and the decline in high
concentration of among marginal workers reflects the deceleration in the growth of
female marginal workers (see Table 2).
Table 3: Sex Ratio in Population and Workforce – All India
Year Population Total Workers Main Workers Marginal Workers 1981 933 351 253 5245
1991 927 400 290 9425 2001 933 461 303 1520
2011 940 452 327 1032
Note: 1. Rural and urban combined.
Source: Census of India.

Final Draft
Growth and Structure of Workforce in India – Venkatanarayana and Suresh Naik Page 7
No Decline in Work Participation Rate (WPR)
It is worth mentioning that unlike the NSSO’s recent estimates, Census data shows a
marginal increase in the WPR between 2001 and 2011. As the rate of growth in total
workforce is higher than that of population, the WPR is increasing, though it is a
marginal increase (see Table 4). This marginal rise in overall WPR is, in fact, entirely
due to increase in marginal workers’ WPR. Between main and marginal workers, the
main workers’ WPR had in fact shown a decline since 1991 whereas there is a
corresponding increase in marginal workers’ WPR during the same period. Thus,
there is an increase of marginal workers’ share in the total workforce, particularly since
1991 (see Table 1).
The work participation rate by gender shows that the males’ overall WPR registered
an increase in 2001 and 2011, whereas the females’ overall WPR had increased in
1991 and 2001 but remained same in 2011. The male-female combined WPR had
increased all throughout during the last three decades. For the males, their main
worker’s WPR has declined and their marginal workers’ WPR has increased. For the
females, their main workers’ WPR does not show any patters; it has increased
between 1981 and 1991, it declined between 1991 and 2001, and thereafter shown an
increase between 2001 and 2011. The WPR of female marginal workers had increased
between 1981 and 2001, and thereafter it has shown a marginal decline in 2011.
Table 4: Work Participation Rate (WPR) – All India
Year WPR - Total WPR - Main WPR - Marginal
Male Female Persons Male Female Persons Male Female Persons
1981 51.1 19.2 35.7 50.1 13.6 32.5 1.0 5.6 3.2 1991 51.1 22.1 37.1 50.5 15.8 33.8 0.6 6.3 3.3
2001 51.8 25.6 39.1 45.0 14.6 30.4 6.7 11.0 8.8 2011 53.2 25.6 39.8 43.8 15.2 29.9 9.4 10.3 9.9
Note: 1. Rural and urban combined.
Source: Census of India.

Final Draft
Growth and Structure of Workforce in India – Venkatanarayana and Suresh Naik Page 8
Literacy and WPR of Marginal Workers
An analysis of relationship between literacy rate and WPR across 21 major states in
India, for the year 2011, shows an interesting observation. While the WPR of
marginal workers category is negatively correlated with literacy rate, the WPR of
main workers is positively correlated - two different directions (Figure 1). By gender,
correlation coefficient is positive and considerably high for the WPR of male main
workers and male literacy rate (see Table 5). In case of WPR of males and females of
marginal workers category and male and female literacy rate, the correlation
coefficient is negative and considerably high for the cases of male and females.
Figure 1: Scatter Plot - Literacy and WPR of Main and Marginal Workers, 2011
Note: Rural and Urban Combined; Male and female combined.
Source: Author’s Calculation based on Census 2011.
Table 5: Correlation Coefficient between Literacy and WPR by Sex and Category of Workers across 21 Major States in India
Category Persons Male Female Total Workers 0.016 0.378 -0.189
Main Workers 0.374 0.480 0.123 Marginal Workers -0.429 -0.401 -0.426
Note: Rural and urban combined.
Source: Author’s Calculation.
0.0
10.0
20.0
30.0
40.0
50.0
60.0 65.0 70.0 75.0 80.0 85.0 90.0 95.0 100.0
WPR
(%)
Literacy Rate (%)
Main MarginalLinear (Main) Linear (Marginal)

Final Draft
Growth and Structure of Workforce in India – Venkatanarayana and Suresh Naik Page 9
It indicates that, on the one hand, those states with higher literacy rate have a better
WPR of main workers category than those of low literacy rates. On the other hand,
states having low levels of literacy do have higher WPR of marginal worker
category. It could be because of the fact that in the light of globalised and emerging
knowledge-based economy and consequent floating kind of labour market, labour
mobility has become indispensable. Such an economy is also increasing the demand
for skilled labour. The traditional occupations of labour absorption in the village
economy such as agriculture and household industry have shown a gradual
deceleration in their absorption rate. Non-agriculture has become the residual sector
for the absorption of growing labourforce. Many times, in fact, jobs are created in
places – urban or Greenfields of rural location – that are away from places of the job
seekers. Herein, literacy skills in understanding the information, plays a role in job
search and migration. There is a disadvantage of being illiterate. Thus, illiterates
might be more likely to be end up with working in occupations which could provide
employment for a few months in a year at their place of residence or neighbouring
locations.
To sum up, the rate of growth in total work force is decelerating fast during the last
decade when compared previous two decades. Among male and female workers,
the fast deceleration is observed among the female workers. Between main and
marginal workers, the rate of growth is high in the case of marginal than the main
workers during the last decade. The analysis also bring out that while men are
moving from main to marginal worker status whereas in the case of female worker
they are moving from marginal to main status. Finally, the analysis also brings out
the inverse relationship between literacy and WPR of marginal worker category.
III Occupational Distribution
A sharp decline in cultivators
It is observed from the census data that the occupational distribution in the total
workforce is still tilted towards agricultural activities – more than half of the
workforce is concentrated in agriculture. However, a striking feature of the trend is

Final Draft
Growth and Structure of Workforce in India – Venkatanarayana and Suresh Naik Page 10
that there is a sharp decline in the size of self-cultivators and at the same there is a
bulging agricultural labour category.
Strikingly, around 8.9 million farmers, during 2001 and 2011, moved away from self-
cultivation in the total work force. The decline in main workers who involved in
cultivation/farming had begun since 1991. Around 7.5 million farmers of main
workers category during 1991-2001 and another 7.4 million during 2001-11, together
14.9 million farmers of main workers category are moved away from farming during
the last two decades (see Table 6). When there was a decline in main workers
involved in self-cultivation during 1991-2001, around 10.4 million workers newly
entered into farming as marginal workers during the same period. Therefore, there
was a net addition of 2.9 million workers into farming activity during 1991-2001.
Later, during 2001-11, along with farmers in the main workers category (7.4 million)
farmers of marginal workers category (1.5 million) also moved away from farming
activity. Thus, there is a total decline of 8.9 million farmers during 2001-11.
Table 6: Workforce (Persons – in Millions) by Occupation – All India
Year
Total Main Marginal
Cultiv A L HHI Others Cultiv A L HHI Others Cultiv A L HHI Others 1981 102.8 64.4 8.6 68.8 92.5 55.5 7.7 66.8 10.3 8.9 0.9 2.0
1991 124.7 86.0 7.6 95.9 110.7 74.6 6.8 93.8 14.0 11.4 0.8 2.1
2001 127.6 107.4 16.4 151.0 103.2 63.4 12.2 133.4 24.4 44.0 4.2 17.7 2011 118.7 144.3 18.3 200.4 95.8 86.2 12.3 168.1 22.9 58.2 6.0 32.3
Note: 1. Rural and urban combined; 2. Cultiv – Cultivators; A L – Agricultural Labourers; HHI – Household Industry; Others – it includes Industry Sector other than HHI, and those involved in the Services Sector.
Source: Census of India. For the decline in absolute number of cultivators observed during the last two
census period, one may seek an explanation from the two established hypothesis.
These hypotheses are valid if the farmers are moving away from agriculture and
taking up non agricultural activities. Over a period of time in India, in fact, we are
coming across the shift in agriculture work force from agricultural activity to non-
agricultural activity (industry and service sector). The first hypothesis is about

Final Draft
Growth and Structure of Workforce in India – Venkatanarayana and Suresh Naik Page 11
agricultural growth led shift and the second is residual sector hypothesis indicating
distress led shift/diversification (see Meller, 1976 and Vaidyanathan, 1986). Again,
another alternative hypothesis emerged in the context of unprecedented episodes of
farmers’ suicides during the last two decades is the extinction of farming community
itself (Sainath, 2013).
Besides, a few other factors which are of recent developments might have compelled
them to shift from the agricultural activities to non-agriculture activities. Such as,
first, increasing cost of cultivation and reducing profitability of farming acts as
distress. Second, rapid urbanization and real estate boom is attracting the rural
farmers to urban centers with higher wages. Third, in the name of rapid
urbanization, real estate business and industrial development i.e. SEZ, the
government and private entrepreneurs acquiring farm land and throwing farmers
out of land and farming by paying a menial compensation. All the above mentioned
factors might have acted as a push factors.
Farmers becoming agricultural labourers !
In contrast to the above mentioned hypotheses, the workforce appears to be
reshuffled within the agriculture – moving away from self-cultivation to agriculture
labour. It is evident from the fact that there is more than compensating size increase
(to decline in farmers) in the category of agricultural labourers. It is about 36.9
million net additions to the size of agriculture labourers during 2001-11 (see Table 6).
When compared that the decline in workforce engaged in self-cultivation at 7.4
million, is very small. At this point one can say that on the one hand, most of those
farmers who are moving away from farming are becoming agricultural labourers.
On the other hand, although a part of the net addition to the total workforce is
absorbed in agriculture, but the whole of that labourforce absorbed in agriculture is
in turn entirely absorbed in agricultural labourers category.
The occupational distribution of main and marginal workers shows that in both the
categories, particularly during 2001-11, the number of cultivators has declined and
the number of agricultural labourers has increased. The net addition of agricultural

Final Draft
Growth and Structure of Workforce in India – Venkatanarayana and Suresh Naik Page 12
labourers, during 2001-11, in the main workers category is about 22.8 million and in
the marginal category it is about 14.2 million (see Table 6).
By gender, men’s shifting away from self-cultivation had begun since 1991 and
continued in 2011. However, during 1991-2001 some of the women had taken up the
cultivation activity. The entry of women into cultivation had replaced male workers
who left cultivation and also made a net addition to this activity in this period.
Notwithstanding, the women also began leaving farming activity during 2001-11.
Therefore, there is a net decline in the total workforce engaged in cultivation during
2001-11. It is interesting to note that while the men among the main workers
category were moving away from cultivation since 1991, at the same time men who
were taking up cultivation in the marginal workers category has increased during
the same period. Despite the increase in male cultivators of marginal workers
category, as it could not compensate the decline in male cultivators of main workers
category, total male engaged in cultivation has declined during 2001-11.
Table 7: Growth (%) of Workforce by Occupation in India
Year Total Main Marginal
Cultiv A L HHI Others Cultiv A L HHI Others Cultiv A L HHI Others Persons 1981-91 1.9 2.9 -1.3 3.4 1.8 3.0 -1.2 3.5 3.1 2.5 -1.3 0.3 1991-01 0.2 2.3 8.1 4.6 -0.7 -1.6 6.0 3.6 5.7 14.5 18.8 23.9
2001-11 -0.7 3.0 1.1 2.9 -0.7 3.1 0.1 2.3 -0.7 2.8 3.6 6.2 Male
1981-91 1.3 2.7 -2.1 3.2 1.3 2.9 -2.1 3.3 -2.4 -3.1 -2.9 -2.4
1991-01 -0.4 2.0 6.0 4.0 -1.3 -1.2 5.1 3.2 21.8 34.1 26.7 32.8 2001-11 -0.4 3.7 1.6 2.4 -0.7 3.0 0.1 2.0 1.5 5.4 10.7 6.4 Female
1981-91 4.0 3.2 0.4 4.3 4.1 3.2 0.9 4.7 3.8 3.2 -1.1 1.8 1991-01 1.7 2.5 10.7 7.9 1.3 -2.4 7.6 6.0 2.3 10.2 17.5 17.3
2001-11 -1.4 2.1 0.6 4.7 -1.0 3.3 0.2 4.2 -2.0 1.0 1.1 6.0
Note: 1. Rural and urban combined; 2. Compound Annual Growth Rate (CAGR); 3. Cultiv – Cultivators; A L – Agricultural Labourers; HHI – Household Industry; Others – it includes Industry Sector other than HHI, and those involved in the Services Sector.
Source: Census of India.

Final Draft
Growth and Structure of Workforce in India – Venkatanarayana and Suresh Naik Page 13
With respect to agricultural labour, in the main workers category when male and
female workers are combined, its size had in fact declined during 1991-2001. But
thereafter it increased between 2001 and 2011. In case of the marginal worker
category the number of workers (male and female combined) engaged in agriculture
labour has increased since 1991. The same pattern is observed for both the men and
women of main workers category. But, in the marginal workers category, the
number of agricultural labourers of male and females has increased since 1991. The
rate of growth in agriculture labourers is significantly higher among the marginal
workers category of males than the rate observed for male main workers category
during 2001-11 (see Table 7). In case of female agricultural labourers, it had shown
the other way round wherein the rate of growth in agriculture labourers of marginal
workers category is lower than the rate observed in the main workers category.
Table 8: Percentage Distribution of Workforce by Four-fold Occupation
– All India
Year
Total Main Marginal
Cult AL HHI Others Cult AL HHI Others Cult AL HHI Others Persons
1981 42.0 26.3 3.5 28.1 41.6 24.9 3.5 30.0 46.7 40.3 3.9 9.1 1991 39.7 27.4 2.4 30.5 38.7 26.1 2.4 32.8 49.6 40.4 2.7 7.3
2001 31.7 26.7 4.1 37.5 33.1 20.3 3.9 42.7 27.0 48.8 4.7 19.5 2011 24.6 30.0 3.8 41.6 26.4 23.8 3.4 46.4 19.2 48.8 5.0 27.1
Male 1981 43.7 19.8 3.2 33.3 43.7 19.6 3.2 33.6 41.5 33.6 2.9 22.1
1991 40.0 21.0 2.1 37.0 39.9 20.8 2.1 37.2 42.7 31.9 2.8 22.6 2001 31.3 20.8 3.0 44.8 32.6 17.1 3.1 47.2 23.2 45.5 2.3 29.1
2011 24.9 24.9 2.9 47.2 26.7 20.2 2.8 50.3 16.5 46.8 3.8 32.9
Female 1981 37.4 44.8 4.4 13.3 33.2 46.2 4.6 16.0 47.7 41.6 4.1 6.6
1991 39.0 43.4 3.3 14.3 34.6 44.2 3.5 17.7 50.3 41.3 2.6 5.7 2001 32.5 39.4 6.4 21.7 34.7 30.8 6.5 28.0 29.6 50.9 6.2 13.3
2011 24.0 41.1 5.7 29.2 25.6 34.6 5.4 34.5 21.7 50.6 6.2 21.4
Note: 1. Rural and urban combined; 2. Cult – Cultivators; A L – Agricultural Labourers; HHI – Household Industry; Others – it includes Industry Sector other than HHI, and those involved in the Services Sector.
Source: Census of India.

Final Draft
Growth and Structure of Workforce in India – Venkatanarayana and Suresh Naik Page 14
Labour force absorption in non-agriculture - increasing
It is observed that during the 2001-11, about 79 million is the net addition to the total
workforce. Of the total net addition to the workforce, during 2001-11, one–third of it
is absorbed in the agriculture and the rest in the non-agriculture. Thus, a large part
of the increasing labour force is getting absorbed in non-agriculture. Relatively
higher growth of workforce engaged in non-agriculture when compared with the
agriculture is observed during the last three decades (see Table 10). It indicates
increasing absorption of labourforce in non-agriculture sector for the last three
decades. The rate of growth in the total workforce engaged in non-agricultural
activities is distinctively high and different from that of agriculture, particularly
during 1991-2001 (see Table 10). Nevertheless, this high growth rate in non-
agriculture has decelerated, during the recent decade (2001-11), to around half-of the
rate that recorded in the previous decade (1991-2001). As a result the considerable
change in the structure of workforce towards non-agriculture observed in 1990s is
reduced in 2000s (see Table 9). This is in contrast to the growth of GDP in India in its
non-agriculture sector that had registered its highest ever during 2001-11.
Table 9: Percentage of Non-Agriculture in the Total Workforce – All India
Year
Total Main Marginal
Male Female Persons Male Female Persons Male Female Persons 1981 36.5 17.7 31.6 36.7 20.6 33.5 24.9 10.7 13.0
1991 39.1 17.6 32.9 39.3 21.2 35.2 25.4 8.4 10.0 2001 47.8 28.1 41.6 50.3 34.5 46.6 31.3 19.5 24.2
2011 50.1 34.9 45.4 53.0 39.8 49.8 36.7 27.6 32.1
Note: Rural and Urban Combined.
Source: Census of India
The grand theory of development says that the growth of industry will absorb the
surplus labour in agriculture to the extent that the wage differential between
agriculture and industry diminishes to zero (Lewis, 1954). Given a significant and
distinctively high growth of non-agriculture GDP in India, particularly during the
last decade, one would have a reason to expect a further high growth of workforce
too in the non-agriculture sector than the rate observed. The reality is in contrast to
Final Draft
Growth and Structure of Workforce in India – Venkatanarayana and Suresh Naik Page 15
the expectation. It indicates a glitch in the structural change of workforce. It could be
because of growing base of the capital-intensity in the non-agriculture sector
reducing rate of labourforce absorption. Given the low levels of education and skill
of workforce in India, there prevails a shortage in supply of skilled labourforce that
industry demands. The recent report of Mckinsey on education and employment
points out a conundrum – i.e. there are people who can’t find jobs and there are
employers who can’t find people with the necessary entry-level skills (see McKinsey,
2013). Therefore, the industry prefers the capital-intensive technology that replaces
the human labour requirement. The growth of otherwise labour-intensive industry
must be very low and decelerating, as it is observed in India. On the other hand, if
the labour-intensive agriculture had relieved the surplus labour (whose marginal
productivity of labour was zero) over time and it is reached a stage where it cannot
afford further migration of labour - out of agriculture to non-agriculture. The
emerging phenomenon of ‘labour shortage’ in agriculture and the growing
agricultural wages rate in the recent past might be the indications.
Growing Female workforce in Non-agriculture
Interestingly, the rate of growth among the female workers engaged in non-
agriculture is found to be higher than their male counterparts. It is so especially in
the case of female main workers in non-agriculture. So what does it indicates, is it
non-agriculture is becoming gender sensitive in female labor absorption? It might be
true otherwise, but, if one observes the pattern of workforce engaged in non-
agriculture sector, most of it is moving towards unorganized and informal sectors
particularly the labour-intensive businesses (Unni and Rani, 2008). Given the gender
based wage differentials prevailing (see Das, 2012) particularly in unorganised and
informal sectors of developing countries such as India, the availability of female
labour at cheaper wage rates might be the inducing factor for the preference of
women workers over men. It may raise the concern over the quality of the females’
employment in non-agriculture. Moreover, it is also evident from the Census data
that the growth of females in marginal workers category engaged in non-agriculture
is higher than that of the main workers. As a result the share of marginal workers in

Final Draft
Growth and Structure of Workforce in India – Venkatanarayana and Suresh Naik Page 16
the total female workforce engaged in non-agriculture is increasing over time. In
2011, around one-third of the total female workforce engaged in non-agriculture is in
the category of marginal workers.
Table 10: Growth of Workforce engaged in Agriculture and
Non-agriculture in India
Year
Agriculture Non-Agriculture
Male Female Persons Male Female Persons Main and Marginal 1981-91 1.7 3.5 2.3 2.9 3.4 2.9
1991-01 0.5 2.1 1.1 4.2 8.5 4.9 2001-11 1.4 0.7 1.1 2.4 3.9 2.7 Main 1981-91 1.8 3.6 2.3 2.9 3.9 3.1
1991-01 -1.2 -0.6 -1.1 3.3 6.3 3.8 2001-11 0.7 1.2 0.9 1.9 3.6 2.2 Marginal 1981-91 -2.7 3.5 2.8 -2.5 0.7 -0.1 1991-01 28.4 6.5 10.4 32.2 17.4 22.7
2001-11 4.2 0.0 1.7 6.7 4.6 5.8
Note: 1. Rural and Urban combined.
Source: Census of India. A relatively high growth of workforce in non-agriculture resulted in increase in the
share of non-agriculture in the total workforce. It increased from 31.6 per cent in
1981 to 41.6 percent in 2001 and further it increased to 45.4 percent in 2011 (see Table
9). The sharpest increase (9 percentage point), in the share of non-agriculture, that
coincides with high growth for workforce engaged in non-agriculture is observed
during 1991-2001. By the status of workers, a sharp increase in the share of non-
agriculture, during the last three decade, is observed for marginal workers and by
gender, such a sharp increase is observed for the female workers (Table 9). But the
interaction of status of worker and gender shows that such a sharp increase is
witnessed among the females of main workers category. For the female workers,
sharpest increase in the share of non-agriculture is registered during 1991-2001.
Particularly among the female workforce of marginal workers category that engaged

Final Draft
Growth and Structure of Workforce in India – Venkatanarayana and Suresh Naik Page 17
in non-agriculture, the sharpest increase in the share of agriculture is observed
during the last decade (2001-2011).
Increasing Marginal category in the Non-agricultural Workforce
It is also observed that the share of marginal workers in the total workforce engaged
in the non-agriculture is increasing since 1990s (see Table 11). It interesting to note
that the increase in the share of marginal workers is even observed for total male
workers engaged agriculture. Among the non-agriculture workers, increasing share
of marginal category is observed for both the male and females.
Table 11: Marginal as a % of Total Workers by Occupation in India
Year
Agriculture Non-agriculture
Cultivators A L Both HHI Others Both Persons
1981 10.0 13.8 11.5 10.0 2.9 3.7
1991 11.2 13.3 12.0 9.9 2.2 2.7
2001 19.1 41.0 29.1 25.6 11.7 13.1 2011 19.3 40.3 30.8 32.7 16.1 17.5
Males 1981 1.9 3.3 2.3 1.8 1.3 1.3 1991 1.3 1.8 1.5 1.6 0.7 0.8
2001 9.6 28.4 17.1 9.8 8.4 8.5 2011 11.7 33.2 22.5 22.9 12.3 12.9
Female 1981 37.2 27.1 31.7 26.8 14.5 17.6 1991 36.6 27.0 31.6 23.1 11.4 13.6
2001 39.0 55.4 48.0 42.0 26.2 29.8 2011 36.6 49.8 44.9 44.0 29.7 32.0
Note: 1. Rural and urban combined.
Source: Census of India. Diminishing rate of Absorption of Labourforce in HHI
Herein it is important to point out the growth of workforce in household industry. It
is an important source of livelihood for a considerable large proportion of workforce.
Around 6% of female workforce and 3% of male workforce, together 4% of total
workforce in India, in 2011, is engaged in household industry (see Table 8). The

Final Draft
Growth and Structure of Workforce in India – Venkatanarayana and Suresh Naik Page 18
analysis of Census data shows that growth of workforce in household industry is
fast decelerating during the last decade (2001-11). It has registered a rate of growth
1.1% per annum during 2001-11 (see Table 6). In fact, there was a decline in the
workforce engaged in household industry during 1981-91. Thereafter, during 1991-
2001, workforce in the HHI registered a significantly higher growth. But it could not
sustain such as growth and began decelerating during 2001-11.
Within the non-agriculture sector, the workforce engaged in household industry
accounts for 8.4% of the total workforce engaged in non-agriculture in 2011. Its share
has in fact declined from 11% in 1981 (see Table 12). Still, for the 6% of male and 16%
female workers (main and marginal combined) engaged in non-agriculture in 2011,
household industry is the source of employment. Among marginal workers engaged
in non-agriculture especially that of women, more than one-fifth is involved in HHI
in 2011. However, a sharp decline is registered for female workers (main and
marginal) wherein the share of HHI in their total workforce declined from 25% to
16.4% between 1981 and 2011. Particularly, among the female marginal workers, the
decline is even sharper, from 38% to 22.5%, during the same period.
Table 12: Household Industry (HHI) as % of Workforce in the Non-agriculture
Year
Main and Marginal Main Marginal
Male Female Persons Male Female Persons Male Female Persons 1981 8.7 25.1 11.1 8.7 22.3 10.4 11.6 38.1 30.0
1991 5.3 18.6 7.3 5.2 16.5 6.8 11.1 31.6 26.6 2001 6.3 22.7 9.8 6.2 18.7 8.4 7.2 31.9 19.2
2011 5.9 16.4 8.4 5.2 13.5 6.8 10.4 22.5 15.7
Note: 1. Rural and urban combined.
Source: Census of India.
In summary, the above analysis of changes in occupational distribution of workforce
shows that there is a sharp decline in the size of self-cultivators but a large part of
decline in this occupation replaced with sharp rise in the size of agriculture labour. It
indicates a sign of cultivators leaving farming activity and becoming the casual
labourers working in agriculture itself. With respect to workforce engaged in the

Final Draft
Growth and Structure of Workforce in India – Venkatanarayana and Suresh Naik Page 19
non-agriculture sector, it has registered relatively higher rate of growth over
agriculture. However, more than half of the workforce is still dependent on
agriculture. Moreover, rate of growth in workforce engaged in non-agriculture is
found to be fast decelerating, particularly during 2001-11. Again, increasing share of
marginal workers category in the total workforce engaged in non-agriculture and
relatively high growth among such marginal workers is a cause of concern. As
regards the household industry there is a diminishing rate of absorption of
workforce in this occupation.
IV Gender Distribution
In fact, we have flagged enough points with respect to females in above analysis.
Still there is space for discussion of gender implications out of recent changes in
growth and changing structure of workforce in India.
Although females share a half of the total population, only one-quarter of the main
status workers are female but little more than half of the marginal status workers are
females. Female’s share in the population has shown a marginal increase since 1991
continued the increase till 2011. Females’ representation in the main workers has
increased during 2001-11, but their representation has declined among the marginal
workers (see Table 13). Their share in the in the total workforce increased between
1981 and 2001 and thereafter it has shown a marginal decline. But their share in main
workers increased throughout during the last three decades - between 1981 and
2011. The decline in their share in total workforce is entirely to due to decline of their
share in the marginal workers which has shown a fast decline since 1991.
In the traditional occupations such as agriculture (incl. self-cultivation and labour)
and household industry, female’s representation is declining (see Table 13). Among
the three occupations: cultivators, agricultural labourers and HHI, the female’s share
had increased between 1981 and 2001 thereafter it declined between 2001 and 2011.
In the in modern occupation their representation is getting increased. In the
workforce engaged in ‘others’ occupation, which include non-household industry

Final Draft
Growth and Structure of Workforce in India – Venkatanarayana and Suresh Naik Page 20
and services, the share of female has increased between 1981 and 2011. However,
little over one-fifth of the total workforce and little less than one-fifth of main
workers engaged in the industry and services sectors, is found to be females. But,
their representation accounts for around two-fifths of marginal workers engaged in
this occupation.
Table 13: Percentage of Female in the Total Population and Workforce in India
Details 1981 1991 2001 2011 Population 48.3 48.1 48.3 48.5 Total Workers 26.0 28.6 31.6 31.1
Main Workers 20.2 22.5 23.2 24.6 Marginal Workers 84.0 90.4 60.3 50.8 Main and Marginal Cultivators 23.1 28.1 32.4 30.3 Agricultural Labour 44.2 45.3 46.6 42.7
HHI 32.9 38.7 49.3 46.7 Others 12.3 13.4 18.3 21.8 Agriculture 31.3 35.1 38.9 37.1 Non-agriculture 14.5 15.2 21.3 23.9 Main Workers Cultivators 16.1 20.1 24.4 23.8 Agricultural Labour 37.4 38.1 35.2 35.9
HHI 26.8 33.1 38.5 38.9 Others 10.8 12.1 15.2 18.3 Agriculture 24.1 27.3 28.5 29.5 Non-agriculture 12.4 13.5 17.2 19.7 Marginal Workers Cultivators 85.8 91.7 65.9 57.6 Agricultural Labour 86.7 92.4 63.0 52.7
HHI 88.1 89.9 80.7 62.8
Others 61.1 70.5 41.0 40.2 Agriculture 86.2 92.0 64.0 54.1 Non-agriculture 69.2 75.7 48.6 43.7
Note: 1. Rural and urban combined.
Source: Census of India. On the whole, female’s representation in main workers has increased over time and
the concentration of females in the total marginal workers is getting reduced

Final Draft
Growth and Structure of Workforce in India – Venkatanarayana and Suresh Naik Page 21
especially since 1991. Their representation in workforce engaged in the agriculture
occupation has declined during 2001-11 and a corresponding increase in the non-
agriculture occupation. To sum up, although there is a continuing tendency of under
representation of women in the workforce, their share is increasing over time,
though at a marginal rate. The increasing representation of women in the workforce
particularly that of the workforce engaged in non-agriculture.
V Concluding Observations
The above analysis of Census data brings new dimension to ongoing debate on the
decline in the growth of employment from the last two decade. The census 2011
result gives better picture when compared with NSSO estimation of work force
participation and change in the pattern of work force. The paper has found that there
is fast decelerating rate of growth in workforce particularly that of females, between
2001 and 2011. But the work participation rate has not declined, if not increased.
Secondly, incremental workforce especially the male is getting reduced to marginal
status workers whereas the incremental female workers are gradually getting
leveled up to main status workers. Still, one third of the female workforce is working
as a marginal worker.
Occupational distribution of workforce shows that labour absorption in self-
cultivation is saturated and declining. But the increase in the size of agricultural
labourers is more than the size decline in cultivators indicating farmers those who
are leaving farming activity and those who enter newly in to agriculture are
becoming agricultural labourers. The decelerating but a high rate of growth in
workforce engaged non-agriculture compared to that of agriculture could not bring
any drastic change in the structure of workforce – a small change in workforce
shifting towards non-agriculture. This is contrast with the highest ever growth of
non-agricultural GDP of India that is registered during the last decade. Within the
non-agriculture, growth of workforce engaged in household industry is decelerating.
Moreover, the rate of growth in marginal workers engaged in non-agricultural

Final Draft
Growth and Structure of Workforce in India – Venkatanarayana and Suresh Naik Page 22
activities is found to be higher than those of main workers increasing share of
marginal workers in the total workforce of non-agriculture sectors is a cause of
concern. Moreover, relatively high growth of female workforce engaged in non-
agriculture appears to be a welcome feature but one needs to be prudent in
interpreting it so, especially in the context of increasing informalisation of labour
market.
* * * Reference
Chaudhari, Subhanil (2011) “Employment in India: What does the Latest Data Show?”, Economic and Political Weekly, August 6.
Das, Panchanan (2012) “Wage Inequality in India: Decomposition by Sector, Gender and Activity Status”, Economic and Political Weekly, Vol. XLVII, No. 50.
EPW (2011) “Don’t Shoot the Messenger”, Economic and Political Weekly, July 9, (Editorial).
Government of India (2011) “Second Annual Report on People on Employment“, Ministry of Labour and Employment, Government of India, New Delhi.
Kannan, K. P. and G. Ravindran (2012) “Counting and Profiling of the Missing Labour Force”, Economic and Political Weekly, Vol. XLVII, No. 6. February 11.
Lewis, W. Arthur (1954) “Economic Development with Unlimited Supplies of Labour”, Manchester School, Vol. ().
McKinsey (2013) Education to Employment: Designing a System that Works, Authored by Mona Mourshed; Diana Farrel; and Dominic Barton, McKinsey Centre for Government, McKinsey&Company; Accessed at http://www.mckinsey.com/ client_service/public_sector/mckinsey_center_for_government/education_to_employment.
Mellor, John W (1976) The New Economics of Growth: A Strategy for India and the Developing World, Cornell University Press, Ithaca.
Papola, T. S. (2012) “Employment Growth in the Post-Reform Period”, Keynote Paper on the Theme “Employment in the Post-Reform India”, 54th Annual Conference, The Indian Society of Labour Economics, Banaras Hindu University, Varanasi.
Planning Commision (2011), Faster, Sustainable and More Inclusive Growth: An Appraoch to the 12th Five Year Plan, Planning Commission, Government of India, New Delhi.
Rangarajan, C; Padma Iyer and Seema Kaul (2011) “Where is the Missing Labour Force”, Economic and Political Weekly, September 24-30.

Final Draft
Growth and Structure of Workforce in India – Venkatanarayana and Suresh Naik Page 23
Sainath, P (2013) “Over 2000 Fewer Farmers Every Day“, The Hindu, Op. Ed., May 2 (Thursday), 2013.
Unni, Jeemol and Uma Rani (2008) Flexibility of Labour in Globalising India: The Challenge of Skills and Technology, Tulika Books, New Delhi.
Vaidyanathan, A. (1986) “Labour Use in Rural India: A Study of Spatial and Temporal Variations”, Economic and Political Weekly, Vol. XXI No. 52.
Appendix
Table A1: Size of Main and Marginal Workers (in Millions) in India
Year Main Workers Marginal Workers
Male Female Persons Male Female Persons 1981 177.5 45.0 222.5 3.5 18.6 22.1 1991 221.7 64.3 285.9 2.7 25.5 28.2 2001 239.6 72.6 312.2 35.8 54.5 90.3 2011 273.1 89.3 362.4 58.7 60.6 119.3
Note: 1. Rural and urban combined.
Source: Census of India.
Table A2: Workforce by Occupation – All India (in Millions)
Year Main & Marginal Main Marginal
Cultiv A L HHI Others Cultiv A L HHI Others Cultiv A L HHI Others Persons 1981 102.8 64.4 8.6 68.8 92.5 55.5 7.7 66.8 10.3 8.9 0.9 2.0 1991 124.7 86.0 7.6 95.9 110.7 74.6 6.8 93.8 14.0 11.4 0.8 2.1 2001 127.6 107.4 16.4 151.0 103.2 63.4 12.2 133.4 24.4 44.0 4.2 17.7 2011 118.7 144.3 18.3 200.4 95.8 86.2 12.3 168.1 22.9 58.2 6.0 32.3 Males 1981 79.1 35.9 5.7 60.4 77.6 34.7 5.6 59.6 1.5 1.2 0.1 0.8 1991 89.6 47.0 4.6 83.1 88.5 46.2 4.6 82.5 1.2 0.9 0.1 0.6 2001 86.3 57.4 8.3 123.5 78.0 41.1 7.5 113.1 8.3 16.3 0.8 10.4 2011 82.7 82.7 9.8 156.6 73.0 55.3 7.5 137.3 9.7 27.5 2.2 19.3 Females 1981 23.8 28.5 2.8 8.4 14.9 20.8 2.1 7.2 8.8 7.7 0.8 1.2 1991 35.0 39.0 2.9 12.8 22.2 28.4 2.2 11.4 12.8 10.5 0.7 1.5 2001 41.3 50.1 8.1 27.6 25.2 22.3 4.7 20.3 16.1 27.8 3.4 7.2 2011 36.0 61.6 8.6 43.7 22.8 30.9 4.8 30.8 13.2 30.7 3.8 13.0
Note: 1. Rural and urban combined; 2. Cultiv – Cultivators; A L – Agricultural Labourers; HHI – Household Industry; Others – it includes Industry Sector other than HHI, and those involved in the Services Sector.
Source: Census of India.

Final Draft
Growth and Structure of Workforce in India – Venkatanarayana and Suresh Naik Page 24
Table A3: Workforce engaged in Agriculture and Non-agriculture – All India (in Millions)
Year
Total Main Marginal % of Agriculture
Agri Non-Agri Agri Non-Agri Agri Non-Agri TW Main Marginal Persons 1981 167.2 77.4 148.0 74.5 19.2 2.9 68.4 66.5 87.0
1991 210.7 103.5 185.3 100.6 25.4 2.8 67.1 64.8 90.0 2001 235.1 167.4 166.6 145.6 68.5 21.9 58.4 53.4 75.8
2011 263.0 218.7 182.0 180.4 81.0 38.3 54.6 50.2 67.9 Male 1981 115.0 66.1 112.3 65.2 2.7 0.9 63.5 63.3 75.1
1991 136.7 87.7 134.6 87.0 2.0 0.7 60.9 60.7 74.6 2001 143.7 131.8 119.1 120.6 24.6 11.2 52.2 49.7 68.7
2011 165.4 166.4 128.3 144.9 37.2 21.5 49.9 47.0 63.3 Female 1981 52.3 11.3 35.7 9.3 16.6 2.0 82.3 79.4 89.3
1991 74.0 15.8 50.7 13.6 23.4 2.1 82.4 78.8 91.6 2001 91.4 35.7 47.5 25.0 43.9 10.6 71.9 65.5 80.5
2011 97.6 52.3 53.7 35.6 43.8 16.7 65.1 60.2 72.4
Note: 1. Rural and Urban combined.
Source: Census of India.