Growth and Inclusion: Theoretical and Applied Perspectivesicrier.org/pdf/Surjit S...
46
THE WORLD BANK WORKSHOP Growth and Inclusion: Theoretical and Applied Perspectives Section III Part 2 January 13, 2012 The Claridges Hotel 12 Aurangzeb Road New Delhi, India 2 + 2 = 3: The Orwellian Record of Inclusive Growth in India Surjit Bhalla Oxus Investments
Transcript of Growth and Inclusion: Theoretical and Applied Perspectivesicrier.org/pdf/Surjit S...
THE WORLD BANK
WORKSHOP
Growth and Inclusion:
Theoretical and Applied Perspectives
Section III Part 2
January 13, 2012
The Claridges Hotel
12 Aurangzeb Road
New Delhi, India
2 + 2 = 3: The Orwellian
Record of Inclusive Growth in India
Surjit Bhalla
Oxus Investments

2 + 2 = 3: The Orwellian Record of Inclusive Growth in India
Surjit S Bhalla with Manoj Agrawal Oxus Investments
Presented at “Growth and Inclusion: Theoretical and Applied Perspectives
Workshop” organized by World Bank.
New Delhi, 13th Jan, 2012
Popular perception of Inclusive Growth in India
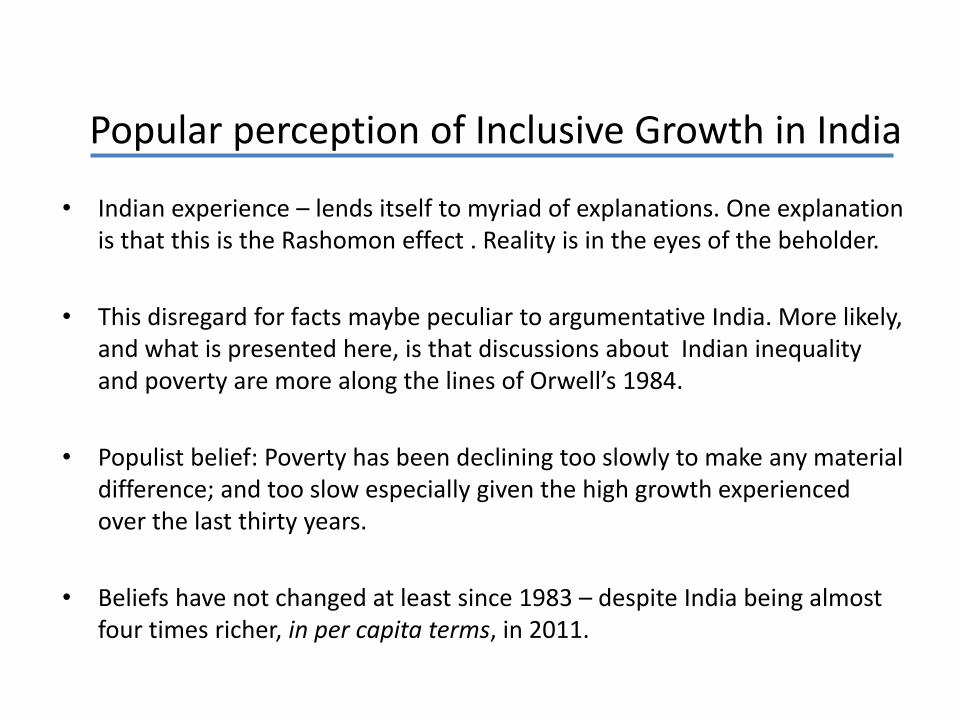
• Indian experience – lends itself to myriad of explanations. One explanation is that this is the Rashomon effect . Reality is in the eyes of the beholder.
• This disregard for facts maybe peculiar to argumentative India. More likely, and what is presented here, is that discussions about Indian inequality and poverty are more along the lines of Orwell’s 1984.
• Populist belief: Poverty has been declining too slowly to make any material difference; and too slow especially given the high growth experienced over the last thirty years.
• Beliefs have not changed at least since 1983 – despite India being almost four times richer, in per capita terms, in 2011.
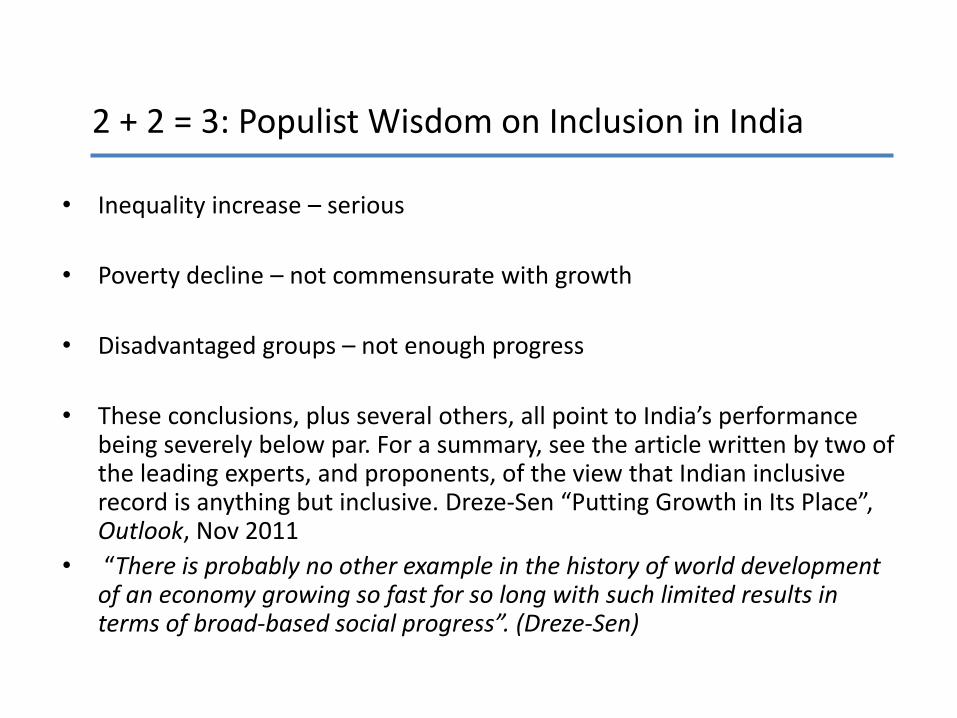
2 + 2 = 3: Populist Wisdom on Inclusion in India
• Inequality increase – serious
• Poverty decline – not commensurate with growth
• Disadvantaged groups – not enough progress
• These conclusions, plus several others, all point to India’s performance being severely below par. For a summary, see the article written by two of the leading experts, and proponents, of the view that Indian inclusive record is anything but inclusive. Dreze-Sen “Putting Growth in Its Place”, Outlook, Nov 2011
• “There is probably no other example in the history of world development of an economy growing so fast for so long with such limited results in terms of broad-based social progress”. (Dreze-Sen)
Some issues for debate, discussion and reality checks
• Poverty Decline
• Inclusion via Education
• Wage & Consumption Growth Story
• Reality of Inequality
• 2+2 = 3 in Action- OECD Inequality, Global Hunger Index, UN MPI
• The Truth of Decline in Calorie Consumption
• Public Schemes: Fixes and Corruption
Poverty Decline

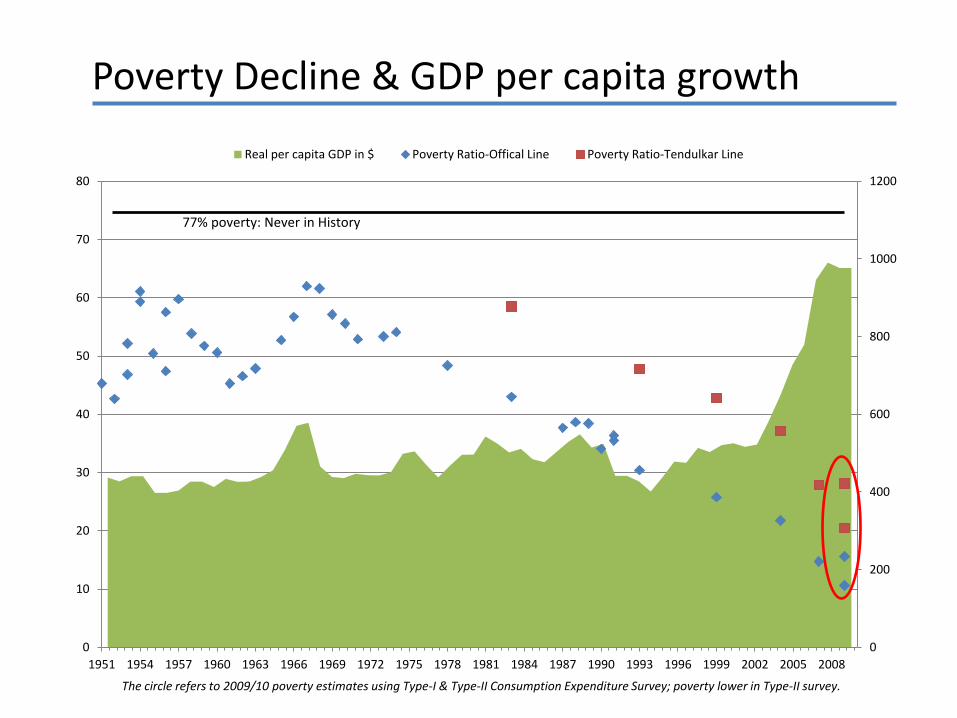
Reality Check 1: MDG goals for poverty decline have been met
• Poverty decline has met the MDG goals for 2015 at least six years earlier
• For old poverty line, poverty ratio 30.4 in 1993/94 and 15.6 in 2009/10
• For new, 20 % higher Tendulkar poverty line, poverty ratio 47.8 in 1993/94 and 28.1 in 2009/10
• Not much discussed (why not?) is a parallel 2009/10 NSS survey – same number of households, same sampling frame, except different households covered – and food asked on a 7 day recall basis for many items rather than the traditional 30 day recall basis. The result – poverty a full 8 percentage points lower according to the Tendulkar poverty line.
0
200
400
600
800
1000
1200
0
10
20
30
40
50
60
70
80
1951 1954 1957 1960 1963 1966 1969 1972 1975 1978 1981 1984 1987 1990 1993 1996 1999 2002 2005 2008
Real per capita GDP in $ Poverty Ratio-Offical Line Poverty Ratio-Tendulkar Line
77% poverty: Never in History
Poverty Decline & GDP per capita growth
The circle refers to 2009/10 poverty estimates using Type-I & Type-II Consumption Expenditure Survey; poverty lower in Type-II survey.
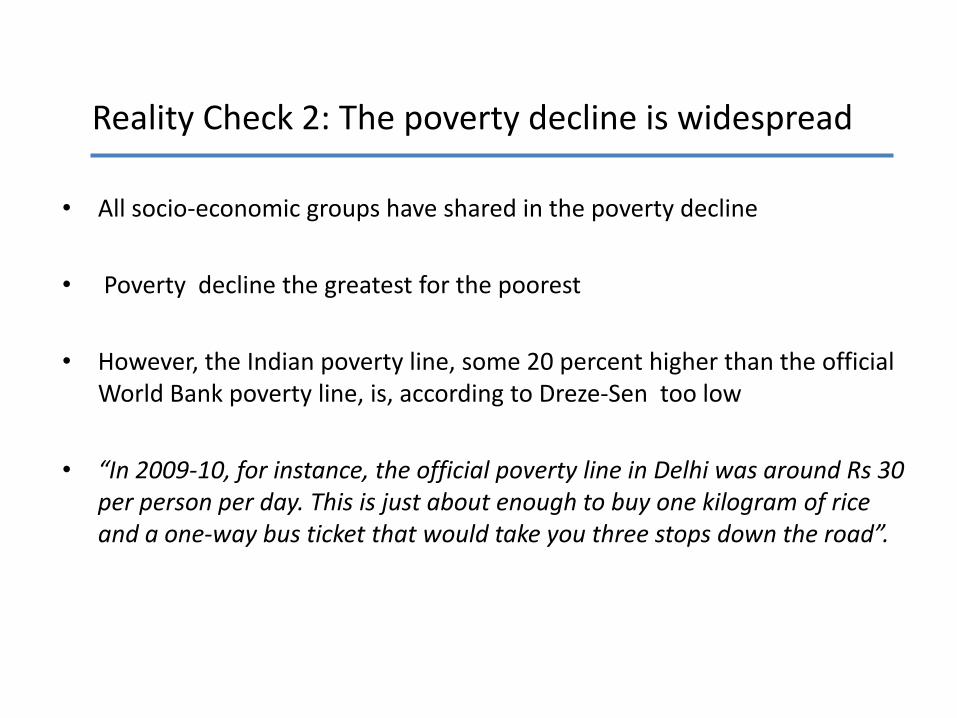
Reality Check 2: The poverty decline is widespread
• All socio-economic groups have shared in the poverty decline
• Poverty decline the greatest for the poorest
• However, the Indian poverty line, some 20 percent higher than the official World Bank poverty line, is, according to Dreze-Sen too low
• “In 2009-10, for instance, the official poverty line in Delhi was around Rs 30 per person per day. This is just about enough to buy one kilogram of rice and a one-way bus ticket that would take you three stops down the road”.
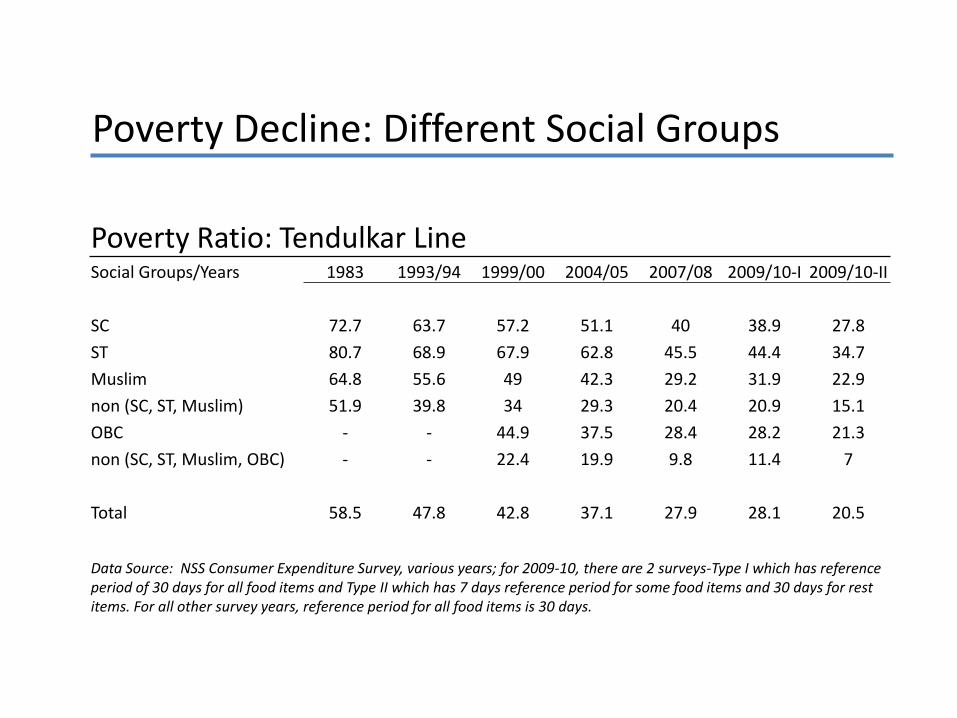
Poverty Ratio: Tendulkar Line Social Groups/Years 1983 1993/94 1999/00 2004/05 2007/08 2009/10-I 2009/10-II
SC 72.7 63.7 57.2 51.1 40 38.9 27.8
ST 80.7 68.9 67.9 62.8 45.5 44.4 34.7
Muslim 64.8 55.6 49 42.3 29.2 31.9 22.9
non (SC, ST, Muslim) 51.9 39.8 34 29.3 20.4 20.9 15.1
OBC - - 44.9 37.5 28.4 28.2 21.3
non (SC, ST, Muslim, OBC) - - 22.4 19.9 9.8 11.4 7
Total 58.5 47.8 42.8 37.1 27.9 28.1 20.5
Data Source: NSS Consumer Expenditure Survey, various years; for 2009-10, there are 2 surveys-Type I which has reference period of 30 days for all food items and Type II which has 7 days reference period for some food items and 30 days for rest items. For all other survey years, reference period for all food items is 30 days.
Poverty Decline: Different Social Groups
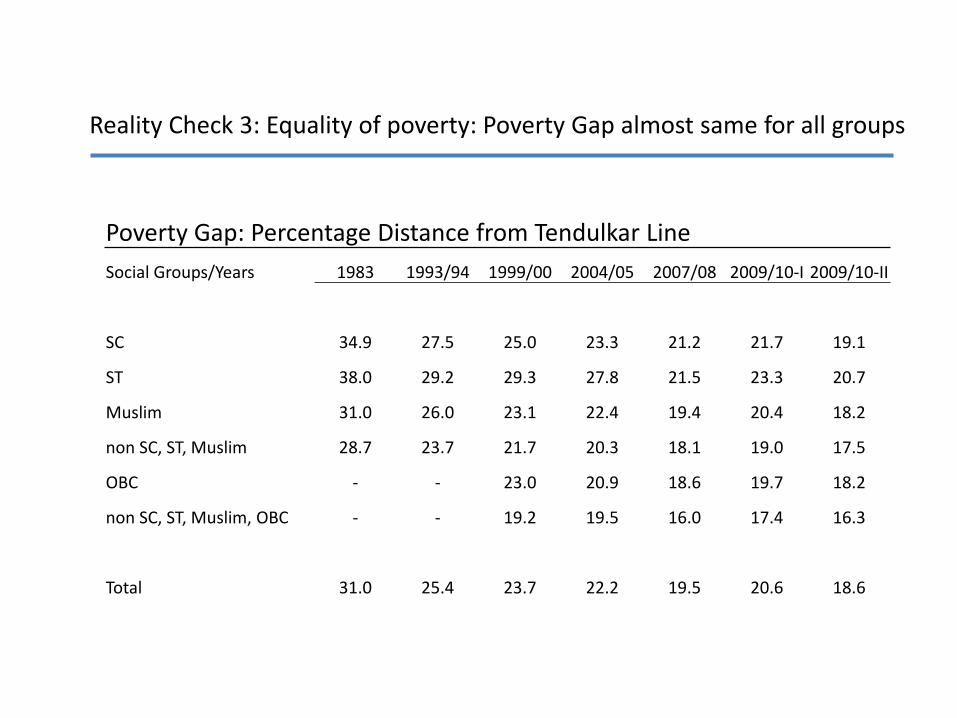
Poverty Gap: Percentage Distance from Tendulkar Line
Social Groups/Years 1983 1993/94 1999/00 2004/05 2007/08 2009/10-I 2009/10-II
SC 34.9 27.5 25.0 23.3 21.2 21.7 19.1
ST 38.0 29.2 29.3 27.8 21.5 23.3 20.7
Muslim 31.0 26.0 23.1 22.4 19.4 20.4 18.2
non SC, ST, Muslim 28.7 23.7 21.7 20.3 18.1 19.0 17.5
OBC - - 23.0 20.9 18.6 19.7 18.2
non SC, ST, Muslim, OBC - - 19.2 19.5 16.0 17.4 16.3
Total 31.0 25.4 23.7 22.2 19.5 20.6 18.6
Reality Check 3: Equality of poverty: Poverty Gap almost same for all groups
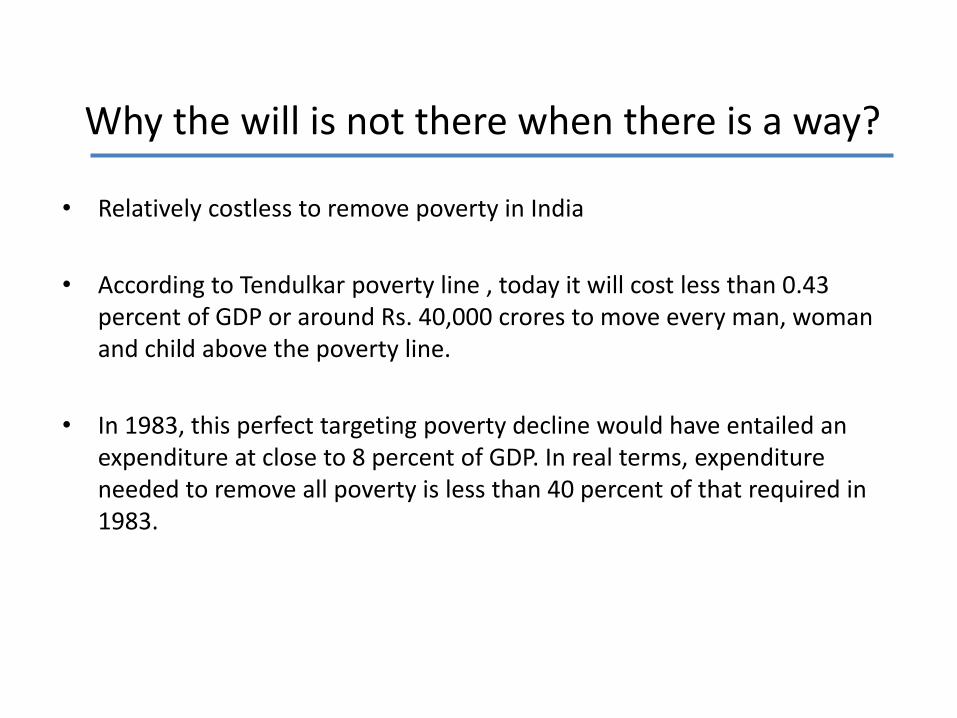
Why the will is not there when there is a way?
• Relatively costless to remove poverty in India
• According to Tendulkar poverty line , today it will cost less than 0.43 percent of GDP or around Rs. 40,000 crores to move every man, woman and child above the poverty line.
• In 1983, this perfect targeting poverty decline would have entailed an expenditure at close to 8 percent of GDP. In real terms, expenditure needed to remove all poverty is less than 40 percent of that required in 1983.
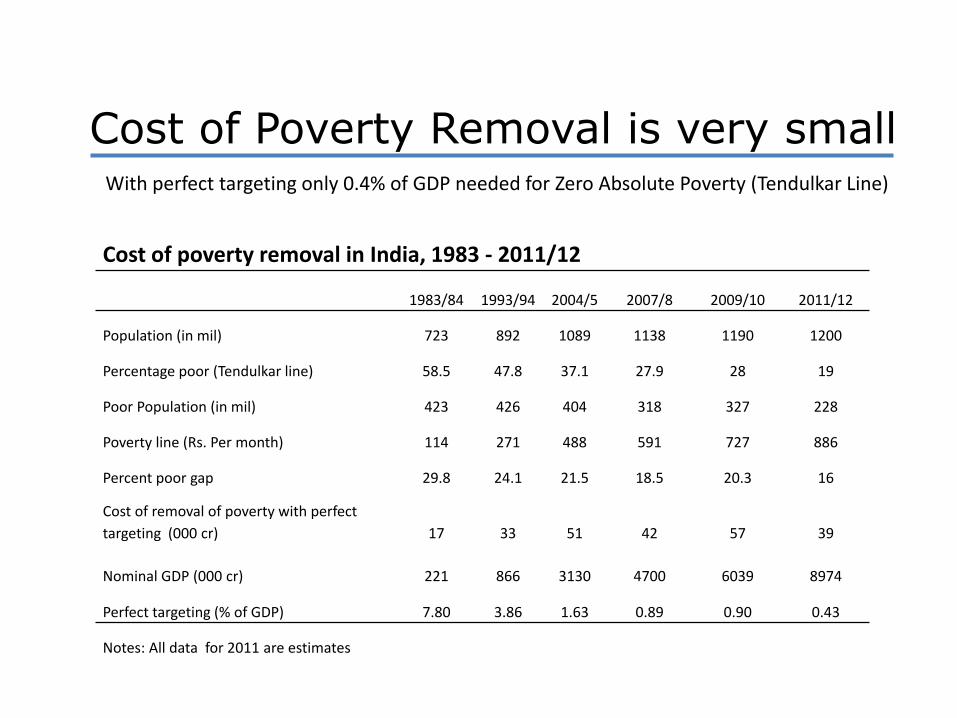
Cost of poverty removal in India, 1983 - 2011/12
1983/84 1993/94 2004/5 2007/8 2009/10 2011/12
Population (in mil) 723 892 1089 1138 1190 1200
Percentage poor (Tendulkar line) 58.5 47.8 37.1 27.9 28 19
Poor Population (in mil) 423 426 404 318 327 228
Poverty line (Rs. Per month) 114 271 488 591 727 886
Percent poor gap 29.8 24.1 21.5 18.5 20.3 16
Cost of removal of poverty with perfect
targeting (000 cr) 17 33 51 42 57 39
Nominal GDP (000 cr) 221 866 3130 4700 6039 8974
Perfect targeting (% of GDP) 7.80 3.86 1.63 0.89 0.90 0.43
Notes: All data for 2011 are estimates
With perfect targeting only 0.4% of GDP needed for Zero Absolute Poverty (Tendulkar Line)
Cost of Poverty Removal is very small

Inclusion via Education
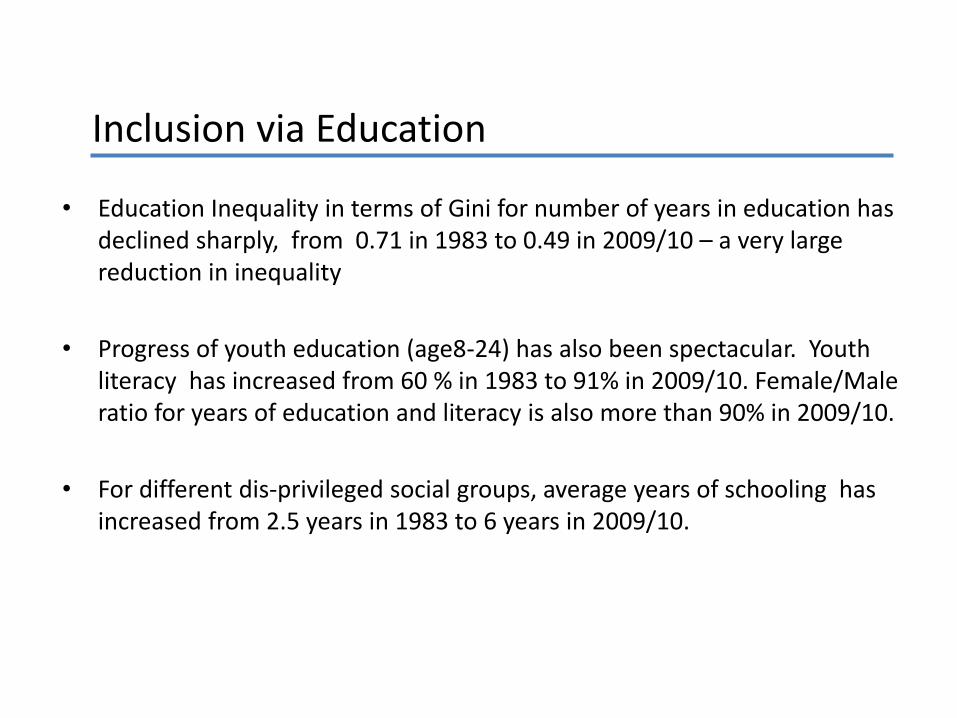
Inclusion via Education
• Education Inequality in terms of Gini for number of years in education has declined sharply, from 0.71 in 1983 to 0.49 in 2009/10 – a very large reduction in inequality
• Progress of youth education (age8-24) has also been spectacular. Youth literacy has increased from 60 % in 1983 to 91% in 2009/10. Female/Male ratio for years of education and literacy is also more than 90% in 2009/10.
• For different dis-privileged social groups, average years of schooling has increased from 2.5 years in 1983 to 6 years in 2009/10.
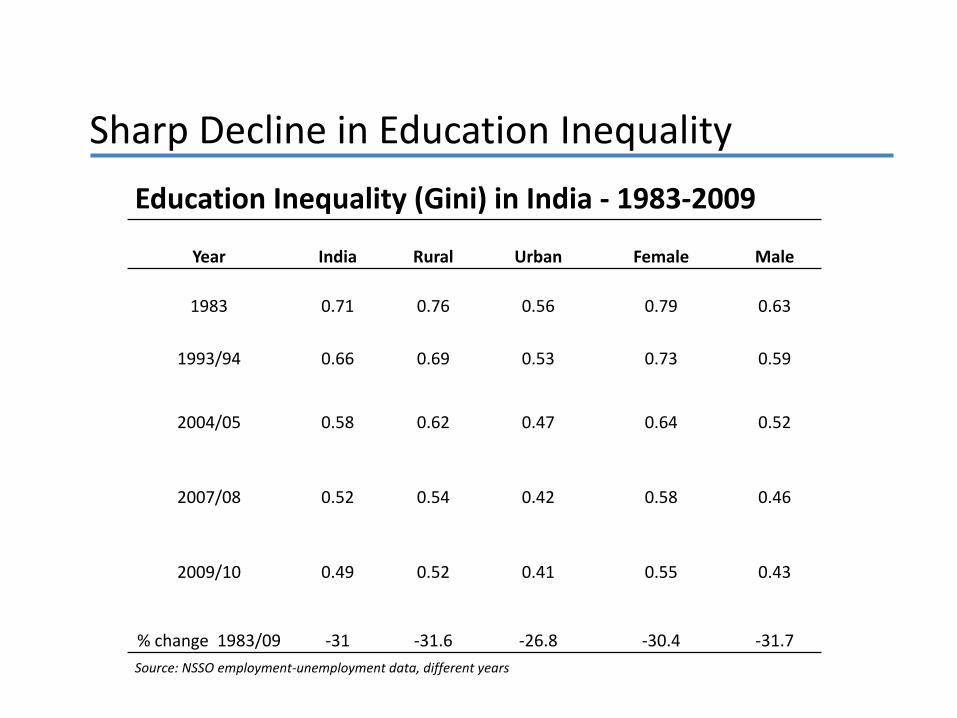
Education Inequality (Gini) in India - 1983-2009
Year India Rural Urban Female Male
1983 0.71 0.76 0.56 0.79 0.63
1993/94 0.66 0.69 0.53 0.73 0.59
2004/05 0.58 0.62 0.47 0.64 0.52
2007/08 0.52 0.54 0.42 0.58 0.46
2009/10 0.49 0.52 0.41 0.55 0.43
% change 1983/09 -31 -31.6 -26.8 -30.4 -31.7
Source: NSSO employment-unemployment data, different years
Sharp Decline in Education Inequality
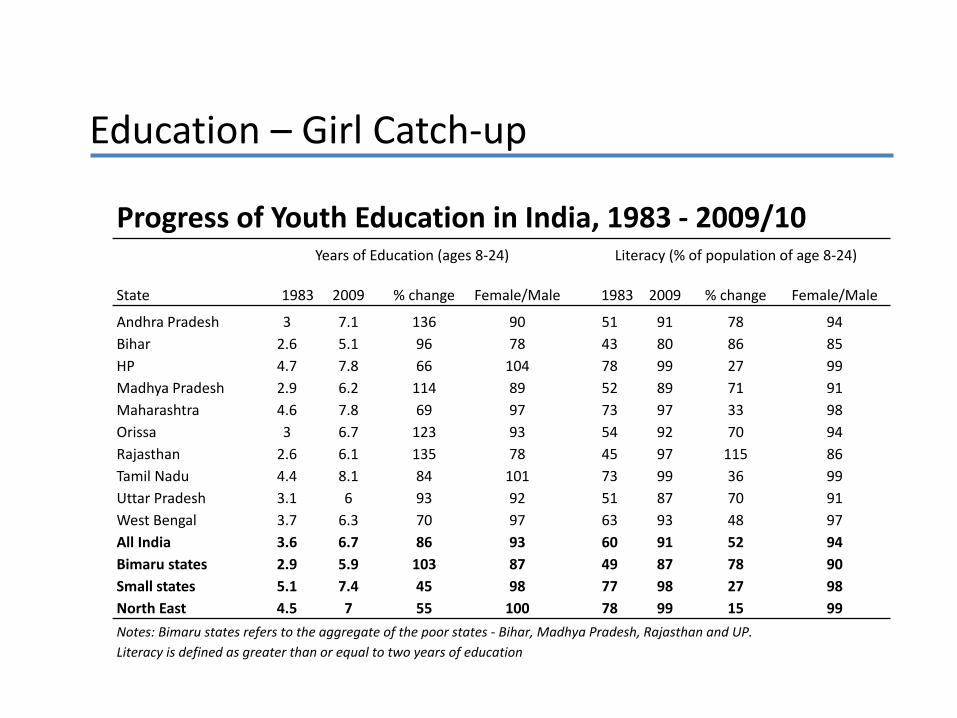
Progress of Youth Education in India, 1983 - 2009/10 Years of Education (ages 8-24) Literacy (% of population of age 8-24)
State 1983 2009 % change Female/Male 1983 2009 % change Female/Male
Andhra Pradesh 3 7.1 136 90 51 91 78 94
Bihar 2.6 5.1 96 78 43 80 86 85
HP 4.7 7.8 66 104 78 99 27 99
Madhya Pradesh 2.9 6.2 114 89 52 89 71 91
Maharashtra 4.6 7.8 69 97 73 97 33 98
Orissa 3 6.7 123 93 54 92 70 94
Rajasthan 2.6 6.1 135 78 45 97 115 86
Tamil Nadu 4.4 8.1 84 101 73 99 36 99
Uttar Pradesh 3.1 6 93 92 51 87 70 91
West Bengal 3.7 6.3 70 97 63 93 48 97
All India 3.6 6.7 86 93 60 91 52 94
Bimaru states 2.9 5.9 103 87 49 87 78 90
Small states 5.1 7.4 45 98 77 98 27 98
North East 4.5 7 55 100 78 99 15 99
Notes: Bimaru states refers to the aggregate of the poor states - Bihar, Madhya Pradesh, Rajasthan and UP.
Literacy is defined as greater than or equal to two years of education
Education – Girl Catch-up
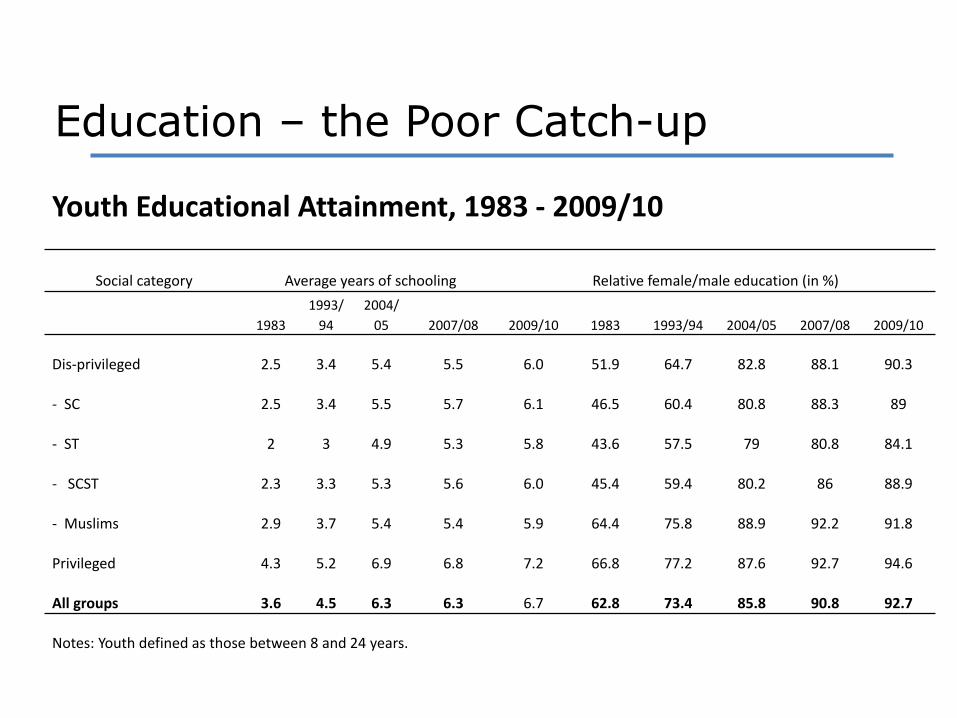
Youth Educational Attainment, 1983 - 2009/10
Social category Average years of schooling Relative female/male education (in %)
1983
1993/
94
2004/
05 2007/08 2009/10 1983 1993/94 2004/05 2007/08 2009/10
Dis-privileged 2.5 3.4 5.4 5.5 6.0 51.9 64.7 82.8 88.1 90.3
- SC 2.5 3.4 5.5 5.7 6.1 46.5 60.4 80.8 88.3 89
- ST 2 3 4.9 5.3 5.8 43.6 57.5 79 80.8 84.1
- SCST 2.3 3.3 5.3 5.6 6.0 45.4 59.4 80.2 86 88.9
- Muslims 2.9 3.7 5.4 5.4 5.9 64.4 75.8 88.9 92.2 91.8
Privileged 4.3 5.2 6.9 6.8 7.2 66.8 77.2 87.6 92.7 94.6
All groups 3.6 4.5 6.3 6.3 6.7 62.8 73.4 85.8 90.8 92.7
Notes: Youth defined as those between 8 and 24 years.
Education – the Poor Catch-up
Wage & Consumption Growth Story
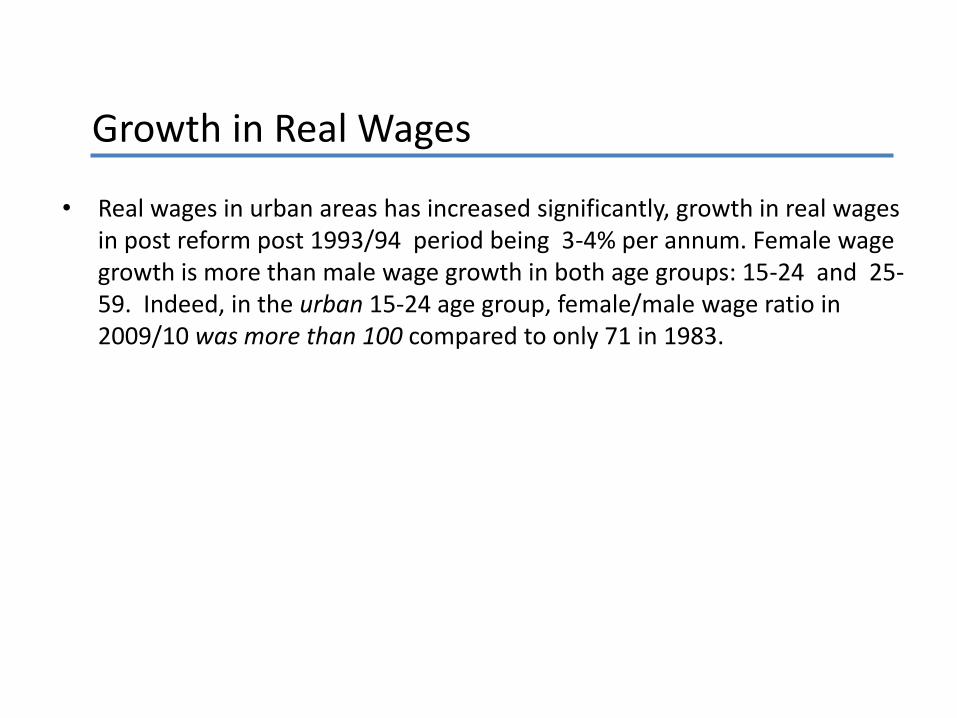
Growth in Real Wages
• Real wages in urban areas has increased significantly, growth in real wages in post reform post 1993/94 period being 3-4% per annum. Female wage growth is more than male wage growth in both age groups: 15-24 and 25-59. Indeed, in the urban 15-24 age group, female/male wage ratio in 2009/10 was more than 100 compared to only 71 in 1983.
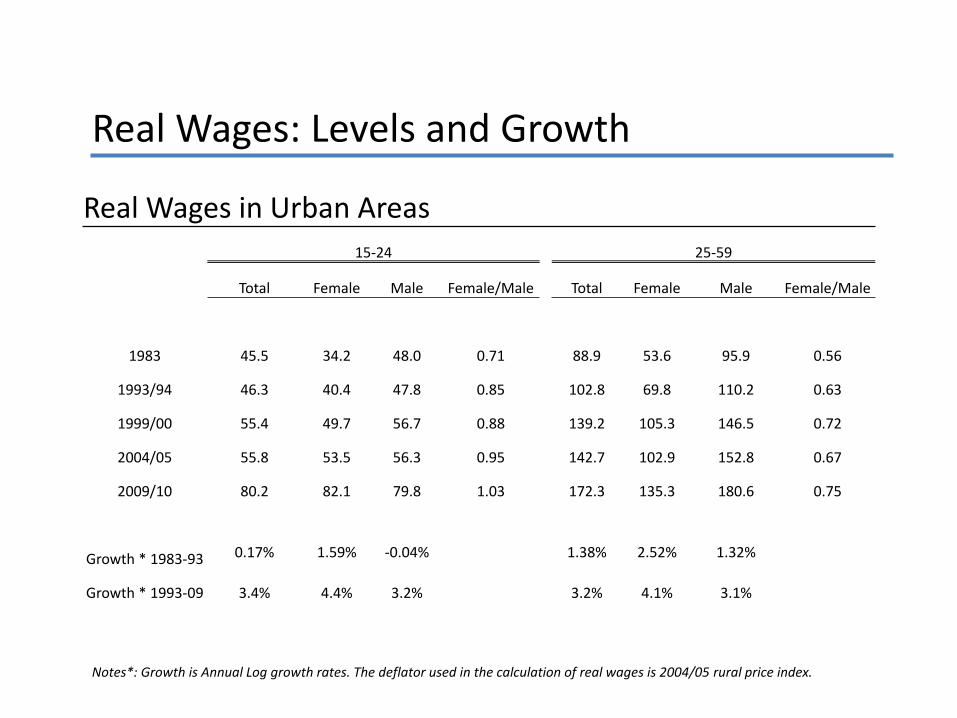
Notes*: Growth is Annual Log growth rates. The deflator used in the calculation of real wages is 2004/05 rural price index.
Real Wages in Urban Areas 15-24 25-59
Total Female Male Female/Male Total Female Male Female/Male
1983 45.5 34.2 48.0 0.71 88.9 53.6 95.9 0.56
1993/94 46.3 40.4 47.8 0.85 102.8 69.8 110.2 0.63
1999/00 55.4 49.7 56.7 0.88 139.2 105.3 146.5 0.72
2004/05 55.8 53.5 56.3 0.95 142.7 102.9 152.8 0.67
2009/10 80.2 82.1 79.8 1.03 172.3 135.3 180.6 0.75
Growth * 1983-93 0.17% 1.59% -0.04% 1.38% 2.52% 1.32%
Growth * 1993-09 3.4% 4.4% 3.2% 3.2% 4.1% 3.1%
Real Wages: Levels and Growth
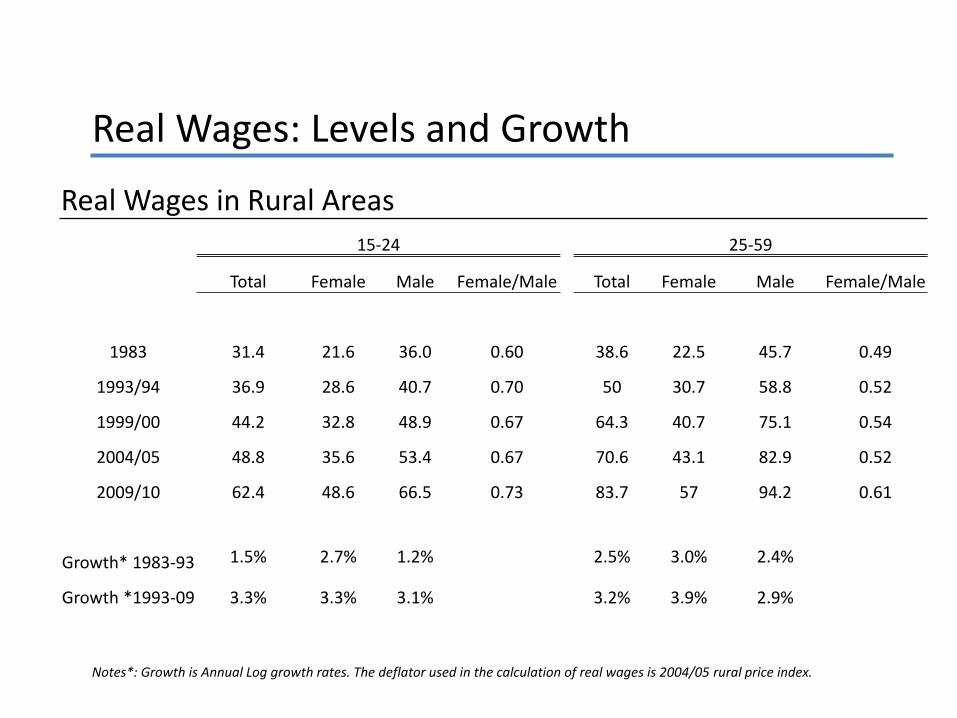
Real Wages in Rural Areas
15-24 25-59
Total Female Male Female/Male Total Female Male Female/Male
1983 31.4 21.6 36.0 0.60 38.6 22.5 45.7 0.49
1993/94 36.9 28.6 40.7 0.70 50 30.7 58.8 0.52
1999/00 44.2 32.8 48.9 0.67 64.3 40.7 75.1 0.54
2004/05 48.8 35.6 53.4 0.67 70.6 43.1 82.9 0.52
2009/10 62.4 48.6 66.5 0.73 83.7 57 94.2 0.61
Growth* 1983-93 1.5% 2.7% 1.2% 2.5% 3.0% 2.4%
Growth *1993-09 3.3% 3.3% 3.1% 3.2% 3.9% 2.9%
Notes*: Growth is Annual Log growth rates. The deflator used in the calculation of real wages is 2004/05 rural price index.
Real Wages: Levels and Growth
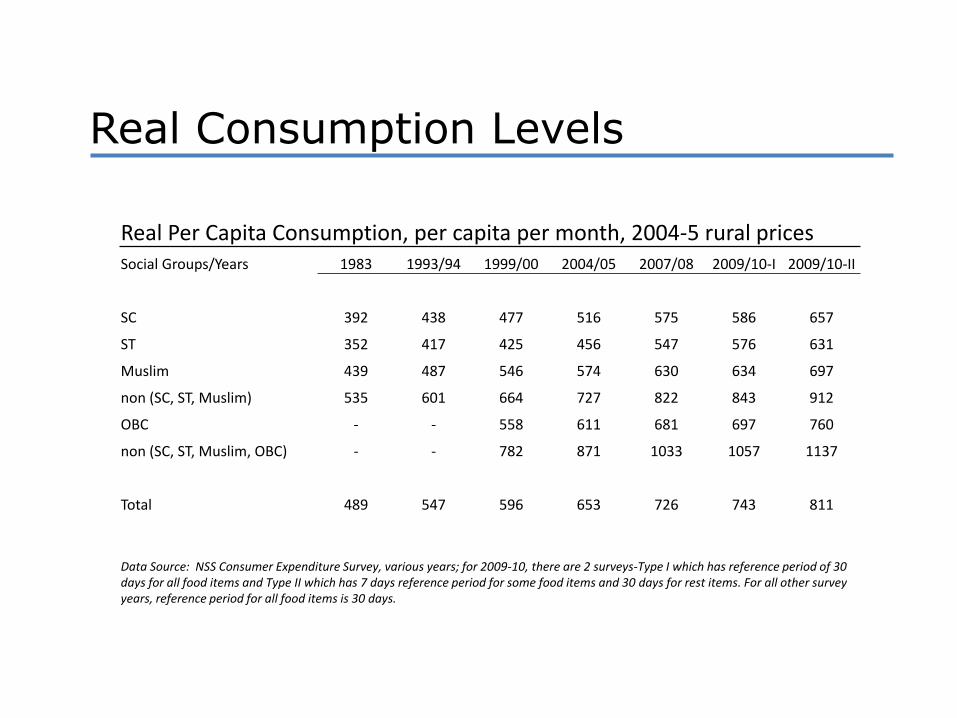
Real Per Capita Consumption, per capita per month, 2004-5 rural prices Social Groups/Years 1983 1993/94 1999/00 2004/05 2007/08 2009/10-I 2009/10-II
SC 392 438 477 516 575 586 657
ST 352 417 425 456 547 576 631
Muslim 439 487 546 574 630 634 697
non (SC, ST, Muslim) 535 601 664 727 822 843 912
OBC - - 558 611 681 697 760
non (SC, ST, Muslim, OBC) - - 782 871 1033 1057 1137
Total 489 547 596 653 726 743 811
Data Source: NSS Consumer Expenditure Survey, various years; for 2009-10, there are 2 surveys-Type I which has reference period of 30 days for all food items and Type II which has 7 days reference period for some food items and 30 days for rest items. For all other survey years, reference period for all food items is 30 days.
Real Consumption Levels
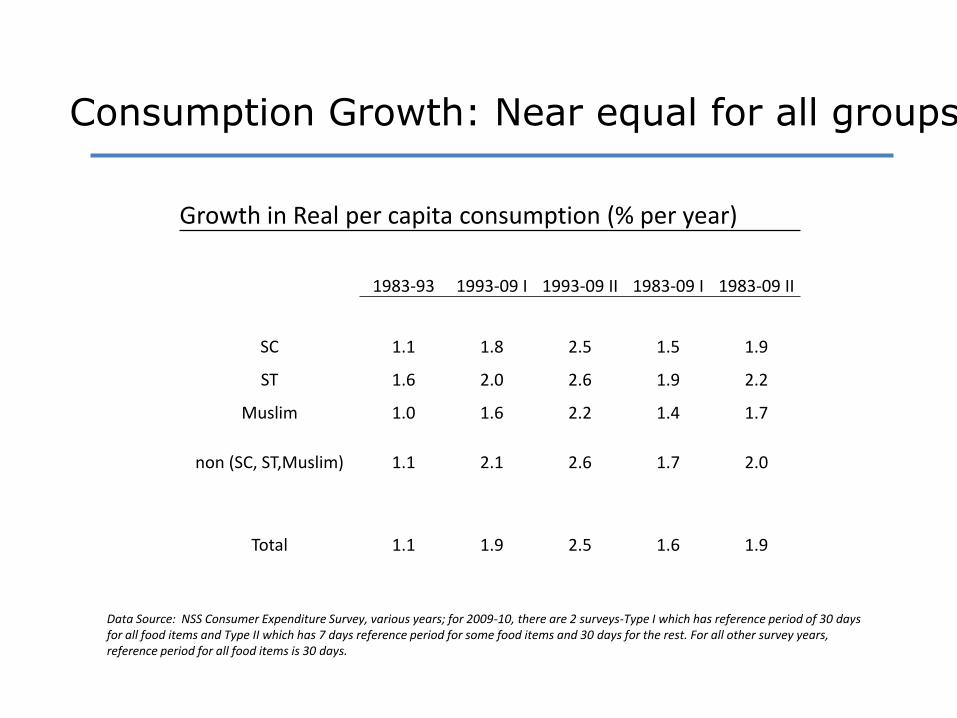
Growth in Real per capita consumption (% per year)
1983-93 1993-09 I 1993-09 II 1983-09 I 1983-09 II
SC 1.1 1.8 2.5 1.5 1.9
ST 1.6 2.0 2.6 1.9 2.2
Muslim 1.0 1.6 2.2 1.4 1.7
non (SC, ST,Muslim) 1.1 2.1 2.6 1.7 2.0
Total 1.1 1.9 2.5 1.6 1.9
Data Source: NSS Consumer Expenditure Survey, various years; for 2009-10, there are 2 surveys-Type I which has reference period of 30 days for all food items and Type II which has 7 days reference period for some food items and 30 days for the rest. For all other survey years, reference period for all food items is 30 days.
Consumption Growth: Near equal for all groups
Reality of Inequality
Gini Inequality in India – Still constant after all these years
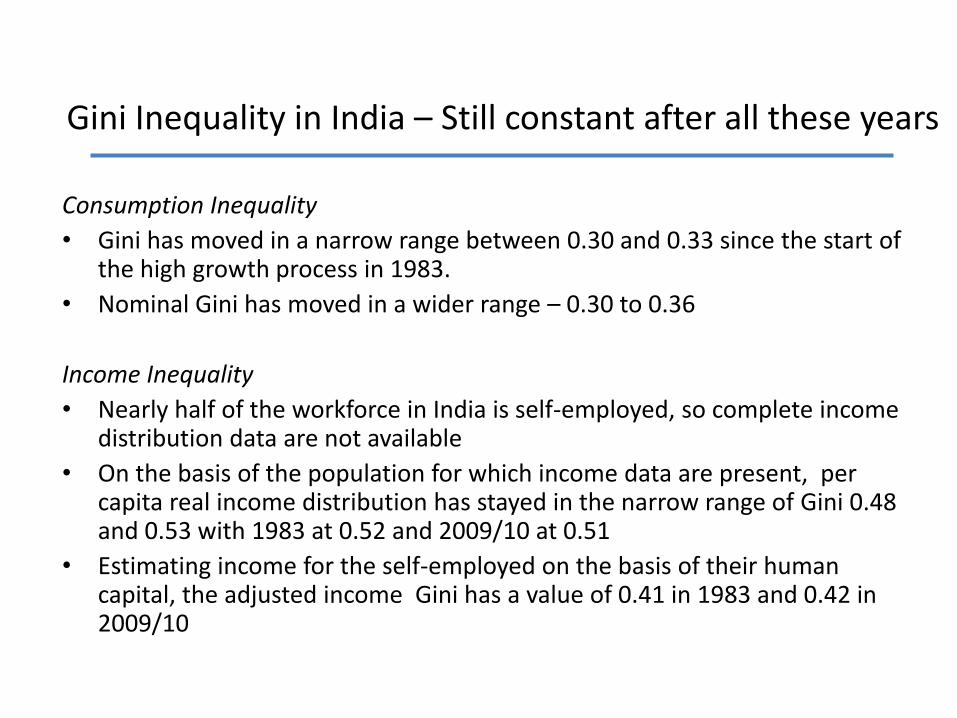
Consumption Inequality
• Gini has moved in a narrow range between 0.30 and 0.33 since the start of the high growth process in 1983.
• Nominal Gini has moved in a wider range – 0.30 to 0.36
Income Inequality
• Nearly half of the workforce in India is self-employed, so complete income distribution data are not available
• On the basis of the population for which income data are present, per capita real income distribution has stayed in the narrow range of Gini 0.48 and 0.53 with 1983 at 0.52 and 2009/10 at 0.51
• Estimating income for the self-employed on the basis of their human capital, the adjusted income Gini has a value of 0.41 in 1983 and 0.42 in 2009/10
Inequality: Gini Coefficients
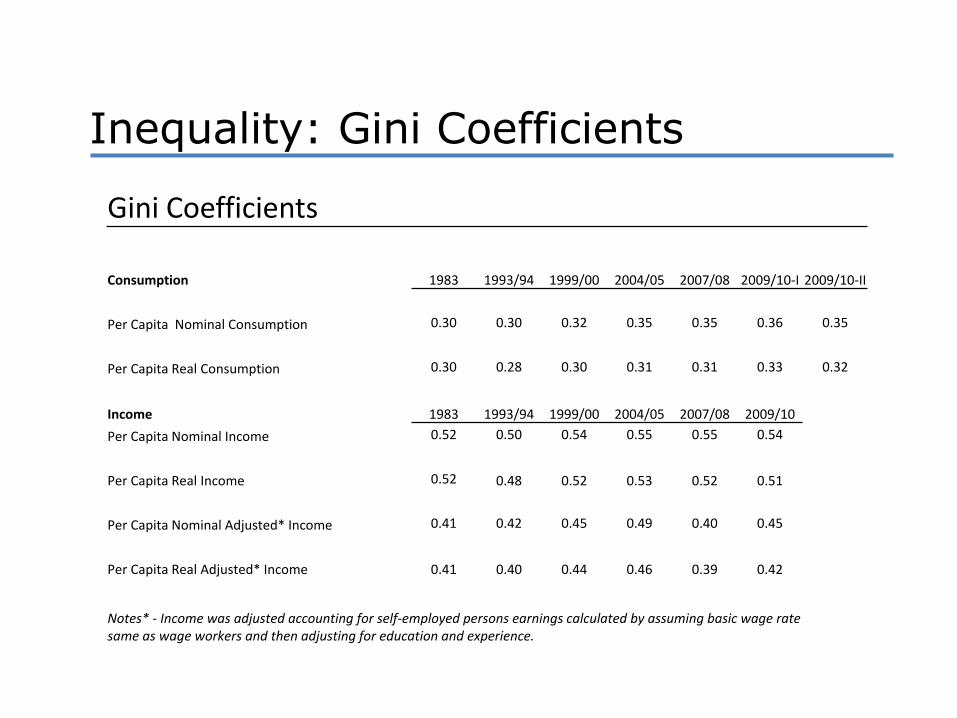
Gini Coefficients
Consumption 1983 1993/94 1999/00 2004/05 2007/08 2009/10-I 2009/10-II
Per Capita Nominal Consumption 0.30 0.30 0.32 0.35 0.35 0.36 0.35
Per Capita Real Consumption 0.30 0.28 0.30 0.31 0.31 0.33 0.32
Income 1983 1993/94 1999/00 2004/05 2007/08 2009/10
Per Capita Nominal Income 0.52 0.50 0.54 0.55 0.55 0.54
Per Capita Real Income 0.52 0.48 0.52 0.53 0.52 0.51
Per Capita Nominal Adjusted* Income 0.41 0.42 0.45 0.49 0.40 0.45
Per Capita Real Adjusted* Income 0.41 0.40 0.44 0.46 0.39 0.42
Notes* - Income was adjusted accounting for self-employed persons earnings calculated by assuming basic wage rate same as wage workers and then adjusting for education and experience.
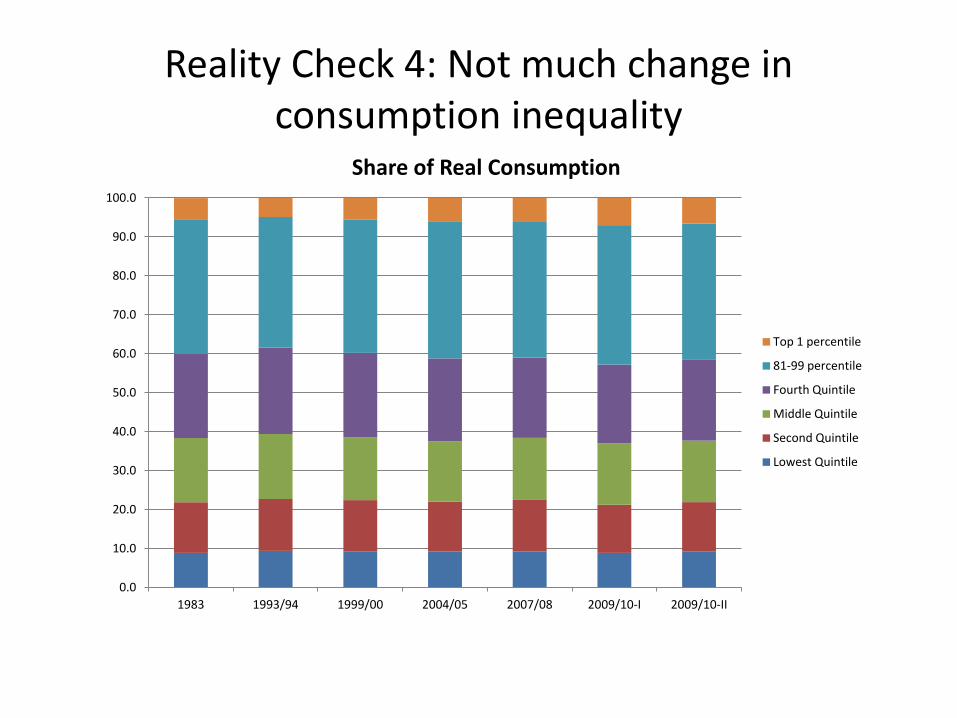
Reality Check 4: Not much change in consumption inequality
0.0
10.0
20.0
30.0
40.0
50.0
60.0
70.0
80.0
90.0
100.0
1983 1993/94 1999/00 2004/05 2007/08 2009/10-I 2009/10-II
Share of Real Consumption
Top 1 percentile
81-99 percentile
Fourth Quintile
Middle Quintile
Second Quintile
Lowest Quintile
Rural/urban inequality in India – Also constant for 30 years
• Sen-Himanshu use the ratio of per capita urban to rural income as an indicator of inequality in India.
• This ratio has markedly increased from 1.49 in 1983 to 1.95 in 2009/10 - a thirty percent increase, a magnitude comparable to inequality increase in China, etc.
• However, using deflators identical to those used to calculate poverty, one obtains the result that the real urban/rural consumption ratio has barely moved since 1983.
• This confirms the robust finding that inequality has stayed constant in India.
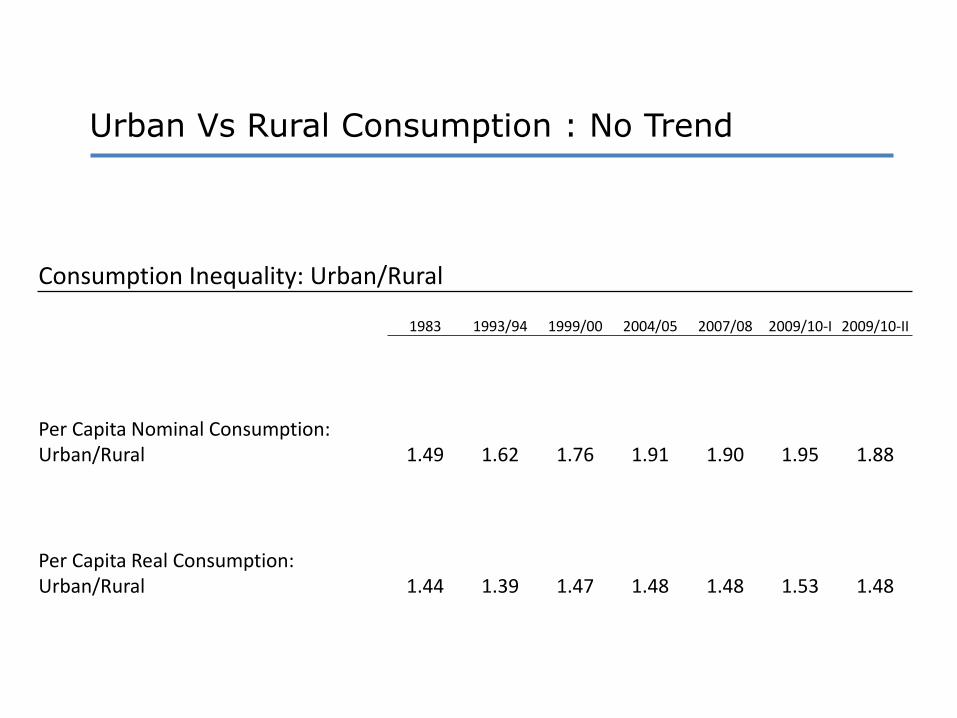
Urban Vs Rural Consumption : No Trend
Consumption Inequality: Urban/Rural
1983 1993/94 1999/00 2004/05 2007/08 2009/10-I 2009/10-II
Per Capita Nominal Consumption: Urban/Rural 1.49 1.62 1.76 1.91 1.90 1.95 1.88
Per Capita Real Consumption: Urban/Rural 1.44 1.39 1.47 1.48 1.48 1.53 1.48
2 + 2 = 3 in Full Force
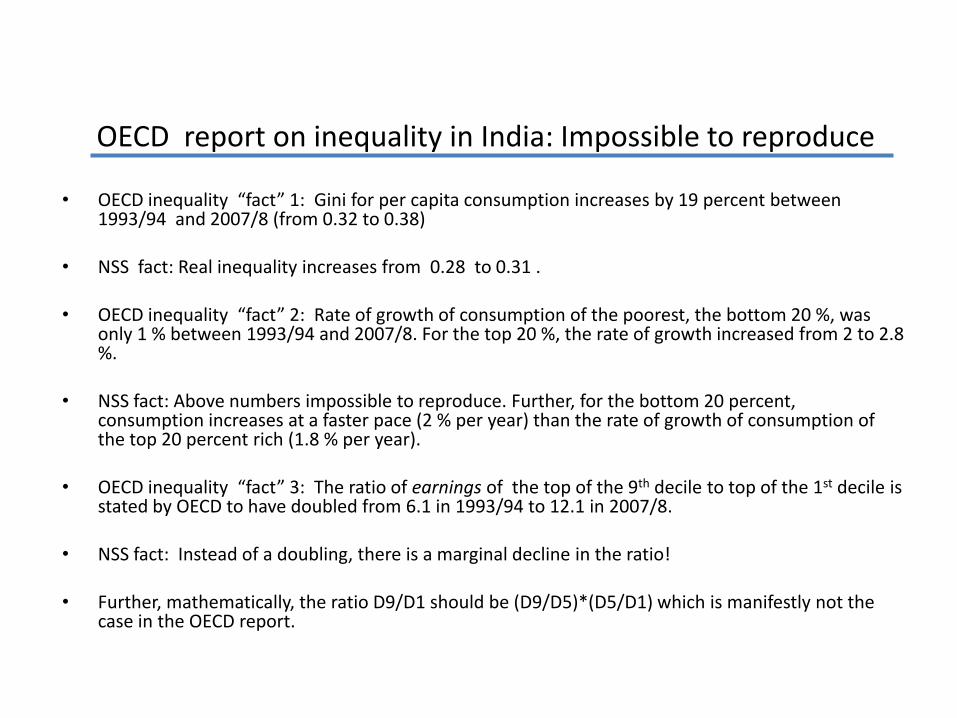
OECD report on inequality in India: Impossible to reproduce
• OECD inequality “fact” 1: Gini for per capita consumption increases by 19 percent between 1993/94 and 2007/8 (from 0.32 to 0.38)
• NSS fact: Real inequality increases from 0.28 to 0.31 .
• OECD inequality “fact” 2: Rate of growth of consumption of the poorest, the bottom 20 %, was only 1 % between 1993/94 and 2007/8. For the top 20 %, the rate of growth increased from 2 to 2.8 %.
• NSS fact: Above numbers impossible to reproduce. Further, for the bottom 20 percent, consumption increases at a faster pace (2 % per year) than the rate of growth of consumption of the top 20 percent rich (1.8 % per year).
• OECD inequality “fact” 3: The ratio of earnings of the top of the 9th decile to top of the 1st decile is stated by OECD to have doubled from 6.1 in 1993/94 to 12.1 in 2007/8.
• NSS fact: Instead of a doubling, there is a marginal decline in the ratio!
• Further, mathematically, the ratio D9/D1 should be (D9/D5)*(D5/D1) which is manifestly not the case in the OECD report.
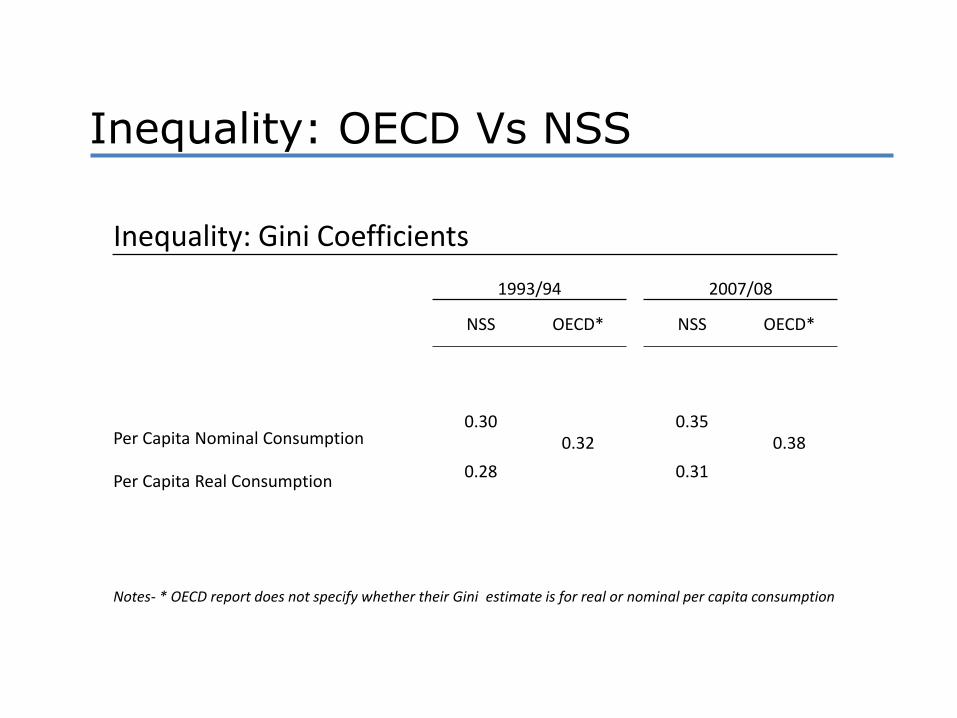
Inequality: Gini Coefficients
1993/94 2007/08
NSS OECD* NSS OECD*
Per Capita Nominal Consumption 0.30
0.32 0.35
0.38
Per Capita Real Consumption 0.28 0.31
Notes- * OECD report does not specify whether their Gini estimate is for real or nominal per capita consumption
Inequality: OECD Vs NSS
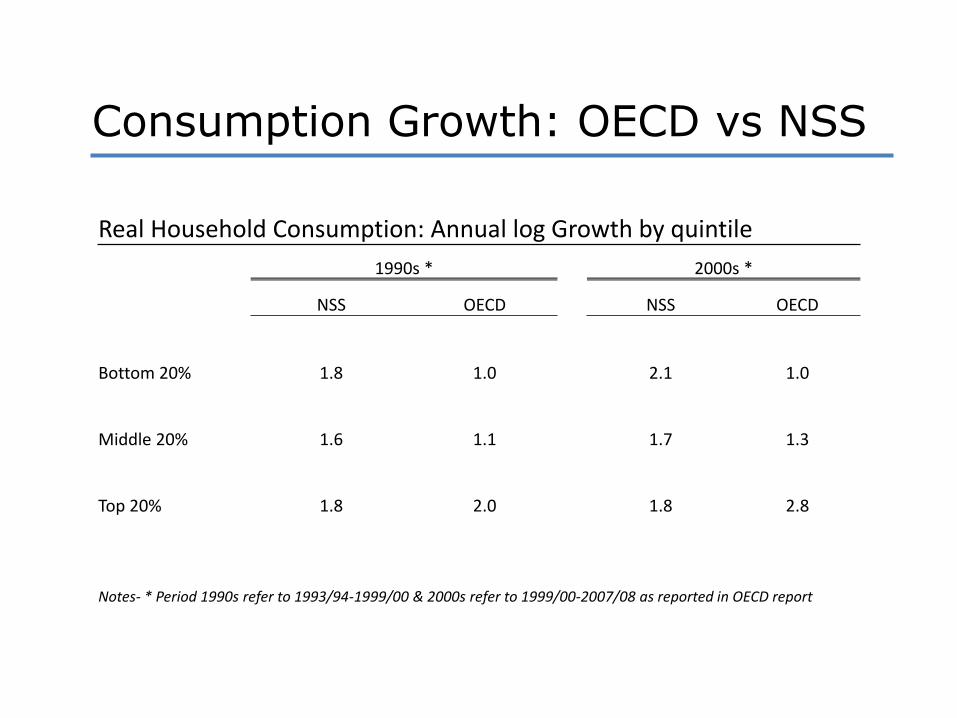
Real Household Consumption: Annual log Growth by quintile
1990s * 2000s *
NSS OECD NSS OECD
Bottom 20% 1.8 1.0 2.1 1.0
Middle 20% 1.6 1.1 1.7 1.3
Top 20% 1.8 2.0 1.8 2.8
Notes- * Period 1990s refer to 1993/94-1999/00 & 2000s refer to 1999/00-2007/08 as reported in OECD report
Consumption Growth: OECD vs NSS
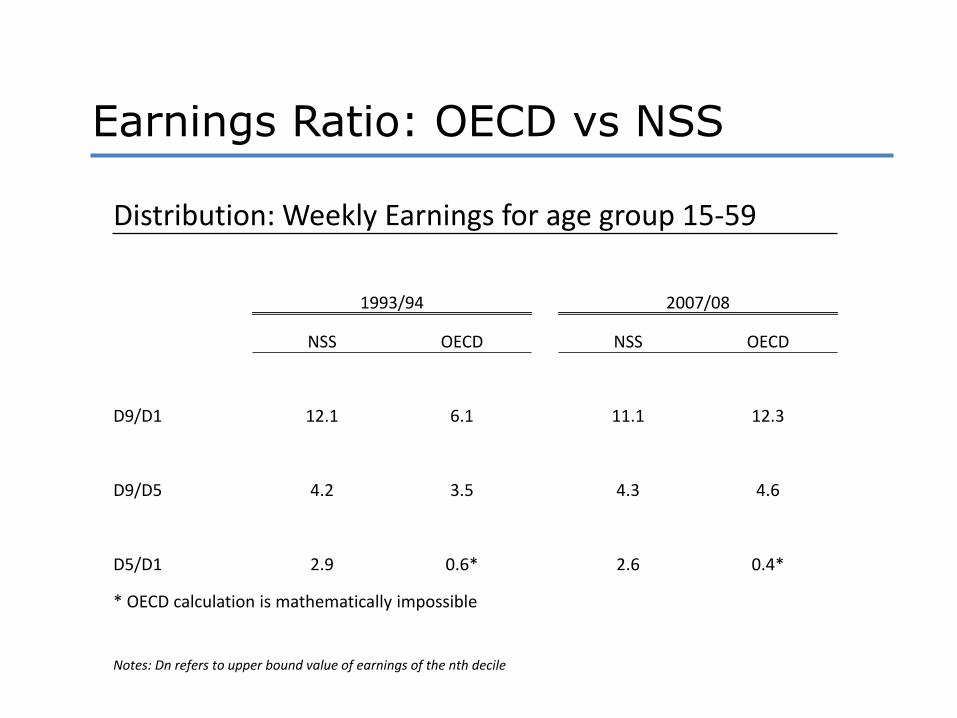
Distribution: Weekly Earnings for age group 15-59
1993/94 2007/08
NSS OECD NSS OECD
D9/D1 12.1 6.1 11.1 12.3
D9/D5 4.2 3.5 4.3 4.6
D5/D1 2.9 0.6* 2.6 0.4*
* OECD calculation is mathematically impossible
Notes: Dn refers to upper bound value of earnings of the nth decile
Earnings Ratio: OECD vs NSS
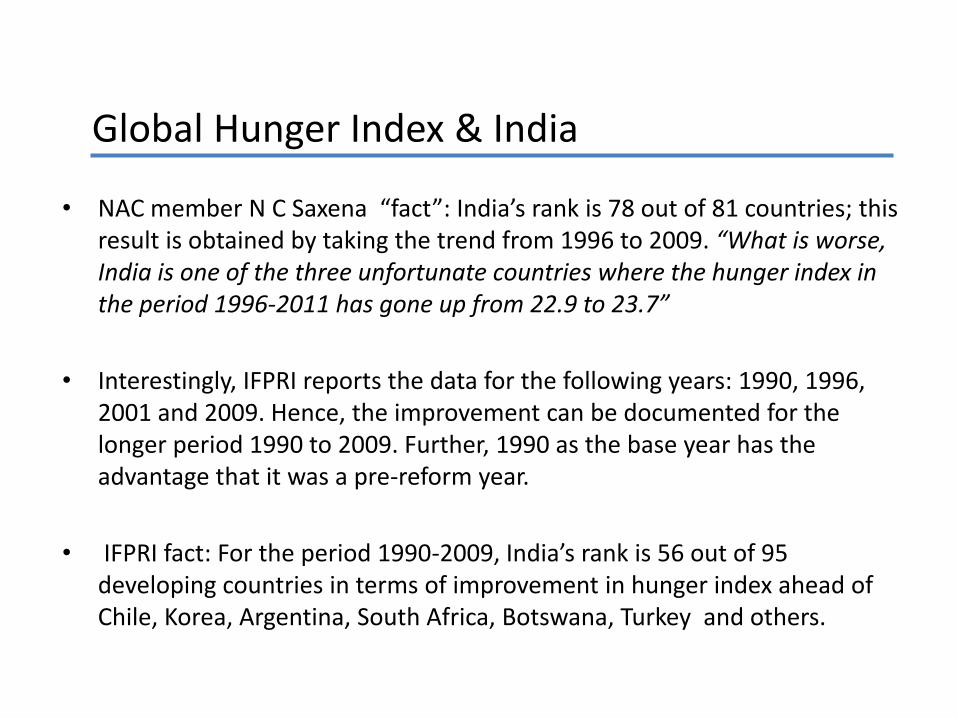
Global Hunger Index & India
• NAC member N C Saxena “fact”: India’s rank is 78 out of 81 countries; this result is obtained by taking the trend from 1996 to 2009. “What is worse, India is one of the three unfortunate countries where the hunger index in the period 1996-2011 has gone up from 22.9 to 23.7”
• Interestingly, IFPRI reports the data for the following years: 1990, 1996, 2001 and 2009. Hence, the improvement can be documented for the longer period 1990 to 2009. Further, 1990 as the base year has the advantage that it was a pre-reform year.
• IFPRI fact: For the period 1990-2009, India’s rank is 56 out of 95 developing countries in terms of improvement in hunger index ahead of Chile, Korea, Argentina, South Africa, Botswana, Turkey and others.
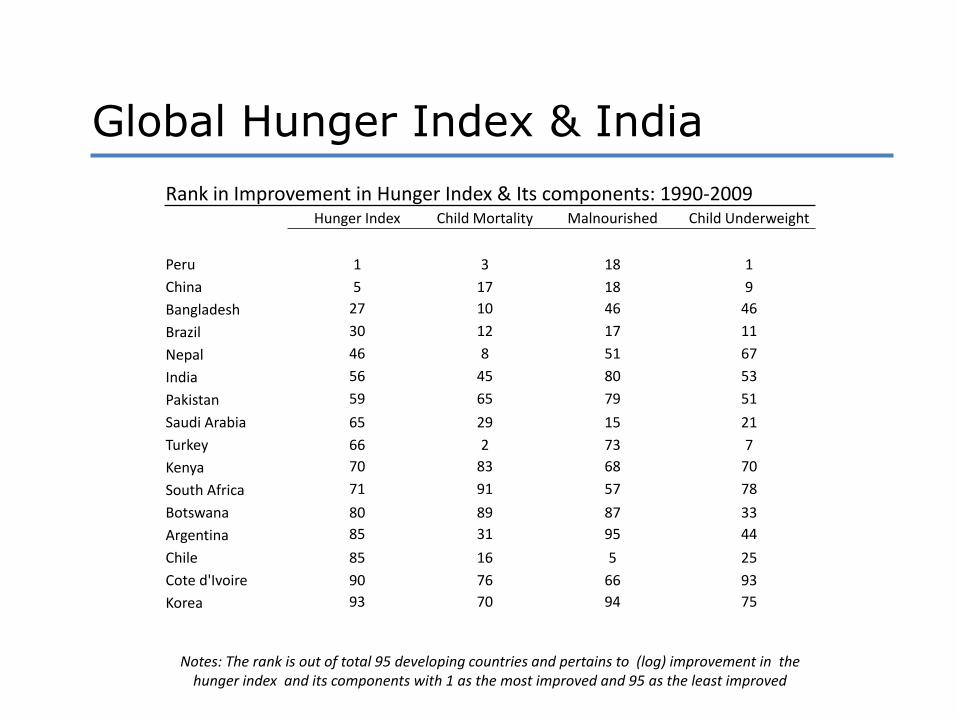
Global Hunger Index & India
Rank in Improvement in Hunger Index & Its components: 1990-2009 Hunger Index Child Mortality Malnourished Child Underweight
Peru 1 3 18 1
China 5 17 18 9
Bangladesh 27 10 46 46
Brazil 30 12 17 11
Nepal 46 8 51 67
India 56 45 80 53
Pakistan 59 65 79 51
Saudi Arabia 65 29 15 21
Turkey 66 2 73 7
Kenya 70 83 68 70
South Africa 71 91 57 78
Botswana 80 89 87 33
Argentina 85 31 95 44
Chile 85 16 5 25
Cote d'Ivoire 90 76 66 93
Korea 93 70 94 75
Notes: The rank is out of total 95 developing countries and pertains to (log) improvement in the hunger index and its components with 1 as the most improved and 95 as the least improved

UN MultiDimensional Poverty Index(MPI) & India:
• UN in its 2010 Human Development report has reported MPI for different countries measuring 10 dimensions of deprivation. We try to compare the education deprivation given in the UN report with that revealed by the NSS data .
• The UN chooses to construct the education component of its index on the basis of very questionable methodology. For child enrollment (16.7 percent of the total index) the calculation is as follows: if even one child of school going age is not attending school, the index for the entire household is zero. A more reasonable method is to compute the index components on the basis of percentages e.g. if there are three children of school going age, and one is not attending school, the index value should be two thirds of 16.7 or 11.13 , not zero!
• This makes a large difference to the results; instead of 25 percent overall deprivation according to the MPI, it is only 10 percent. But this correct method of computation does not yield the much cited UN “result” that eight sates in India are more deprived than the poor countries in sub-Saharan Africa.
• Further, we cannot reproduce the UN result even with UN assumptions – instead of 25 percent education poor, we obtain 14.4 percent.
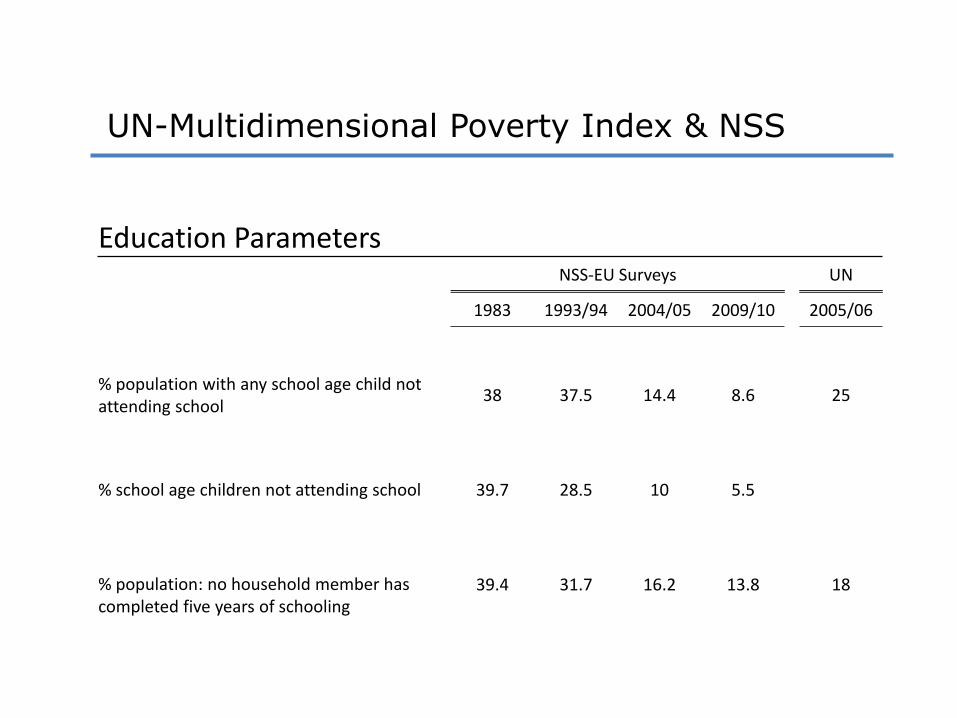
UN-Multidimensional Poverty Index & NSS
Education Parameters NSS-EU Surveys UN
1983 1993/94 2004/05 2009/10 2005/06
% population with any school age child not attending school
38 37.5 14.4 8.6 25
% school age children not attending school 39.7 28.5 10 5.5
% population: no household member has completed five years of schooling
39.4 31.7 16.2 13.8 18
Truth about Decline in Calorie Consumption
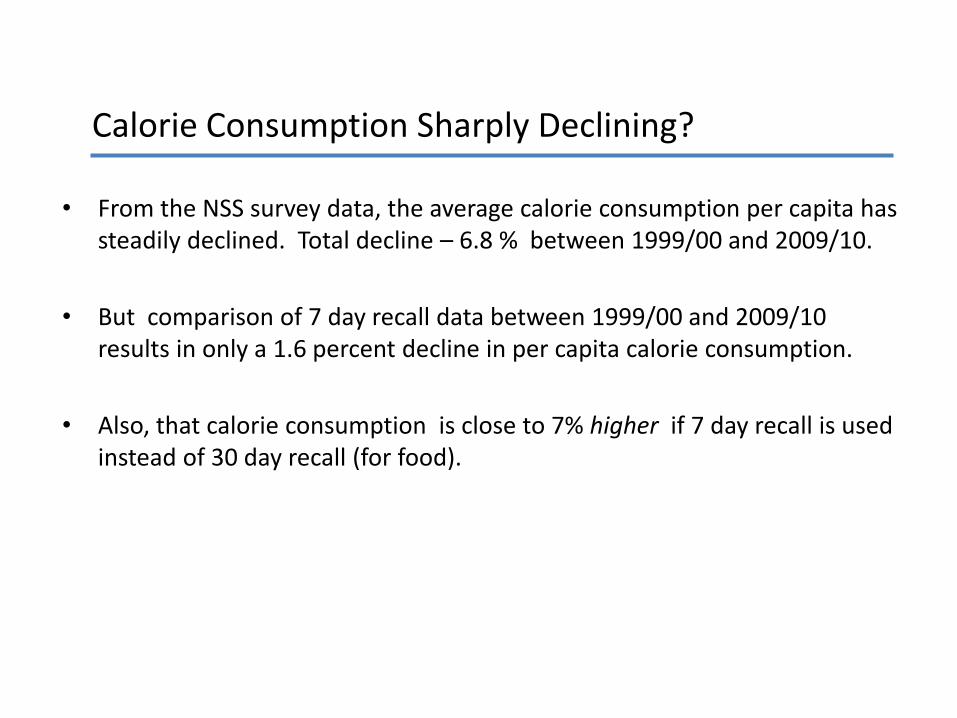
Calorie Consumption Sharply Declining?
• From the NSS survey data, the average calorie consumption per capita has steadily declined. Total decline – 6.8 % between 1999/00 and 2009/10.
• But comparison of 7 day recall data between 1999/00 and 2009/10 results in only a 1.6 percent decline in per capita calorie consumption.
• Also, that calorie consumption is close to 7% higher if 7 day recall is used instead of 30 day recall (for food).
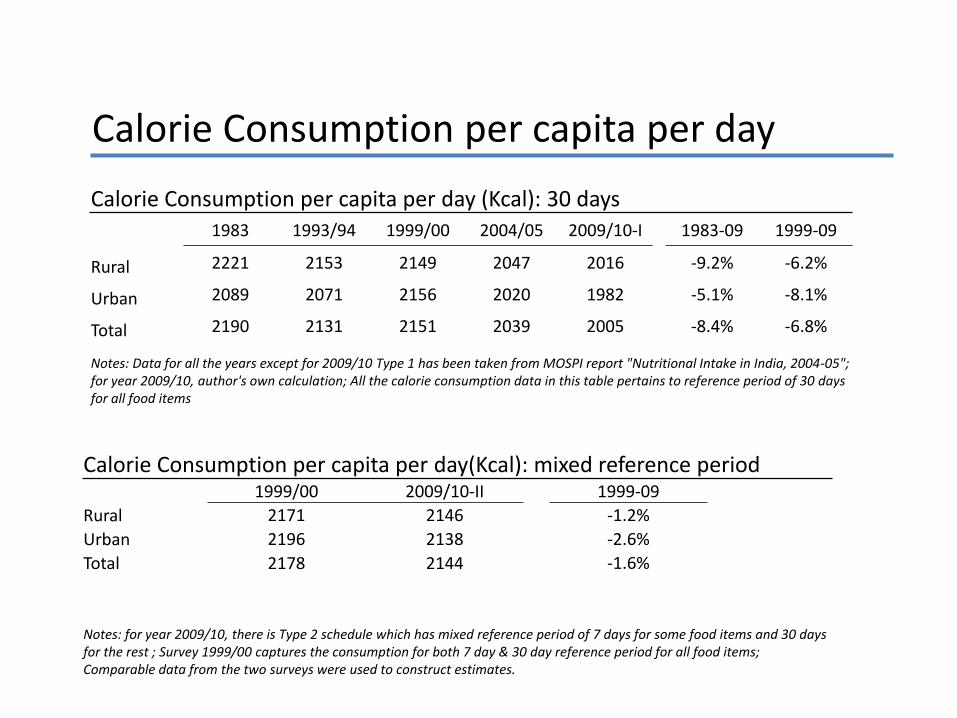
Calorie Consumption per capita per day (Kcal): 30 days 1983 1993/94 1999/00 2004/05 2009/10-I 1983-09 1999-09
Rural 2221 2153 2149 2047 2016 -9.2% -6.2%
Urban 2089 2071 2156 2020 1982 -5.1% -8.1%
Total 2190 2131 2151 2039 2005 -8.4% -6.8%
Notes: Data for all the years except for 2009/10 Type 1 has been taken from MOSPI report "Nutritional Intake in India, 2004-05"; for year 2009/10, author's own calculation; All the calorie consumption data in this table pertains to reference period of 30 days for all food items
Calorie Consumption per capita per day(Kcal): mixed reference period 1999/00 2009/10-II 1999-09
Rural 2171 2146 -1.2%
Urban 2196 2138 -2.6%
Total 2178 2144 -1.6%
Notes: for year 2009/10, there is Type 2 schedule which has mixed reference period of 7 days for some food items and 30 days for the rest ; Survey 1999/00 captures the consumption for both 7 day & 30 day reference period for all food items; Comparable data from the two surveys were used to construct estimates.
Calorie Consumption per capita per day
Public Schemes: Fixes & Corruption
Public Schemes
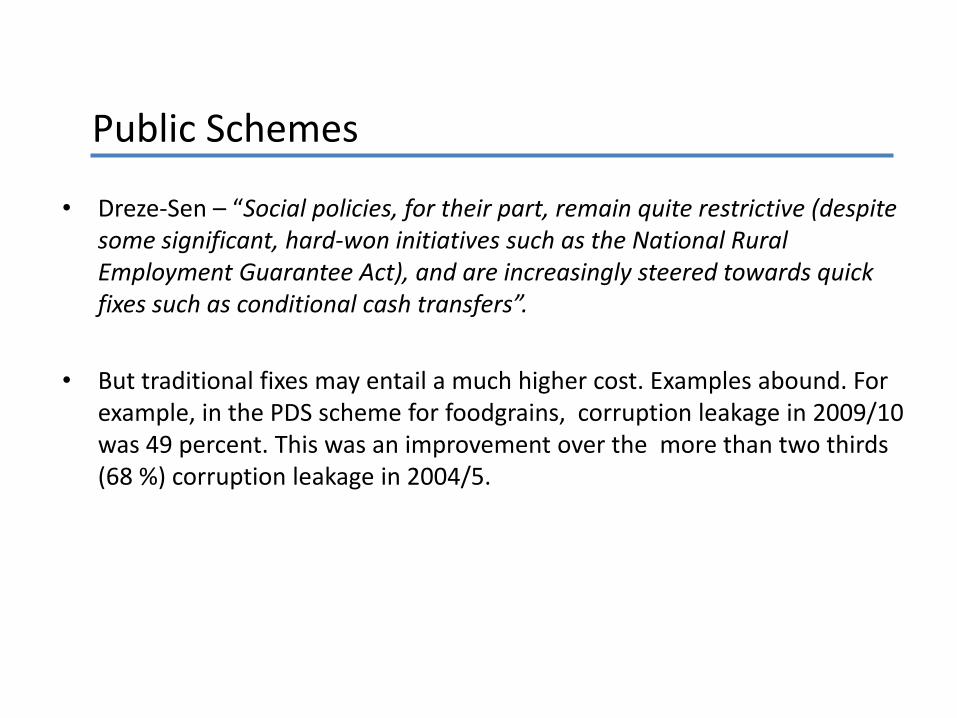
• Dreze-Sen – “Social policies, for their part, remain quite restrictive (despite some significant, hard-won initiatives such as the National Rural Employment Guarantee Act), and are increasingly steered towards quick fixes such as conditional cash transfers”.
• But traditional fixes may entail a much higher cost. Examples abound. For example, in the PDS scheme for foodgrains, corruption leakage in 2009/10 was 49 percent. This was an improvement over the more than two thirds (68 %) corruption leakage in 2004/5.
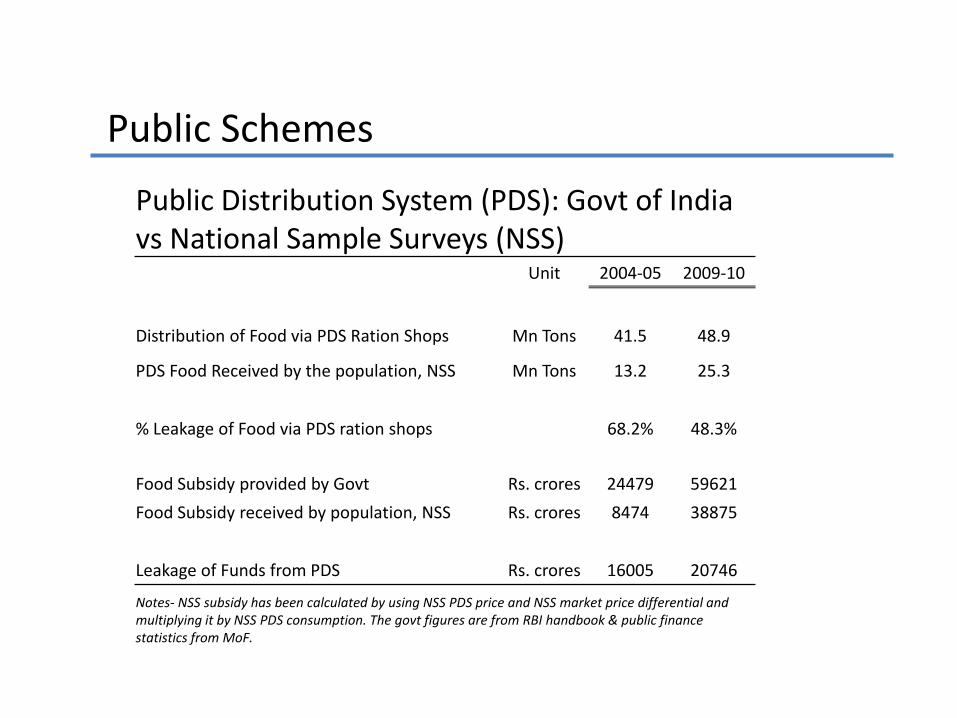
Public Distribution System (PDS): Govt of India vs National Sample Surveys (NSS)
Unit 2004-05 2009-10
Distribution of Food via PDS Ration Shops Mn Tons 41.5 48.9
PDS Food Received by the population, NSS Mn Tons 13.2 25.3
% Leakage of Food via PDS ration shops 68.2% 48.3%
Food Subsidy provided by Govt Rs. crores 24479 59621
Food Subsidy received by population, NSS Rs. crores 8474 38875
Leakage of Funds from PDS Rs. crores 16005 20746
Notes- NSS subsidy has been calculated by using NSS PDS price and NSS market price differential and multiplying it by NSS PDS consumption. The govt figures are from RBI handbook & public finance statistics from MoF.
Public Schemes
References
• Human Development Report 2010, “The Real Wealth of Nations: Pathways to Human Development”, UNDP
• “2011 Global Hunger Index”, IFPRI
• N C Saxena, “Hunger in India”
• Jean Dreze & Amartya Sen, “Putting Growth In Its Place”, Outlook, November 14, 2011
• OECD, 2011, Divided we stand: Why Inequality Keeps Rising
• Surjit S Bhalla, “Avoiding Rashomon: The Reality of Education, Employment and Earnings in India, 1983-2010”, Workshop on Employment, World Bank – ICRIER, New York, Sept 27, 2011
• Surjit S Bhalla, “Inclusion & Growth in India: Some Facts, Some Conclusions”, Prepared for International Growth Centre, Growth Week, London, Sept 21, 2011