Growth and Equity Effects of Agricultural Marketing ...
43
United States Department of Agriculture Economic Research Service Economic Research Report Number 89 December 2009 Growth and Equity Effects of Agricultural Marketing Efficiency Gains in India Maurice R. Landes Mary E. Burfisher
Transcript of Growth and Equity Effects of Agricultural Marketing ...

United States Department of Agriculture
Economic Research Service
Economic Research Report Number 89
December 2009
Growth and Equity Effects of Agricultural Marketing Efficiency Gains in India
Maurice R. Landes
Mary E. Burfisher

ww
w.er
s.usda.gov
Visit Our Website To Learn More!
National Agricultural LibraryCataloging Record:
The U.S. Department of Agriculture (USDA) prohibits discrimination in all its programs and activities on the basis of race, color, national origin, age, disability, and, where applicable, sex, marital status, familial status, parental status, religion, sexual orientation, genetic information, political beliefs, reprisal, or because all or a part of an individual's income is derived from any public assistance program. (Not all prohibited bases apply to all programs.) Persons with disabilities who require alternative means for communication of program information (Braille, large print, audiotape, etc.) should contact USDA's TARGET Center at (202) 720-2600 (voice and TDD).
To file a complaint of discrimination write to USDA, Director, Office of Civil Rights, 1400 Independence Avenue, S.W., Washington, D.C. 20250-9410 or call (800) 795-3272 (voice) or (202) 720-6382 (TDD). USDA is an equal opportunity provider and employer.
Landes, MauriceGrowth and equity effects of agricultural marketing efficiency gains in India.(Economic research report (United States. Dept. of Agriculture. Economic Research Service) ; no. 89)1. Agriculture—India—Econometric models. 2. Agriculture-Economic aspects—India.3. Agriculture and state—India. 4. Farm produce-Marketing-Government policy—India.I. Burfisher, Mary E. II. United States. Dept. of Agriculture. Eco-nomic Research Service. III. Title.
HD9016.I42
Indiawww.ers.usda.gov/Briefing/India/
Photos: Maurice R. Landes

United StatesDepartmentof Agriculture
www.ers.usda.gov
A Report from the Economic Research Service
Abstract
Agriculture is the largest source of employment in India, and food accounts for about half of consumer expenditures. Moving agricultural products from the farm to consumers more efficiently could result in large gains to producers, consumers, and India’s overall economy. This analysis uses a computable general equilibrium model with agricul-tural commodity detail and households disaggregated by rural, urban, and income class to study the potential impacts of reforms that achieve efficiency gains in agricultural marketing and reduce agricultural input subsidies and import tariffs. More efficient agri-cultural marketing generates economywide gains in output and wages, raises agricul-tural producer prices, reduces consumer food prices, and increases private consumption, particularly by low-income households. These gains could help to offset some of the medium-term adjustment costs for some commodity markets and households associated with reducing agricultural subsidies and tariffs.
Keywords: India, agriculture, policy reform, marketing efficiency, tariffs, subsidies, households, computable general equilibrium model.
Acknowledgments
Roman Keeney (Purdue University), Ashok Gulati (International Food Policy Research Institute), Holly Higgins (USDA, Foreign Agricultural Service), and two anonymous reviewers provided valuable comments on earlier versions of this report. The authors thank Anita Regmi (USDA, Economic Research Service (ERS)) for coordinating the peer review of the report, Linda Hatcher (USDA, ERS) for editing the report, and Cynthia A. Ray (USDA, ERS) for graphics design and layout.
Maurice R. Landes Mary E. Burfisher
Growth and Equity Effects of Agricultural Marketing Efficiency Gains in India
Economic Research Report Number 89
December 2009

ii Growth and Equity Effects of Agricultural Marketing Efficiency Gains in India / ERR-89
Economic Research Service/USDA
Contents
Summary. . . . . . . . . . . . . . . . . . . . . . . . . . . . . . . . . . . . . . . . . . . . . . . . . . . iii
Introduction . . . . . . . . . . . . . . . . . . . . . . . . . . . . . . . . . . . . . . . . . . . . . . . . 1
Agricultural Policy, Investment, and Marketing Efficiency in India . . 3
Potential Implications of Marketing Efficiency Gains . . . . . . . . . . . . . . 6
Estimated Costs of Marketing Agricultural and Food Products. . . . . . 8
Household Income and Expenditure Patterns . . . . . . . . . . . . . . . . . . . 11
Impacts of Potential Marketing Efficiency Gains . . . . . . . . . . . . . . . . . 15
Economywide Impacts . . . . . . . . . . . . . . . . . . . . . . . . . . . . . . . . . . . . . 15
Agricultural Sector Impacts . . . . . . . . . . . . . . . . . . . . . . . . . . . . . . . . . 16
Household Impacts: Income and Rural/Urban Distribution . . . . . . . . . 18
Comparing the Impacts of Increased Marketing Efficiency With Agricultural Input Subsidy and Tariff Reform. . . . . . . . . . . . . . 19
India’s Agricultural Subsidies. . . . . . . . . . . . . . . . . . . . . . . . . . . . . . . . 19
India’s Agricultural Tariffs . . . . . . . . . . . . . . . . . . . . . . . . . . . . . . . . . . 20
Scenario Comparisons. . . . . . . . . . . . . . . . . . . . . . . . . . . . . . . . . . . . . . 22
Conclusions . . . . . . . . . . . . . . . . . . . . . . . . . . . . . . . . . . . . . . . . . . . . . . . . 25
References . . . . . . . . . . . . . . . . . . . . . . . . . . . . . . . . . . . . . . . . . . . . . . . . . 27
Appendix 1: Model and Database . . . . . . . . . . . . . . . . . . . . . . . . . . . . . 30
Appendix 2: Sector Aggregation From GTAP Database; Mapping GTAP Data Into the India SAM . . . . . . . . . . . . . . . . . . . . . . 33
Appendix 3: Scenario Results for Impacts of Agricultural Marketing Efficiency, Input Subsidy, and Tariff Reform Scenarios in India . . . . . 34
Recommended citation format for this publication:
Landes, Maurice R., and Mary E. Burfisher. Growth and Equity Effects of Agricultural Marketing Efficiency Gains in India. ERR-89. U.S. Dept. of Agriculture, Econ. Res. Serv. November 2009.

iii Growth and Equity Effects of Agricultural Marketing Efficiency Gains in India / ERR-89
Economic Research Service/USDA
Summary
Growth in India’s economy and consumer buying power has accelerated sharply since the early 1990s, when a balance-of-payments crisis instigated major liberalizing reforms to exchange rate, trade, and domestic regulatory policies. As a result, India’s food demand is expanding and diversifying, but India’s farm sector has not shared in the benefits of policy reform, and growth in the sector has remained sluggish. Because the farm sector accounts for a large share of total output and employment in the Indian economy, this poor performance raises concerns about India’s ability to sustain accelerated income growth, reduce pervasive rural poverty, and maintain food security.
What Is the Issue?
Despite the recent robust expansion of India’s economy, lagging investment and growth in its agricultural sector are raising concerns about the need for a second round of reforms to stimulate the farm economy. Reforms of agricul-tural trade protection and producer subsidies are frequent topics of discussion and analysis, but strong evidence supports the idea that fragmented and inef-ficient domestic agricultural marketing chains seriously hinder agricultural competitiveness and growth. Measures to boost marketing efficiency by reducing regulatory barriers that have impeded investment in agricultural wholesale and retail trade services may also improve conditions for low-income producers and consumers, a priority for India’s policymakers. This study examines the performance of India’s agricultural marketing system and analyzes the economywide implications of improved marketing efficiency that might stem from future reforms to domestic market regulations and increased investment in agricultural markets.
What Are the Major Findings?
Measures to improve agricultural marketing efficiency in India can substan-tially and broadly benefit India’s economy. Improved marketing efficiency has the potential to generate economywide gains in output and wages, raise agricultural producer prices, reduce consumer food prices, and increase private consumption, particularly by rural and low-income households.
The broad gains from improving agricultural marketing efficiency contrast significantly with the impacts of reducing agricultural subsidies and tariffs. Indian policymakers face domestic and international pressures to reduce input subsidies and tariffs in the farm sector. But reducing subsidies and tariffs, while conferring economywide benefits, may also, at least in the medium term, create adjustment costs for labor, land, and capital markets, some commodity sectors, and households. In contrast, improved agricul-tural marketing efficiency can benefit the overall economy (see chart), as well as low-income households. The results of this study suggest that policy measures to improve the efficiency of domestic agricultural markets may be a valuable complement to subsidy and tariff reforms by helping to mitigate the medium-term losses that may stem from such reforms.

iv Growth and Equity Effects of Agricultural Marketing Efficiency Gains in India / ERR-89
Economic Research Service/USDA
Greater investment and efficiency in India’s agricultural supply chains also have the potential to enhance agricultural growth over the longer term. Whether new policies lead to rapid investment by modern retailers and others in transforming India’s markets or the process occurs gradually, more efficient agricultural marketing is likely to strengthen consumer demand for food and other goods. More efficient domestic marketing may also boost net agricultural exports, although this result does not account for the changes in demand likely to occur as higher income growth is sustained over the longer term or for constraints on crop and livestock production that may emerge.
This analysis also does not fully assess the adjustment costs, including poten-tial employment and income losses in some areas of the traditional marketing system, that might result from transforming India’s traditional wholesale and retail markets into a more efficient sector. This transformation could lead to fewer, but larger, vertically integrated, and more technologically advanced processing and marketing enterprises. Concerns with managing these adjust-ment costs are central to the current debate over regulating direct foreign investment in food retailing in India. This analysis suggests, however, that although some participants in the traditional marketing system would undoubt-edly face adjustment costs, the impacts on economywide wages and welfare, as well as the welfare impacts on low-income households, are positive.
For the United States, these results suggest that increasing investment and efficiency in India’s agricultural markets is an important potential driver of broad-based income and demand growth in India, likely bringing long-term benefits to its trade partners. The analysis of the potential impacts of reforms to agricultural input subsidies and tariffs suggests why these issues are sensitive for India in bilateral and multilateral negotiations. At least in the medium term, reducing input subsidies lowers output of food staples, leading to reduced welfare for low-income households, while reducing tariffs imposes adjustment costs on protected commodity sectors. But, the results also suggest that measures to improve agricultural marketing effi-ciency, perhaps including cooperation to strengthen India’s market institu-tions and investment climate, can help mitigate the adjustment costs faced
Economywide effects of alternative agricultural and food marketing policy scenarios in India
-6.0 -4.0 -2.0 0.0 2.0 4.0 6.0
Percent change from base
50% increase in marketingefficiency
Eliminate input subsidies
Eliminate agricultural tariffs
Capital rents
Wages
Land rents
Producer price index
Real investment demand
Real household consumption
Real gross domestic product

v Growth and Equity Effects of Agricultural Marketing Efficiency Gains in India / ERR-89
Economic Research Service/USDA
by some households and commodity sectors from such reforms. Further, the substantial increases in agricultural output and food consumption that arise from improved marketing efficiency in this analysis suggest the potential for positive returns to private investment—including U.S. private foreign invest-ment—in Indian agribusiness.
How Was the Study Conducted?
The authors constructed a computable general equilibrium (CGE) model of the Indian economy. The basic model structure was developed by the International Food Policy Research Institute (IFPRI), with expanded commodity coverage, disaggregation of marketing and trade costs, disaggre-gation of rural and urban households by expenditure class, and other exten-sions added by the authors for this study. Model data were supplied by the Global Trade Analysis Project (GTAP) and official Indian sources. Model structure, extensions, and data sources are described in detail in an appendix. The study also draws on data and results from studies of India’s agricultural markets conducted recently by ERS, the World Bank, and other institutions.


1 Growth and Equity Effects of Agricultural Marketing Efficiency Gains in India / ERR-89
Economic Research Service/USDA
Introduction
Growth in India’s real income has accelerated sharply since the early 1990s, when a balance of payments crisis instigated major liberalizing reforms to exchange rate, trade, and domestic regulatory policies. But, despite the resulting expansion and diversification of food demand, growth in India’s farm sector has been slowing. Because the farm sector accounts for large shares of total output and employment in the Indian economy, this poor performance raises concerns about progress in reducing pervasive rural poverty, the sustainability of India’s higher growth path, and the maintenance of food security. The successful reforms of the early 1990s enhanced the competitiveness and growth of India’s manufacturing and service sectors, but political consensus on a “second round” of reforms to stimulate the rural sector and more directly address the needs of India’s rural and urban poor has remained elusive. A major package of credit concessions and outlays for agriculture announced in the 2008/09 government budget—in advance of national elections in early 2009—was evidence of continued concern with farm sector performance.
The government has been and continues to be heavily involved in India’s agricultural sector through policy interventions in the production, marketing, and trade of most major farm commodities. Most obvious—and most studied—have been India’s border measures, including relatively high bound and applied tariffs and export controls for farm products, and its burgeoning subsidies on farm inputs and on producer and consumer prices of wheat and rice.1 Less obvious—and less studied—are India’s extensive array of central and state regulations that affect the movement, storage, processing, and marketing of farm commodities and that have served as disincentives for private investment in agricultural wholesale and retail marketing. As a result, India’s agricultural marketing system consists primarily of small-scale, nonintegrated, and inefficient marketing enterprises that tax both producers and consumers of farm products (Landes, 2008; Landes and Gulati, 2004).
A small but growing body of research on India’s agricultural wholesale and retail markets has identified a range of developments that are increasing or could increase efficiency in the supply chains that move agricultural prod-ucts from producers to consumers. Vertical integration,2 led by the private sector, has significantly reduced marketing costs, reduced consumer prices, increased grower returns, and stimulated growth in India’s broiler industry (Landes et al., 2004). Reducing the government’s role in marketing wheat by fully decentralizing and privatizing procurement for government distri-bution programs could reduce producer wholesale markups for wheat, as well as sharply lower budgetary costs (Jha et al., 2007). Deregulating oilseed marketing and processing, which would allow the import of oilseeds, could improve efficiency in India’s oilseed-processing industry and reduce consumer prices of edible oil while maintaining incentives for oilseed producers (Persaud and Landes, 2006; World Bank, 1997). Joseph et al. (2008) have recommended a package of reforms needed to improve the competitiveness and efficiency of India’s agricultural supply chains, including the promotion of retailer cooperatives and associations to procure directly from farmers, developing professional standards and product branding, improving credit and banking services, and simplifying regulatory and licensing requirements in the marketing chain.
1A bound tariff is the maximum tariff rate allowed by the World Trade Orga-nization. An applied tariff is the actual tariff rate in effect at a country’s border.
2One business controls or owns dif-ferent aspects of buying, processing, selling, and delivering products and services.

2 Growth and Equity Effects of Agricultural Marketing Efficiency Gains in India / ERR-89
Economic Research Service/USDA
The widespread underinvestment and inefficiency in India’s agricultural marketing system, coupled with the high priority given to boosting agri-cultural growth, makes it important to explore the potential impacts of improvements in marketing efficiency that may occur as a result of reduced regulation and increased investment in domestic markets. This study reviews and builds on industry studies of agricultural marketing efficiency to provide an economywide assessment of the impacts of potential increases in marketing efficiency. The analysis uses a computable general equilibrium (CGE) model to estimate the effects of increased agricultural marketing efficiency on economywide production, consumption, prices, and welfare. Because the equity implications of policy reform are a key consideration for Indian policymakers, the framework also accounts for the distribution of impacts on 10 representative household types classified by rural and urban location and by income class. The impacts of increased marketing efficiency are then contrasted with those for two controversial and more commonly addressed areas of agricultural reform: liberalization of agricultural trade and removal of agricultural input subsidies.
The results indicate that, when marketing costs are reduced, impacts include higher agricultural producer prices, lower consumer food prices, and increased real consumption for all households—high and low income, rural and urban. Increasing the efficiency of agricultural marketing tends to have greater positive impacts on consumers and producers—particularly on lower income households—than do other more “traditional” reforms, such as reducing agricultural input subsidies or removing barriers to agricultural trade. A key implication is that measures to improve marketing efficiency offer a potentially valuable complement to agricultural subsidy and trade reforms.

3 Growth and Equity Effects of Agricultural Marketing Efficiency Gains in India / ERR-89
Economic Research Service/USDA
Agricultural Policy, Investment, and Marketing Efficiency in India
Marketing services are the wholesale and retail trade services used to bring domestically produced goods from the producer to the point of sale for intermediate and final demand. In India’s agricultural and food markets, the marketing chain typically consists of a primary market where farmers sell their product, wholesale markets where wholesalers who purchase from primary markets sell to processors and retailers, and retail markets where retailers sell to consumers. In many cases, additional intermediaries may be present in supply chains, including village collectors who purchase from farmers and sell in primary markets or subwholesalers who operate between wholesalers and retailers. Many, if not most, of the intermediaries in India’s agricultural supply chains are small-scale, nonintegrated marketing enter-prises operating in the “unorganized” sector, for which little official data are available.
Inefficient marketing systems tax producers by placing downward pres-sure on farm gate prices and tax consumers by raising retail prices, thus representing a potentially important target for reform. In India, agriculture accounts for about 18 percent of gross domestic product (GDP) and 58 percent of employment, and food accounts for about 47 percent of consumer expenditure (Reserve Bank of India, 2007; Government of India, Ministry of Statistics and Programme Implementation, 2005, 2008). Thus, in India, like other developing countries, the economywide impacts of improved marketing efficiency on food demand, output, and trade are potentially larger than in more developed countries where agriculture and food account for smaller shares of the economy. Improved performance of agricultural marketing may also have desirable equity outcomes by reducing food costs for low-income rural and urban consumers, who tend to allocate the largest budget shares for food.
The significance of high marketing costs as a tax on farm output is evident in studies that have quantified government intervention in Indian agricul-ture, in which the combination of trade restrictions and high marketing costs often result in producer prices below import parity prices for many of India’s major farm commodities (U.S. Department of Agriculture, 1994; Mullen et al., 2005). There is also strong evidence that an array of central and state government policies have tended to undermine incentives for private invest-ment by farmers and agribusinesses. These policies may have contributed to an inefficient marketing system characterized by small-scale, nonintegrated marketing service enterprises (Landes, 2008; World Bank, 1999, 1997). These policy measures include the following:
Movement, storage, and pricing restrictions on food commodities• . The Essential Commodities Act allows central and state governments to administratively impose movement, storage, pricing, and quality restric-tions on most food commodities. These restrictions are a major source of policy risk for agribusiness investment, particularly in larger scale firms that hold relatively large stocks or operate across state borders.

4 Growth and Equity Effects of Agricultural Marketing Efficiency Gains in India / ERR-89
Economic Research Service/USDA
Agricultural marketing restrictions• . State agricultural marketing laws have historically required all farm produce to be sold in government-regulated markets and prohibited private investment in markets and vertical coordination or integration between agribusinesses and farmers. These rules are now in the process of reform but with full implementa-tion in just a few states. Government-regulated markets continue to dominate agricultural marketing in most of the country.
Land tenure policies• . In addition to ceilings on land ownership, many states either prohibit farm land rental or provide insufficient legal protec-tions to either party to a rental agreement to support an active rental market. These policies impede formation of larger operational holdings and farmer access to investment credit and complicate vertical coordina-tion between growers, processors, and traders.
Scale limitations on agricultural processing firms.• Until the late 1990s, most agricultural processors were required to be “small-scale industries,” restricted to fixed capital assets of no more than 10 million rupees (Rs) (about $247,000). Although most scale restrictions have been removed, agricultural marketing and processing remain dominated by small-scale firms.
Credit policies• . The high cost and limited availability of credit likely restricted new investment in agriculture and agribusiness during the 1990s. Terms and availability for institutional credit have improved significantly since 2000, but a large share of farmers and agribusinesses still depend on high-cost credit from traditional moneylenders.
Tax policies.• Until 2000, high excise tax rates of 8-16 percent on most processed agricultural products raised costs and deterred investment in food processing. These tax rates have been reduced sharply since 2001.
This policy environment, although changing since the late 1990s, has continued to be unfriendly to private investment in agricultural marketing and processing firms, particularly larger, integrated agribusinesses, and has corresponded with sluggish investment in Indian agriculture and agribusi-ness. During 2003-05, the share of investment in India’s GDP was 27 percent for the economy as a whole. The share of agricultural investment in agricul-tural GDP was just 6 percent for investment in production agriculture and 15 percent for investment in production agriculture and agricultural marketing infrastructure (fig. 1).3 Further, while total investment in the Indian economy has been accelerating and grew about 6.5 percent annually in real terms during 1997-2004, investment in agriculture has been slowing and grew just 2.2 percent annually during the same period. Additional evidence of the low levels of investment in Indian agribusiness includes the following:
Although more than 90 percent of India’s food grains receive primary •processing, mostly in medium- or small-scale mills, relatively small shares of other food products are processed. About 2.2 percent of fruit and vegetable production receives any processing, about 35 percent of milk is processed (mostly as packaged fluid milk), and between 6 and 21 percent of poultry and meat is processed (U.S. Department of Agriculture, 2008).
3Intercountry comparisons are complicated by data limitations and differences in definitions. If one uses comparable broad definitions of invest-ment in agriculture, India’s agricultural investment-to-GDP ratio of 15 percent for 2003-05 falls well below Brazil’s 48 percent. If one uses comparable narrow definitions, India’s investment-to-GDP ratio of 7 percent also falls below China’s 10 percent (Landes, 2008).

5 Growth and Equity Effects of Agricultural Marketing Efficiency Gains in India / ERR-89
Economic Research Service/USDA
The scale of most of India’s soybean-processing plants is in the range of •170 tons/day, far below the average capacity of U.S. plants (2,700 tons/day) and the even larger average capacity of new plants in Brazil and Argentina (Reca, 2003).
Only 1-2 percent of food products are sold through modern chain retail •establishments (U.S. Department of Agriculture, 2006).
The strong expansion of consumer food demand, along with improved national tax and credit conditions and implementation of agricultural marketing reform in some states, has improved the climate for investment in Indian agriculture since 2001. There is evidence of increased investment in modern food retailing by domestic and multinational firms (Landes, 2008; Reardon and Gulati, 2008). Findings from research on Indian agricultural markets indicate that these new private-sector initiatives could significantly improve marketing efficiency:
Vertical integration in India’s broiler industry is improving efficiency •in production and, particularly, marketing. Variable production costs averaged 10 percent lower and producer-to-retail marketing margins 60 percent lower in regions where vertical integration accounted for the largest shares of production (Landes et al., 2004).4
Domestic markets for wheat and rice are inefficient because of large •numbers of intermediaries, high physical losses, and disincentives for private investment (World Bank, 1999). The average producer-to-retail markup for unprocessed, ungraded, bulk wheat is estimated at 52 percent of the producer price in the private sector, with the producer-to-wholesale markup for the public-sector Food Corporation of India (FCI) estimated at 51 percent of the producer price (Gandhi and Koshy, 2007). Reducing the role of the FCI and increased investment by the private
4The marketing margin is the differ-ence between the retail and farm price.
Figure 1
Gross fixed capital formation (GFCF) in India as share of gross domestic product (GDP)
Percent of GDP
1Includes onfarm investment and off-farm investment in agriculture-related infrastructure.
2Includes only on-farm investments.
Source: Reserve Bank of India, Handbook of Statistics on the Indian Economy; Government of India, Ministry of Agriculture, 2003.
Total GFCF/total GDP
0
5
10
15
20
25
30
1970 75 80 85 90 95 2000 05
GFCF in and for agriculture/agricultural GDP1
GFCF in agriculture/agricultural GDP2

6 Growth and Equity Effects of Agricultural Marketing Efficiency Gains in India / ERR-89
Economic Research Service/USDA
sector have the potential to increase marketing efficiency and reduce costs (Jha et al., 2007).
Oilseed and product marketing costs in India are inflated because the •scale, technology, and capacity utilization rates of oilseed-processing plants are well below international standards. Efficiency gains associated with deregulation of marketing and processing of India’s major oilseeds have been estimated at 22-44 percent (World Bank, 1997).
The efficiency of India’s horticultural product markets is impeded by •high logistical costs, produce wastage rates of 20-40 percent, and low domestic quality standards. Indian growers, on average, receive 12-15 percent of the retail price of horticultural produce, compared with 30-40 percent in the United States, despite the little value that is added in the Indian market (Matoo et al., 2007).
Potential Implications of Marketing Efficiency Gains
The relatively low levels of efficiency in India’s agricultural marketing chains tax the output of Indian producers and the consumption of Indian consumers, but also offer a potential source of improved agricultural compet-itiveness and income growth over the longer term. Deregulation of agricul-tural markets, such as removal of private movement and storage restrictions, can benefit both producers and consumers by improving incentives for private investment in market infrastructure, new technology, and more effi-cient horizontally or vertically integrated agribusinesses. Producers stand to gain when improved marketing efficiency increases demand and prices for their products. Consumers can gain if more efficient wholesale and retail trade services reduce consumer prices.
The net effect of improvements in marketing efficiency on agricultural producer prices is, however, not clear cut. For producers, an efficiency-induced fall in the retail cost of food should increase quantity demanded and create upward pressure on producer prices. At the same time, this price increase could be offset by declines in producer prices as gains in marketing efficiency reduce the prices of intermediate agricultural inputs and therefore lower the costs of production. For consumers, purchase price declines associ-ated with more efficient marketing could be offset by upward price pressure from increased quantity demanded, particularly if demand is highly respon-sive to changes in price (price-elastic demand) and/or expanding supply through production or trade is inhibited by technical or resource constraints (price-inelastic supply). Across commodity sectors, marketing efficiency gains are likely to affect prices, output, and demand differently, depending on the sectors’ use of marketing services and potential for efficiency gains.

7 Growth and Equity Effects of Agricultural Marketing Efficiency Gains in India / ERR-89
Economic Research Service/USDA
The total—or economywide—impacts of increasing the efficiency of agri-cultural and food marketing may be substantial in a developing country like India because the agricultural sector accounts for a large share of economic activity and food accounts for a large share of household budget expendi-tures. Gains in farm output associated with higher farm prices may signifi-cantly affect aggregate supply of agricultural goods as well as all other goods and services and agricultural trade. Lower food prices for consumers can lead to potentially large economywide changes in consumption expenditures for food and other goods and in household savings and investment.
In addition to the potential for important impacts on aggregate produc-tion, consumption, and investment, more efficient agricultural and food marketing services also have the potential to benefit low-income consumers in particular. The distribution of benefits across income groups depends on differences in food budget shares across low- and high-income households, whether their food basket is composed of commodities associated with more or less use of marketing services, and differences in household income sources. A relatively large number of India’s poorest households are in rural areas, spend a relatively large share of income on food, and earn most of their income as either farmers or farm laborers. To the extent that improved marketing efficiency boosts farm prices and farm output, net sellers of food tend to gain. All net buyers of food tend to gain as consumer prices of food fall and labor demand and wages rise. Lower income rural and urban house-holds, which tend to allocate the largest shares of income to food and depend on wage income, stand to benefit more from marketing efficiency gains than higher income households. However, higher income households can also benefit from more efficient food marketing because they tend to purchase more of the types of foods associated with intensive use of marketing services, such as processed or retail convenience foods.

8 Growth and Equity Effects of Agricultural Marketing Efficiency Gains in India / ERR-89
Economic Research Service/USDA
Estimated Costs of Marketing Agricultural and Food Products
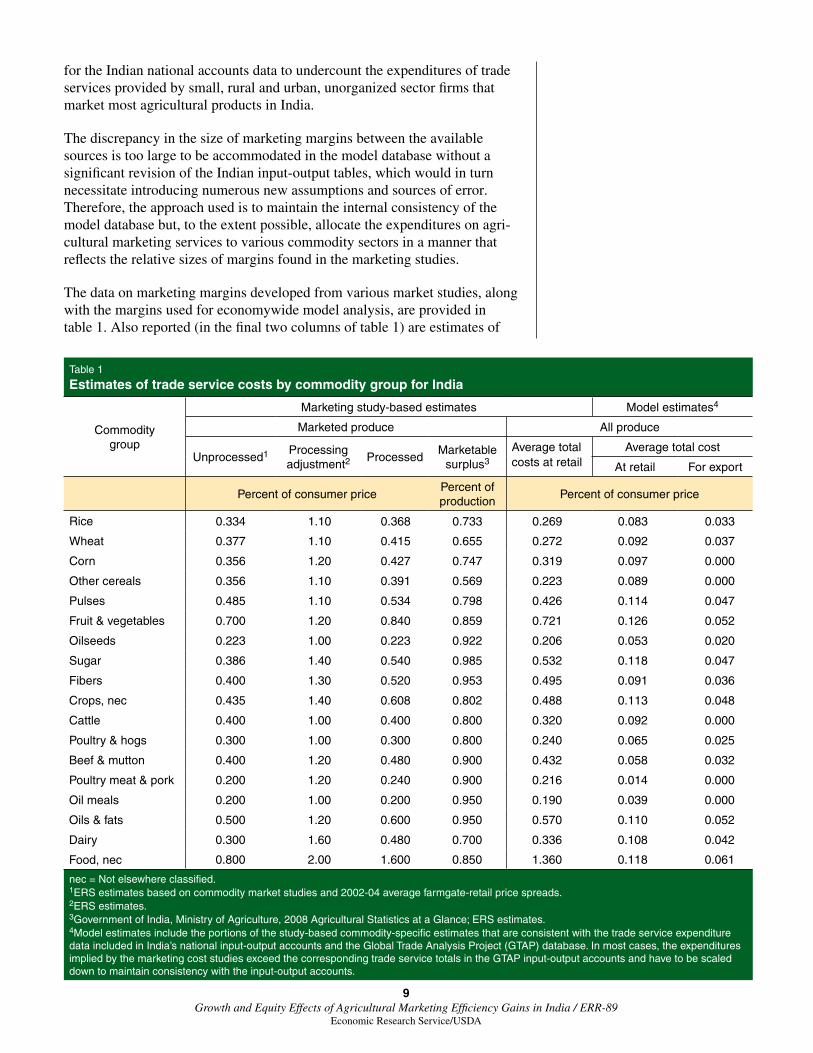
The costs of wholesale and retail marketing services are embedded in the purchase prices paid by firms for intermediate inputs, by households for private consumption, by government and investors for purchases of agricul-tural goods, and for exports. We use multiple sources to develop a dataset of estimated current agricultural and food marketing costs for domestic and export sales on a commodity basis.5 For the purpose of general equilibrium economic modeling, it is necessary to have comprehensive, internally consis-tent data that describe the input and output relationships of firms’ technolo-gies and the economywide flows of income and expenditures. In this case, we also require consistent data on the supply and demand for wholesale and retail trade services for major agricultural products. We drew primarily on the internally consistent data on the Indian economy—including total expen-ditures on wholesale and retail trade services by each category of demand—from the 2001 India database (version 6) of the Global Trade Analysis Project (GTAP).6
In the GTAP data, as in the Indian national accounts on which they are based, purchasers’ expenditures on each good are reported net of marketing costs and only total trade marketing service expenditures are reported for each category of demand (intermediate, households, government, invest-ment, and exports). These trade service data cover the full range of marketing formats in both urban and rural areas. They include the public sector’s role in marketing some food products; the small, private, “organized” sector composed of relatively large-scale retail outlets, such as supermarkets; and the marketing services provided by India’s large, private “unorganized” trading sector composed of myriad small shops, stalls, open markets, and bazaars (Government of India, Ministry of Statistics and Programme Implementation, 2000, 2007). Note that, within the dataset, private-own-consumption of agricultural goods—which accounts for the largest share of the goods produced and consumed by Indian farm households—is assumed to have no associated marketing costs. India has many small farmers—about 81 percent of all operational holdings, accounting for about 39 percent all farmland, are 2 hectares or less—and home consumption is estimated to account for significant shares of total use of most crops (Government of India, Ministry of Agriculture, 2008).
To disaggregate total expenditures on marketing services by each purchaser into marketing margins paid for each commodity, we relied on a combination of judgment and findings from recent studies of India’s food grain, oilseed, poultry, and horticultural product markets. A major inconsistency had to be reconciled, however, between the data on total expenditures on marketing services reported in the GTAP data (and the Indian national accounts) and the much larger expenditures on marketing margins reported in the commodity market studies. One reason for the inconsistency is that the Indian national accounts data implicitly average in the zero margins for on-farm consump-tion—goods that do not enter the marketplace. A second reason may be the inaccuracy of the marketing cost data from the various marketing studies that are often based on available data for a few markets or regions that may not represent national average data. A third reason could be a possible tendency
5Author calculations to develop esti-mated marketing margins are described in further detail in Appendix 1.
6GTAP database development for each country or region combines cur-rent international data on trade flows, applied tariffs, agricultural subsidies, macroeconomic indicators, and energy use with contributed national input-output tables to create a balanced, internally consistent global database for a specified base year. The GTAP v6 database used in this study incorporates India’s 1993-94 national input-output table contributed by Chadha and Pratap (2006) in a balanced global database for 2001.
9 Growth and Equity Effects of Agricultural Marketing Efficiency Gains in India / ERR-89
Economic Research Service/USDA
for the Indian national accounts data to undercount the expenditures of trade services provided by small, rural and urban, unorganized sector firms that market most agricultural products in India.
The discrepancy in the size of marketing margins between the available sources is too large to be accommodated in the model database without a significant revision of the Indian input-output tables, which would in turn necessitate introducing numerous new assumptions and sources of error. Therefore, the approach used is to maintain the internal consistency of the model database but, to the extent possible, allocate the expenditures on agri-cultural marketing services to various commodity sectors in a manner that reflects the relative sizes of margins found in the marketing studies.
The data on marketing margins developed from various market studies, along with the margins used for economywide model analysis, are provided in table 1. Also reported (in the final two columns of table 1) are estimates of
Table 1 Estimates of trade service costs by commodity group for India
Commodity group
Marketing study-based estimates Model estimates4
Marketed produce All produce
Unprocessed1 Processing adjustment2
ProcessedMarketable
surplus3 Average totalcosts at retail
Average total cost
At retail For export
Percent of consumer pricePercent of production
Percent of consumer price
Rice 0.334 1.10 0.368 0.733 0.269 0.083 0.033
Wheat 0.377 1.10 0.415 0.655 0.272 0.092 0.037
Corn 0.356 1.20 0.427 0.747 0.319 0.097 0.000
Other cereals 0.356 1.10 0.391 0.569 0.223 0.089 0.000
Pulses 0.485 1.10 0.534 0.798 0.426 0.114 0.047
Fruit & vegetables 0.700 1.20 0.840 0.859 0.721 0.126 0.052
Oilseeds 0.223 1.00 0.223 0.922 0.206 0.053 0.020
Sugar 0.386 1.40 0.540 0.985 0.532 0.118 0.047
Fibers 0.400 1.30 0.520 0.953 0.495 0.091 0.036
Crops, nec 0.435 1.40 0.608 0.802 0.488 0.113 0.048
Cattle 0.400 1.00 0.400 0.800 0.320 0.092 0.000
Poultry & hogs 0.300 1.00 0.300 0.800 0.240 0.065 0.025
Beef & mutton 0.400 1.20 0.480 0.900 0.432 0.058 0.032
Poultry meat & pork 0.200 1.20 0.240 0.900 0.216 0.014 0.000
Oil meals 0.200 1.00 0.200 0.950 0.190 0.039 0.000
Oils & fats 0.500 1.20 0.600 0.950 0.570 0.110 0.052
Dairy 0.300 1.60 0.480 0.700 0.336 0.108 0.042
Food, nec 0.800 2.00 1.600 0.850 1.360 0.118 0.061
nec = Not elsewhere classified.1ERS estimates based on commodity market studies and 2002-04 average farmgate-retail price spreads.2ERS estimates.3Government of India, Ministry of Agriculture, 2008 Agricultural Statistics at a Glance; ERS estimates.4Model estimates include the portions of the study-based commodity-specific estimates that are consistent with the trade service expenditure data included in India’s national input-output accounts and the Global Trade Analysis Project (GTAP) database. In most cases, the expenditures implied by the marketing cost studies exceed the corresponding trade service totals in the GTAP input-output accounts and have to be scaled down to maintain consistency with the input-output accounts.

10 Growth and Equity Effects of Agricultural Marketing Efficiency Gains in India / ERR-89
Economic Research Service/USDA
conversion factors and marketable surplus ratios used to adjust the market study data for processing and on-farm consumption. For all commodities, the marketing margins that are consistent with the findings of various market studies were scaled down to meet the constrained totals in the balanced economywide database. Margins are estimated separately for domestic sales and exports. Overall, the estimates for the domestic commodity marketing margins used in this analysis—constrained by the level of total market service expenditures in Indian national accounts—average about 21 percent of those based on the findings of commodity market studies. The estimated marketing margins for export sales, scaled to the control total in the model database, are smaller than those for domestic sales and reflect that marketing margins for export sales do not span the full farm-to-retail supply chain. Because of the downward scaling, the model data may understate the size of India’s actual agricultural marketing margins and the impacts of improved marketing efficiency.
The marketing margin estimates are marketing services costs as a percentage of the retail price. Estimated margins are relatively low for primary agricul-tural products, such as rice and wheat, which are often consumed on farm and often minimally processed (fig. 2). Estimated marketing margins for domestic sales are highest for dairy, fresh fruits and vegetables, processed foods, and sugar. The export margins are highest for fresh fruits and vegeta-bles, other processed foods, pulses, and crops not elsewhere classified.7
Although the available data provide a basis for differentiating marketing margins across the commodity sectors, they do not permit differentiating marketing costs and margins for the various categories of consumers, such as rural or urban location and high- or low-income. We, therefore, assume a uniform marketing margin across domestic demand categories for each commodity. As a result, to the extent that urban and/or higher income consumers tend to purchase relatively more marketing services, the data may understate those expenditures. Similarly, to the extent that low-income and/or rural consumers tend to buy fewer marketing services, the data may overstate their expenditures.
7See appendix 1 for more detail on how these marketing costs by commodity were estimated.
Figure 2
Estimated agricultural marketing margins in India
Marketing services/retail price
nec = Not elsewhere classified.
Source: Saluja and Yadav, 2006; Global Trade Analysis Project Version 6 database; author calculations.
ExportDomestic
0
2
4
6
8
10
12
14
Rice
Whe
at
Corn
Oth
er g
rain
sPul
ses
Frui
t and
veg
etab
les
Oils
eeds
Oils
eed
mea
lsO
il and
fats
Sugar
Fibe
rsCro
ps, n
ec
Cattle
and
she
epPou
ltry
and
hogs
Beef a
nd m
utto
n
Poultr
y an
d po
rk
Dairy
and
pro
duct
sO
ther
food
s

11 Growth and Equity Effects of Agricultural Marketing Efficiency Gains in India / ERR-89
Economic Research Service/USDA
Household Income and Expenditure Patterns
In the context of the recent poor performance of India’s rural sector and the implications for poverty reduction, policymakers are likely to be particu-larly concerned about how various types of households, particularly rural and low-income households, are likely to gain or lose from a policy change. The distribution of outcomes across households is determined by the diver-sity in their sources of income and by the composition of their spending. To explore the impacts of marketing efficiency gains across households, we use a database developed by Saluja and Yadav (2006) to disaggregate the GTAP data—which describe a single aggregate household—into multiple house-holds defined by rural or urban location and by income class. The Saluja and Yadav database describes 10 household types in India, 5 urban (U) and 5 rural (R), each with 5 expenditure classes: abject poverty (R1, U1); poverty (R2, U2); middle income (R3, U3); upper income (R4, U4); and high income (R5, U5). We use the income classes defined by Saluja and Yadav to disag-gregate the single aggregate household in the GTAP data to the same 10 household types.8
In the model database, expenditures on food, comprised of primary agri-cultural products and processed foods and their related marketing margins, account for 47 percent of India’s private consumption expenditures on goods and services (excluding expenditures on savings and taxes). In general—and as expected in a developing country like India—food accounts for a larger share of expenditure by rural households than by urban households, and poorer households spend proportionately more on food than do wealthier households, in both rural and urban areas (fig. 3). Also as expected, the composition of food expenditures varies across income. In general, poor households consume more whole grains and other unprocessed agricultural products than do high-income households. At higher incomes, households consume more dairy, poultry, and other processed foods, as opposed to primary agricultural products (fig. 4).
8See appendix 1 for a detailed discus-sion of how the household data were disaggregated.
Figure 3
Composition of Indian household consumption expenditures by household type
Percent of expenditures
R = Rural; U = Urban; R1, U1 = Abject poverty; R2, U2 = Poverty; R3, U3 = Middle income; R4, U4 = Upper income; R5, U5 = High income.
Source: Saluja and Yadav, 2006; Global Trade Analysis Project Version 6 database.
Primary agricultureProcessed foodManufactured goodsServices
0102030405060708090
100
R1 U4U3U2U1R5R4R3R2 U5Household type

12 Growth and Equity Effects of Agricultural Marketing Efficiency Gains in India / ERR-89
Economic Research Service/USDA
Marketing costs for agricultural and food products in India account for a substantial proportion of household expenditures—about 5 percent of total Indian household spending on all goods and services. For all households, expenditures on marketing services are about 11 percent of the food budget. Across households, the share of total household expenditures on food marketing services tends to fall as household incomes rise, a pattern that reflects the declining share of food expenditures in the household budget as incomes rise (fig. 5). Within the food expenditure basket, however, the share of spending on marketing services rises as household incomes rise (fig. 6).9 This pattern reflects the shift toward consuming goods with higher marketing costs as household incomes rise. Lower income households, in contrast, tend
9The exception to this pattern is the highest income urban households (U5), where the share of household food expenditures spent on food marketing services is relatively low. The likely explanation is that these, generally larger, households purchase relatively large amounts of food that require little processing or other marketing services, perhaps to meet the requirements of large extended families and/or house-hold servants.
Figure 4
Composition of Indian household expenditures on food by household type
Percent of food expenditures
nec = Not elsewhere classified; R = Rural; U = Urban; R1, U1 = Abject poverty; R2, U2 = Poverty; R3, U3 = Middle income; R4, U4 = Upper income; R5, U5 = High income.
Source: Saluja and Yadav, 2006; Global Trade Analysis Project Version 6 database.
Food grainsFruits and vegetablesOilseeds and products
R1 U4U3U2U1R5R4R3R2 U5
SugarMeat and productsDairy productsCrops and food, nec
0102030405060708090
100
Household type
Figure 5
Food marketing costs in India as share of total household consumption expenditures by household type
Percent of consumption expenditures
R = Rural; U = Urban; R1, U1 = Abject poverty; R2, U2 = Poverty; R3, U3 = Middle income; R4, U4 = Upper income; R5, U5 = High income.
Source: Saluja and Yadav, 2006; Global Trade Analysis Project Version 6 database; author calculations.
R1 U4U3U2U1R5R4R3R2 U50
1
2
3
4
5
6
7
Household type

13 Growth and Equity Effects of Agricultural Marketing Efficiency Gains in India / ERR-89
Economic Research Service/USDA
to consume unprocessed agricultural products with relatively low marketing costs.
Indian households also differ in their sources of income—returns from land, labor, and capital. Wages are the more important income source for poorer households in India, with the role of capital and land-based earnings rising with income (fig. 7). Any changes in wage incomes are therefore likely to have the most impact on lower income rural and urban households, whereas changes in returns to capital—and to land—will be felt mostly by higher income households.
Figure 7
Sources of income for Indian households by household type
$U.S. billions
R = Rural; U = Urban; R1, U1 = Abject poverty; R2, U2 = Poverty; R3, U3 = Middle income; R4, U4 = Upper income; R5, U5 = High income.
Source: Saluja and Yadav, 2006; Global Trade Analysis Project Version 6 database.
LandLaborCapital
R1 U4U3U2U1R5R4R3R2 U50
20
40
60
80
100
120
Household type
Figure 6
Food marketing costs in India as share of household food consumption expenditures by household type
Percent of food expenditures
R = Rural; U = Urban; R1, U1 = Abject poverty; R2, U2 = Poverty; R3, U3 = Middle income; R4, U4 = Upper income; R5, U5 = High income.
Source: Saluja and Yadav, 2006; Global Trade Analysis Project Version 6 database; author calculations.
R1 U4U3U2U1R5R4R3R2 U510.4
10.6
10.8
11.0
11.2
11.4
11.6
11.8
Household type

14 Growth and Equity Effects of Agricultural Marketing Efficiency Gains in India / ERR-89
Economic Research Service/USDA
Household savings and tax rates differ substantially across Indian house-holds. Savings rates are either negative or negligible in lower income rural and urban households but rise with income: The highest income rural (R5) and urban households (U5) save 33 percent and 23 percent of their respective after-tax incomes (fig. 8). Tax expenditures are relatively low for all Indians but tend to be highest in middle-income rural and urban households.
Figure 8
Indian household consumption, savings, and taxes by household type
$U.S. billions
R = Rural; U = Urban; R1, U1 = Abject poverty; R2, U2 = Poverty; R3, U3 = Middle income; R4, U4 = Upper income; R5, U5 = High income.
Source: Saluja and Yadav, 2006; Global Trade Analysis Project Version 6 database.
ConsumptionSavingsTaxes
R1 U4U3U2U1R5R4R3R2 U5-10
10
30
50
70
90
110
Household type

15 Growth and Equity Effects of Agricultural Marketing Efficiency Gains in India / ERR-89
Economic Research Service/USDA
Impacts of Potential Marketing Efficiency Gains
The analytical framework used in this study is a single-country, computable general equilibrium (CGE) model developed by the International Food Policy Research Institute (Löfgren et al., 2002). The model explicitly accounts for marketing margins as a fixed input-output quantity ratio between wholesale and retail marketing services and the sale of domestically produced food and agricultural goods in domestic and export markets. The purchase price for food and agricultural commodities in domestic and export markets is defined as the sum of the producer price plus the cost of the marketing service, plus any sales tax. Any change in the cost of marketing services directly affects the commodity purchase price, and through the demand response and changing intermediate input costs, may also affect the producer price.
The potential impacts of efficiency gains are analyzed in the model by imposing a 50-percent increase in total primary factor productivity in the production of wholesale and retail trade services used for food and agricul-tural commodities. This 50-percent increase implies that the same quantity of labor and capital inputs used to produce marketing services now gener-ates 50 percent more output, thus reducing the costs of wholesale and retail marketing services. These efficiency gains are assumed to result from increased investment, improved technology, and enhanced integration in agricultural supply chains as rising consumer demand and domestic regula-tory reform improve the climate for agribusiness investment and productivity growth.
We impose a relatively large increase in marketing productivity because of the evidence that the scope for efficiency gains is substantial and because the model data may understate existing marketing costs in the farm sector. The 50-percent productivity increase is equivalent to a compound annual productivity growth of about 4.5 percent over about 10 years, a timeframe compatible with a medium-run outcome in which land, labor, and capital markets fully adjust to the productivity gain. Although we expect the scope for marketing efficiency gains to vary by commodity, for simplicity—and due to lack of good detailed information by sector—we assume the same productivity gain across all food and agricultural commodities. A 50-percent increase in productivity may not be feasible in all sectors, but the anecdotal information derived from studies of India’s food grain, oilseed, poultry, and fruit and vegetable industries suggests that it is a plausible overall average.
Economywide Impacts
The assumed improvement in marketing efficiency raises real GDP by 1 percent, reflecting the increased productivity of India’s fixed aggregate factor supplies in providing marketing services (table 2). The scenario also gener-ates a 1.4-percent increase in real household consumption—a welfare indi-cator that accounts for changes in the quantities of household consumption valued at base period prices. Additionally, improved marketing efficiency generates increases in investment that could increase future economywide output and consumption, although these dynamic impacts are not captured in the model. At the economywide level, the scenario has a small but positive impact on the producer price index, but implications for prices become more important when the focus shifts to the agricultural commodity sectors.

16 Growth and Equity Effects of Agricultural Marketing Efficiency Gains in India / ERR-89
Economic Research Service/USDA
Other economywide impacts include more government tax revenues associ-ated with increased GDP and a small increase in the aggregate demand for imports (although demand for agricultural imports falls). Import growth leads to a small depreciation of the real exchange rate and an increase in aggregate exports. Wages and rental rates for land and capital increase in the scenario, driven by higher factor demand and the model assumption that labor and the other primary factors are fully employed. In the India case, however, labor unemployment and underemployment are substantial. Therefore, an alterna-tive interpretation of the labor market result is that the upward pressure on wages in the labor market could increase employment and/or reduce under-employment instead of increasing wages. In this event, the increase in GDP would be even larger as more of India’s productive factors are put to use.
Agricultural Sector Impacts
Increased efficiency in wholesale and retail marketing of agricultural and food products significantly affects producer and sales prices of domestic agricultural and food products (table 3). The reduction in marketing costs between producers and consumers reduces consumer prices and raises demand for most agricultural and food products. Greater demand increases production and producer prices for most agricultural and food products; the gains in marketing efficiency, therefore, are shared between producers and consumers. The largest production gains tend to be in such categories as oilseeds and products, sugar, dairy, and processed products (food, not else-where classified), which mostly have relatively high marketing costs (fig. 9).
Table 2 Aggregate impacts of efficiency gains in agricultural and food marketing in India
Variable50% increase in total factor productivity
in agricultural and food marketing
Percent change from base
Real gross domestic product 1.0
Real household consumption 1.4
Real investment demand 0.4
Government revenue 1.0
Producer price index 0.4
Land rents 5.6
Wages 1.6
Capital rents 0.1
Exports 0.7
Agricultural exports 3.9
Imports 0.7
Agricultural imports -0.9
Exchange rate - rupees/U.S. dollar 0.7
Source: ERS model results.

17 Growth and Equity Effects of Agricultural Marketing Efficiency Gains in India / ERR-89
Economic Research Service/USDA
The rise in farm output associated with marketing efficiency gains further increases India’s normally substantial positive agricultural trade balance. Agricultural exports, which include a broad array of grain, oilseed, horticul-tural, and animal products, rise about 4 percent, whereas imports—dominated by edible oils and pulses—fall about 1 percent. Note that these results for trade, as well as for other variables, account only for medium-term adjust-ments to greater marketing efficiency and not for the longer term impacts of higher, sustained economic growth on food demand and trade.
Table 3 Price effects of efficiency gains in agricultural and food marketing in India
Selected sectors
50% increase in total factor productivity in agricultural and food marketing
Producer price Consumer price
Percent change from base
Rice 1.2 -0.8
Wheat 1.8 -0.5
Corn 2.2 -0.2
Fruit and vegetables 2.3 -1.0
Oils, fats 0.4 -2.1
Sugar 1.0 -1.8
Fibers 2.4 -0.1
Poultry and pork 2.7 0.6
Dairy products 1.9 -0.7
Food products, nec -0.1 -4.0
Source: ERS model results.
Figure 9
Production impacts of agricultural and food marketing efficiency gains in India
Percent change from base
nec = Not elsewhere classified.
Source: ERS model results.
0
1
2
3
4
5
6
7
RiceW
heat
Corn
Frui
t and
veg
etab
les
Oils
eeds
Oil m
eal
Oil a
nd fa
tsSug
arFi
bers
Poultr
y an
d ho
gs
Dairy
Food
, nec
Food
reta
il tra
de

18 Growth and Equity Effects of Agricultural Marketing Efficiency Gains in India / ERR-89
Economic Research Service/USDA
Household Impacts: Income and Rural/Urban Distribution
How the impacts are distributed across households hinges on how price changes affect the costs of the bundles of goods and services purchased by households and how changes in returns to land, labor, and capital affect earn-ings by rural and urban households at different income levels. The results indicate that all households benefit from marketing efficiency gains, which reduce consumer prices of most food items. Lower income households benefit primarily because they allocate a larger share of their expenditures to food (fig. 10). Higher income households also benefit because they tend to spend more than lower income households on foods, such as dairy products, that use larger amounts of marketing services.
Income gains tend to favor rural households and poor households in both urban and rural areas because wages rise more than do returns to capital. And, for rural households—whether low- or high-income—higher earnings are driven by increased returns to land associated with higher farm output.
The gains to rural households may be overstated and the gains to urban households understated by the model because the underlying data on marketing margins are an average of on-farm consumption, which does not incur marketing costs, and marketed consumption, which does incur marketing costs. To the extent that lower income rural—but not urban—households spend less than the average marketing costs on goods in their expenditure baskets, their estimated gains are overstated. Similarly, the impacts on higher income households, both rural and urban, are understated to the extent that they purchase products with higher-than-average marketing costs for a given product category. Although it is important to realize these potential biases in the results, the size of the estimated gains for both rural and urban low-income households suggests that the gains would remain substantial even if these data deficiencies could be corrected.
Figure 10
Effects on household real consumption of agricultural and food marketing efficiency gains in India by household type
Percent change from base
R = Rural; U = Urban; R1, U1 = Abject poverty; R2, U2 = Poverty; R3, U3 = Middle income; R4, U4 = Upper income; R5, U5 = High income.
Source: ERS model results.
R1 U4U3U2U1R5R4R3R2 U5
Household type
0.0
0.5
1.0
1.5
2.0

19 Growth and Equity Effects of Agricultural Marketing Efficiency Gains in India / ERR-89
Economic Research Service/USDA
Comparing the Impacts of Increased Marketing Efficiency With Agricultural Input Subsidy and Tariff Reform
Reform of India’s agricultural subsidy and tariff policies have been topics of debate by Indian policymakers and trade partners since at least the early 1990s. Rising input subsidy outlays are often criticized for causing factor market distortions and diverting public resources from productive invest-ments, but they have been sustained and even enlarged because of concerns for the welfare of India’s many small-scale farmers. India’s high agricultural tariffs are challenged in the current multilateral negotiations and elsewhere for imposing high costs on consumers and hindering longer term competi-tiveness, but liberalizing reforms are also strongly resisted largely because of concerns with farmer welfare.
The goal of comparing subsidy and tariff reform with increased agricultural and food marketing efficiency is to assess and compare their effects on the economy, commodity sectors, and households. These broad areas of agricul-tural policy reform offer a general representation of the policies that might be adopted in India, but they are not necessarily comparable in terms of the magnitude of their impacts.
India’s Agricultural Subsidies
The cost of India’s major agricultural input subsidies for electrical power, fertilizer, and irrigation water has grown about 6 percent annually in real terms since 1990, reaching nearly Rs500 billion (about $10 billion) in 2002/03 (fig. 11) (Mullen et al., 2005; Gulati and Narayanan, 2003). The cost of providing free or subsidized (depending on the state) electricity for agriculture accounts for more than two-thirds of total input subsidies, as well as most of the growth since 1990. Irrigation is a key factor in boosting crop yields, but the policy of subsidizing electricity is also now widely acknowledged to be promoting inefficiency in water use and overpumping of groundwater. Fertilizer subsidies are provided to farmers in the form of price subsidies for domestic and imported fertilizers and to the fertilizer industry in the form of preferential prices to offset the losses of higher cost plants. For this study, we include only subsidies going to farmers, which amounted to about Rs70 billion ($1.4 billion) in 2002/03 and have tended to decline since the mid-1990s. Subsidies for canal irrigation water were about Rs60 billion ($1.2 billion) in 2002/03 but have shown little growth.
The rising outlays for input subsidies, which were equivalent to about 11 percent of total agricultural output in 2002/03, are of growing concern for Indian policymakers. By comparison, public investment in agriculture and agricultural infrastructure amounted to just 5 percent of agricultural GDP in 1999-2000 (the most recent period available) and has shown relatively slug-gish real annual growth of less than 1 percent since 1990. Although reform of India’s subsidy policies would potentially make available more public resources for productive investments in irrigation, research, market services, and infrastructure, withdrawing the subsidies has proven difficult because of their popularity with rural voters and, in the case of power and water subsi-dies, the state governments that administer them.

20 Growth and Equity Effects of Agricultural Marketing Efficiency Gains in India / ERR-89
Economic Research Service/USDA
The Government of India has also been incurring substantial and rising budgetary costs for operating the system of minimum support prices (MSPs), public distribution, and storage for wheat and rice. The real cost of what is called the “food grain subsidy” has climbed steadily since the late 1990s, reaching an average of Rs242 billion ($5.5 billion) during 2004/05-2006/07 (Government of India, Ministry of Finance, 2008). Rising costs have stemmed from increased government procurement and storage costs associ-ated with defending higher support prices and with introducing new and more highly subsidized distribution programs for poor and disadvantaged groups.
Despite these substantial and rising costs, the food grain subsidy is not specifically included in the data and subsidy-reduction scenario used in this study for two reasons. First, the system of supporting MSPs is combined with border policies, such as export restrictions, and domestic measures, such as levies on rice millers and grain movement restrictions, that can also tax producers. Calculations of producer subsidy equivalents (U.S. Department of Agriculture, 1994) and producer support estimates (Mullen et al., 2005) that incorporate careful comparisons of world prices and Indian domestic prices show that these policies net out as subsidies in some years and taxes in others. According to this evidence, there is no clear rationale for character-izing the bundle of expenditures and policies called the food grain subsidy as a subsidy (or tax) on producers. Second, India’s domestic marketing costs are an important factor in assessing levels of market price support, and the impacts of these costs are already being studied separately.
India’s Agricultural Tariffs
India completed the elimination of quantitative restrictions on agricultural imports in 2001 but maintains relatively high bound tariffs on most agricul-tural commodities (fig. 12). Reductions in India’s agricultural tariffs have
Figure 11
Major Indian agricultural input subsidies, 2001
$U.S. billions
Source: Global Trade Analysis Project Version 6 database; author calculations.
-0.20.00.20.40.60.81.01.21.41.61.8
FertilizerPowerIrrigation
Rice
Whe
at
Corn
Oth
er g
rain
sPul
ses
Frui
t and
veg
etab
les
Oils
eeds
Sugar
Fibe
rsO
ther
cro
ps

21 Growth and Equity Effects of Agricultural Marketing Efficiency Gains in India / ERR-89
Economic Research Service/USDA
been an important target of the United States and other trading partners in bilateral and multilateral settings, including the current Doha Round.
India remains reluctant to commit to reducing bound agricultural tariffs that afford protection to its large number of small-scale farmers and agribusi-nesses. However, the government has made unilateral reductions in applied rates to facilitate imports and contribute to increased price stability for commodities in short supply, including pulses, vegetable oils, and, most recently, wheat (Landes, 2008). There is evidence that reductions in at least some currently prohibitive tariffs could yield a significant boost to industries, such as oilseed processing, that lack access to raw materials and to producers who are now isolated from world market prices (Persaud and Landes, 2006). However, in a number of cases, such as rice, oil meals, fruits and vegetables, and poultry meat, India has high applied tariffs on goods for which domestic prices are typically competitive in regional or global markets in order to assure adequate protection and bargaining strength with trading partners. In these cases, tariff reductions would have little or no impact on import demand. The model addresses the impacts of tariff changes by treating imported and exported products separately from domestic goods, thus limiting the impact of tariff reductions on the Indian goods, which, despite high tariffs, tend to have relatively low internal prices and import demand.
Recent studies by Ganesh-Kumar et al. (2006) and Polaski et al. (2008) of the potential impacts of agricultural trade liberalization on the agricultural sector as a whole have indicated that, in the short run, the benefits to India from participating in a global agricultural reform agenda would be positive but modest. Polaski et al. stress the importance of setting negotiating terms that balance the interests of India’s poor households with the benefits of improved efficiency and market opportunities.
Figure 12
Indian applied agricultural import tariffs, 2001
Percent ad valorem
nec = Not elsewhere classified.
Source: Global Trade Analysis Project Version 6 database.
0
20
40
60
80
100
120
140
Ric
eW
heat
Cor
nO
ther
gra
inPu
lses
Frui
ts a
nd v
eget
able
sO
ilsee
dsO
ilmea
lsFa
ts/o
ilsSu
gar
Fibe
rsC
rops
nec
Cat
tle a
nd s
heep
Poul
try a
nd h
ogs
Beef
and
mut
ton
Poul
try a
nd p
ork
Dai
ry p
rodu
cts
Food
s ne
c
Beve
rage
/toba
cco

22 Growth and Equity Effects of Agricultural Marketing Efficiency Gains in India / ERR-89
Economic Research Service/USDA
Scenario Comparisons
The subsidy reform scenario simulates removal of all agricultural input subsi-dies, and the tariff reform scenario simulates the removal of all agricultural tariffs. Because the effects of the subsidy and tariff reform scenarios and the increased marketing efficiency scenarios are not necessarily comparable in terms of magnitude, our discussion focuses on the patterns of their effects on the economy and across commodities and households.
The removal of agricultural input subsidies leads to a relatively small increase in real GDP (fig. 13), but higher producer and consumer prices for staple food commodities, particularly for grains and fibers, which receive the bulk of input subsidies (figs. 14 and 15), cause aggregate real house-hold consumption to fall.10 Producer and consumer prices of nonsubsidized commodities fall because of an overall decline in consumer expenditures and a shift in land use away from crops that lose subsidies.
The decline in agricultural production reduces agricultural employment and economywide wages. However, the substantial government savings from eliminating subsidies boost national savings and investment, thus improving prospects for future growth in output, employment, and consumption—dynamic effects that are not accounted for in our static framework. With lower factor returns and higher prices for food staples (wheat and rice), at least in the near term, real consumption declines for all household types (fig. 16). Consumption losses are greatest in poorer and rural households, reflecting the combination of lower returns to land and labor and substan-tially higher prices for food staples.
When agricultural tariffs are removed, the more efficient allocation of resources leads to growth in real GDP and increases in the returns to labor and capital and in aggregate real household consumption. But, the decline in government tax revenue in this scenario causes aggregate savings and investment to fall. The removal of agricultural tariffs has minor impacts on overall producer and consumer prices and farm output, reflecting relatively
10See appendix 3 for complete numeri-cal results from the scenarios.
Figure 13
Economywide effects of alternative agricultural and food marketing policy scenarios in India
Source: ERS model results.
Eliminate agricultural tariffs
Eliminate input subsidies
50% increase in marketing efficiency
Percent change from base
-6.0 -4.0 -2.0 0.0 2.0 4.0 6.0
Capital rents
Wages
Land rents
Producer price index
Real investment demand
Real household consumption
Real gross domestic product

23 Growth and Equity Effects of Agricultural Marketing Efficiency Gains in India / ERR-89
Economic Research Service/USDA
competitive domestic prices and generally small amounts of trade in such sectors as food grains, fruits and vegetables, fibers, and dairy. However, more heavily protected sectors with less competitive domestic prices, including fats and oils and poultry, face potentially significant producer
Figure 14
Producer price effects of alternative agricultural and food marketing policy scenarios in India
nec = Not elsewhere classified.
Source: ERS model results.
Eliminate agricultural tariffs
Eliminate input subsidies
50% increase in marketing efficiency
Percent change from base
-6 -4 -2 0 2 4 6 8 10
Food, nec
Dairy
Poultry and pork
Fibers
Sugar
Oils and fats
Fruits and vegetables
Wheat
Rice
Corn
Figure 15
Consumer price effects of alternative agricultural and food marketing policy scenarios in India
nec = Not elsewhere classified.
Source: ERS model results.
Eliminate agricultural tariffs
Eliminate input subsidies
50% increase in marketing efficiency
Percent change from base
Food, nec
Dairy
Poultry and pork
Fibers
Sugar
Oils and fats
Fruits and vegetables
Wheat
Rice
Corn
-35 -30 -25 -20 -15 -10 -5 0 5 10

24 Growth and Equity Effects of Agricultural Marketing Efficiency Gains in India / ERR-89
Economic Research Service/USDA
price and output shocks when tariffs are removed. Higher returns to labor and capital lead to increased real consumption by all rural and urban households. Consumption gains are largest in lower income households, driven by higher wages, relatively small increases in staple food prices, and significant consumer price declines for highly protected items, particularly fats and oils.
Comparisons across the three scenarios suggest that improved agricultural and food marketing efficiency can increase returns to land and labor and significantly boost aggregate real consumption relative to the other scenarios. The magnitude and distribution of household consumption gains associated with improved marketing efficiency are similar to those in the tariff removal scenario but in sharp contrast to the potentially adverse consequences of subsidy removal, at least in the near term. Unlike the subsidy and tariff reform scenarios, improvements in marketing efficiency have the potential to provide price benefits to both producers and consumers, particularly lower income and rural households. In contrast, the results suggest that removing subsidies could substantially raise consumer prices for food staples, while lowering tariffs could substantially reduce production in currently protected sectors, such as oilseed products, poultry, and processed foods.
Finally, although the model does not account for dynamic changes in savings and investment over time, the scenarios differ substantially in their implications for economywide savings, investment, and future growth. The marketing efficiency scenario suggests modest increases in savings and investment, tariff elimination reduces savings and investment, and the removal of subsidies generates substantial gains in government savings and investment. A dynamic framework that accounts for the effects of investment on economic growth would likely indicate stronger growth benefits from improved marketing efficiency and reduced subsidies compared with that arising from the removal of trade-distorting tariffs.
Figure 16
Household real consumption effects of alternative agricultural and food marketing policy scenarios in India
Percent change from base
R = Rural; U = Urban; R1, U1 = Abject poverty; R2, U2 = Poverty; R3, U3 = Middle income; R4, U4 = Upper income; R5, U5 = High income.
Source: ERS model results.
R1 U4U3U2U1R5R4R3R2 U5Household type
-3.5
-2.5
-1.5
-0.5
0.5
1.5
2.5
3.5 Eliminate agricultural tariffs
Eliminate input subsidies
50% increase in marketing efficiency

25 Growth and Equity Effects of Agricultural Marketing Efficiency Gains in India / ERR-89
Economic Research Service/USDA
Conclusions
The results suggest that measures to improve agricultural marketing effi-ciency in India, perhaps including strengthening public and private marketing institutions and improving the regulatory climate for private agribusi-ness investment, may substantially and broadly benefit India’s economy. Advances in marketing efficiency are shown to have the potential not only to increase income and employment economywide, but to provide positive price impacts for both agricultural producers and consumers and benefits to all households—particularly for rural and low-income households.
In a broader sense, the results also suggest the potential for greater invest-ment and efficiency in India’s agricultural markets to be a source of enhanced agricultural growth, trade, and competitiveness over the longer term. Whether new policies lead to rapid investment by modern retailers and others in transforming markets or the process occurs gradually, the results suggest that improvements in domestic marketing efficiency, although boosting food demand, may also strengthen agricultural exports and reduce imports. However, these results neither account for changes in food and feed demand that are likely to occur as higher income growth is sustained over the longer term nor account for constraints on crop and livestock production that may emerge with increased land use intensity, yields, and feed demand.
Finally, this analysis highlights the dilemma of Indian policymakers as they face domestic and international pressures for subsidy and tariff reform. Despite any economywide benefits from subsidy and tariff reform, particu-larly in a more dynamic and longer term framework, these measures have the potential to create adjustment costs for some commodity sectors and households—at least in the medium term. These potential costs may make implementing subsidy and tariff reform more difficult given the large share of rural and low-income households in India. In contrast, the effects on the economy and on households of increased efficiency in agricultural marketing suggest that this approach may be a valuable complement to subsidy and tariff reforms because of the potential to help mitigate the adjustment costs associated with those measures.
The modeling framework used here does not permit full analysis of the adjustment costs that might be incurred if India’s traditional marketing system were transformed into a more efficient sector. This transformation likely would lead to losses in employment and income in some traditional firms. But, there would be more, larger scale, vertically integrated, and more technologically advanced processing and marketing enterprises that would provide new employment and investment opportunities. Concerns with these adjustment costs are an important part of the current debate over whether to permit foreign direct investment in multibrand retail marketing in India (Mukherjee and Patel, 2005). The results of this study indicate that improve-ments in agricultural marketing efficiency that explicitly entail reduced labor and capital inputs in providing marketing services still put upward pressure on economywide returns to labor and capital. Although some participants in the traditional marketing system will undoubtedly face adjustment costs, the economywide employment and consumption impacts are shown to be positive.

26 Growth and Equity Effects of Agricultural Marketing Efficiency Gains in India / ERR-89
Economic Research Service/USDA
For the United States, these results suggest that the process of increasing investment and efficiency in India’s agricultural markets could moderate growth in India’s future agricultural imports, but also act as an important driver of India’s economywide income and demand growth. The results of the analysis for various commodity sectors and households indicate why domestic support and market access issues are sensitive for India in bilateral and multilateral negotiations. The results also suggest avenues for addressing these concerns through cooperation and investment, which could contribute to more efficient domestic marketing chains. Further, the gains in output and consumption associated with introducing improvements in marketing effi-ciency suggest the potential for returns to private investment in India’s agri-cultural markets.
Analytical issues that would be useful to address in future work include improved data on wholesale and retail marketing costs in Indian food and agriculture, not only by commodity, but also by purchaser. Recent sector studies of India’s agricultural markets conducted by the World Bank, USDA’s Economic Research Service, and others indicate producer-to-retail marketing costs that are substantially higher than those implied by the avail-able input-output data for the Indian economy used for this study. If this is true, then the current study likely underestimates the potential economywide gains from improved agricultural marketing efficiency. In addition, as noted, the use of a dynamic framework would better capture the potentially signifi-cant, long-term growth implications of marketing efficiency gains in Indian food and agriculture.

27 Growth and Equity Effects of Agricultural Marketing Efficiency Gains in India / ERR-89
Economic Research Service/USDA
References
Arndt, C., H.T. Jensen, S.Robinson, and F. Tarp. 1999. Marketing Margins and Agricultural Technology in Mozambique, TMD Discussion Paper No. 43, Trade and Macroeconomics Division, International Food Policy Research Institute, Washington, DC.
Chadha, R., and D. Pratap. 2006. “Chapter 11-H: India,” in Betina V. Dimaranan, editor, Global Trade, Assistance, and Production: The GTAP 6 Data Base, Center for Global Trade Analysis, Purdue University.
Gandhi, V., and A.Koshy. 2007. Wheat Marketing In India: Systems, Efficiency, and Integration, unpublished manuscript, Indian Institute of Management, Ahmedabad, India, October.
Ganesh-Kumar, A., M. Panda, and M.E. Burfisher. 2006. Reforms in Indian Agro-Processing and Agriculture Sectors in the Context of Unilateral and Multilateral Trade Agreements, Working Paper WP-2006-011, Indira Gandhi Institute of Development Research, Mumbai.
Government of India, Ministry of Agriculture, Directorate of Economics and Statistics, 2008. Agricultural Statistics at a Glance 2008, http://dacnet.nic.in/eands/latest_2006.htm.
Government of India, Ministry of Agriculture, Directorate of Economics and Statistics. 2003. Report of the Committee on Capital Formation in Agriculture, March, http://agricoop.nic.in/Capital%20Formation/FinalReport.doc.
Government of India, Ministry of Finance. 2008. Economic Survey, 2007/08.
Government of India, Ministry of Statistics and Programme Implementation. 2005. National Sample Survey, 61st Round, http://mospi.gov.in/mospi_nsso_rept_pubn.htm.
Government of India, Ministry of Statistics and Programme Implementation. 2008. National Sample Survey, 62nd Round, January, http://mospi.nic.in/rept%20_%20pubn/ftest.asp?rept_id=523&type=NSSO.
Government of India, Ministry of Statistics and Programme Implementation, Central Statistical Organization. 2000. Input-Output Transactions Table, 1993-94, New Delhi.
Government of India, Ministry of Statistics and Programme Implementation, Central Statistical Organization. 2007. National Accounts Statistics Sources and Methods, New Delhi.
Government of India, Ministry of Statistics and Programme Implementation, National Sample Survey Organization. 2001. Consumption of Some Important Commodities in India, 1999-2000, Report No. 461, New Delhi.
Gulati, A., and S. Narayanan. 2003. The Subsidy Syndrome in Indian Agriculture, New Delhi: Oxford University Press.

28 Growth and Equity Effects of Agricultural Marketing Efficiency Gains in India / ERR-89
Economic Research Service/USDA
Jha, S., P.V. Srinivasan, and M. Landes. 2007. Indian Wheat and Rice Sector Policies and the Implications of Reform, Economic Research Report No. 41, U.S. Department of Agriculture, Economic Research Service, May.
Joseph, M., N. Soundararajan, M. Gupta, and S. Sahu. 2008. Impact of Organized Retailing on the Unorganized Sector, Indian Council for Research on International Economic Relations, New Delhi
Landes, M. 2008. The Environment for Agricultural and Agribusiness Investment in India, Economic Information Bulletin No. 37, U.S. Department of Agriculture, Economic Research Service, July.
Landes, M., and A. Gulati. 2004. “Farm Sector Performance and Reform Agenda,” Economic and Political Weekly (Mumbai) 39(32):3611-19, August 7-13.
Landes, M., S. Persaud, and J. Dyck. 2004. India’s Poultry Sector: Development and Prospects, Outlook Report No. WRS04-03, U.S. Department of Agriculture, Economic Research Service, February.
Löfgren, H., R.L. Harris, and S. Robinson. 2002. A Standard CGE Model in GAMS, Microcomputers in Policy Research Paper No. 5, International Food Policy Research Institute, Washington, DC.
Matoo, A., D. Mishra, and A. Narain. 2007. From Competition at Home to Competing Abroad: A Case Study of India’s Horticulture, New Delhi: Oxford University Press.
McDonald, S., and K. Thierfelder. 2004. Deriving a Global Social Accounting Matrix from GTAP Versions 5 and 6 Data, GTAP Technical Paper No. 22, Purdue University, West Lafayette, IN.
Mukherjee, A., and N. Patel. 2005. FDI in Retail Sector India, Academic Foundation, New Delhi.
Mullen, K., D. Orden, and A. Gulati. 2005. Agricultural Policies in India: Producer Support Estimates 1985-2002, Discussion Paper No. 82, International Food and Policy Research Institute, Washington, DC.
Persaud, S., and M. Landes. 2006. The Role of Policy and Industry Structure in India’s Oilseed Markets, Economic Research Report No. 17, U.S. Department of Agriculture, Economic Research Service, April.
Polaski, S., A. Ganesh-Kumar, S. McDonald, M. Panda, and S. Robinson. 2008. India’s Trade Policy Choices: Managing Diverse Challenges, Carnegie Endowment for International Peace, Washington, DC.
Pradhan, B.K., and P.K. Roy. 2003. The Well Being of Indian Households: MIMAP – India Survey Report, New Delhi: Tata McGraw Hill.
Reardon, T., and A. Gulati. 2008. The Rise of Supermarkets and Their Development Implications: International Experience Relevant for India,

29 Growth and Equity Effects of Agricultural Marketing Efficiency Gains in India / ERR-89
Economic Research Service/USDA
Discussion Paper 752, International Food Policy Research Institute, Washington, DC.
Reca, A. 2003. “Competition, Economies of Scale, and Product Differentiation,” 2003 U.S. Food & Agribusiness Outlook, pp, 22-27, Rabobank International and Sparks Companies, Inc., September.
Reserve Bank of India. 2007. Handbook of Statistics on Indian Economy, September.
Robinson, S. 1991. “Macroeconomics, Financial Variables, and Computable General Equilibrium Models,” World Development 19(11):1509-25.
Rosenthal, R.E. 2007. GAMS: A User’s Guide, GAMS Development Corporation, Washington, DC.
Saluja, M.R., and B. Yadav. 2006. Social Accounting Matrix for India 2003-04, India Development Foundation, New Delhi.
U.S. Department of Agriculture, Economic Research Service. 1994. Estimates of Producer and Consumer Subsidy Equivalents: Government Intervention in Agriculture, 1982-92, Statistical Bulletin No. 913, December.
U.S. Department of Agriculture, Foreign Agricultural Service. 2008. India Food Processing Annual Report, Gain Report No. IN8030, July 2.
U.S. Department of Agriculture, Foreign Agricultural Service. 2006. India Report: Retail Food Sector, Gain Report No. IN6111, December 12.
World Bank. 1999. India Foodgrain Marketing Policies: Reforming to Meet Food Security Needs, Vols. 1 and 2, Report No. 18329-IN, Rural Development Sector Unit, South Asia Region, August 17.
World Bank. 1997. The India Oilseed Complex: Capturing Market Opportunities, Vols. 1 and 2, Report No. 15677-IN, Rural Development Sector Unit, South Asia Region, July 31.
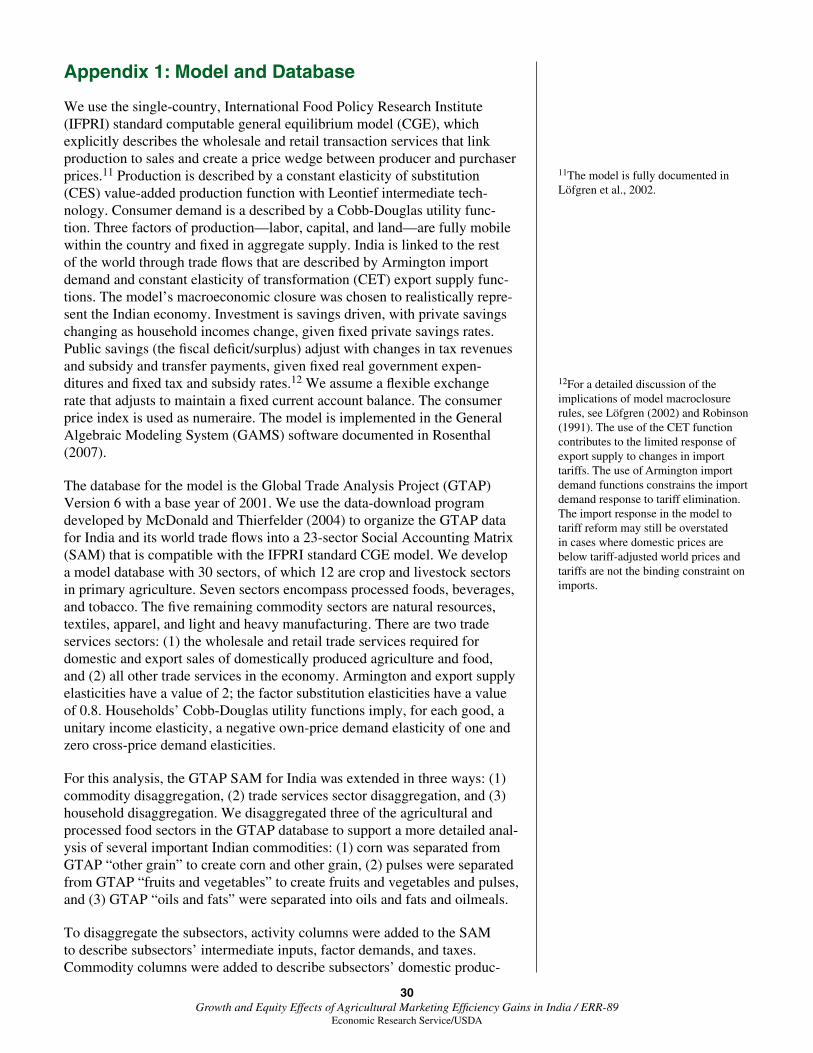
30 Growth and Equity Effects of Agricultural Marketing Efficiency Gains in India / ERR-89
Economic Research Service/USDA
Appendix 1: Model and Database
We use the single-country, International Food Policy Research Institute (IFPRI) standard computable general equilibrium model (CGE), which explicitly describes the wholesale and retail transaction services that link production to sales and create a price wedge between producer and purchaser prices.11 Production is described by a constant elasticity of substitution (CES) value-added production function with Leontief intermediate tech-nology. Consumer demand is a described by a Cobb-Douglas utility func-tion. Three factors of production—labor, capital, and land—are fully mobile within the country and fixed in aggregate supply. India is linked to the rest of the world through trade flows that are described by Armington import demand and constant elasticity of transformation (CET) export supply func-tions. The model’s macroeconomic closure was chosen to realistically repre-sent the Indian economy. Investment is savings driven, with private savings changing as household incomes change, given fixed private savings rates. Public savings (the fiscal deficit/surplus) adjust with changes in tax revenues and subsidy and transfer payments, given fixed real government expen-ditures and fixed tax and subsidy rates.12 We assume a flexible exchange rate that adjusts to maintain a fixed current account balance. The consumer price index is used as numeraire. The model is implemented in the General Algebraic Modeling System (GAMS) software documented in Rosenthal (2007).
The database for the model is the Global Trade Analysis Project (GTAP) Version 6 with a base year of 2001. We use the data-download program developed by McDonald and Thierfelder (2004) to organize the GTAP data for India and its world trade flows into a 23-sector Social Accounting Matrix (SAM) that is compatible with the IFPRI standard CGE model. We develop a model database with 30 sectors, of which 12 are crop and livestock sectors in primary agriculture. Seven sectors encompass processed foods, beverages, and tobacco. The five remaining commodity sectors are natural resources, textiles, apparel, and light and heavy manufacturing. There are two trade services sectors: (1) the wholesale and retail trade services required for domestic and export sales of domestically produced agriculture and food, and (2) all other trade services in the economy. Armington and export supply elasticities have a value of 2; the factor substitution elasticities have a value of 0.8. Households’ Cobb-Douglas utility functions imply, for each good, a unitary income elasticity, a negative own-price demand elasticity of one and zero cross-price demand elasticities.
For this analysis, the GTAP SAM for India was extended in three ways: (1) commodity disaggregation, (2) trade services sector disaggregation, and (3) household disaggregation. We disaggregated three of the agricultural and processed food sectors in the GTAP database to support a more detailed anal-ysis of several important Indian commodities: (1) corn was separated from GTAP “other grain” to create corn and other grain, (2) pulses were separated from GTAP “fruits and vegetables” to create fruits and vegetables and pulses, and (3) GTAP “oils and fats” were separated into oils and fats and oilmeals.
To disaggregate the subsectors, activity columns were added to the SAM to describe subsectors’ intermediate inputs, factor demands, and taxes. Commodity columns were added to describe subsectors’ domestic produc-
11The model is fully documented in Löfgren et al., 2002.
12For a detailed discussion of the implications of model macroclosure rules, see Löfgren (2002) and Robinson (1991). The use of the CET function contributes to the limited response of export supply to changes in import tariffs. The use of Armington import demand functions constrains the import demand response to tariff elimination. The import response in the model to tariff reform may still be overstated in cases where domestic prices are below tariff-adjusted world prices and tariffs are not the binding constraint on imports.

31 Growth and Equity Effects of Agricultural Marketing Efficiency Gains in India / ERR-89
Economic Research Service/USDA
tion, imports, and commodity taxes. Corresponding activity rows and commodity rows were also added. The activity rows report the sale of total domestic production of the subsectors to the commodity accounts. The commodity rows report intermediate and final demand for each new subsector. The newly disaggregated rows and columns of the SAM sum to the original rows and columns. Data used for the agricultural sector disaggre-gation are drawn from multiple USDA data sources.
The trade services sector in the SAM is disaggregated into (1) trade services used in wholesale and retail sales of domestically produced food and agri-cultural commodities to domestic and export markets, and (2) all other trade services. The objective of the disaggregation of the agricultural and food trade services sector is to create a link between total expenditures by firms and final demand (households, government, investment, and exports) on trade services reported in the GTAP database and the commodity composition of those wholesale and retail trade services. As a first step in creating this link, we create control totals for aggregate domestic and export agricultural marketing expenditures by assuming that the trade services required for all domestically consumed goods are of equal proportion and that those provided for exports are of equal proportion. The control total for trade services used for domestic sales of agricultural and food goods is then assumed to equal the share of these goods in aggregate domestic expenditure multiplied by total domestic trade service expenditure in the economy. The control total for marketing expenditures on exports of agricultural and food goods is assumed to equal the budget share of these goods in total export sales multiplied by total export trade service expenditure. Next, to capture variation in marketing costs across agricultural and food commodities, we estimate trade margin costs for each commodity by applying to the domestic and export control totals the trade and marketing margins based on farm-retail price spread data and data from various studies of Indian commodity markets. Finally, the trade service margins for domestic and export sales are uniformly scaled so that the sums of trade service expenditures are equal to the control totals for domestic and export trade service expenditures and meet the constraint that, for any production activity or agent, agricultural trade expenditures cannot exceed total trade expenditures by commodity reported in the GTAP data. For sectors in which base exports are a negligible share of production, trade and marketing costs on export sales are assumed to be zero.
The category “other trade services” becomes a residual of the trade service sector in the GTAP data. It is defined as total trade service expenditures minus trade services produced and consumed in marketing domestic produc-tion of agricultural and food goods.
We follow Arndt et al. (1999) in restructuring the India SAM to include one production activity row and one activity column to describe the produc-tion and sale of margin services used for agricultural and food products. The activity column account reports the production technology as a propor-tion of, and identical to, the production of trade services in the original SAM. One commodity row account and one commodity column account is added to the SAM to describe the supply of and demand for margin services used for agricultural and food products. The commodity column account describes the supply of margin services, which are only produced domesti-cally. The commodity row account describes the intermediate input demand

32 Growth and Equity Effects of Agricultural Marketing Efficiency Gains in India / ERR-89
Economic Research Service/USDA
for the margin service in the production of margin services and the alloca-tion of margin services for marketing domestic sales and exports. Two trade margin accounts (a column and row for each) are added to the SAM—one for domestic sales and one for export sales. The trade margin row accounts report demand for trade margin services for the sale of agricultural and food products in the domestic market and as exports. These margins are demanded by each agricultural and food commodity, in their column accounts, so that the value of each agricultural and food commodity purchase reported in the SAM now includes its trade margin on the domestic variety. Nonfood and nonagricultural commodity purchases are reported net of marketing costs.
Expenditures by firms, households, government, investment, and exports are adjusted so that expenditures on food and agricultural commodities are reported in purchaser prices that include the wholesale and retail trade and marketing costs. These trade service expenditures, now embedded in commodity prices, are then subtracted from each agent’s total expenditures on trade margin services.
Finally, we extend the India SAM by disaggregating the single household into 10 representative households. Household income and expenditure data are from the 2003/04 India SAM developed by Saluja and Yadav (2006). Using 1999-2000 data from the National Sample Survey Organization (Government of India, Ministry of Statistics and Programme Implementation, 2001), Saluja and Yadav disaggregated 10 household types that characterize 5 income and expenditure classes each for rural and urban households: abject poverty, poverty, middle income, upper income, and high income. The middle household classes have national average per capita expenditures in urban and rural areas. Saluja and Yadav draw data on sources of factor income by household type from Pradhan and Roy (2003).
The 73-sector data in the Saluja and Yadav SAM are aggregated into the sectors of the GTAP India SAM, and the household income and expenditure shares of the 10 household types are then applied to disaggregate the single household in the GTAP SAM. Because the Saluja and Yadav SAM includes only labor and capital, whereas the model used here also includes land, we assume that land income has the same distribution as capital income in the Saluja and Yadav database. Furthermore, we assume that land returns accrue only to rural households.

33 Growth and Equity Effects of Agricultural Marketing Efficiency Gains in India / ERR-89
Economic Research Service/USDA
No. Sector name GTAP sector
1 Rice pdr pcr
2 Wheat wht
3 Corn gro
4 Oth grain gro
5 Pulses v_f
6 Frt/veg. v_f
7 Oilseeds osd
8 Sugar c_b sgr
9 Fibers pfb
10 Crops nec ocr
11 Beef ctl
12 Poultry/hog oap wol
13 Nat. Resource frs fsh coa oil gas omn p_c crp nmm
14 Beef/mutton cmt
15 Poultry/pork omt
16 Oilmeals vol
17 Fats oils vol
18 Dairy prods rmk mil
19 Foods nec ofd
20 Bev tobac b_t
21 Textiles tex
22 Apparel wap
23 Light mfg. lea lum ppp
24 Heavy mfg. i_s nfm fmp mvh otn ele ome omf
25 Agric trade services trd
26 Food trade services trd
27 Othr trade services trd
28 Ag. Transp. otp wtp atp
29 Oth transp. otp wtp atp
30 Oth services ely gdt wtr cns cmn ofi isr obs ros osg dwe
Source: ERS model.
Appendix 2: Sector Aggregation From GTAP Database: Mapping GTAP Sata Into the India SAM

34 Growth and Equity Effects of Agricultural Marketing Efficiency Gains in India / ERR-89
Economic Research Service/USDA
Variable50 % increase in total factor productivity in agricultural
& food marketing
Elimination of agricul-tural subsidies
Elimination of agricultural tariffs
Percent change from base
Aggregate impacts:
Real GDP 1.0 0.1 0.3
Real household consumption 1.4 -1.3 1.2
Real investment demand 0.4 4.2 -2.2
Government revenue 1.0 7.4 -2.3
Producer price index 0.4 -0.4 1.0
Land rents 5.6 -5.0 -0.1
Wages 1.6 -1.4 1.3
Capital rents 0.1 -0.5 1.2
Agricultural exports 3.9 3.9 -2.7
Agricultural imports -0.9 -36.4 21.4
Exchange rate - rupees/$ 0.7 -0.6 2.4
Consumer price impacts:
Rice -0.8 5.4 0.9
Wheat -0.5 8.7 0.8
Corn -0.2 1.1 0.6
Fruit & veg. -1.0 0.9 -1.3
Oils & fats -2.1 -0.6 -21.0
Sugar -1.8 -2.2 0.8
Fibers -0.1 1.5 0.3
Poultry & pork 0.6 -0.7 -34.7
Dairy -0.7 -2.2 0.3
Food, nec -4.0 -0.9 -1.1
Producer price impacts:
Rice 1.2 5.8 0.9
Wheat 1.8 9.5 0.8
Corn 2.2 1.4 0.6
Fruit & veg. 2.3 1.3 0.6
Oils & fats 0.4 -0.4 -0.7
Sugar 1.0 -2.3 0.8
Fibers 2.4 2.1 0.7
Poultry & pork 2.7 -0.8 -5.5
Dairy 1.9 -2.3 0.3
Food, nec -0.1 -0.9 0.5
continued—
Appendix 3: Scenario Results for Impacts of Agricultural Marketing Efficiency, Input Subsidy, and Tariff Reform Scenarios in India

35 Growth and Equity Effects of Agricultural Marketing Efficiency Gains in India / ERR-89
Economic Research Service/USDA
Variable50 % increase in total factor productivity in agricultural
& food marketing
Elimination of agricul-tural subsidies
Elimination of agricultural tariffs
Percent change from base
Real household consumption (welfare) impacts by household type:
Rural: Abject poverty (R1) 2.0 -2.6 1.7
Rural: Poor (R2) 1.9 -2.3 1.7
Rural: Middle income (R3) 1.8 -1.9 1.5
Rural: Upper mid. income (R4) 1.7 -1.6 1.3
Rural: High income (R5) 1.4 -1.2 0.9
Urban: Abject poverty (U1) 1.4 -1.8 1.7
Urban: Poor (U2) 1.3 -1.4 1.6
Urban: Middle income (U3) 1.2 -0.9 1.4
Urban: Upper mid. income (U4) 0.9 -0.5 1.0
Urban: High income (U5) 0.8 -0.8 1.0
Source: ERS model results.
Appendix 3: Scenario Results for Impacts of Agricultural Marketing Efficiency, Input Subsidy, and Tariff Reform Scenarios in India—continued